Abstract
Lonicera japonica Thunb. (LJT) has been widely used as medicines or food additives in Asian countries for thousands of years. The flower buds are often medicinally used, and the other tissues are ignored. However, flowers, leaves and stems have also been reported to have antimicrobial, anti-inflammatory and antioxidant effects. In the current study, un-targeted metabolomics analysis was performed to investigate the metabolic difference among different tissues (flowers, flower buds, stems and leaves) of LJT based on liquid chromatography with mass spectrometry. A total of 171 metabolites were identified, including 28 flavonoids, 35 phenolic acids, 43 iridoids, 9 amino acids, 6 nucleotides, 16 fatty acids, 22 lipids and 12 others. Four new secondary metabolites were discovered. Some flavonoids and iridoids were not detected in leaves and stems. Principal component analysis showed significant differences among four different tissues. Some 27, 81, 113 differential metabolites were found between flowers/flower buds, leaves/flower buds, stems/flower buds, respectively. Primary metabolites showed a higher content in the flowers and flower buds. For the flavonoids, flavones were mainly accumulated in the leaves, flavonols were mainly accumulated in the flower buds, and acylated flavonol glucosides were mainly accumulated in the flowers. Most phenolic acids showed a higher content in the flowers or flower buds, while phenolic acid-glucosides showed significantly higher content in the flower buds. The most abundant iridoids in the LJT also showed a higher content in the flowers and flower buds. These results can provide new insights into the understanding of the metabolites changes in different tissues, and lay a theoretical foundation for the comprehensive utilization of LJT.
1. Introduction
Lonicera japonica Thunb. (LJT), belonging to the Caprifoliaceae family, has been used in traditional Chinese medicine or as a food additive for thousands of years [1]. It is widely cultivated in China as well as in other Asian countries, such as Japan and Korea [2]. Lonicera japonica Thunb. has various medicinal effects, including anti-inflammatory, antiviral, antibacterial, antioxidant, hepatoprotective and anti-tumor, etc. [3]. The metabolites are directly related to biological functions. Lonicera japonica Thunb. contains many medicinal components such as flavonoids, phenolic acids, and iridoids [4]. Flavonoids are found to inhibit inflammatory cytokines and mediators [5]. Phenolic acids, especially caffeoylquinic acids and caffeic acid, show significantly antiviral and antioxidant activities [6]. Iridoids are found to have anti-inflammatory, antiviral, anticancer and analgesic activities [7].
The metabolites are structurally complex in the plant, especially secondary metabolites. Thousands of metabolites can be detected in plant tissues using mass spectrometry. Metabolomics is a research discipline that integrates the capabilities of several types of research including analytical chemistry, statistics and biochemistry [8]. Metabolomics analysis involves the detection and quantification of metabolites with mass spectrometry or nuclear magnetic resonance, and integrates the resulting data with multivariate statistical techniques [9,10]. With the development of liquid chromatography with mass spectrometry (LC-MS), metabolomics has been widely used in plant research [11]. There are abundant chemical components among different medicinal tissues. More organic acids and lipids have been found in the seeds than leaves and bark of Eucommia ulmoides Oliver with untargeted metabolomics [12]. A total of 62 components were selected as potential biomarkers to distinguish leaves, peels, flowers, pulps, peels and seeds for Clausena lansium (Lour.) Skeels [13]. Differential primary metabolites were significantly lower in the shoots than the roots, while secondary metabolites were higher in the shoots than in roots for Salsola collina Pall [14].
The flower buds of LJT have been medicinally used, while the flowers, leaves and stems have often been neglected, resulting in insufficient utilization. Recently, increasing amounts of research has focused on the chemical components of other tissues of LJT. Medicinal components have also been characterized. In the flowers, neochlorogenic acid, chlorogenic acid, cryptochlorogenic acid, 4,5-O-caffeoylquinic acid, sweroside and secoxyloganin have been found [15]. In the leaves, luteolin, rutin, luteoloside, lonicerin, isochlorogenic acid C, isochlorogenic acid B, isochlorogenic acid A and chlorogenic acid have been found [16]. In the stems, 18 medicinal substances such as neochlorogenic acid, chlorogenic acid, loganin, secoxyloganin, ochnaflavone, sweroside have been identified [17]. Previous studies have usually focused on several components in the individual tissues. Moreover, studies on dynamic primary and secondary metabolite changes among different tissues of LJT have been few. In the current study, qualitative and semi-quantitative analyses were performed on the flowers, flower buds, stems and leaves of LJT. The metabolomic profiling of the four different tissues was investigated, and different metabolites were identified. The metabolomic differences of LJT were analyzed and differential metabolites were filtered. The variations and regulation of metabolites among different tissues were investigated.
2. Materials and Methods
2.1. Chemicals and Materials
Acetonitrile and methanol (HPLC grade) were purchased from Merck (Darmstadt, Germany). Ultrapure water was made using a Direct-Q 8 UV-R water purification system (Millipore, Billerica, MA, USA). Standard components of chlorogenic acid, cryptochlorogenic acid, neochlorogenic acid, isochlorogenic acid A, isochlorogenic acid B, isochlorogenic acid C, 3-O-feruloylquinic acid, 5-O-feruloylquinic acid, cinnamic acid, caffeic acid, ferulic acid, coumaric acid, sinapic acid, luteolin, apigenin, luteoloside, rutin, apigenin-7-O-glucoside, isorhamnetin-3-O-glucoside, quercetin-3-O-glucoside, loganin, vogeloside were obtained from Shanghai Yuanye Biotechnology Co. Ltd. (Shanghai, China).
2.2. Plant Materials
Fresh LJT samples were collected in Linyi of Shandong Province, China. Four different tissues samples were collected separately from five plants: flowers (F), flower buds (FB), stems (S) and leaves (L) (Figure 1). Samples were immediately quenched in liquid nitrogen after collection. There were three biological replicates. The LJT samples were identified by Professor Wang Xiao at Shandong Analysis and Test Center.
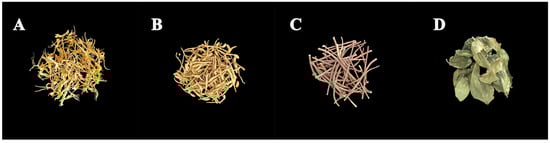
Figure 1.
Phenotypes of different tissues of LJT. (A) flowers. (B) flower buds. (C) stems. (D) leaves.
2.3. Sample Preparation
The samples were freeze-dried, ground into powder, and passed through a 40-mesh sieve respectively. Quality control (QC) samples were obtained by mixing equal powder of each sample to be analyzed. The powder of 150 mg was accurately weighed into 5 mL Eppendorf tube. Subsequently, 3 mL precooled extraction solution of methanol/water (3:1, v/v) solution was added to the tube, and the tube was extracted in ice water with ultrasonic for 30 min. The solution was centrifuged at 12,000 rpm for 10 min, and then freeze-dried by a refrigerated centrifugal vacuum concentrator (Centrivap, Labconco, Kansas City, MO, USA). For LC-MS analysis, the samples were re-dissolved in 1 mL solution of 10% methanol/water (v/v) solution, and filtered through 0.22 μm membrane filters.
2.4. LC-MS Analysis
Analysis was performed with an UHPLC system (H-Class, Waters, Milford, MA, USA) combined with a Q-TOF mass spectrometer equipped with an ESI interface (Impact II, Bruker, Germany). The UHPLC analyses were performed on an Agilent ZORBAX SB C18 column (2.1 × 100 mm, 1.8 μm, Agilent, Palo Alto, CA, USA). The column oven was maintained at 40 °C and the flow rate was 0.3 mL/min. The temperature of the injection chamber was controlled at 4 °C. The mobile phases contained A (0.1% formic acid in water, v/v) and B (acetonitrile). The mobile phase B linearly increased from 5% to 25% during the first 20 min, and then linearly increased 100% in 15 min and was kept for 5 min. The total run time was 40 min. The mass spectrometry experiment was performed with the ESI source. The mass range was from m/z 50 to 1200. The capillary voltage was 3500 V in the positive mode and 3000 V in the negative mode. The nebulizer pressure was 2.0 bar, the flow rate of dry gas was 8.0 L/min, and the drying gas temperature was 200 °C. The collision radio frequency (RF) was 750 Vpp, the prepulse storage was 8 μs, and the transfer time was 80 μs.
2.5. Data Analysis
The data deconvolution and peak alignment were performed using MS-DIAL [18], and the peak table with m/z, retention time, and area was obtained. Principal component analysis (PCA) and orthogonal partial least squares discrimination analysis (OPLS-DA) were conducted using SIMCA (version 14.0, Umetrics, Umeå, Sweden). Nonparametric test and hierarchical cluster analysis (HCA) were conducted using MultiExperiment Viewer (version 4.9, Dana-Farber Cancer Institute, Boston, MA, USA). Pathway mapping of identified metabolites was performed using the Kyoto Encyclopedia of Genes and Genomes (KEGG) database (http://www.genome.jp/kegg/, accessed on 21 August 2022).
3. Results and Discussion
3.1. Metabolites Identification in Different Tissues
The metabolites were identified based on molecular weight, retention time and characteristic fragment ions. Standards available were used for confirmation. A total of 171 metabolites were identified, of which 171were in the flowers, 169 in the flower buds, 142 in the leaves and 139 in the stems. The 171 metabolites include 28 flavonoids, 35 phenolic acids, 43 iridoids, 9 amino acids, 6 nucleotides, 16 fatty acids, 22 lipids and 12 others (Table 1 and Table S1). Among them, secondary metabolites of phenolic acids, flavonoids and iridoids have specific fragment rules.

Table 1.
Identification of secondary metabolites in different tissues of LJT.
3.1.1. Identification of Flavonoids
Flavonoids have three rings (C6-C3-C6) as their basic skeleton (labeled as A, B, and C) [19]. According to structural differences, flavonoids can be divided into flavonols, flavones, isoflavones and other subclasses [20]. Flavonoids have been found to be glycosylated and acylated. Flavonoids mainly existed in the form of O-glycosides in the LJT. The O-glycosidic bond is easily broken, showing the fragment ions of aglycone. Subsequently, the aglycone ions would be cleaved to form a series of fragment ions including dehydration, Retro Diels-Alder (RDA) fragmentation, C-ring fragmentation [21]. The peak 3 presented [M−H]− at 431.0976 and fragment ions at 269 [M−H−Glu]−, 251 [M−H−Glu−H2O]−, 223 [M−H−Glu−H2O−CO]−. It was identified as apigenin-7-O-glucoside (Table 1). The peak 5 presented [M−H]− at 447.0924 and fragment ions at 285 [M−H−Glu]−, 241 [M−H−Glu−CO2]−, 151 [1,3A−], 133 [1,3B−]. It was identified as luteoloside. 18 flavonoid O-glycosides were identified from LJT, including quercetin-O-glucoside, isorhamnetin-O-glucoside, quercetin-O-rutinoside, luteolin-O-diglucoside, kaempferol-O-diglucoside, apigenin-O-neohesperidoside, etc. Some flavonoid glycosides are further acylated. Acylated flavonoids were found in the flavonol subclass. Three acylated flavonoid glycosides were identified for the first time from LJT, including kaempferol-acetylglucoside, quercetin-acetylglucoside and quercetin-malonylglucoside. Among the flavonoids, 28 were detected in flowers and flower buds, 25 in leaves and only 17 in stems. Apigenin-5-O-neohesperidoside, apigenin-7-O-glucoside, isorhamnetin-3-O-glucoside, isorhamnetin-O-rutinoside I, isorhamnetin-O-rutinoside II, luteolin-O-diglucoside, kaempferol-O-rutinoside III, diosmin, diosmetin, corymbosin and flavoyadorinin B were absent in the stems. Corymbosin and flavoyadorinin B and 5-hydroxyl-3′,4′,7-trimethoxy flavone were absent in the leaves.
3.1.2. Identification of Phenolic Acids
Phenolic acids were found in free forms or conjugated with quinic acid (QA)/glucoside in LJT [22]. Five free phenolic acids were identified in LJT, including caffeic acid, ferulic acid, coumaric acid, sinapic acid and cinnamic acid. The MS/MS spectra showed characteristic peaks of losing free phenolic acid, quinic acid or glucose. A total of 35 phenolic acids were identified, of which 5 were free phenolic acids, 28 were bound phenolic acids and 2 were others.
The peaks (29, 30 and 31) both presented [M−H]− at m/z 353.0869. Their MS/MS spectra showed characteristic ions at m/z 191 or 173 and m/z 179. The elution order was confirmed by comparing with standards, and peaks 29, 30 and 31 were finally deduced as neochlorogenic acid, chlorogenic acid, cryptochlorogenic acid (Table 1). The peaks (37, 38 and 39) both presented [M−H]− at m/z 515.1186. Their MS/MS spectra showed characteristic ions at m/z 353 or 335, 191 and 179. The elution order was confirmed by comparing with standards, and peaks 37, 38, and 39 were finally deduced as isochlorogenic acid B, isochlorogenic acid A, isochlorogenic acid C. The peaks (40, 41 and 42) both presented [M−H]− at m/z 529.1338. Their MS/MS spectra had characteristic peaks at m/z 353 or 335 and 367. Peaks 40, 41 and 42 were preliminarily assigned as feruloyl caffeoylquinic acid and its isomers. Phenolic acid glycosides are more hydrophilic. The peak (49) presented [M−H]− at m/z 515.1397. Its elution time was 3.78 min, and its MS/MS spectra had a characteristic peak at m/z 353. The peak 49 was finally deduced as caffeoylquinic acid-glucoside. The peak (50) presented [M−H]− at m/z 529.1555. Its elution time was 4.98 min, and its MS/MS spectra had characteristic peak at m/z 367. The peak 50 was finally deduced as feruloylquinic acid-glucoside. Some 29 bounded phenolic acids were identified from LJT, including 3-O-feruloylquinic acid, 3-O-p-coumaroylquinic acid, sinapoylquinic acid, p-coumaroyl caffeoylquinic acid, caffeoyl sinapoylquinic acid, feruloylquinic acid-glucoside, sinapoylquinic acid-glucoside etc. In addition, sinapoylquinic acid-glucoside was identified for the first time from LJT. All these phenolic acids were detected in the flowers, flowers buds, leaves and stems.
3.1.3. Identification of Iridoids
The iridoids in LJT were mainly in the form of glycosides. Iridoids exhibit characteristic fragmentations of loss of glucose, H2O, CO, and RDA cleavage [23]. The peaks (69, 70 and 71) both presented [M−H]− at 389.1081. In the MS/MS spectrum, they showed fragment ions at m/z 209, 165, 121. The peaks 69, 70 and 71 were tentatively characterized as secologanoside and its isomers (Table 1). The peaks (80 and 81) both presented [M−H]− at 375.1288. In the MS/MS spectrum, they showed fragment ions at m/z 213, 169, 151. The peaks 80 and 81 were tentatively characterized as 8-epi-loganic acid and 7-epi-loganic acid. The peaks 74 and 75 both presented [M−H]− at 757.2550. In the MS/MS spectrum, they produced fragment ions at m/z 595, 525, 493. The peaks 74 and 75 were tentatively characterized as (E)-aldosecologanin, (Z)-aldosecologanin. The peaks (89, 90 and 91) both presented [M+H]+ at 405.1393. In the MS/MS spectrum, they produced fragment ions at m/z 243, 211, 193. The peaks 89, 90 and 91 were tentatively characterized as secoxyloganin and its isomers. The peaks (92 and 93) both presented [M+H]+ at 391.1600. In the MS/MS spectrum, they produced fragment ions at m/z 229, 211, 197. The peaks 92 and 93 were tentatively characterized as loganin and its isomer. Among the iridoids, 43 were detected in the flowers and flower buds, 41 in the stems and 32 in the leaves. Lonijapospiroside B I, lonijapospiroside B II, lonijapospiroside B III, secoxyloganin I, secoxyloganin II, loganin II, 5α-carboxystrictosidine I, 5α-carboxystrictosidine III, 7-O-ethylsweroside, lonijaposide T, dimethyl lonijaposide C were missing in the leaves. Missing in the stems were 5α-carboxystrictosidine I, 5α-carboxystrictosidine II.
3.2. Metabolomics Difference in Different Tissues of LJT
A total of 3 QC samples were prepared and analyzed. The total ion current chromatograms (TICs) of the QC samples in positive ion mode (ESI+) and negative ion mode (ESI-) are shown in Figure 2 respectively. It was found that peak intensity and retention time basically overlapped, which means that the perturbation during the process of the experiment is small. The relative standard deviation (RSD) of each peak area was calculated. The peak number and accumulated peak area were counted within different RSD ranges (0−10, 10−20, 20−30, and >30%). The 98.3% of the peaks have RSD less than 20%, accounting for 99.8% of the total area. It indicates good repeatability and stability of the metabolomic analysis.
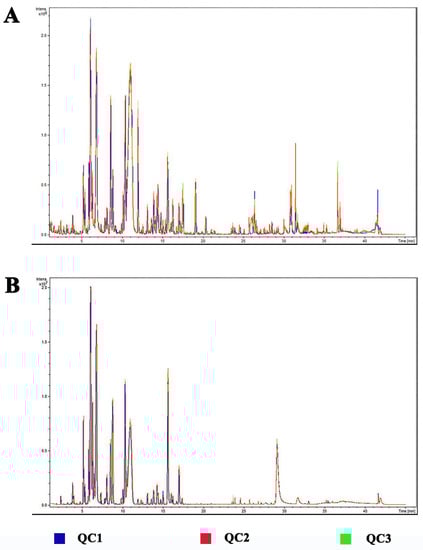
Figure 2.
The total ion current chromatograms (TICs) of the QC samples. (A) positive ion mode (ESI+). (B) negative ion mode (ESI−).
Principal component analysis was performed to find the metabolomic differences in different tissues of LJT. It was found that two principal components explained 71.90% of the overall variance (51.00% and 20.90% for PC1 and PC2 respectively, Figure 3A). There were significant variations among the four tissues, since they dispersed in four different parts of the score plot. Hierarchical cluster analysis was then carried out for the four tissues. Samples of flower buds, flowers, leaves and stems of LJT formed four separate clusters (Figure 3B). Moreover, the samples of leaves and stems clustered together, and the samples of flower buds and flowers clustered together, suggesting a similarity in the composition and content.
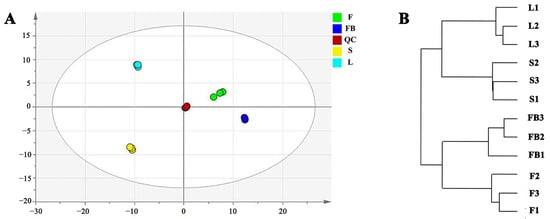
Figure 3.
Analysis of metabolic variation in different tissues of LJT. (A) the score plot of PCA anal-ysis. (B) hierarchical cluster analysis of different tissues of LJT.
Orthogonal partial least squares-discrimination analysis was performed between each two groups of samples. The score plot showed significant differences among them. Differential metabolites were filtered by VIP value (VIP > 1) and fold-change (FC ≥ 4). There were 27 significantly differential metabolites between flowers and flower buds (18 up-regulated, 9 down-regulated), 81 between leaves and flower buds (69 up-regulated, 12 down-regulated), 113 between stems and flower buds (106 up-regulated, 7 down-regulated), 66 between leaves and flowers (54 up-regulated, 12 down-regulated), 98 between stems and flowers (93 up-regulated, 5 down-regulated), 79 between stems and leaves (58 up-regulated, 21 down-regulated). Most of these differential metabolites were secondary metabolites.
Kyoto Encyclopedia of Genes and Genomes is one of the databases for pathway research, which contains pathway information on metabolism, genetic information processing [24]. In the current study, differential metabolites were annotated by the KEGG database. Through the KEGG pathway analysis, it was found that the differential metabolites were mainly enriched in five pathways, including flavone and flavonol biosynthesis (Ko00944), flavonoid biosynthesis (Ko00941), phenylpropanoid biosynthesis (Ko00940), biosynthesis of amino acids (Ko01230), monoterpenoid biosynthesis (Ko00902), citrate cycle (Ko00020). There were more differential metabolites enriched in the phenylpropanoid biosynthesis pathway than those in other pathways. The phenylpropanoid biosynthesis pathway is an indispensable pathway which provides precursors for many secondary metabolites. Phenylpropanoid biosynthesis mainly includes the biosynthesis of amino acids, flavonoids and phenolic acids. Subsequently, heat map analysis was carried out for the 132 differential metabolites, and metabolites dynamic changes were analyzed using the biosynthesis pathway map.
3.2.1. Differences in Primary Metabolites of Different Tissues
Figure 4 is the heat map of differential primary metabolites. Amino acids were significantly more abundant in the flower buds than other tissues. Amino acids are critical to plant development. They play the role as precursors or nitrogen donors for the synthesis of nucleotides, hormones and secondary metabolites [25]. Phenylalanine and tryptophan are important precursors for the synthesis of phenolic acids and flavonoids in the phenylpropanoid biosynthesis pathway [26]. The amount of phenylalanine and tryptophan in flowers buds was higher than in other tissues, which was related to the distributions of flavonoids and phenolic acids. The amount of phenylalanine in flower buds was 7.52-fold, 31.91-fold and 33.83-fold more than in the flowers, stems and leaves, respectively. Similarly, the amount of tryptophan in flower buds was 5.23-fold, 32.25-fold and 35.46-fold more than in the flowers, stems and leaves, respectively.
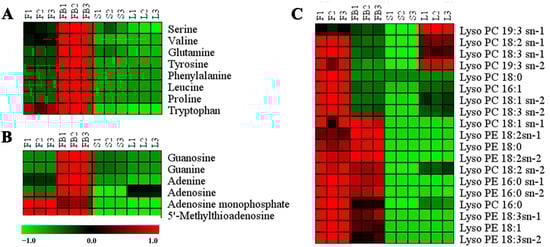
Figure 4.
Heat map of differential primary metabolites. (A) amino acids. (B) nucleosides. (C) lipids. Red represents higher content and green represents lower content.
Nucleotides are important metabolites of plant growth and development [27]. The amount of nucleotides in the flower buds was much higher than in other tissues (Figure 4B). Lipids are essential constituents of plant cells. They provide structural integrity and energy for various metabolic processes [28]. As is shown in Figure 4C, the amount of lipids was significantly higher in the flowers than that in the other tissues.
3.2.2. Differences in Secondary Metabolites of Different Tissues
Phenylalanine and tryptophan are catalyzed by enzymes to form cinnamic acid and p-coumaroyl-CoA. Then the phenylpropanoid pathway divides into two branches: the phenylalanine metabolic pathway and the flavonoid metabolic pathway [29]. Flavonoid biosynthesis is an important downstream branch of phenylpropanoid metabolism.
As is shown in Figure 5, there are significant differences in flavonoids in different tissues of LJT. Most flavones showed higher expression in leaves, such as apigenin-O-neohesperidoside, apigenin-7-O-glucoside, luteolin, luteoloside, luteolin-O-diglucoside, diosmin and diosmetin-O-glucoside. Flavonoids that accumulated in leaves mainly involved the flavone biosynthesis pathway. The content of luteolin in the leaves was 5.27-fold, 12.23-fold and 12.47-fold higher than that in flower buds, flowers and stems, respectively. The content of luteoloside in the leaves was 1.74-fold, 3.51-fold and 135.81-fold higher than that in flower buds, flowers and stems, respectively. Similarly, the content of apigenin-7-O-glucoside in the leaves was 6.39-fold and 11.82-fold higher than that in the flower buds and flowers. The content of apigenin-O-neohesperidoside in the leaves was 82.86-fold, 69.01-fold and 456.12-fold higher than that in the flower buds, flowers and stems. Moreover, the content of diosmin in the leaves was 23.05-fold and 22.33-fold higher than that in flowers buds and flowers. The content of diosmetin in leaves was 20.81-fold and 36.34-fold higher than that in flowers buds and flowers. Flavones are bioavailable molecules with antioxidant, anti-inflammatory, antibacterial, antiviral and anticancer activities [19]. Luteolin and luteoloside, as the most common flavones, have been reported to inhibit the transcriptional activation of STAT3/IRF-1, NF-κB and AP-1 pathways and exert anti-inflammatory effects [30]. Apigenin-7-O-glucoside can protect free radical-induced oxidative damage of pBR322 DNA, bovine serum albumin and erythrocytes [31]. Most flavonols showed higher expression in the flower buds, including quercetin-3-O-glucoside, quercetin-O-diglucoside, rutin, isorhamnetin-3-O-glucoside, isorhamnetin-O-rutinoside, kaempferol-O-rutinoside. Flavonoids which accumulated in the flower buds mainly involved the flavonol biosynthesis pathway. The amount of isorhamnetin-3-O-glucoside in the flower buds was 2.06-fold and 4.32-fold higher than that in the flowers and leaves. The amount of quercetin-3-O-glucoside in the flower buds was 1.04-fold, 3.17-fold and 75.60-fold higher than that in the flowers, leaves and stems, respectively. The amount of rutin in the flower buds was 1.31-fold, 37.75-fold and 635.04-fold higher than that in the flowers, leaves and stems, respectively. The kaempferol-O-rutinoside in the flower buds was 2.23-fold, 1.21-fold, 129.02-fold higher than that in the flowers, leaves and stems. Flavonols also have beneficial activities. Isorhamnetin-3-O-glucoside can effectively protect lens protein by maintaining Ca2+-ATPase activity, preventing oxidative stress, calcium accumulation and lipid peroxidation [32]. Quercetin-3-O-glucoside inhibits pancreatic cancer cell migration and has an anti-cancer effect [33]. Moreover, flavonols can filter some harmful solar wave-lengths to protect DNA [34]. For acylated flavonoid glucosides, kaempferol-O-acetylglucoside, quercetin-O-acetylglucoside, quercetin-O-malonylglucoside were abundant in the flowers. The amount of kaempferol-acetylglucoside in flowers was 2.11-fold, 1.81-fold and 20.01-fold higher than that in flower buds, leaves and stems, respectively. The amount of quercetin-acetylglucoside in flowers was 1.27-fold, 1.45-fold and 16.21-fold higher than that in the flower buds, leaves and stems, respectively. The amount of quercetin-malonylglucoside in the flowers was 1.30-fold, 1.47-fold and 15.60-fold higher than that in the flower buds, leaves and stems, respectively. Acylation of flavonoids can further affect their physicochemical properties and pharmacological effects. Acylation reaction of flavonoids with aromatic carboxylic acids markedly enhances antioxidant activities [35,36].
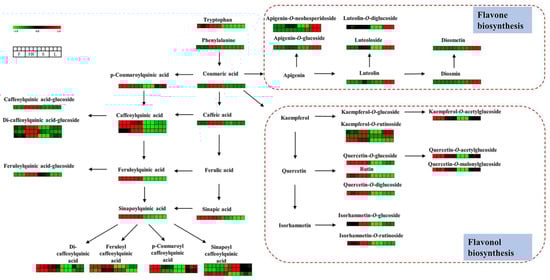
Figure 5.
Visualization of phenolic acids and flavonoids in biosynthesis pathway map. Red box represents a higher content, and green box represents a lower content.
Twenty-six phenolic acids with significant differential expression were found among different tissues. As shown in Figure 5, most phenolic acids showed a higher expression in the flower buds and flowers. Free phenolic acids, including coumaric acid, caffeic acid, ferulic acid, were much higher in the flower buds than those in other tissues. The amount of coumaric acid in the flower buds was 9.75-fold, 19.56-fold and 46.03-fold higher than that in the flowers, leaves and stems, respectively. The amount of caffeic acid in the flower buds was 4.18-fold, 5.36-fold, 1.58-fold higher than that in the flowers, leaves and stems, respectively. Caffeic acid can kill a diverse range of microbial pathogens, exerting an antimicrobial effect [37]. Bound phenolic acids were conjugated with quinic acid or glucose. Most bound phenolic acids were more abundant in the flowers and flower buds, including caffeoylquinic acid, di-caffeoylquinic acid, feruloylquinic acid, sinapoylquinic acid, feruloyl caffeoylquinic acid, etc. For example, the amount of caffeoylquinic acid isomers in the flower buds was 0.77-2.45 times, 2.17-30.01 times and 3.32-212.34 times more than in the flowers, leaves and stems, respectively. The amount of di-caffeoylquinic acid isomers in the flower buds was 0.61-1.06 times, 1.49-2.43 times and 3.31-25.93 times more than in the flowers, leaves and stems, respectively. The amount of feruloylquinic acid in the flower buds was 1.05-fold, 21.75-fold and 5.61-fold higher than in the flowers, leaves and stems, respectively. The amount of sinapoylquinic acid in the flower buds was 1.05-fold, 21.75-fold and 5.61-fold higher than that in flowers, leaves and stems, respectively. Caffeoylquinic acid and its derivatives are the main active ingredients of LJT, which have many therapeutic effects, such as antioxidant activity, antibacterial, liver protection, heart protection, anti-inflammatory, neuroprotective, anti-obesity, antiviral, anti-microbial, anti-hypertension [38]. The amount of phenolic acid-glucosides was higher in the flower buds than in other tissues such as caffeoylquinic acid-glucoside, feruloylquinic acid-glucoside, di-caffeoylquinic acid-glucoside. The amount of caffeoylquinic acid-glucoside in the flower buds was 7.10-fold, 6.20-fold, 6.65-fold higher than that in the flowers, leaves and stems, respectively. Similarly, the amount of feruloylquinic acid-glucoside in the flower buds was 7.07-fold, 7.68-fold, 2.66-fold higher than in the flowers, leaves and stems respectively. The amount of di-caffeoylquinic acid-glucoside isomers in the flower buds was 2.13–5.82 times, 2.74–7.56 and 4.74–30.88 times more than in the flowers, leaves and stems, respectively. Di-caffeoylquinic acid glucoside has a significant protective effect on DNA damage induced by ROO and OH radicals [39].
Thirty-two iridoids with significant differential expression were found among different tissues of LJT. As shown in Figure S1, most iridoids showed a higher expression in the flowers and flower buds. Aldosecologain, secoxyloganin, vogeloside, 7-O-ethylsweroside were the most abundant iridoids in the LJT (Figure 6). The amount of secoxyloganin in the flowers was 1.34-fold, 34.4-fold and 4.77-fold higher than that in the flower buds, leaves and stems, respectively. The amount of vogeloside in the flowers was 1.10-fold, 11.81-fold and 2.46-fold higher than that in the flower buds, leaves and stems, respectively. The amount of aldosecologanin in the flower buds was 1.80-fold, 5.08-fold and 4.20-fold higher than that in the flowers, leaves and stems, respectively. The amount of 7-O-ethylsweroside in the flower buds was 1.09-fold and 6.10-fold higher than that in the flowers and stems, respectively. However, 7-O-ethylsweroside was not detected in leaves. Iridoids have many pharmacological activities such as liver protection, anti-inflammatory and anti-cancer effects [40]. Vogeloside can inhibit nitric oxide production by lipopolysaccharide-activated macrophages, play a significant anti-inflammatory effect [41]. The amount and composition of flavonoids, phenolic acids and iridoids was significantly different in the four medicinal tissues, so the pharmacological effects and action mechanisms may also be different among them.
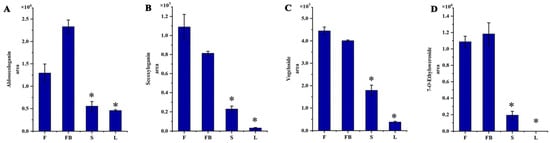
Figure 6.
The content of iridoids in different tissues of LJT. (A) Aldosecologanin. (B) Secologanin, (C) Vogeloside. (D) 7-O-ethylsweroside. * means that significant difference was found between FB/S and FB/L.
4. Conclusions
In this study, flowers, flower buds, stems and leaves of LJT were analyzed with un-targeted metabolomics based on UHPLC-Q-TOF MS. The major active components were identified in different tissues of LJT, including flavonoids, phenolic acids and iridoids. The content of metabolites in four tissues were significantly different. Flower buds were rich in flavonols, phenolic acids and iridoids. Flowers contained more acylated flavonol glucosides, phenolic acids and iridoids. Leaves were rich in flavones, and most metabolites showed lower content in the stems. The changes in metabolite content and composition can lead to differences in pharmacological effects and mechanisms among the four different tissues. The detailed relationship between the differential metabolites and their pharmacological activities needs further investigation.
Supplementary Materials
The following supporting information can be downloaded at: https://www.mdpi.com/article/10.3390/metabo13020186/s1, Table S1: Identification of primary metabolites in LJT. Figure S1: Heat map of differential iridoids in four different tissues of LJT.
Author Contributions
Y.W., Writing—original draft, investigation, methodology, formal analysis, L.L.; conceptualization, data curation, funding acquisition, writing—review and editing, W.J.; resources, supervision; validation; visualization, S.L.; resources, supervision, validation, J.F.; methodology, project administration, visualization, H.L.; resources, methodology, project administration, X.W.; conceptualization, funding acquisition, writing—review and editing. All authors have read and agreed to the published version of the manuscript.
Funding
This work was supported by National Natural Science Foundation of China (21904080), Shandong Major Technological Innovation Project (2021CXGC010508), Shandong Province Taishan Scholar Program (X. Wang), Science, Education and Industry Integration Innovation Pilot Project from Qilu University of Technology (Shandong Academy of Sciences) (2022JBZ02-04).
Institutional Review Board Statement
Not applicable.
Informed Consent Statement
Not applicable.
Data Availability Statement
The data are available in the article and supplementary material.
Conflicts of Interest
The authors declare no conflict of interest.
References
- Yang, B.; Zhong, Z.; Wang, T.; Ou, Y.; Tian, J.; Komatsu, S.; Zhang, L. Integrative omics of Lonicera japonica Thunb. Flower development unravels molecular changes regulating secondary metabolites. J. Proteomics 2019, 208, 103470. [Google Scholar] [CrossRef] [PubMed]
- Chang, Y.; Li, C.; Wang, R.; Li, X.; Guo, S.; Zhang, W.; Liu, B. The metabolic profile elucidation of Lonicera japonica flos water extract and the metabolic characteristics evaluation of bioactive compounds in human gastrointestinal tract in vitro. J. Pharm. Biomed. Anal. 2022, 219, 114906. [Google Scholar] [CrossRef] [PubMed]
- Zhang, T.; Liu, H.; Bai, X.; Liu, P.; Yang, Y.; Huang, J.; Zhou, L.; Min, X. Fractionation and antioxidant activities of the water-soluble polysaccharides from Lonicera japonica Thunb. Int. J. Biol. Macromol. 2020, 151, 1058–1066. [Google Scholar] [CrossRef]
- Ge, L.; Xie, Q.; Jiang, Y.; Xiao, L.; Wan, H.; Zhou, B.; Wu, S.; Tian, J.; Zeng, X. Genus Lonicera: New drug discovery from traditional usage to modern chemical and pharmacological research. Phytomedicine 2022, 96, 153889. [Google Scholar] [CrossRef]
- Han, M.H.; Lee, W.S.; Nagappan, A.; Hong, S.H.; Jung, J.H.; Park, C.; Kim, H.J.; Kim, G.Y.; Kim, G.; Jung, J.M.; et al. Flavonoids isolated from flowers of Lonicera japonica Thunb. inhibit inflammatory responses in BV2 microglial cells by suppressing TNF-α and IL-β through PI3K/Akt/NF-kb signaling pathways. Phytother. Res. 2016, 30, 1824–1832. [Google Scholar] [CrossRef]
- Oboh, G.; Agunloye, O.M.; Akinyemi, A.J.; Ademiluyi, A.O.; Adefegha, S.A. Comparative study on the inhibitory effect of caffeic and chlorogenic acids on key enzymes linked to Alzheimer’s disease and some pro-oxidant induced oxidative stress in rats’ brain-in vitro. Neurochem. Res. 2013, 38, 413–419. [Google Scholar] [CrossRef]
- Kou, Y.; Li, Z.; Yang, T.; Shen, X.; Wang, X.; Li, H.; Zhou, K.; Li, L.; Xia, Z.; Zheng, X.; et al. Therapeutic potential of plant iridoids in depression: A review. Pharm. Biol. 2022, 60, 2167–2181. [Google Scholar] [CrossRef] [PubMed]
- Shen, S.; Zhan, C.; Yang, C.; Fernie, A.R.; Luo, J. Metabolomics-centered mining of plant metabolic diversity and function: Past decade and future perspectives. Mol. Plant 2023, 16, 43–63. [Google Scholar] [CrossRef]
- Rao, G.; Liu, X.; Zhang, W.; Wu, W.; Zhang, J. Metabolomics reveals variation and correlation among different tissues of olive (Olea europaea L.). Biol. Open 2017, 6, 1317–1323. [Google Scholar]
- Gálvez Ranilla, L. The application of metabolomics for the study of cereal corn (Zea mays L.). Metabolites 2020, 10, 300. [Google Scholar] [CrossRef]
- Wu, Y.; Yang, H.; Huang, Z.; Zhang, C.; Lyu, L.; Li, W.; Wu, W. Metabolite profiling and classification of highbush blueberry leaves under different shade treatments. Metabolites 2022, 12, 79. [Google Scholar] [CrossRef] [PubMed]
- Chen, J.Y.; Wang, W.T.; Kong, J.Q.; Yue, Y.D.; Dong, Y.Y.; Zhang, J.C.; Liu, L. Application of UHPLC-Q-TOF MS based untargeted metabolomics reveals variation and correlation amongst different tissues of Eucommia ulmoides Oliver. Microchem. J. 2022, 172, 106919. [Google Scholar] [CrossRef]
- Fan, R.; Peng, C.; Zhang, X.; Qiu, D.; Mao, G.; Lu, Y.; Zeng, J. A comparative UPLC-Q-Orbitrap-MS untargeted metabolomics investigation of different parts of Clausena lansium (Lour.) Skeels. Food Sci. Nutr. 2020, 8, 5811–5822. [Google Scholar] [CrossRef] [PubMed]
- Li, S.; Chen, Y.; Duan, Y.; Zhao, Y.; Zhang, D.; Zang, L.; Ya, H. Widely targeted metabolomics analysis of different parts of Salsola collina Pall. Molecules 2021, 26, 1126. [Google Scholar] [CrossRef] [PubMed]
- Xie, X.; Gu, L.; Xu, W.; Yu, X.; Yin, G.; Wang, J.; Jin, Y.; Wang, L.; Wang, B.; Wang, T. Integrating anti-influenza virus activity and chemical pattern recognition to explore the quality evaluation method of Lonicerae japonicae Flos. Molecules 2022, 27, 5789. [Google Scholar] [CrossRef]
- Wang, D.; Du, N.; Wen, L.; Zhu, H.; Liu, F.; Wang, X.; Du, J.; Li, S. An efficient method for the preparative isolation and purification of flavonoid glycosides and caffeoylquinic acid derivatives from leaves of Lonicera japonica Thunb. using high speed counter-current chromatography (HSCCC) and prep-HPLC guided by DPPH-HPLC experiments. Molecules 2017, 22, 229. [Google Scholar]
- Su, X.; Zhu, Z.H.; Zhang, L.; Wang, Q.; Xu, M.M.; Lu, C.; Zhu, Y.; Zeng, J.; Duan, J.A.; Zhao, M. Anti-inflammatory property and functional substances of Lonicerae japonicae Caulis. J. Ethnopharmacol. 2021, 267, 113502. [Google Scholar] [CrossRef]
- Tsugawa, H.; Cajka, T.; Kind, T.; Ma, Y.; Higgins, B.; Ikeda, K.; Kanazawa, M.; VanderGheynst, J.; Fiehn, O.; Arita, M. MS-DIAL: Data-independent MS/MS deconvolution for comprehensive metabolome analysis. Nat. Methods 2015, 12, 523–526. [Google Scholar] [CrossRef]
- Shen, N.; Wang, T.; Gan, Q.; Liu, S.; Wang, L.; Jin, B. Plant flavonoids: Classification, distribution, biosynthesis, and antioxidant activity. Food Chem. 2022, 383, 132531. [Google Scholar] [CrossRef]
- Liu, X.; Fan, X.; Wang, X.; Liu, R.; Meng, C.; Wang, C. Structural characterization and screening of chemical markers of flavonoids in Lysimachiae Herba and Desmodii Styracifolii Herba by ultra high-performance liquid chromatography quadrupole time-of-flight tandem mass spectrometry based metabolomics approach. J. Pharm. Biomed. Anal. 2019, 171, 52–64. [Google Scholar] [CrossRef]
- Ali, A.; Cottrell, J.J.; Dunshea, F.R. LC-MS/MS Characterization of phenolic metabolites and their antioxidant activities from australian native plants. Metabolites 2022, 12, 1016. [Google Scholar] [CrossRef]
- Wu, S.; Shen, D.; Wang, R.; Li, Q.; Mo, R.; Zheng, Y.; Zhou, Y.; Liu, Y. Phenolic profiles and antioxidant activities of free, esterified and bound phenolic compounds in walnut kernel. Food Chem. 2021, 350, 129217. [Google Scholar] [CrossRef]
- Zhang, F.X.; Li, Z.T.; Li, M.; Yuan, Y.L.; Cui, S.S.; Chen, J.X.; Li, R.M. Dissection of the potential anti-influenza materials and mechanism of Lonicerae japonicae flos based on in vivo substances profiling and network pharmacology. J. Pharm. Biomed. Anal. 2021, 193, 113721. [Google Scholar] [CrossRef]
- Kanehisa, M.; Furumichi, M.; Tanabe, M.; Sato, Y.; Morishima, K. KEGG: New perspectives on genomes, pathways, diseases and drugs. Nucleic Acids Res. 2017, 45, D353–D361. [Google Scholar] [CrossRef] [PubMed]
- Tegeder, M. Transporters for amino acids in plant cells: Some functions and many unknowns. Curr. Opin. Plant Biol. 2012, 15, 315–321. [Google Scholar] [CrossRef] [PubMed]
- Pascual, M.B.; El-Azaz, J.; de la Torre, F.N.; Cañas, R.A.; Avila, C.; Cánovas, F.M. Biosynthesis and metabolic fate of phenylalanine in conifers. Front. Plant Sci. 2016, 7, 1030. [Google Scholar] [CrossRef]
- Wang, Y.; Kang, Y.; Ma, C.; Miao, R.; Wu, C.; Long, Y.; Ge, T.; Wu, Z.; Hou, X.; Zhang, J.; et al. CNGC2 is a Ca2+ influx channel that prevents accumulation of apoplastic Ca2+ in the leaf. Plant Physiol. 2017, 173, 1342–1354. [Google Scholar] [CrossRef] [PubMed]
- Lim, G.H.; Singhal, R.; Kachroo, A.; Kachroo, P. Fatty acid- and lipid-mediated signaling in plant defense. Annu. Rev. Phytopathol. 2017, 55, 505–536. [Google Scholar] [CrossRef] [PubMed]
- Li, P.; Ruan, Z.; Fei, Z.; Yan, J.; Tang, G. Integrated transcriptome and metabolome analysis revealed that flavonoid biosynthesis may dominate the resistance of Zanthoxylum bungeanum against stem canker. J. Agric. Food Chem. 2021, 69, 6360–6378. [Google Scholar] [CrossRef]
- Aziz, N.; Kim, M.Y.; Cho, J.Y. Anti-inflammatory effects of luteolin: A review of in vitro, in vivo, and in silico studies. J. Ethnopharmacol. 2018, 225, 342–358. [Google Scholar] [CrossRef]
- Wang, W.; Yue, R.F.; Jin, Z.; He, L.M.; Shen, R.; Du, D.; Tang, Y.Z. Efficiency comparison of apigenin-7-O-glucoside and trolox in antioxidative stress and anti-inflammatory properties. J. Pharm. Pharmacol. 2020, 72, 1645–1656. [Google Scholar] [CrossRef]
- Devi, V.G.; Rooban, B.N.; Sasikala, V.; Sahasranamam, V.; Abraham, A. Isorhamnetin-3-glucoside alleviates oxidative stress and opacification in selenite cataract in vitro. Toxicol. In Vitro 2010, 24, 1662–1669. [Google Scholar] [CrossRef]
- Lee, J.; Lee, J.; Kim, S.J.; Kim, J.H. Quercetin-3-O-glucoside suppresses pancreatic cancer cell migration induced by tumor-deteriorated growth factors in vitro. Oncol. Rep. 2016, 35, 2473–2479. [Google Scholar] [CrossRef]
- Martínez-Lüscher, J.; Brillante, L.; Kurtural, S.K. Flavonol profile is a reliable indicator to assess canopy architecture and the exposure of red wine grapes to solar radiation. Front. Plant Sci. 2019, 10, 10. [Google Scholar] [CrossRef] [PubMed]
- Xin, X.; Zhang, M.; Li, X.; Lai, F.; Zhao, G. Biocatalytic synthesis of acylated derivatives of troxerutin: Their bioavailability and antioxidant properties in vitro. Microb. Cell Fact. 2018, 17, 130. [Google Scholar] [CrossRef] [PubMed]
- El-Kersh, D.M.; Abou El-Ezz, R.F.; Fouad, M.; Farag, M.A. Unveiling natural and semisynthetic acylated flavonoids: Chemistry and biological actions in the context of molecular docking. Molecules 2022, 27, 5501. [Google Scholar] [CrossRef] [PubMed]
- Khan, F.; Bamunuarachchi, N.I.; Tabassum, N.; Kim, Y.M. Caffeic acid and its derivatives: Antimicrobial drugs toward microbial pathogens. J. Agric. Food Chem. 2021, 69, 2979–3004. [Google Scholar] [CrossRef]
- Naveed, M.; Hejazi, V.; Abbas, M.; Kamboh, A.A.; Khan, G.J.; Shumzaid, M.; Ahmad, F.; Babazadeh, D.; FangFang, X.; Modarresi-Ghazani, F.; et al. Chlorogenic acid (CGA): A pharmacological review and call for further research. Biomed. Pharmacother. 2018, 97, 67–74. [Google Scholar] [CrossRef]
- Gao, C.Y.; Tian, C.R.; Zhou, R.; Zhang, R.G.; Lu, Y.H. Phenolic composition, DNA damage protective activity and hepatoprotective effect of free phenolic extract from Sphallerocarpus gracilis seeds. Int. Immunopharmacol. 2014, 20, 238–247. [Google Scholar] [CrossRef]
- Wang, C.; Gong, X.; Bo, A.; Zhang, L.; Zhang, M.; Zang, E.; Zhang, C.; Li, M. Iridoids: Research advances in their phytochemistry, biological activities, and pharmacokinetics. Molecules 2020, 25, 287. [Google Scholar] [CrossRef]
- Meragelman, T.L.; Renteria, B.S.; Silva, G.L.; Sotomayor, C.; Gil, R.R. Modified secoiridoid from Acicarpha tribuloides and inhibition of nitric oxide production in LPS-activated macrophages. Phytochemistry 2006, 67, 1534–1538. [Google Scholar] [CrossRef] [PubMed]
Disclaimer/Publisher’s Note: The statements, opinions and data contained in all publications are solely those of the individual author(s) and contributor(s) and not of MDPI and/or the editor(s). MDPI and/or the editor(s) disclaim responsibility for any injury to people or property resulting from any ideas, methods, instructions or products referred to in the content. |
© 2023 by the authors. Licensee MDPI, Basel, Switzerland. This article is an open access article distributed under the terms and conditions of the Creative Commons Attribution (CC BY) license (https://creativecommons.org/licenses/by/4.0/).