Article

Export Trade, Absorptive Capacity, and High-Quality Economic Development in China

School of Economics and Finance, Xi’an Jiaotong University, Xi’an 710061, China
*
Author to whom correspondence should be addressed.
Systems 2023, 11(2), 54; https://doi.org/10.3390/systems11020054
Submission received: 4 November 2022 / Revised: 28 December 2022 / Accepted: 15 January 2023 / Published: 18 January 2023

Abstract

:
Exports are a crucial driving force of China’s economic growth; however, researchers have yet to verify whether they can effectively improve the high-quality economic development. Based on interprovincial panel data from 2000 to 2019, in this study, we constructed a high-quality economic development indicator system through the entropy weight method, and we adopted the linear regression model and dynamic panel threshold model to empirically test the export trade effect on the high-quality economic development as well as its mechanism. We also probed the impact of the heterogeneous absorptive capacity on the high-quality economic development. According to our research findings, China’s export trade has substantially promoted the high-quality economic development level by, from the viewpoint of the action path, positively influencing the economic, open, and coordination subsystems. The influence of the export trade on the high-quality economic development has a substantial single-threshold effect on the heterogeneous absorptive capacity; that is, when the threshold variables that represent the regional absorptive capacity (the economic level, R&D intensity, and technological gap) are all higher than the threshold value, the export trade has a substantial positive impact on the high-quality economic development level. The research conclusions of this paper provide new ideas for the development of high-quality economic systems as well as a useful reference for China in its formulation of more targeted foreign trade policies.

1. Introduction

1.1. Background

China’s economy has shifted from the stage of rapid growth to the stage of high-quality development, which means that its economy has entered a critical period in which the quality and efficiency of the development are improving and the transformation of both the new and old driving forces is being realized. As an integral part of China’s economy, international trade is a paramount engine of its economic growth and a major source of its technological progress. Since the reform and China’s opening-up, and especially since its accession to the WTO, China has actively participated in the international division of labor by taking advantage of the labor costs, developed an export-oriented economy, and caught up to and surpassed economic aggregation by virtue of its technological backwardness. Although the current development of economic globalization is facing a headwind, and unilateralism and trade protectionism are increasing, China presents a new situation in the midst of the changes, timely proposing a new development pattern of the “dual circulation of domestic and foreign markets”, and emphasizing that “China will not close its door to the outside world, but will open it wider and wider”. In the face of unprecedented opportunities and challenges, foreign trade enterprises will participate in the international market with an updated attitude in the future, actively promoting the high-quality “external circulation” development pattern, realizing the combination of global value chain reconstruction and domestic economic restructuring, promoting one another through the dual circulation of domestic and foreign markets, and jointly expediting high-quality economic development. The development of export trade has effectively ameliorated the domestic labor productivity and played a vital role in propelling China’s economic growth. Trade exposes domestic enterprises to overseas experiences and research, which helps them to learn, digest, absorb, and innovate new technologies. Moreover, foreign trade enterprises that participate in international competition are more likely to stimulate their pioneering and innovative vitalities and inject impetus into their original innovations. At present, China’s foreign trade export development is gradually changing from a low-tech labor-intensive model to a medium–high-tech knowledge and technology-intensive model, which is helping China to transition from a large trading country to a strong trading country. In the critical period of China’s foreign trade transformation and high-quality economic development, under the new dual circulation of domestic and foreign markets, it is imperative that we explore the relationship between export trade and high-quality economic development.

1.2. Study Motivation

Since its accession to the WTO in 2001, China’s economy has embarked on a fast track of development, with an average annual economic growth rate of more than double digits and a rapid increase in GDP. It has to be said that the global market has given China a huge space for development. Foreign trade once accounted for 60 to 70 percent of China’s GDP. Previous studies have also confirmed the important role of export trade in China’s economic growth through empirical analysis [1]. However, a series of structural problems accumulated in China’s long-term rapid growth stage have also been exposed, such as low quality and efficiency, insufficient independent innovation, unbalanced economic structure, and serious environmental pollution, which seriously restricts China’s sustainable economic and social development. It is urgent to transform the mode of economic development and promote comprehensive and coordinated development, and high-quality economic development has attracted more and more attention [2]. If this is the case, can export trade continue to be an important driving force for China’s high-quality economic development? No studies have explored this issue. The research motivation of this paper is as follows: first, we need to figure out the impact of export trade on high-quality economic development. Secondly, it explores the mechanisms through which export trade indirectly acts on high-quality economic development; Thirdly, considering that there are great differences in the level of economic development and absorptive capacity among regions in China, the absorptive capacity is included in the empirical modeling process to further verify whether the impact of export trade on high-quality economic development is different due to the absorptive capacity of different regions. The premise of solving the above problems is to objectively evaluate and measure the high-quality development of China’s economy. To this end, we select five sub-systems and 33 basic indicators to build the high-quality economic development index system, and then calculate the index by entropy weight method. Secondly, it is necessary to build an econometric regression model for empirical analysis. In terms of research methods, the general linear panel model, dynamic panel model, and dynamic panel threshold model are used to test the above problems, respectively. In short, figuring out the influencing mechanism of export trade on high-quality economic development is of great theoretical and practical significance for China to cope with the severe international situation, improve the new pattern of comprehensive opening-up, and realize the construction of a strong country with high-quality development. The solution of the above problems can not only bring new ideas for China’s high-quality economic development, but also provide useful reference for China to make more targeted foreign trade related policies.

1.3. Article Structure Arrangement

The follow-up structure of this paper is as follows. The Section 2 contains a literature review, in which we sort out the existing literature on trade and economic development to provide theoretical support for the follow-up research of this paper. In the Section 3, we present the construction and measurement of the high-quality economic development index system. In the Section 4, we present the theoretical mechanism, research hypotheses, and empirical research design of the study. In the Section 5, we present the empirical research results. In the Section 6, we summarize the research conclusions of the study and propose relevant policy recommendations.

2. Literature Review

2.1. Relevant Research on High-Quality Economic Development and Its Measurement

In previous studies, there are two understandings of the quality of economic growth: (1) a narrow understanding, which simply equates the quality of the economic growth with its efficiency, such as the total factor productivity [3,4], ignoring the sustainable and stable development of the economy; (2) a broad understanding, in which the quality of the economic growth is the inevitable result of the development of its quantity, to a certain extent, which has a rich connotation and needs to be comprehensively reflected through a multidimensional indicator system. The representative views are as follows. Thomas considers the economic growth quality to be a supplement to the speed of the development. He believes that the quality of the economic growth should also cover the welfare distribution, ecological environment, risk resistance, and governance [5]. Taking a broad view, Barro argues that the quality of the economic growth should include life expectancy, environmental conditions, social welfare, political institutions, and religious beliefs [6]. The connotations of high-quality economic development are more abundant, including not only economic factors, but also, among others, social, environmental, governance, and quality of life factors [7]. Jin also argues that high-quality development should be multidimensional, with the goal of meeting the people’s growing and multifaceted needs for better lives [8]. The method of accurately measuring the high-quality development is particularly important before conducting relevant research. The measurement of the high-quality-development indicators includes both single and multivariate indicators. Scholars primarily measure high-quality development with single indicators, such as the per capita GDP [9], green total factor productivity [10], and Solow residual [11]. The single-index-related literature has laid a foundation for the follow-up study of the high-quality development; however, a single index reflects nothing more than one aspect of the economic and social development, and it cannot comprehensively reflect the high-quality development connotations, nor can it be used to scientifically judge them. Therefore, more and more scholars are focusing on multivariate indicators to measure the high-quality -development indicators from different perspectives. Wei and Li built a high-quality economic development indicator system with 10 dimensions, which includes the economic structure, innovation drive, resource allocation, and regional coordination and sharing [12]. Jian and Nie constructed a high-quality development index at the national level from five aspects: the product and service quality, economic benefits, social benefits, ecological benefits, and economic operation state, and they concluded that China’s current high-quality development rate is substantially behind the expansion rate of its economic growth [13]. Jin points out that the development concept of “innovation, coordination, green, openness and sharing” is a new requirement for high-quality development in the new era, as well as an evaluation criterion for whether high-quality development has been achieved. Li and Ren [5] and Liu et al. [14] built a comprehensive indicator system based on the five development concepts to measure the high-quality-development level.

2.2. Relevant Research on Trade and Economic Development

The concept of “economic development” is relatively broad, covering both the increase in “quantity” and the improvement in “quality”. Here, we limited the literature review to the trade impact on the quality of the economic development. In line with the development context of the existing research, we divided the relevant literature into the following categories.
(1)
The impact of trade on the economic efficiency. In the endogenous economic growth theory, which emerged in the 1980s, endogenous technological progress is the decisive factor for sustainable economic growth. Based on this theory, the new trade theory further concludes that trade has an impact on economic growth and productivity through the expansion of the economies of scale and technological spillovers. The growth of exports can introduce technology innovation rewards to traders, and the end of the technology monopoly period will gradually narrow the technology gap between countries and stimulate a new demand for technology research and development in the countries with first-mover-innovation advantages [15]. Moreover, technology spillovers that are generated by trade exports through external economic effects and differential factor productivity effects can improve the productivity levels of the nonexport sectors [16], and the learning effect produced by trade via “learning by doing” can further enhance a country’s total factor productivity [17]. In China, there has been an R&D spillover effect since the opening-up of trade [18]. A large number of studies have emerged in the academic circle in which the researchers conduct in-depth discussions on the relationship between trade and technological progress, and they have concluded that the trade openness has remarkably improved the total factor productivity [19], and that exports encourage enterprises to participate in R&D. Comparatively speaking, enterprises that export and research and develop at the same time are more productive; however, the incentive effect of exports on innovation only occurs within foreign trade enterprises that have higher productivities [20]. On the contrary, some scholars believe that regions that are engaged in export processing have an inhibitory effect on the growth rate of the total factors in the region [21];
(2)
The impact of trade on the green efficiency. Foreign trade has a positive effect on energy efficiency, and primarily through the technology spillovers from imports and the learning from exports [22]. The service export trade of developing countries is conducive to the promotion of China’s green total factor productivity [23]. Moreover, the improvements in the trade export scale and export quality have substantially and positively promoted the green efficiency of regional industries [24]. Contrary to the above research conclusions, some scholars believe that the low-level expansion of export trade hinders the green transformation of China’s industry, thereby reducing the industrial energy efficiency [25]. The total trade volume at the industry level has not substantially affected China’s energy efficiency. However, the import of intermediate goods remarkably improves the energy efficiency, while the export of intermediate goods is not conducive to an improvement [26]. After crossing the threshold of human capital, trade liberalization has tremendously promoted green productivity; however, the impact is only partially relevant [27];
(3)
The impact of trade on the economic structure. The foreign trade structure has a vital impact on the upgrading of the national industrial structure [28]. In accordance with the theory of factor endowment and comparative advantage, a country will make full use of its factor resources with endowment advantages to participate in the international division of labor, which promotes industrial development. Based on the comparative advantage theory, developing countries can achieve industrial upgrading by following the development path of “assembly—manufacturing—R&D” [29]. At the same time, trade can accelerate the advanced development of the industrial structure through the accumulation of material capital and the stimulation of the consumption demand [30]. Some scholars also argue that foreign trade and the industrial structure have upgraded to a nonlinear U-shaped relationship. With the expansion of trade, the level of the industrial structure first declined and then increased [31]. Moreover, nothing but the optimization of the trade structure in goods can promote the upgrading of the industrial structure, while the role of trade in services is not substantial [32].

2.3. Objectives and Contributions

After reviewing the existing literature, we believe that the existing studies still have the following deficiencies. First, the existing studies lack a unanimous conclusion on the measurement of the high-quality economic development indicators. In addition, the current economy is in the initial stage of high-quality economic development. With the continuous development of the economy and society, and the transition of the major social contradictions, there is still sufficient space for the expansion of the connotations and extensions of these indicators, and we still need to improve their measurement. Second, most of the existing studies on the impact of export trade on the quality of economic growth focus on a single level of discussion, such as technological innovation, green development, or structural upgrading. Due to the differences in the index selection and model construction, no consensus has been reached, and it requires further verification. Moreover, we lack research on the export trade impact on high-quality economic development.
In view of this, in this study, we primarily expanded the existing research from the following aspects: (1) based on the five development concepts, we constructed an evaluation system that covers 5 subsystems, 17 subindexes, and 33 basic indexes, including economy, society, ecology, and openness and coordination, to comprehensively and systematically measure the high-quality economic development system; (2) we do not limit the influence of the export trade on the economic quality to a certain aspect but base it on multifaceted comprehensive evaluation indicators. We tested the direct impact of the export trade on the high-quality economic development by using China’s provincial panel data; (3) from the perspective of the indirect effects, we discuss the ways in which export trade affects high-quality economic development; (4) considering the difference in the absorption capacities among the regions, we constructed a dynamic panel threshold model to explore the impact of the threshold variables of the different absorption capacities on the relationship between the export trade and high-quality economic development. In addition, we also tested the empirical model by replacing the variables to ensure that the empirical results were robust and reliable.

3. High-Quality Economic Development System

3.1. System Construction

High-quality economic development is a new and important development concept and strategy for the new era that aims to meet the people’s ever-growing needs for better lives, in many aspects [6], and embodies the new development philosophy. High-quality development should be multidimensional, involving not only the economic field, but also a wider range of perspectives, such as social, political, and cultural aspects. The measurement of the high-quality-development level should include all aspects of economic and social development, and it should reflect the connotations and extensions of the high-quality development; however, it is impossible to exhaust all of the indicators. Therefore, the selection of the high-quality indicators should follow the principles of comprehensiveness, comparability, and representativeness [33]. The new requirements of the high-quality development in the new era are “innovative, coordinated, green, open, and shared” development. The five development concepts are also the criteria for evaluating whether high-quality development has been achieved.
To scientifically and objectively construct an index system of high-quality economic development, we should not only accurately understand and grasp the connotations and extensions of the high-quality development, but also take into account the statistical connotations of the index measurement. Based on this, we followed the five development concepts, and based on the strengths of the evaluation indicators related to the existing studies [10,11,12], we divided the high-quality economic development indicator system into the following five subsystems: (1) the economic subsystem. To reflect the vitality of the economic development and maintain sustained and stable economic growth, it is also necessary to optimize the internal composition of the economy. At the same time, it is necessary to implement efficient development with innovation as the premise, enable scientific and technological innovation with finance, boost the high-quality development of the economic system, and create a good market environment for economic entities. Therefore, we measured the economic subsystem from four dimensions: economic growth, innovation efficiency, financial efficiency, and market development; (2) the social subsystem. The whole social field also needs to achieve high-quality development. The people’s desire for better lives cannot be achieved without social development and progress. The high-quality development of the social system requires that people share the fruits of development. The income gap is in a reasonable range, and the basic living and security needs are gradually being met. Therefore, the measurement of the social subsystem should cover three dimensions: social progress, social equity, and social security; (3) the ecological subsystem. High-quality economic development must consider the green ecological development and utilization rate of energy resources, and the level of environmental protection must constantly be improved, the pollution situation gradually improved, and the people’s living environment continuously bettered. Therefore, the measurement of this subsystem should cover three dimensions: environmental pollution, the environmental protection level, and energy resources; (4) the open subsystem. High-quality development must be open development [11]. The high-level opening-up should propel high-quality economic development [34], and it should not only be reflected in the economic field but should also be an all-around and multilevel opening. Therefore, we measured the open subsystems from three dimensions: trade opening, investment opening, and tourism opening; (5) the coordination subsystem. Coordinated development is the inherent requirement of high-quality economic development. Economic and social development is systematic and integrated, and it requires the coordination and linkage between the different factors, fields, and links to achieve the overall planning and a comprehensive balance. Therefore, we measured the coordination subsystem from four dimensions: income, consumption, production, and livelihood. The 5 subsystems of high-quality economic development contain 17 subindexes and 33 specific indicators. Finally, we selected panel data of 30 provinces in China from 2000 to 2019 to measure the high-quality-development index system. We present the selection and measurement of the indicators in Table 11.

3.2. Measurement Method

Researchers commonly use the entropy weight method to determine the weight of indicators, and especially in the comprehensive evaluation of economic indicators. Based on the principle of the “difference drive”, this method highlights local differences and obtains the optimal weight from the actual data of each sample, which reflects the utility value of the entropy weight of the indicator information and can avoid the influence of human factors. The index weight produced by this method is more objective and thus has high credibility. In addition, the weighting process of the entropy weight method is transparent and reproducible [35]. In addition, the method can realize the dimensionless processing of data through the standardization method, which has the advantages of monotonicity, scale independence, and data information constancy.
Therefore, in this study, we referred to Hu and Xu’s practice [36]. We used the entropy weight method to measure the high-quality economic development level, and we obtained the weight of each index by calculating the information entropy of each basic index and then calculating the comprehensive high-quality economic development index. We present the specific calculation formula in the following sections.

3.2.1. Standardization of Treatment

Because the indicator measure dimensions are different, we could not directly compare them; thus, we required dimensionless standardization. The standardized formula for the positive indicators is as follows:
X i j = X i j min ( X 1 j , X 2 j , , X n j ) max ( X 1 j , X 2 j , , X n j ) min ( X 1 j , X 2 j , , X n j ) , i = 1 , 2 , , n ; j = 1 , 2 , , m
The standardized formula for the negative indicators is as follows:
X i j = max ( X 1 j , X 2 j , , X n j ) X i j max ( X 1 j , X 2 j , , X n j ) min ( X 1 j , X 2 j , , X n j ) , i = 1 , 2 , , n ; j = 1 , 2 , , m
where i represents the region; j represents the measurement index; Xij and X’ij represent the original data and standardized data of the jth index of the region (i), respectively; n represents the number of regions; m represents the number of indicators.

3.2.2. Calculation of Comprehensive Indicators

According to the standardized index, the information entropy ei of region i and the weight value of each index wj are solved, and finally the comprehensive index value of high-quality economic development (hqdit) is calculated according to the information entropy and standardized value. The calculation formula is as follows:
e j = ( 1 ln n ) i = 1 n X i j i = 1 n X i j ln X i j i = 1 n X i j
w j = 1 e j / j = 1 m 1 e j
h q d i t = j = 1 m W j X i j
The comprehensive high-quality-development index value (hqdit) of each region calculated by the above formula was between 0 and 1. The higher the hqdit value, the higher the high-quality economic development level in the region, and the lower the hqdi value, the lower the high-quality economic development level in the region.

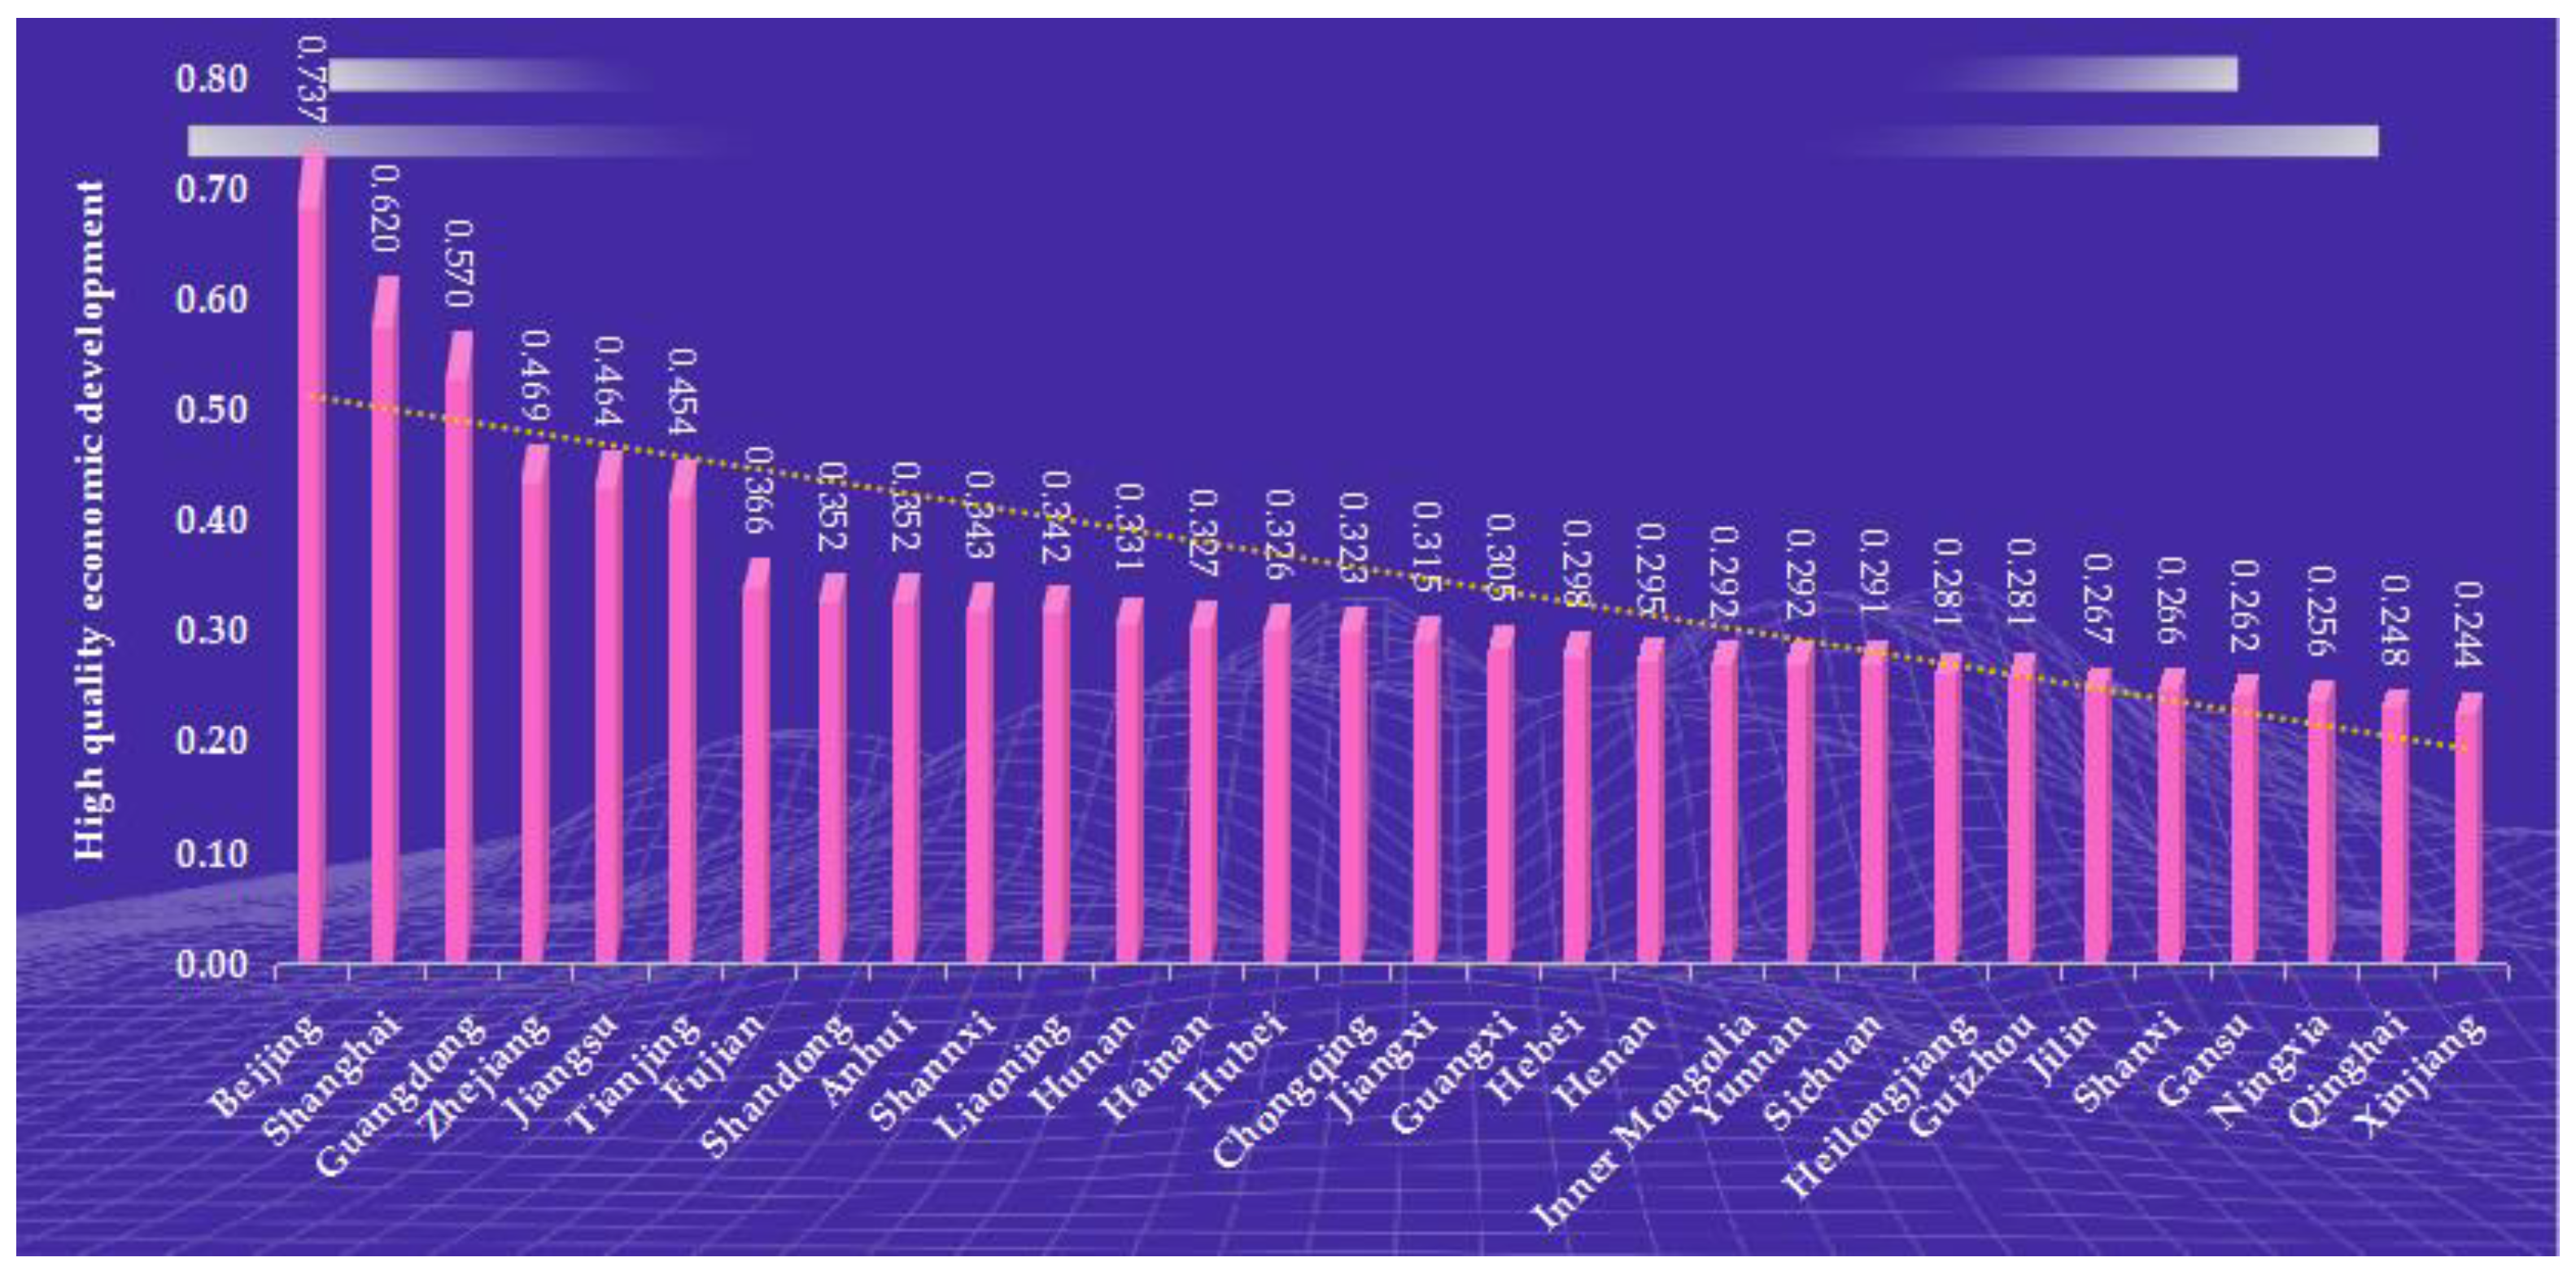
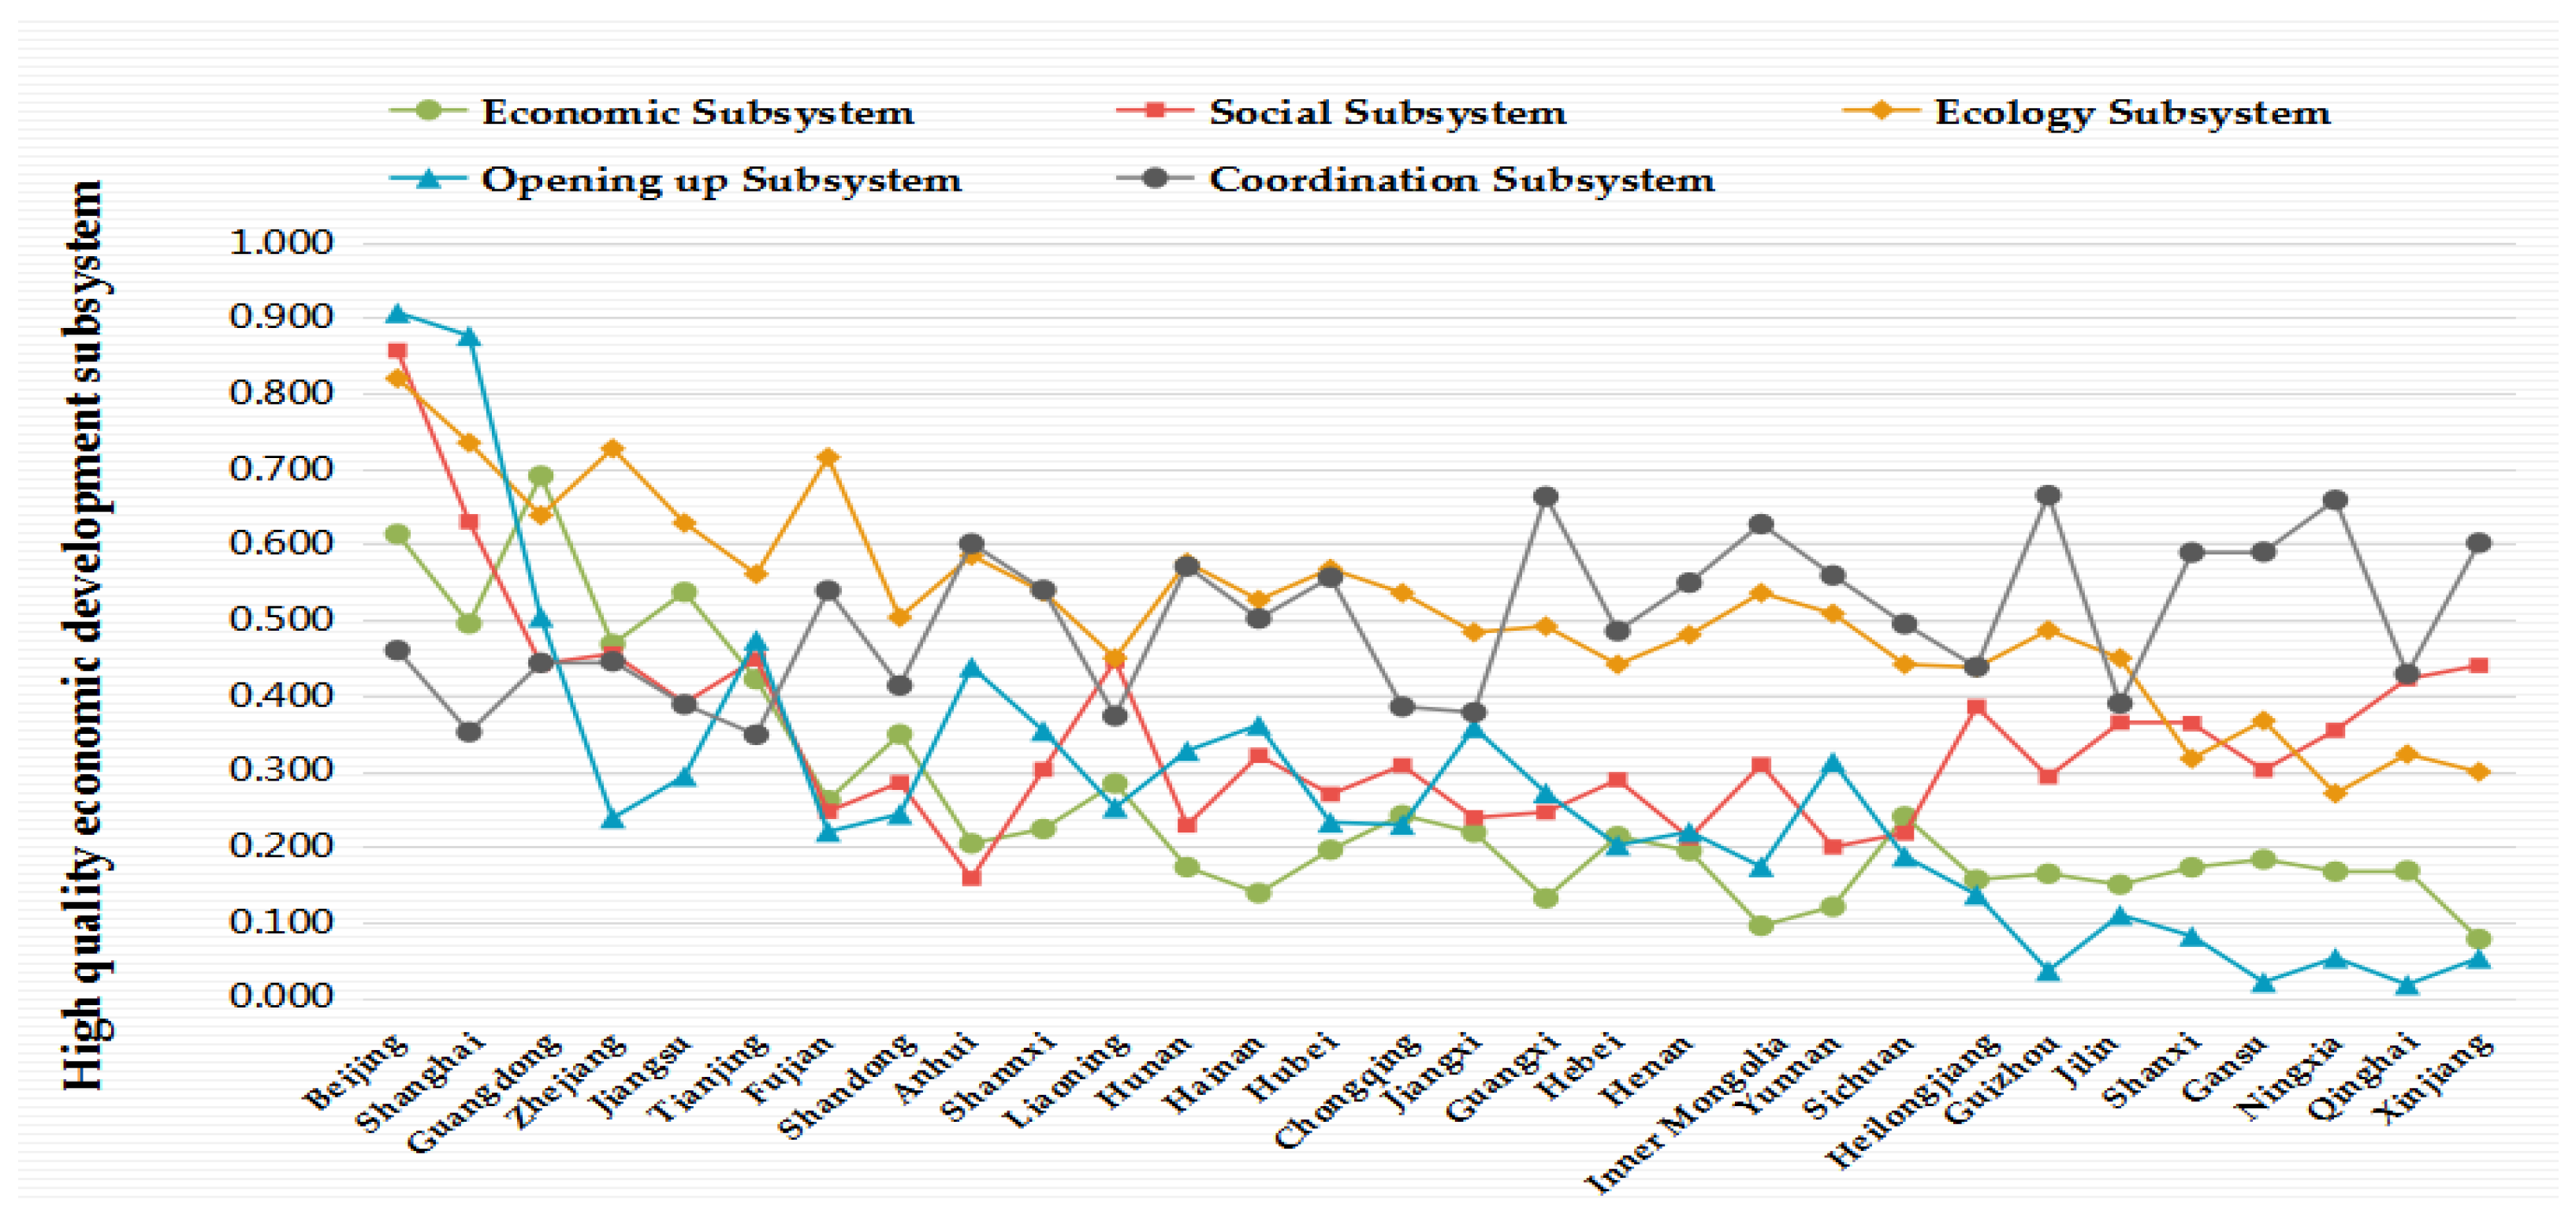
3.3. Analysis of System Results

We present the systematic measurement results of the high-quality economic development in 30 provinces in China for 2019 in Figure 1. In the figure, the high-quality economic development scores in each province range from 0.244 to 0.737, with the lowest score in Xinjiang (0.244), and the highest in Beijing (0.737). The measured scores are basically consistent with the results obtained by Guo Yun et al. [37]. We further followed the current situation of China’s regional economic development and combined the practices of the existing research [38], dividing the high-quality economic development system into four development levels: (1) the leading high-quality- development regions, which were the regions with scores greater than 0.5, including Beijing, Shanghai, and Guangdong; (2) the potential high-quality development areas, which included regions with scores between 0.34 and 0.5, such as Zhejiang, Jiangsu, Tianjin, Fujian, Shandong, Anhui, Shaanxi, and Liaoning; (3) the mediocre-quality development areas, which were the areas with scores between 0.29 and 0.34, including Hunan, Hainan, Hubei, Chongqing, and other regions; (4) the low-quality-development areas, which were backward areas with scores below 0.29, including Heilongjiang, Guizhou, Jilin, Shanxi, and other regions.
Among the provinces in the leading and potential areas of high-quality development, the only ones in the central and western regions were Anhui and Shaanxi, while the remaining provinces are in the eastern regions. The mediocre-quality development areas are mostly in the central provinces, and the underdeveloped areas are all in the western provinces, except for Heilongjiang, Guizhou, Jilin, and Shanxi. The distribution of the regional economic growth is basically the same as that of China, and the level of high-quality development is tilted from the eastern region to the central and western regions.
To further analyze the characteristics and internal logic of China’s high-quality economic development, we measured the five subsystems that constitute it, and we present the results in Figure 2. The broken-line chart in Figure 2 indicates that the trends of the economic, ecological, and open subsystems were basically consistent with the comprehensive high-quality-development index, and the score level from the leading high-quality development areas, potential high-quality development areas, and mediocre-quality development areas to the backward areas is characterized by successive fluctuations and decreases, and the regional differences between the social subsystem and coordination subsystem are smaller than those of the other subsystems. The average scores of the five subsystems were 0.258, 0.347, 0.514, 0.272, and 0.501, respectively. Among the economic subsystems, Guangdong and Xinjiang had the highest and lowest scores, respectively, while Jiangsu and Sichuan, which were located in the development-potential area, had substantially higher scores than the other provinces in the same region. In the social subsystem, the scores of Beijing and Shanghai, which were the leading development areas, were substantially higher than those of the other provinces, while the scores of the backward development areas had a “tail raising” feature. The mean value of the ecological subsystem was the largest, the high and low values were located in Beijing and Ningxia, respectively, and there was not much difference in the score levels of the remaining provinces, indicating that, compared with the other subsystems, there is little difference among the current ecological environment statuses of the provinces in China; however, the regional distribution difference is still higher in the east and lower in the west, which is because, although the industrial pollution is serious in the developed eastern regions, the investment in environmental pollution control is relatively strong and the environmental protection level is relatively high; thus, the overall ecological environment level does not show a trend of high in the west and low in the east. Contrary to the score of the ecological subsystem, the score of the open subsystem substantially varied among the four regional levels, with a maximum value of 0.907 (Beijing) and minimum value of 0.017 (Qinghai). Most of the regions with low levels of openness are the less developed inland areas; that is, the openness levels of the eastern coastal areas are substantially higher than those of the central and western inland areas, and the openness degrees of the inland border areas are substantially higher than those of the inland nonborder areas. Finally, the average score of the coordination subsystem was second only to that of the ecological subsystem. Except for some extreme values in some areas, the regional differences were small overall.

4. Theoretical Mechanism, Hypotheses, and Research Design

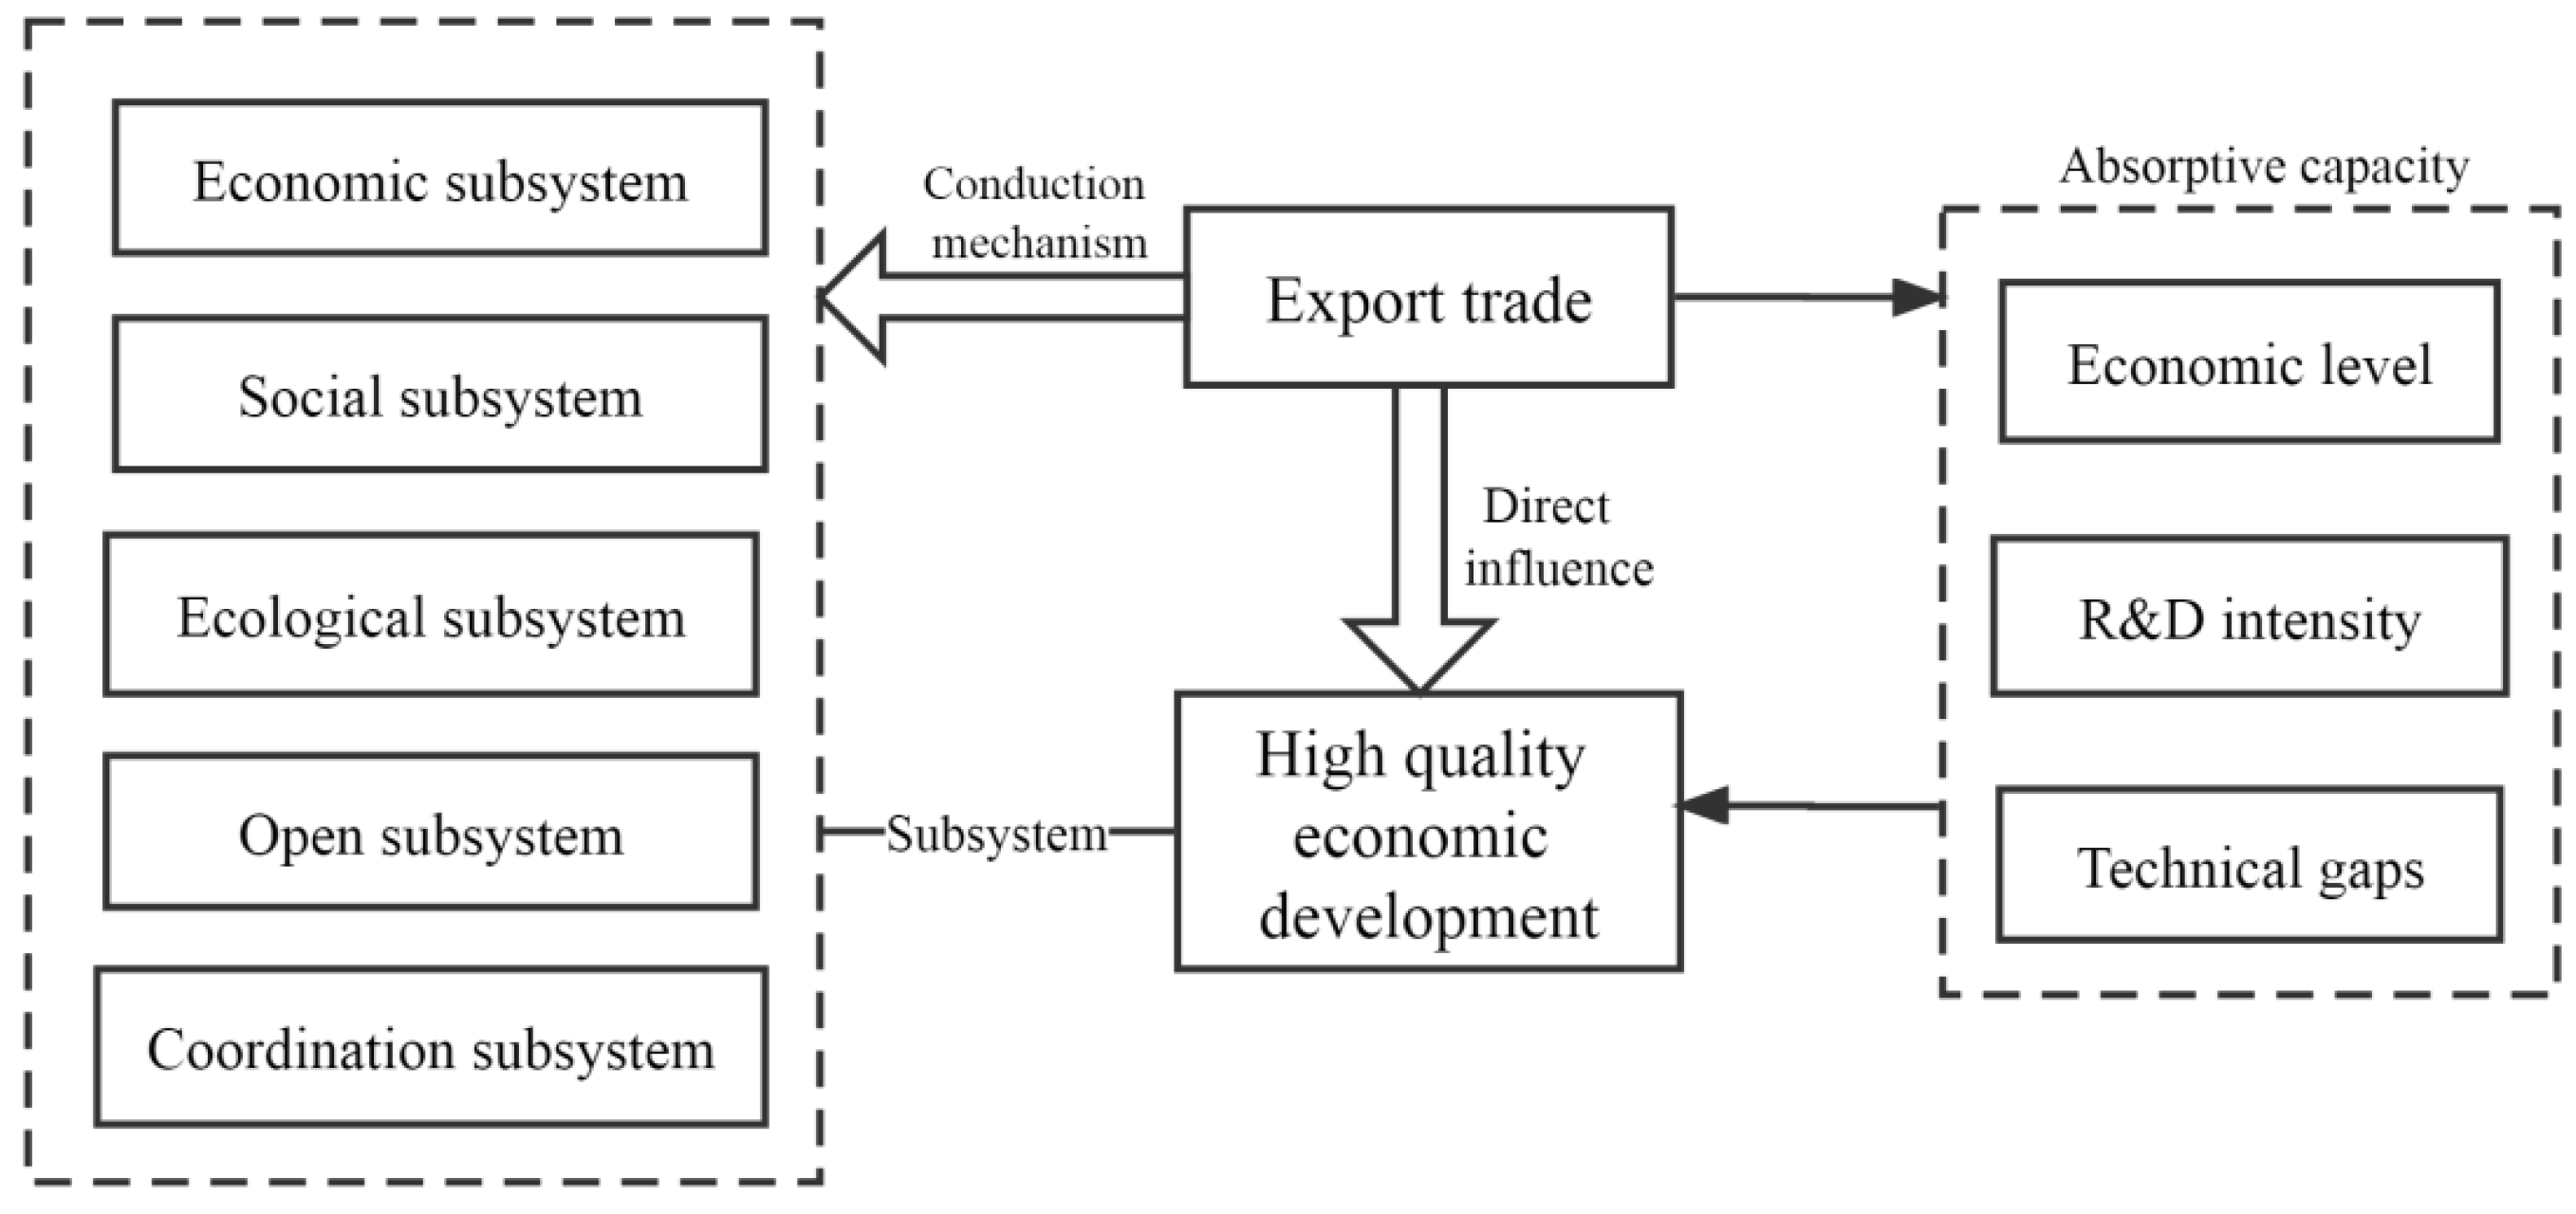
4.1. Theoretical Mechanism and Hypotheses

In this paper, we discuss the theoretical mechanism of the influence of the export trade on the high-quality economic development from the two aspects of direct and indirect effects, and we also analyze the export trade influence on the high-quality economic development from the perspective of the heterogeneity of the absorption capacity. We present the mechanism diagram in Figure 3.

4.1.1. Direct Impact of Export Trade on High-Quality Economic Development

The high-quality economic development is a comprehensive development index with multiple indicators. Its connotations include economic development, social progress, the ecological environment, the opening-up, and coordinated development. The impact of export trade on economic activity is also multifaceted. For example, free trade intensifies international competition [18]. By engaging with a number of advanced transnational enterprises in the process of foreign trade, foreign trade enterprises can gain a sharper perception of new innovative ideas and technologies, which is conducive to the improvement in their technological innovation abilities [19]. Moreover, the earnings from export trade provide financial support for technological innovation and upgrading [39]. Free trade also promotes the transition from an economy based on of the means of production of sectors with low productivities to one based on those of sectors with high productivities, which helps to optimize the allocation of resources and ameliorate the productivity of enterprises. At the same time, the overseas earnings obtained by foreign trade enterprises in the process of trade and export introduce more abundant R&D funds for enterprises, help them to move closer to emerging industries, and thereby give rise to the optimization and upgrading of their industrial structures, all of which have a positive impact on the high-quality economic development. Thus, we propose Hypothesis 1.
Hypothesis 1.
The growth of China’s export trade can substantially improve the high-quality economic development level.

4.1.2. Indirect Action Mechanism of Export Trade on High-Quality Economic Development

To clarify the specific impact path of the export trade on the high-quality economic development, we need to further explore the export trade impacts on the various high-quality-development subsystems.
(1)
The export trade impact on the economic subsystem. Because the economic subsystem involves multiple indicator dimensions, such as economic growth, innovation efficiency, and financial development, at the level of economic growth, exports cause the rapid expansion of the domestic market scale and the doubling of the income levels. Under the effect of economies of scale, the marginal cost of enterprise production tends to decrease, and the profit returns tend to increase. The increase in profits provides the financial support for enterprises to carry out technological innovation. From the angle of innovation efficiency, Melitz points out that trade allows more productive firms to enter international markets, while those that are less productive maintain their home markets [40]. As a result, export enterprises usually face competitors with high technology level in the international market [41]. The learning effect of export enterprises through learning by doing can significantly promote the innovation of local enterprises [42], the technology spillover effect is more significant after the absorption capacity is added [43]. Serti and Tomasi also point out that whether exports can bring productivity gains depends on the absorptive capacity of exporting firms [44]. In addition, facing fierce international competition in the international market, trade enterprises will actively seek to innovate and upgrade their production technology [45], and the trade competition will also result in the withdrawal of enterprises with low productivities. Export earnings are concentrated among the enterprises with high productivities, which will improve the productivity of the entire industry in the long term;
(2)
The export trade impact on the social subsystem. The social subsystem covers different dimensions, such as social progress, social equity, and social security. Here, social progress refers to the livelihood level of the people rather than to economic development and productivity, and export trade is more likely to have an impact on the latter. Moreover, social security and social equity are dominated by government departments, while social security is only a part of the social responsibility that enterprises should bear; thus, export trade may not have a substantial impact on the social subsystem;
(3)
The export trade impact on the ecological subsystem. The ecological subsystem covers not only the undesired environmental pollution, energy consumption, and other indicators, but also the environmental protection level, which has a positive impact on the ecological environment. Most researchers have confirmed that the opening-up of export trade will aggravate and intensify the environmental pollution in China. Some energy- and resource-based trading enterprises increase their exports at the cost of higher energy consumption, which is also detrimental to the improvement in China’s environmental quality. However, some scholars have concluded that export trade can promote the progress of the green innovation efficiency [46], thereby improving the environmental protection levels of enterprises. Therefore, under the dual effects of negative pollution intensification and positive environmental protection enhancement, export trade may not have a substantial impact on the ecological subsystem;
(4)
The export trade impact on the open subsystem. Export trade is an important part of China’s opening-up, and the adherence to the opening-up is an important premise for China’s economy in its achievement of 40 years of high-speed growth. A higher level of openness in the new era was the original intention of the high-quality economic development. The opening up of China promotes reform, development, and innovation, which, in turn, promotes high-quality economic development. Second, on the level of investment openness, some studies have pointed out that export trade mainly affects the investment behavior of transnational corporations through the exchange rate, which is because exports are the main source of national foreign exchange reserves, which, in turn, have a direct impact on the national exchange rate [47]. Therefore, exports indirectly affect the exchange rate level through the surplus or gap in foreign exchange reserves. The exchange rate is an important factor that affects transnational investment because the fluctuation in the exchange rate may increase the expected income and profit levels of transnational investors, and export trade may improve China’s foreign investment level through the exchange rate transmission mechanism [48]. Third, export trade can also promote the development of cross-border tourism through the “publicity effect” of export commodities [49]. The expansion of inbound tourism will not only bring economic income to China, but will also contribute to transnational cultural exchange and cooperation;
(5)
The export trade impact on the coordinate subsystem. Because the coordination subsystem involves income coordination [50], consumption coordination, and production coordination, export trade mainly influences the coordination subsystem through these channels by improving the labor remuneration and optimizing the industrial structure to promote high-quality development. According to the above theoretical mechanism, we propose Hypothesis 2.
Hypothesis 2.
Export trade promotes high-quality economic development through its considerable influence on the economic, open, and coordination subsystems.

4.1.3. Extended Research Hypothesis

The economic development level in a region depends not only on factors such as the factor endowment, technology level, and resource utilization efficiency, but also on the size of the regional absorption capacity. The regional absorption capacity refers to a region’s ability [51] to acquire, digest, and apply new external knowledge, technology, and experience. Because China has a vast territory, the economic development and absorptive capacity levels considerably vary among the regions; thus, the export trade impact on the high-quality economic development may vary depending on the regional absorptive capacity. We selected three variables to assess the absorptive capacity: the regional economic development level, R&D intensity, and technology gap. First, the higher the regional economic development level, the stronger the region’s ability to digest and absorb new products and technologies, and the faster the expansion of the new technologies in the entire industry, which provides a good basis for the technological innovations of export enterprises. According to the current situation of the foreign capital attraction to China, the greater the number of developed regions that attract foreign capital, the more foreign capital flows in, which not only expands the employment and improves the labor income of the investment place, but also contributes to its accumulation of advanced technologies [52]. At the same time, according to the “pollution halo hypothesis”3, foreign investment can have a direct positive impact on the ecological environment of the investment place, and this impact produces a competitive learning effect on the export enterprises in the same region [53]. Second, in terms of the R&D intensity, the potential of the enterprises in a region to digest, absorb, and transform new technologies is bound to its absorptive capacity. In the process of research and development, enterprises will reintegrate the production factors to reduce the production costs, improve the quality of the existing products, and develop new products through forward, backward, and technology-related effects, respectively, so as to improve the export trade structure and promote the optimization and upgrading of regional industries. At the same time, after decades of development, China’s trade enterprises are gradually eliminating the export disadvantage of the sole reliance on price competition and imitation development. R&D innovation is a vital means for trade enterprises to continuously open themselves up to the international market and maintain competitiveness, and it is also the only way for China’s enterprises to accelerate their transformation and upgrading, which will help China transition from a large trading country to a strong trading country. Finally, when the variable that characterizes the absorptive capacity is the technology gap, there is a positive relationship between the technology gap and technology spillover. The greater the gap between a country’s technology gap and international rating level, the greater the space [54] for new technology imitation, learning, and absorption. Nevertheless, some scholars have reached research conclusions that are contrary to the abovementioned results. They believe that the large technological gap makes it more difficult for backward-developing countries to digest and absorb new technologies, which is unfavorable to their diffusion and spillover [55]. The smaller technology gap enables foreign trade enterprises to efficiently identify potential learning and imitation opportunities, and to then transform them into internal knowledge and technology, thereby boosting the high-quality development of the local economy. Based on the above analysis, we propose Hypothesis 3.
Hypothesis 3.
The impact of the export trade on the high-quality economic development varies with the different regional absorptive capacities. Only when the absorptive capacity exceeds a certain degree can the export trade have a positive enhancement effect on the high-quality economic development.

4.2. Research Design

4.2.1. Model Settings

Linear Regression Model

In the second part of this paper, a brief analysis is made on the mechanism of export trade affecting high-quality economic development. In order to empirically test the correlation between export trade and high-quality economic development, it is necessary to construct a regression model for analysis. Previous studies have confirmed that export trade is linearly correlated with economic growth [56] and economic development quality [1], so this paper establishes a linear panel model to test the correlation among variables:
h q d i t = α + β 1 exp i t + δ m C V m i t + μ i + v t + ε i t
where i is the province; t is the year; hqdit is the high-quality economic development level of the explained variable; α and β1 are the regression estimation coefficient of the constant term and explanatory variable (trade exports (expit)), respectively; CVmit is m control variables; δm is its estimation coefficient; μi is the individual fixed effect; νt is the time fixed effect; εit is a random disturbance term.
The ordinary linear panel model can choose the mixed POOL estimation model and the individual effect model, which can be further divided into the fixed effect model and random effect model, among them, the difference between individuals with fixed effects is reflected in the fact that each individual has its own intercept term, while the random effect model assumes that the difference between individuals is random. The F-test was used to determine whether to adopt the mixed POOL model or the individual effect model. When the p-value of the F-test was less than 0.10, it indicated that there were significant individual differences between variables, and the individual effect model should be selected for regression. The Hausman test was used to select fixed effects and random effects [57]. When the p value of the Hausman test was less than 0.10, it indicated that the individual differences between variables were not random, and fixed effects should be used for regression analysis of the linear model.

4.2.2. Dynamic Panel Model

Since the ordinary linear panel model can only show the static correlation between variables, it does not consider the dynamic characteristics of economic variables. However, the growth of high-quality economic development level has a continuity and dynamic effect, Therefore, the one-period-lagged term of the explained variable is further added to Equation (1), and the dynamic panel model is used for estimation. This paper constructs the following dynamic panel model:
h q d i t = α + λ 0 h d q t 1 + β 1 exp i t + δ m C V m i t + μ i + v t + ε i t
In Formula (7), hqdit−1 is the lag term of the explained variable, λ0 is its regression estimation coefficient, and the other variables are the same as in Formula (6). Because the dynamic lag term of the explained variable is related to the individual effect in the component of the random error term, which leads to the endogeneity of the estimation, the generalized method of moments (GMM) proposed by Arellano and Bond can better solve the endogeneity problem in the dynamic panel model, and is usually regarded as the first choice for estimating the dynamic panel model [58]. The GMM estimation method includes difference GMM (DIF-GMM) and system GMM (SYS-GMM). In contrast, SYS-GMM adds a group of lagged difference variables as the instrumental variables of the corresponding variables in the level equation, eliminating the problem of weak instrumental variables in difference GMM. Therefore, the bias is smaller than that of DIF-GMM estimation [59].

4.2.3. Dynamic Panel Threshold Model

We used the linear regression model to test the simple linear relationship between the export trade and high-quality economic development. However, due to its geographical location, economic base, and other factors, there is a substantial imbalance in China’s regional economic development. The eastern, central, and western regions substantially differ in terms of their economic levels, R&D innovation, and other aspects, which has led to the heterogeneity of the absorption capacity of each region. Therefore, the export trade impacts on the high-quality economic development may also be different due to the different regional absorption capacities. Therefore, based on Hansen’s research [60], we constructed a dynamic panel threshold model to test the influence of the export trade on the high-quality economic development under different absorption capacities. Compared with the static panel threshold model, the dynamic panel threshold model can overcome the problem of missing variables and deal with the endogeneity of the model. We further extended Equation (7) to provide the corresponding dynamic panel threshold model:
h q d i t = α + λ 0 h q d i t 1 + β j 1 exp i t I T H j i t γ j 1 + β j 2 exp i t I T H j i t > γ j 1 + + β j n exp i t I T H j i t γ j n +   β j n + 1 exp i t I T H j i t > γ j n +   δ m C V m i t + μ i + ν t + ε i t
where α is a constant term; THjit represents j different threshold variables, including the economic development level (pgdp), R&D intensity (rd), and technology gap (tgap); βj1βjn represent the impact coefficient of the export trade on the high-quality economic development when different thresholds are taken under a certain absorptive capacity variable; γj1γjn represent the threshold values of n different levels under the jth threshold variable; I(·) represents the indicator function. The other parameter settings are the same as in Formula (6).
Because the dynamic panel threshold model contains the lag term of the explained variable, the model has an endogenous problem, and we can no longer apply the traditional estimation method of the static panel threshold model. In this study, we used the research methods of Caner [61] and Kremer [62] as the reference for the stepwise regression analysis on the dynamic panel threshold model. This estimation method is divided into three steps: first, we subjected all the variables in the panel threshold model to orthogonal deviation transformation using the forward orthogonal transformation method to eliminate the individual fix effects. Then, we performed linear regression on the variables in the model to obtain the simulation values of the lag terms of the explained variables. In the threshold regression model, we used the simulated value to replace the lag term of the explained variable, and we obtained the threshold value of the threshold variable by using the static panel threshold estimation method and tested the threshold effect. We then classified the samples according to the corresponding threshold interval, and we used the SYS-GMM method to conduct regression analyses on the different types of samples, obtaining the final empirical analysis results of the dynamic panel threshold model.

4.2.4. Variables and Data

The explained variable was the high-quality economic development (hqd) (see Section 2 of the article for the variable measurement methods). The explanatory variable was the export trade (exp), which we measured by the proportion of total export trade in GDP of each region according to the locations of the business units.
In terms of the threshold variable (TH), we measured the economic development level (pgdp) by the actual per capita GDP of each province. We measured the R&D intensity (rd) by the proportion of R&D expenditure in the GDP of each region: the greater the R&D intensity, the stronger the ability of the region to accept new technologies, and the stronger its promotion of regional innovation and development. We measured the technology gap (tgap) by the ratio of the average labor productivity of China’s regions to the average labor productivity of foreign countries, using Li and Liu’s [63] practices for reference. The labor productivity is the ratio of the actual GDP and number of employees measured in dollars in each region. The value of the technology gap is between 0 and 1: the larger the value, the higher the technical level, and the smaller the corresponding technology gap.
To reduce the possible deviation in the omission of the explanatory variables from the regression estimation results, and using the existing literature for reference [50], we set the control variables (X) in this study as follows: environmental regulation (er), which we measured by the proportion of regional investment in environmental pollution control in the GDP; government R&D investment (gov), which we measured by the per capita financial expenditure on science and technology; the education level (ey), which we represented by the average years of education (average years of education = (primary school × 6 + junior high school × 9 + high school × 12 + college degree or above × 16) ÷ total population aged 6 years and above); the domestic fixed capital investment (kr), which is characterized by the proportion of the difference between the total regional investment and foreign investment in the gross regional product; the population density (pd), which we measured by the population per unit area of each region and calculated by the resident population/the area of each region.
We selected the panel data of 30 provinces (autonomous regions and municipalities directly under the Central Government) in China from 2000 to 2019. Considering the unavailability of the data, we excluded Tibet, Hong Kong, Macao, and Taiwan, China. In this paper, except for the ratio variable, we deflated all the other monetary indicators with the year 2000 as the base period (see Table 2 for the descriptive statistics of the variables). We took the data used for the above variables from the “China Statistical Yearbook”, “China Science and Technology Statistical Yearbook”, “China Environmental Yearbook”, “New China Statistical Data Collection for 60 Years”, and wind database and statistical yearbooks of the various regions.

5. Empirical Results Analysis

5.1. Regression Estimation Results of the Linear Model

We present the estimation results of the static and dynamic linear regression models in Table 3. Models (1)–(3) are the ordinary least squares (OLS) and regression estimation results that controlled the fixed effects of the provinces and years, respectively. Model (4) is the estimation result that we obtained using the system GMM method. According to the Hausman test result of the fixed effect model in Table 3, the p-value is 0.0000, which indicated that it was reasonable for the selection of the fixed effect to regress the model. In the system GMM model, according to the Sargan test results, we cannot reject the original hypothesis that all the tool variables are valid. According to the AR (2) test results, there is no second-order autocorrelation, which indicates that the endogenous problem of the dynamic model can be overcome. According to the regression results of both the static and dynamic linear panel models, the regression coefficient of the export trade to the high-quality economic development is remarkably positive at the 1% level, which indicates that the export trade is one of the factors that accelerates the high-quality economic development in China. With the vigorous development of China’s export trade scale, enterprises can effectively improve the economic quality level through the R&D competition, learning, and productivity enhancement effects in the process of export trade [64]. On the other hand, export trade will bring external economic effect and factor productivity differential effect [65]. The former enables non-export enterprises to realize economic growth by imitating the mature management technology and advanced production technology of export enterprises, while the latter enables production resources to flow from inefficient non-export sectors to efficient export sectors and realize high-quality economic development through resource optimization allocation [66]. Nevertheless, to clarify the specific export trade impact path on the high-quality economic development, we need to further explore the impact of the export trade impact on the various high-quality development subsystems. We verify Hypothesis 1 here.
The regression coefficient of the lag term of the explained variable in Model (4) is substantially positive, which indicates that there has been a substantial “transfer effect” between the high-quality economic development of the current period and that of the previous period, and that the economic development achievements accumulated in the earlier period will form a virtuous circle and will have a positive enhancement effect on the high-quality economic development in the future.
According to the estimation results of the control variables, environmental regulation has no substantial impact on the high-quality economic development. The reason may be that, although pollution control investment is conducive to environmental improvement, higher pollution control investment corresponds to more serious environmental pollution, which results in no substantial environmental regulation impact on the high-quality development. The estimated coefficient of the government R&D input is positive in all four models, which indicates that the higher the per capita fiscal expenditure on science and technology, the better the improvement in the high-quality economic development level. The estimated coefficient of the education level is positive in all the models, which verifies the positive correlation between the education level and high-quality economic development. The estimated coefficient of the domestic fixed capital investment is positive only in Models (2) and (4), which means that fixed asset investment may promote high-quality economic development. The estimated coefficient of the population density is only positive in Models (1) and (4), and the positive estimated coefficient indicates that the population density is positively correlated with the high-quality economic development.

5.2. Test of Action Mechanism

We present the regression estimation results for each subsystem for the test of the specific mechanism of export trade that affects the level of high-quality economic development in Table 4. In the regression results of Table 4, Models (1)–(5) correspond to the empirical regression results of the economic, social, ecological, open, and coordination subsystems, respectively. The regression estimation coefficient of Model (1) is substantially positive, which indicates that the export trade has a positive promotional effect on the high-quality economic development through its substantial influence on the economic subsystem, which is because export trade can improve the technical level [67], stimulate innovation, and increase incomes [34] to promote high-quality development. The regression estimation coefficients of Model (2) and model (3) the effect of the export trade on the social and ecological subsystems were not substantial, which indicates that the export trade has not had a substantial impact on the social and ecological subsystems, which is because, here, the social subsystem focuses on social livelihoods rather than on economic development and productivity, while trade exports are more likely to have an impact on the latter. While the ecological subsystem covers undesirable indicators, such as environmental pollution and energy consumption, it also involves the environmental protection level, which has a positive impact on the ecological environment. Under the interaction of the negative pollution-intensification effect and positive environmental-protection-level enhancement effect, export trade has not had a substantial impact on the ecological subsystem. The regression estimation coefficient of Model (4) is substantially positive, which indicates that export trade plays a positive role in the facilitation of high-quality economic development through its effect on the open subsystem. On the one hand, the implementation of opening to the outside world can continuously improve labor productivity and achieve high-quality economic development by promoting the specialization of division of labor, promoting technological progress, accelerating the accumulation of human resources and institutional innovation [68], On the other hand, export mainly affects the investment behavior of transnational corporations through the influence of exchange rates. Because the fluctuation of exchange rate may improve the expected income and profit level of transnational investment subjects, export trade may help improve the level of China’s outbound investment through the exchange rate transmission mechanism, the entry of high-level foreign investment can not only provide China with a large amount of capital [69], but also lead to advanced technology and management experience, it will also increase employment and increase fiscal revenue [70], thereby boosting high-quality development. The estimated coefficient of Model (5) is also substantially positive, which indicates that the export trade plays a positive role in advancing high-quality economic development by substantially affecting the coordination subsystem. The expansion of the export trade scale increases the demand for domestic labor, which contributes to an increase in the labor remuneration through the influencing factors, such as the employment and wage levels [41]. At the same time, the production and export of products enable the factor endowments to flow among different countries, which not only helps individual countries to concentrate on developing advantageous industries, but also realizes the optimal allocation of the production resources to promote the upgrading of the national industrial development level. Export trade participants may take the initiative to improve the quality of their export products to effectively meet the high-end and diversified demands of the international market because of the competition incentive. In the long term, the industrial structure will be optimized and upgraded according to the export structure [20]. In conclusion, we verify Hypothesis 2 here.

5.3. Regression Estimation Results of Dynamic Panel Threshold Model

To further test whether the export trade impacts on the high-quality economic development level were different, owing to the different regional absorptive capacities, we used the dynamic panel threshold model for the empirical testing.

5.3.1. Threshold Effect Test

According to the threshold effect test results in Table 5, the economic level, R&D level, and technology gap, which represent the absorption capacity, all passed the single-threshold test, and all three were significant at the 1% level. The p-values of the double-threshold and triple-threshold models were greater than 0.100, which indicates that none of the three threshold variables passed the double-threshold or triple-threshold tests. The threshold values of the threshold variable economic levels, R&D intensity, and technology gap were 9.957, 1.160, and 0.084, respectively, which indicates that only when a region’s absorptive capacity exceeds its threshold value can the export trade substantially and positively promote high-quality economic development.

5.3.2. Analysis of Threshold Regression Results

In the estimation results of the dynamic panel threshold model in Table 6, the lag regression coefficients of the explained variables are substantially positive, which indicates that there has been a substantial “transfer effect” between the current high-quality economic development and that of the previous period. When the threshold variable that represents the absorption capacity was the economic level, the dynamic panel threshold value of 9.957 divided the observations into two intervals, with 290 observations in the low interval, and 250 observations in the high interval. When the logarithm of the economic level does not exceed the threshold value (9.957), the influence of the export trade on the high-quality economic development is not substantial. After the threshold is passed, the influence of the export trade on the high-quality economic development has a considerable positive effect. It indicates that foreign trade enterprises in regions with higher economic level have a stronger ability to digest and absorb new products and new technologies, and can realize the expansion of new technologies in the whole industry at a faster speed, which will provide a good foundation for technological innovation for export trade enterprises [71], and then have a significant positive impact on the level of high-quality economic development. When the threshold variable that represents the absorption capacity was the R&D intensity, the dynamic panel threshold value of 1.160 divided the observed values into two intervals, with 289 observed values in the low interval, and 251 observed values in the high interval. When the R&D intensity does not exceed the threshold value of 1.160, the influence of the export trade on the high-quality economic development level is negative. Once the threshold value is crossed, the influence of the export trade on the high-quality economic development level is substantially positive, which means that, in the regions with higher R&D intensities, the increase in export trade is more conducive to the promotion of high-quality economic development. This is because the higher the R&D absorption capacity of a region, the stronger its ability to digest, absorb, and transform new technologies, which strengthens the learning abilities of enterprises in the process of export trade, and is more likely to encourage foreign trade enterprises to continuously acquire advanced technologies and improve their production processes, as well as the quality of their management through secondary education, thereby improving the regional high-quality-development level [72]. When the threshold variable that represents the absorption capacity was the technology gap, the dynamic panel threshold value of 0.084 divided the observed values into two intervals, with 234 observed values in the low interval, and 306 observed values in the high interval. When the technology gap does not exceed the threshold value of 0.084, the influence of the export trade on the high-quality economic development is not substantial. Once the threshold value is crossed, the influence of the export trade on the high-quality economic development is substantially positive, which indicates that a large technological gap is not conducive to the absorption and adoption of new technologies by foreign trade enterprises, while in regions with small technological gaps, the increase in export trade is more conducive to the promotion of high-quality economic development [73]. Based on the above empirical results, we verify Hypothesis 3 here.

5.4. Robustness Test

To ensure the robustness and reliability of the empirical research results, we tested the empirical model from different perspectives. The test results are as follows.
To test the robustness of the empirical results by replacing the variables, we replaced the original explained-variable high-quality economic development index with the green total factor productivity4. We replaced the original expository variable, export trade, with the proportion of trade exports of domestic destinations and goods sources in the regional GDP, and we again conducted a robustness test on the relationship between the export trade and high-quality economic development. In the first two columns of Table 7, we adopted the fixed effects and systematic GMM methods to conduct the empirical analysis on the replaced variables. The results are consistent with those in Table 2. The influence of the export trade on the high-quality development was substantially positive, which indicates that the empirical results of the linear panel model in this study have a certain robustness.
Considering the possible endogenous problems of the explanatory variables and control variables involved in this study, in addition to the explained variables, we also treated the explanatory and control variables with one-stage lag. At the same time, because there may have been outliers in the data on the explanatory and explained variables, we shrink-tailed 1% and 99% of the values of the two, respectively, and we then conducted a regression analysis on the dynamic panel threshold model. We present the regression results in Columns 3–8 of Table 7. After we treated all the variables shown in the regression results with a lag of one period, the threshold variables representing the absorptive capacity—the economic level, R&D intensity, and technology gap—all showed substantial single-threshold effects. The results of the threshold regression results presented in Table 5 are consistent, indicating that the conclusions that we drew from the dynamic panel threshold model in this study are robust.

6. Conclusions, Countermeasures, and Suggestions

6.1. Conclusions

Based on the five development concepts of “innovation, coordination, green, openness and sharing”, in this study, we first constructed a comprehensive high-quality-development indicator system that includes 5 subsystems and 33 basic indicators to measure the high-quality development level of China’s interprovincial economy. Second, focusing on the theme of whether export trade can promote high-quality economic development, we empirically tested the export trade impact on the high-quality economic development as well as its mechanism by building a general linear panel model and dynamic panel threshold model. We empirically tested the effects of the export trade on the high-quality economic development as well as its mechanism of action, and we measured the absorptive capacity thresholds in the heterogeneous regions to obtain the specific influences of the different absorptive capacities on the relationship between the export trade and high-quality economic development. According to the results, (1) China’s export trade has substantially improved the high-quality economic development level; (2) in terms of the action path, export trade primarily affects the economic, opening, and coordination subsystems, having a positive promotional effect on the high-quality economic development; and (3) the heterogeneous absorptive capacity has a substantial impact on the improvement in the high-quality economic development. Only when the economic level, R&D intensity, and technological gap of a region all exceed the threshold value will the export trade substantially promote the improvement in the high-quality economic development level.
The research conclusion of this paper provides new empirical evidence for China to further expand the opening to the outside world while taking into account high-quality economic development, which has strong theoretical and policy significance.
Based on the above conclusions, the following countermeasures and suggestions are proposed:

6.2. Countermeasures and Suggestions

First, China needs to continue to expand its share of trade and increase the scale of its exports. Quantitative change is the premise and foundation of qualitative change. Local governments should encourage more enterprises to actively participate in international trade. By merely remaining in a state of openness, enterprises can gradually integrate with the world. The absorption and learning of advanced international experiences and technologies can force domestic enterprises to achieve transformation and upgrading. China should provide greater policy and financial support to help enterprises carry out green technology R&D and innovation, and especially the low-carbon industries with high added value.
Second, we need to move from a large export trade country to a strong export trade country, as well as drive high-quality development by opening up at the highest level. As mentioned above, qualitative change is the inevitable result of quantitative change. Based on the consolidation of the trade scale, we should further improve the export quality and optimize the trade structure. In line with the strategic deployment of the dual circulation of domestic and foreign markets, we need to optimize the international market layout and trade and export structure, coordinate scientific and technological innovation in the field of foreign trade with the high-quality development of the domestic market, strengthen domestic and international cooperation in the high-tech-industry chain, achieve the optimal resource allocation worldwide, further improve the level of the value and industry chains, and help the domestic industry to climb to the middle–high end to open China up to the outside world to a greater degree to enhance its high-quality economic development. At the same time, we should learn from the experiences of developed countries, develop a new innovation system that combines science and technology with finance, encourage the flow of R&D capital to original innovation areas, and strive to achieve more technological breakthroughs.
Third, absorbing capacity is the foundation of innovative learning of trade enterprises, which plays a key role in technology spillovers and high-quality development. The lack of absorptive capacity greatly reduces the innovative output of enterprises. Thus, all regions should pay attention to improving the ability of enterprises to absorb, transform, and use external knowledge. On the one hand, increasing R&D investment is the most direct way to improve the absorptive capacity of enterprises, which should include the investment in human capital of enterprises. It is essential to actively introduce new high-level talents and strengthen the skill training of existing talents. On the other hand, the internal organizational management structure and corporate culture of trade enterprises also have a great impact on the improvement of absorptive capacity, which requires the formation of a good organizational learning atmosphere within the enterprise, focusing on cultivating and improving employees’ ability to acquire, digest and absorb new ideas and knowledge. At the same time, in terms of the innovation environment, local governments should increase support for innovation policies, strengthen the construction of supporting infrastructure, actively guide the exchange and learning of knowledge and technology in the region, encourage foreign trade enterprises, universities and scientific research institutions to conduct technical exchanges and cooperative innovation, and create a good pattern of innovation and opening up for science and technology innovation subjects.

6.3. Research Deficiencies and Future Prospects

This paper provides some references and draws some meaningful conclusions for the impact of export trade on the high-quality development of China’s economy through empirical analysis. However, how to measure the index of high-quality economic development scientifically and accurately has always been a difficulty in existing research, which is also the main reason why many empirical researches have not reached consistent results. Therefore, in the future, we will continue to devote ourselves to solving the above problems and find scientific measurement methods to measure the high-quality economic development more accurately. In addition, in future studies, we will take micro enterprises as the basis to study the impact of export trade at the enterprise level on the high-quality development of China’s economy, so that the research conclusions of this paper can be supported by micro evidence.

Author Contributions

H.L.: Review and Editing & methodology. X.Q.: supervision & software & funding acquisition. All authors have read and agreed to the published version of the manuscript.

Funding

This work was sponsored in part by Chinese Ministry of Education Philosophy and Social Science Research Major Project Fund (18JZD035), Social Science Foundation of Shaanxi Province (2021D054, 2021D053), Social Science Foundation of Shaanxi province Department of Education (2022HZ1118), China Statistical Science Research Project (2022LY061), Fundamental Research Funds of Xi’an Jiaotong University (Special Project of the 20th National Congress of the CPC) (SK2022133).

Institutional Review Board Statement

Not applicable.

Informed Consent Statement

Not applicable.

Data Availability Statement

Not applicable.

Conflicts of Interest

The authors declare no conflict of interest.

Notes

1
Considering the availability of data, the Tibet, Hong Kong, Macao and Taiwan in China were excluded, and the interpolation method or analogy method is used to estimate the missing data.
2
Here, the rationalization index of industrial structure is constructed based on the Thiel index, and the calculation formula is: T I = i = 1 n Y i Y ln Y i L i / Y L . where Yi is the output of industry i in a region, Y is the total output of all industries in a region, Li is the number of employees in industry i in a region, and L is the total number of employees in all industries in a region, TI is between [0, 1], the smaller the value is, the more reasonable the industrial structure is; otherwise, the more unreasonable it is.
3
“Pollution Haven Hypothesis” holds that the inflow of foreign capital may also bring “dirty technology” to the destination of investment, thus worsening the environmental pollution of the host country. Therefore, the impact of foreign capital inflow on a country’s environmental pollution needs to be further verified.
4
Here, the global super-efficiency EBM model defines the directional distance function and sets it as non-oriented and variable return to scale. Combined with the global Malmquist index, the green total factor productivity of each Chinese provincial level is measured. The input indicators include: human capital, which is measured by the number of employment in three industries in each province; capital stock, the data of fixed capital investment flow is adjusted by the fixed asset price index, the price factor is removed, the accumulated depreciation is subtracted, and the actual fixed capital stock is calculated by the perpetual inventory method; energy consumption, measured by the total energy consumption of each province. Output indicators include desired output, measured by actual provincial GDP, and undesired output, which includes sulfur dioxide emissions and wastewater emissions by provinces.

References

  1. Zhang, J.; Li, Y.; Liu, Z. Does export promote the productivity of Chinese enterprises—Empirical evidence from Chinese local manufacturing enterprises: 1999~2003. Manag. World 2009, 12, 11–26. [Google Scholar]
  2. Gao, P.; Du, C.; Liu, X.; Yuan, F.; Tang, D. Construction of Modern Economic System Under the Background of High-quality Development: A logical framework. Econ. Res. J. 2019, 54, 4–17. [Google Scholar]
  3. Zhang, C.; Kong, J. Effect of Equity in Education on the Quality of Economic Growth: Evidence from China. Int. J. Hum. Sci. 2010, 7, 47–69. [Google Scholar]
  4. Mei, L.; Chen, Z. The Convergence Analysis of Regional Growth Differences in China: The Perspective of the Quality of Economic Growth. J. Serv. Sci. Manag. 2016, 9, 453–476. [Google Scholar] [CrossRef] [Green Version]
  5. Thomas, V.; Dailami, M.; Mansoor, D.; Dhareshear, A.; Kaufmann, D.; Kishor, N.; Lopez, R.; Wang, Y. The Quality of Growth; Oxford University Press: Oxford, UK, 2000. [Google Scholar]
  6. Barro, R.J. Quantity and Quality of Economic Growth. Chil. Econ. 2002, 5, 17–36. [Google Scholar]
  7. Li, M.; Ren, B. Comprehensive evaluation of China’s high-quality development in the new era and its path choice. Financ. Sci. 2019, 5, 21–32. [Google Scholar]
  8. Jin, B. Economic Research on “High Quality Development”. China’s Ind. Econ. 2018, 4, 5–18. [Google Scholar]
  9. Chen, S.Y.; Chen, D.K. Haze pollution, Government control and high-quality economic development. Econ. Res. 2018, 2, 22–34. [Google Scholar]
  10. Yu, Y.Z.; Yang, X.Z.; Zhang, S.H. Research on the time-space Transformation Characteristics of China’s Economy from high-speed growth to high-quality development. Res. Quant. Econ. Tech. Econ. 2019, 6, 3–21. [Google Scholar]
  11. Wang, G.J.; Zhang, H.; Jin, T.L. The driving force of China’s economic quality development: Structural adjustment or technological progress. Economist 2020, 6, 59–67. [Google Scholar]
  12. Wei, M.; Li, S. Research on the Measurement of the High Quality Development Level of China’s Economy in the New Era. Res. Quant. Econ. Tech. Econ. 2018, 35, 3–20. [Google Scholar]
  13. Jian, X.; Nie, C. Measurement of China’s high-quality development: 1978–2018. Economist 2020, 8, 49–58. [Google Scholar]
  14. Liu, Y.X.; Tian, C.S.; Cheng, L.Y. Measurement and Comparison of the High Quality Development Level of the World Economy. Economist 2020, 5, 69–78. [Google Scholar]
  15. Krugman, P. Increasing returns, monopolistic competition and international trade. J. Int. Econ. 1979, 9, 469–479. [Google Scholar] [CrossRef]
  16. Feder, G. On export and economic growth. J. Dev. Econ. 1983, 12, 59–73. [Google Scholar] [CrossRef]
  17. Grossman, G.; Krueger, A. Environmental Impacts of a North American Free Trade Agreement. NBER Work. Pap. 1991, No.3914. [Google Scholar]
  18. Coe, D.; Helpman, E. International R&D spillover. Eur. Econ. Rev. 1995, 39, 859–887. [Google Scholar]
  19. Li, J.; Tang, Y. Trade Opening, FDI and Total Factor Productivity. Macroecon. Res. 2019, 9, 67–79. [Google Scholar]
  20. Luo, C.; Zhang, Z. Complementarity of export and R&D activities and its impact on productivity—Evidence from Chinese listed enterprises. Res. Quant. Econ. Technol. Econ. 2020, 7, 134–154. [Google Scholar]
  21. Ye, X.; Chen, D.; Liu, R. The impact of bonded zones and export processing zones on regional total factor productivity: An empirical study based on the double difference method. J. Cent. Univ. Financ. Econ. 2021, 1, 119–128. [Google Scholar]
  22. Lin, B.; Liu, H. Whether foreign trade is conducive to improving energy and environmental efficiency—Taking China’s industrial sector as an example. Econ. Res. 2015, 50, 127–141. [Google Scholar]
  23. Wang, S.; Wang, X.; Hu, Z. Research on the green productivity effect of service export trade: Empirical analysis based on industry breakdown data of nine developing economies. World Econ. Res. 2019, 7, 29–42. [Google Scholar]
  24. Wang, L.; Song, J.; Yan, M. Export trade and industrial green efficiency improvement. Ind. Technol. Econ. 2020, 39, 144–151. [Google Scholar]
  25. Qi, S.; Xu, J. The impact of trade openness on green total factor productivity of countries along the “the Belt and Road”. China’s Popul. Resour. Environ. 2018, 28, 134–144. [Google Scholar]
  26. Liu, Y. Will International Trade Deteriorate Total Factor Energy Efficiency? -- An Empirical Analysis Based on China’s 33 Industrial Industries, China’s Population. Resour. Environ. 2018, 28, 20–29. [Google Scholar]
  27. Yang, S.; Han, X.; Song, W. Does foreign direct investment affect China’s green total factor productivity? J. Shanxi Univ. Financ. Econ. 2017, 39, 14–26. [Google Scholar]
  28. Mzaumdar, J. Do static gains from trade lead to medium-run growth. J. Political Econ. 1996, 104, 1328–1337. [Google Scholar] [CrossRef]
  29. Memedovic, O. Inserting Local Industries into Global Value Chains and Global Production Networks; UNIDO Working Paper: Vienna, Austria, 2004. [Google Scholar]
  30. Cai, H.Y.; Xu, Y.Z. Does the trade opening affect the upgrading of China’s industrial structure? Research on Quantitative Economy. Tech. Econ. 2017, 34, 3–22. [Google Scholar]
  31. Yang, D.; Yang, L. Foreign Trade, Technological Progress and Industrial Structure Upgrading: Experience. Mechanism and Demonstration. Manag. World 2016, 11, 172–173. [Google Scholar]
  32. Bu, W.; Yang, Y.; Chi, S. Research on the Impact of China’s Foreign Trade Commodity Structure on the Upgrading of Industrial Structure. Macroecon. Res. 2019, 8, 55–70. [Google Scholar]
  33. Luo, N.; Jiang, Y. The Impact of Local government competition and opening to the Outside World on environmental pollution: A case study of 270 cities in China. Urban Probl. 2017, 12, 46–55. [Google Scholar]
  34. Wang, A.; Fang, Y. Reorientation of the development of China Pilot Free Trade Zone from the perspective of double-cycle new development pattern: And on the reform path of China’s free trade Zone with high-quality economic development. Mod. Econ. Res. 2021, 11, 37–48. [Google Scholar]
  35. Sun, L.J.; Xing, X.J.; Zhou, D.Q. Improvement of Entropy Weighting Method. Stat. Decis. Mak. 2010, 21, 153–154. [Google Scholar]
  36. Hu, X.P.; Xu, P. Research on the impact of FDI quality characteristics on China’s high-quality economic development. Int. Trade Issues 2020, 10, 31–50. [Google Scholar]
  37. Guo, Y.; Fan, B.; Long, J. Research on the practical Measurement of high-quality Regional Development and its Spatio-temporal evolution. J. Quant. Tech. Econ. 2020, 37, 118–132. [Google Scholar]
  38. Zou, Y.; Tang, L. Statistical Measurement of China’s High Quality Industrial Development Level. Stat. Decis. Mak. 2021, 37, 95–98. [Google Scholar]
  39. Keller, W. International Trade, Foreign Direct Investment, and Technology Spillovers. NBER Work. Pap. 2009, No. w15442. [Google Scholar]
  40. Melitz, M.J. The impact of trade on intra-industry re-allocations and aggregate industry productivity. Econometrica 2003, 71, 1695–1725. [Google Scholar] [CrossRef] [Green Version]
  41. Wang, Q.; Zhu, Y.; Wang, Y. Can export trade increase innovation output?—Based on the empirical analysis of China’s micro enterprises. J. Beijing Technol. Bus. Univ. 2016, 31, 41–52. [Google Scholar]
  42. Zhang, H.; Zhang, M. Learning effect of Chinese enterprises’ export trade -- based on the perspective of capacity utilization. J. Shanxi Univ. Financ. Econ. 2019, 41, 77–92. [Google Scholar]
  43. Liu, X.H.; Buck, T. Innovation performance and channels for international technology spillovers: Evidence from Chinese high-tech industries. Res. Policy 2007, 36, 355–366. [Google Scholar] [CrossRef]
  44. Serti, F.; Tomasi, C. Self-selection and post-entry effects of exports: Evidence from Italian manufacturing firms. Rev. World Econ. 2008, 144, 660–694. [Google Scholar] [CrossRef]
  45. Salomon, R.M.; Shaver, J.M. Learning by exporting:new insights from examining firm innovation. J. Econ. Manag. Strategy 2005, 14, 431–460. [Google Scholar] [CrossRef]
  46. Wang, H.; Bian, Y.-J.; Wang, S.-Q.; Li, X.-C. Geographical endowment, foreign trade and industrial technological innovation efficiency—Empirical analysis based on panel quantiles. Manag. Rev. 2017, 3, 40–48. [Google Scholar]
  47. Nie, F.; Liu, H. Interactive Mechanism of China’s IFDI, OFDI and Export Trade—An Empirical Test Based on Transnational Panel Data. Int. Econ. Trade Explor. 2018, 34, 68–84. [Google Scholar]
  48. Chakrabrti, R.; Scholnick, B. Exchange Rate Expectations and Foreign Direct Investment Flow. Weltwirtschaftliches Archiv. 2002, 1, 1–21. [Google Scholar] [CrossRef]
  49. Sun, G. Advantages of a Big Country and the High Speed and Sustainable Growth of China’s Tourism Industry. Tour. J. 2008, 4, 29–34. [Google Scholar]
  50. Wang, Y.; Wu, G. Trade liberalization and China’s urban-rural income gap: An empirical study based on prefecture level urban panel data. Int. Trade Issues 2019, 4, 64–75. [Google Scholar]
  51. Cohen, W.; Levinthai, D. Absorptive capacity: A new perspective on learning and innovation. Adm. Sci. Q. 1990, 35, 128–152. [Google Scholar] [CrossRef]
  52. Bai, Y.; Qian, Q.; Jiao, J.; Li, L.; Li, F.; Yang, R. Can environmental innovation benefit from outward foreign direct investment to developed countries? Evidence from Chinese manufacturing enterprises. Environ. Sci. Pollut. Res. 2020, 27, 13790–13808. [Google Scholar] [CrossRef]
  53. Chen, Y.; Yang, Z. Foreign Investment in Manufacturing Industry and Fluctuation of Market Power: Competition or Monopoly. China Ind. Econ. 2012, 10, 52–64. [Google Scholar]
  54. Wang, J.; Blomstrom, M. Foreign Investment and Technology Transfer:A Simple Mode. Eur. Econ. Rev. 1992, 36, 137–155. [Google Scholar] [CrossRef]
  55. Glass, A.; Saggi, K. International Technology Transfer and the Technology Gap. J. Dev. Econ. 1998, 55, 369–398. [Google Scholar] [CrossRef]
  56. Xu, G.; Song, D. Empirical Study on the Relationship between China’s Export Trade, Economic Growth and Carbon Emission. Int. Trade Issues 2010, 1, 74–79. [Google Scholar]
  57. Hausman, J.A. Specification tests in econometrics. Econometrica 1978, 46, 1251–1271. [Google Scholar] [CrossRef] [Green Version]
  58. Arellano, M.; Bond, S. Some Tests of Specification for Panel Data: Monte Carlo Evidence and an Application to Empolyment Equations. Rev. Econ. Stud. 1991, 58, 277–297. [Google Scholar] [CrossRef] [Green Version]
  59. Chen, C.F. Industrial green total factor productivity and its influencing factors in China: An empirical study based on ML productivity index and dynamic panel model. Stat. Res. 2016, 33, 53–62. [Google Scholar]
  60. Hansen, B. Sample Splitting and Threshold Estimation. Econometrica 2000, 68, 575–603. [Google Scholar] [CrossRef] [Green Version]
  61. Caner, M.; Hansen, B.E. Instrumental variable estimation of a threshold model. Econom. Theory 2004, 20, 813–843. [Google Scholar] [CrossRef]
  62. Kremer, S.; Bick, A.; Nautz, D. Inflation and growth: New evidence from a dynamic panel threshold analysis. Empir. Econ. 2013, 44, 861–878. [Google Scholar] [CrossRef] [Green Version]
  63. Li, M.; Liu, S. Regional differences and threshold effects of reverse technology spillovers of foreign direct investment -- threshold regression analysis based on China’s inter-provincial panel data. Manag. World 2012, 1, 21–32. [Google Scholar]
  64. Amiti, M.; Konings, J. Trade Liberalization, Intermediate Inputs and Productivity: Evidence from Indonesia. Am. Econ. Rev. 2007, 97, 1611–1638. [Google Scholar] [CrossRef]
  65. Kneller, R.; Pisu, M. Industrial Linkages and Export Spillovers from FDI. World Econ. 2007, 30, 105–134. [Google Scholar] [CrossRef]
  66. Wang, Y.; Liu, S. Empirical Study on International Technology Spillover Channels. Res. Quant. Econ. Technol. Econ. 2008, 4, 153–161. [Google Scholar]
  67. Han, F.; Zhuang, Z. Domestic Big Market, Artificial Intelligence Application and Manufacturing Export Domestic Added Value. World Econ. Res. 2022, 33–47. [Google Scholar]
  68. Foster, B.P.; Balassa, T.; Benen, T.D. Extracellular vesicles in blood, milk and body fluids of the female and male urogenital tract and with special regard to reproduction. Crit. Rev. Clin. Lab. Sci. 2017, 6, 53–59. [Google Scholar] [CrossRef]
  69. Wen, D. FDI, Export Opening and provincial Industrial Growth in China. J. Financ. Res. 2003, 6, 104–114. [Google Scholar]
  70. Xie, T.; Li, Y.; Pan, Y. Foreign Direct Investment, technological progress and Industrial structure upgrading: Based on the spatial econometric analysis of China’s provinces. Ind. Technol. Econ. 2018, 37, 35–43. [Google Scholar]
  71. He, X.; Ou, Y.; Shi, W. FDI technology spillover and the threshold of China’s absorptive capacity. World Econ. 2014, 10, 52–76. [Google Scholar]
  72. Qian, X.; Wang, J.; Huang, Y.; Wang, S. Exports and the productivity of Chinese industrial enterprises – self selection effect or export learning effect? Quant. Econ. Tech. Econ. Res. 2011, 28, 37–51. [Google Scholar]
  73. Ge, X.; Chen, L. The technological progress effect of international R&D spillovers: An empirical study based on absorptive capacity. Quant. Econ. Tech. Econ. Res. 2009, 26, 86–98. [Google Scholar]
Figure 1. Comprehensive scores of China’s high-quality economic development in 2019.
Systems 11 00054 g001
Figure 2. Trend distribution of China’s high-quality economic development subsystems in 2019.
Systems 11 00054 g002
Figure 3. Mechanism diagram of influence of export trade on high-quality economic development.
Systems 11 00054 g003
Table 1. China’s high-quality economic development system.
SubsystemSubindicatorBasic IndicatorMeasurement MethodSign
EconomicsEconomic
growth
GDP growth rate per capitaReal GDP growth rate per capita+
Innovation
efficiency
Number of authorized invention patent applicationsNumber of authorized invention patent applications/total population of region (piece)+
Proportion of output value of high-tech enterprisesOutput value of high-tech enterprises/total regional output value (%)+
Total factor productivityAnnual average growth rate of total factor productivity+
Financial
efficiency
Deposit balance per unit GDPBalance of financial institution deposits at end of year/regional GDP (%)+
Loan balance per unit GDPBalance of financial institution loans at end of year/regional GDP (%)+
Market developmentMarketization degreeMarketization index+
SocietySocial progressInternet penetrationNumber of Internet users/total resident population (%)+
Educational expenditureTotal expenditure on education/regional GDP (%)+
Registered urban unemployment rateUnemployed/sum of employees and unemployed (%)
Social equityEngel coefficient of urban householdsFood, tobacco, and alcohol expenditure/total consumption expenditure of urban residents
Engel coefficient of rural householdsFood, tobacco, and alcohol expenditure/total consumption expenditure of rural residents
Social
security
Participation rate for medical insuranceNumber of medical insurance participants/total number of employees (%)+
Participation rate for endowment insuranceNumber of pension insurance participants/total number of employees (%)+
EcologyEnvironmental
pollution
Exhaust gas emissions per unit GDPSulfur dioxide emissions/regional GDP (ton/CNY 10,000)
Wastewater discharge per unit GDPWastewater discharge/regional GDP (ton/CNY 10,000)
Carbon emission intensityCarbon emissions/regional GDP (ton/CNY 10000)
PM2.5Mean value of PM2.5 concentration in different regions (mg/m3)
Environmental
protection
level
Utilization rate of solid wasteUtilization amount of solid waste/generation amount of solid waste (%)+
Domestic garbage removal rateDomestic waste clearing and transportation volume/domestic waste generation volume (%)+
Urban sewage treatment rateUrban sewage treatment capacity/total sewage discharge (%)+
Number of public toilets per capitaTotal number of public toilets/total population of region (seats/10,000 people)+
Energy
resources
Energy intensity per unit GDPTotal energy consumption/regional GDP (ton/CNY 10,000)
Forest coverageForest coverage (%)+
Opening
up
Open tradeTotal imports per unit GDPTotal imports/regional gross output value (%)+
Investment
openness
Actual utilized foreign capital per unit GDPActual utilized foreign capital/regional gross output value (%)+
Tourism
openness
Proportion of overseas tourism incomeOverseas tourism income/regional total output value (%)+
Coordi-
nation
Revenue
coordination
Urban–rural income gapUrban residents’ disposable income/rural residents’ disposable income
Proportion of labor remuneration in GDPLabor remuneration/regional gross output value (%)+
Consumption coordinationUrban–rural consumption gapConsumption of urban residents/consumption of rural residents
CPIReal consumer price index
Production coordinationRational production structureCalculation based on Thiel index2
Livelihood coordinationUrbanization rateUrban population/total regional population (%)+
Table 2. Descriptive statistics of variables.
VariableVariable NameVariable SymbolMean ValueStandard DeviationMinimum ValueMaximum Value
Explained variablesHigh-quality economic developmenthqd0.3010.14090.08520.812
Explanatory variablesExport tradeexp15.68918.2680.68098.90
Control variablesEnvironmental regulationer1.2880.6600.2894.230
Government R&D investmentlngov3.9561.6150.9047.589
Education levellnh2.1370.1271.6932.548
Domestic national capital investmentkr5.9892.5901.79914.70
Population densitylnpd5.4271.2631.9468.251
Threshold variablesEconomic development levellnpgdp9.8500.7717.88711.815
R&D intensityrd1.3881.1360.1407.410
Technical gaptgap0.1020.0730.0130.407
Table 3. Test results of linear regression model.
Variable(1)(2)(3)(4)
OLSFEFESYS-GMM
exp0.340 ***
(7.392)
0.223 ***
(5.031)
0.224 ***
(4.676)
0.115 ***
(11.512)
er0.308
(0.241)
−0.359
(−1.220)
0.177
(0.579)
−0.699 ***
(−2.581)
lngov46.016 ***
(3.209)
1.037 ***
(4.202)
2.823 ***
(3.564)
0.055 *
(1.943)
lnh2.561 ***
(6.672)
27.252 ***
(8.783)
12.912 **
(2.230)
15.109 ***
(18.222)
kr0.796
(1.034)
0.301 **
(2.064)
0.133
(0.796)
0.323 ***
(9.040)
lnpd39.563 ***
(3.291)
1.018
(0.249)
−2.405
(−0.586)
3.052 ***
(4.767)
hqdt-1 0.408 ***
(22.068)
Constant−68.678 ***
(−2.773)
−42.587 *
(−1.937)
−2.715
(−0.092)
−33.504 ***
(−9.984)
Hausman 110.20 ***73.46 ***
Sargan0.766
(0.910)
28.179
(1.000)
AR(1) −3.373 ***
(0.001)
AR(2) 0.011
(0.991)
Adj-R20.8490.7470.826
Observed value600600600570
Note: T-values are shown in parentheses. ***, **, and * represent 1%, 5%, and 10% significance coefficient tests, respectively.
Table 4. Test results of action mechanism.
Variable(1)(2)(3)(4)(5)
EconomicSocialEcologicalOpening-UpCoordination
exp0.025 ***
(3.005)
0.010
(1.100)
0.005
(0.737)
0.027 **
(2.742)
0.026 ***
(4.607)
Constants7.111 *
(1.650)
3.222
(0.587)
3.072
(0.401)
−4.444
(−0.691)
−14.969 ***
(−2.891)
Control variableYesYesYesYesYes
Hausman test54.40 ***82.04 ***175.11 ***54.45 ***39.43 ***
Individual effectYesYesYesYesYes
Time effectYesYesYesYesYes
Adj-R20.4240.5730.4210.4210.743
Observations600600600600600
Note: T-values are shown in parentheses. ***, **, and * represent 1%, 5%, and 10% significance coefficient tests, respectively.
Table 5. Threshold effect test results.
Threshold VariableThreshold NumberF-Valuep-ValueThreshold
Value
Confidence IntervalBS Time
Economic levelSingle threshold56.01 ***0.0009.9579.9559.959500
Double threshold20.120.21310.32910.31810.330500
Triple threshold13.340.58710.90410.84410.905500
R&D intensitySingle threshold139.75 ***0.0001.1601.1201.170500
Double threshold16.400.1772.0301.8152.040500
Triple threshold14.620.5502.8302.7502.890500
Technical gapSingle threshold68.45 ***0.0000.0840.0800.084500
Double threshold29.290.1070.0520.0510.056500
Triple threshold30.760.1130.1750.1720.177500
Note: *** represent 1% significance coefficient tests, respectively.
Table 6. Test results of dynamic panel threshold model based on absorption capacity.
VariableEconomic LevelR&D DensityTechnical Gap
lnpgdpγ1lnpgdp > γ1rdγ2rd > γ2tgapγ3tgap > γ3
hqdt−10.164 ***
(5.984)
0.337 ***
(17.209)
0.188 ***
(6.902)
0.304 ***
(5.738)
0.152 ***
(7.030)
0.335 ***
(19.790)
exp−0.006
(−0.710)
0.017 ***
(4.262)
−0.068 **
(−2.281)
0.018 **
(2.425)
0.008
(0.031)
0.024 ***
(3.435)
Constant−0.738 **
(−2.393)
−0.710 ***
(−13.616)
−0.253
(−0.699)
−0.648 ***
(−3.786)
−1.772 ***
(−3.815)
−0.636 ***
(−4.096)
Control variableYesYesYesYesYesYes
Sargan test25.774
(1.000)
21.357
(1.000)
23.616
(1.000)
17.355
(1.000)
25.889
(1.000)
22.004
(1.000)
AR(1)−2.822 ***
(0.005)
−2.343 **
(0.019)
−2.857 ***
(0.004)
−2.399 **
(0.016)
−3.322 ***
(0.001)
−2.668 ***
0.008
AR(2)−0.959
(0.338)
0.072
(0.942)
−0.973
(0.331)
−0.243
(0.808)
−0.137
(0.891)
0.127
(0.899)
Observations290250289251234306
Note: T-values are shown in parentheses. ***, and ** represent 1% and 5% significance coefficient tests, respectively.
Table 7. Robustness test.
VariableLinear RegressionEconomic LevelR&D IntensityTechnical Gap
FeSYS-GMMlnpgdpγ1lnpgdp > γ1rdγ2rd > γ2tgapγ3tgap > γ3
hqdt−1 0.862 ***
(37.264)
hqdt−2 0.023
(0.910)
0.478 ***
(17.340)
0.237 ***
(7.508)
0.333 ***
(3.688)
0.176 ***
(7.773)
0.390 ***
(28.435)
exp0.040 ***
(2.792)
0.049 ***
(43.712)
0.156 ***
(6.129)
0.260 **
(2.278)
0.015
(1.036)
0.036 *
(1.716)
0.016
(1.463)
0.025 ***
(3.033)
Constant−12.173
(−1.148)
−20.561 ***
(−17.120)
−6.363 ***
(−8.774)
−0.540 ***
(−3.278)
−0.887 ***
(−4.581)
−0.459
(−1.309)
−0.998 ***
(−2.773)
−0.557 ***
(−5.025)
Control variablesYesYesYesYesYesYesYesYes
Sargan 28.294
(1.000)
18.629
(0.9474)
21.055
(1.000)
19.641
(1.000)
12.499
(1.000)
24.310
(1.000)
21.764
(1.000)
AR(1) −2.356 **
(0.019)
−2.505 **
(0.013)
−3.056 ***
(0.002)
−3.394 ***
(0.000)
−2.592 **
(0.011)
−3.412 ***
(0.001)
−2.327
(0.020)
AR(2) −0.673
(0.501)
−0.840
(0.400)
0.802
(0.423)
−0.114
(0.909)
−0.317
(0.751)
−0.947
(0.344)
0.398
(0.697)
0.103
Observations600570125415356190238302
Note: T-values are shown in parentheses. ***, **, and * represent 1%, 5%, and 10% significance coefficient tests, respectively.
Disclaimer/Publisher’s Note: The statements, opinions and data contained in all publications are solely those of the individual author(s) and contributor(s) and not of MDPI and/or the editor(s). MDPI and/or the editor(s) disclaim responsibility for any injury to people or property resulting from any ideas, methods, instructions or products referred to in the content.

