3.1. Global Overview
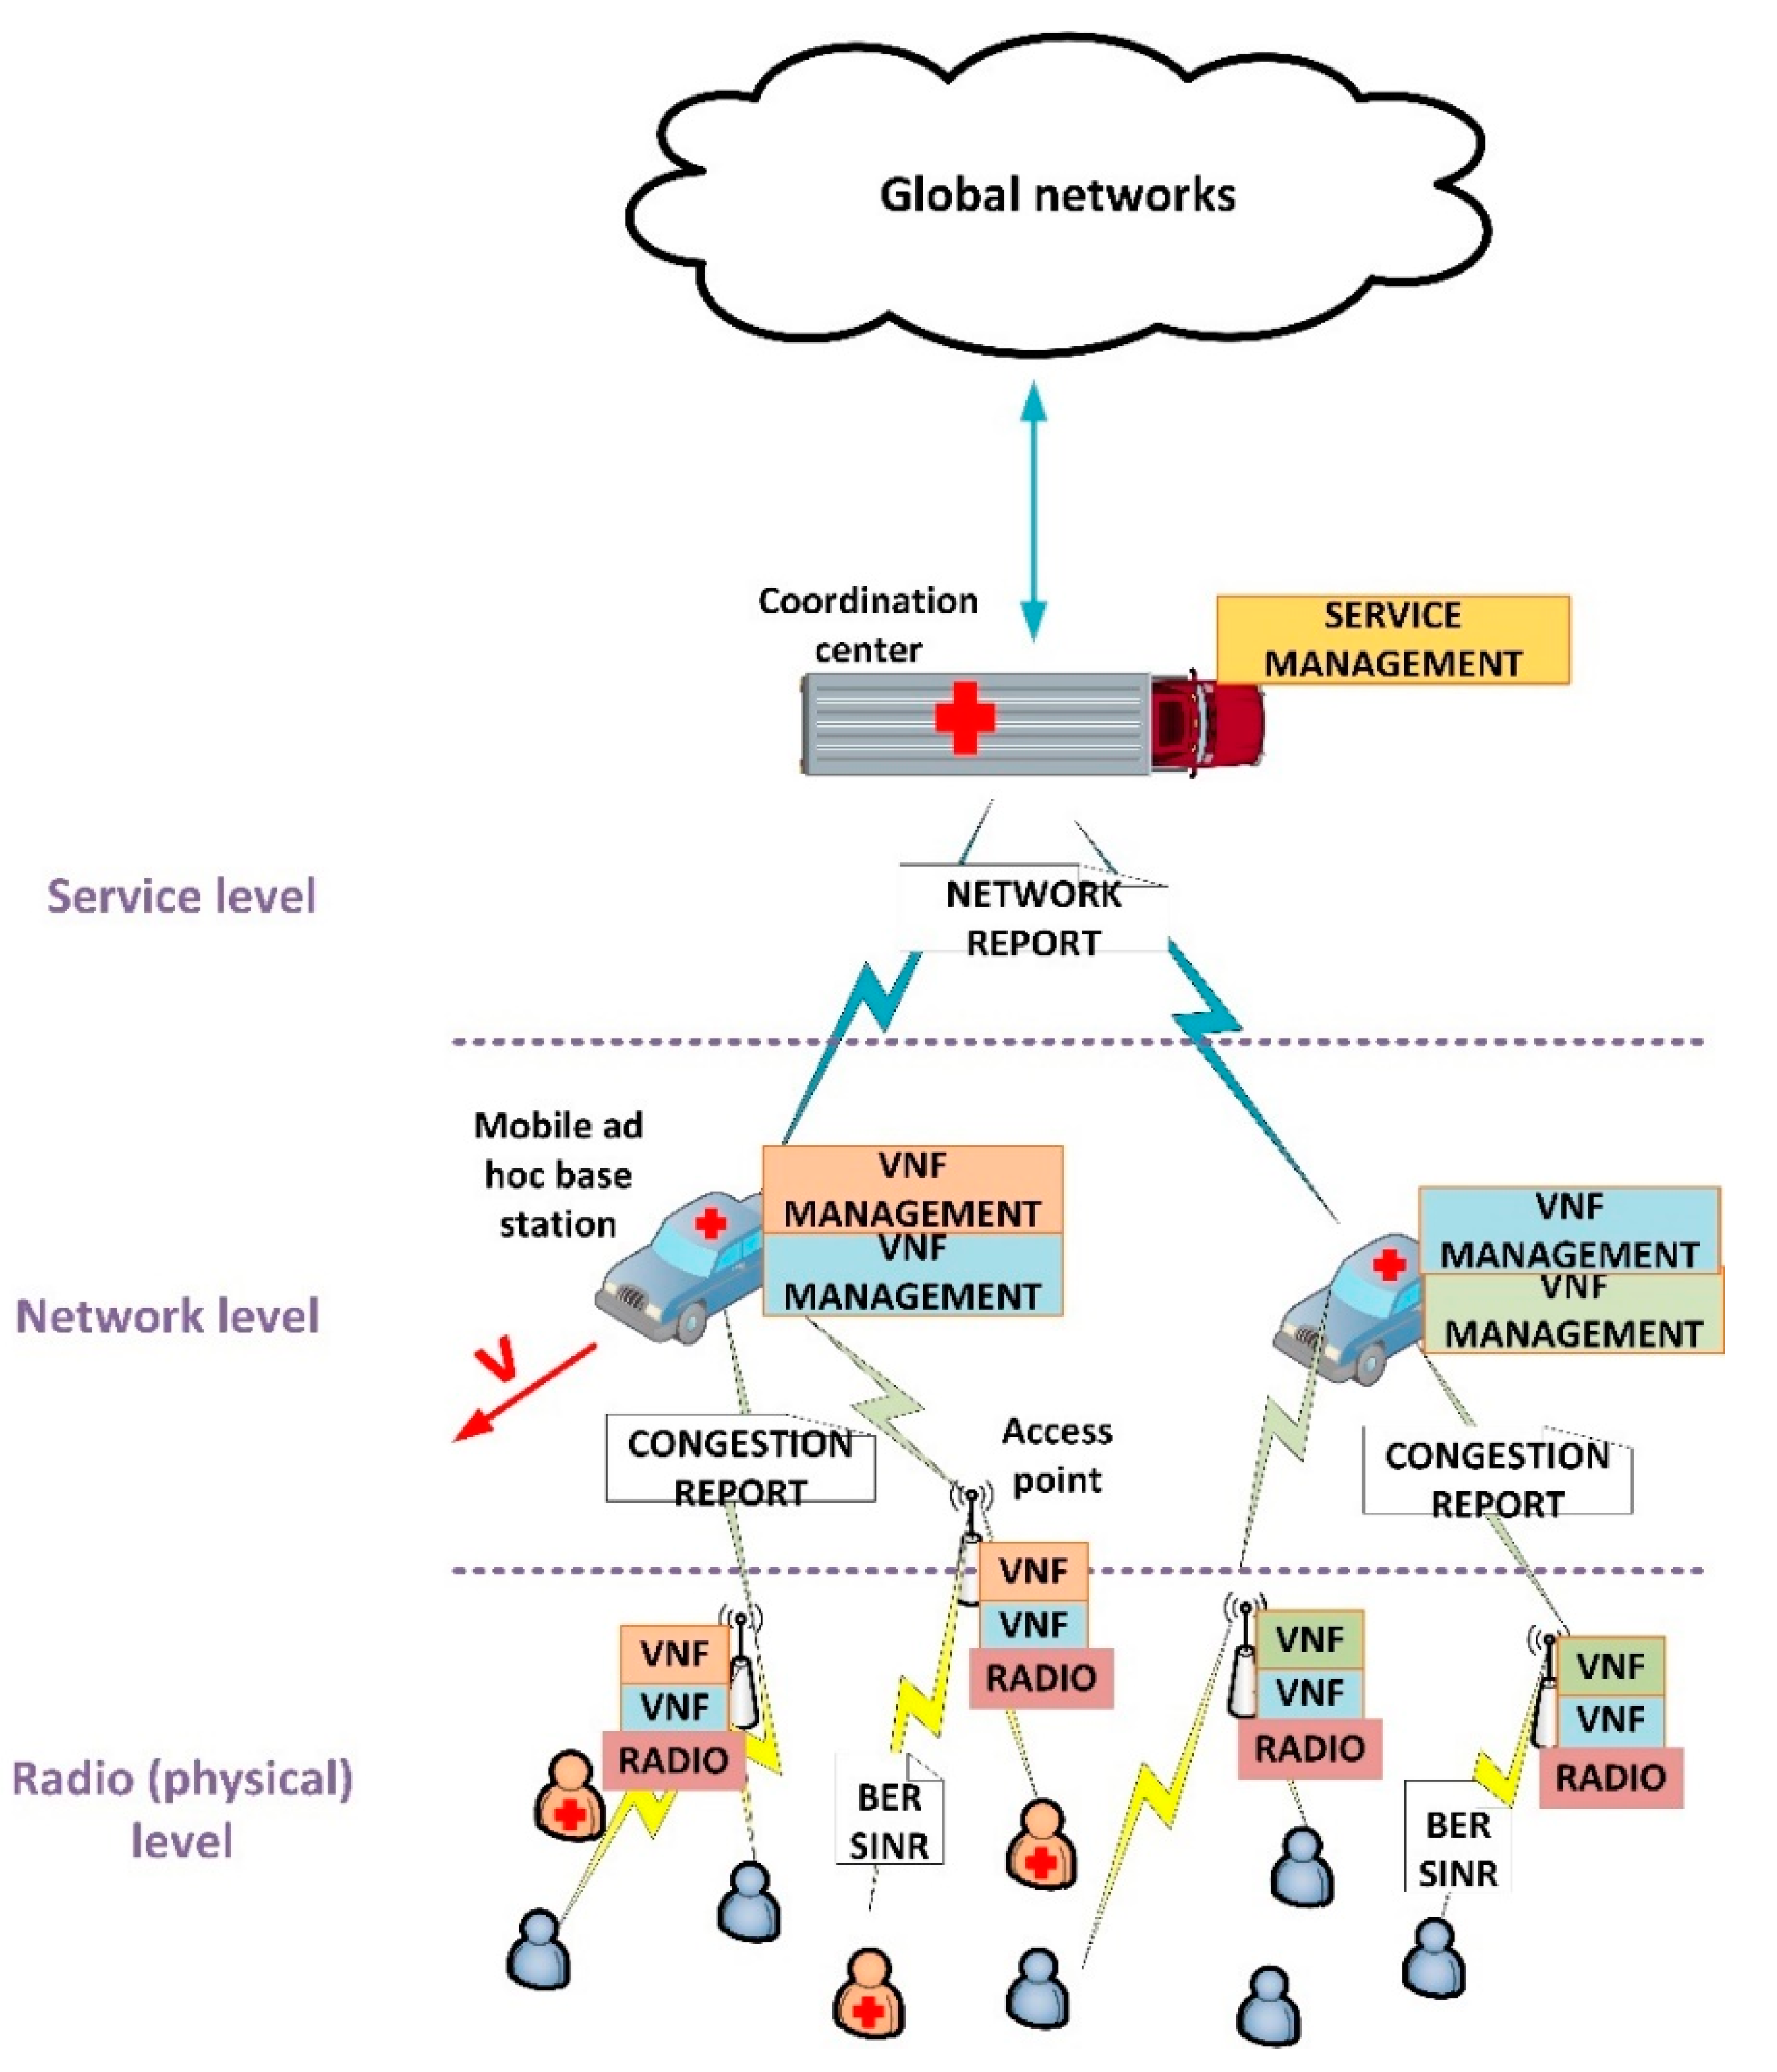
Figure 1 shows the proposed architecture. As can be seen, three different levels are considered: radio (or physical) level, network level and service level. In general, the proposed architecture follows the mobile network design principles, and presents a distributed structure.
The radio access network is distributed into two different layers: the access points at radio level and the mobile base stations at network level. The scheme follows the C-RAN (Cloud Radio Access Networks) architectures proposed for 5G technologies. In access networks (collection of access points), Network Virtual Functions (VNF) supporting different services are deployed, together with all physical capabilities required at radio level. These access points are deployed around the entire geographical area to be covered. They employ wireless communications and batteries to be totally independent. On the other hand, typically, in emergency situations, ad hoc base stations are deployed through medium-size mobile infrastructures, such as emergency cars, where a generic computing platform is included. These base stations are connected to the access point using any of the existing wireless technologies (we are not addressing this point in this article). In these base stations, the resource management of VNF and services is performed. Besides, all base stations are connected to a main coordination center, where global service management is located and acting as gateway to the global communication networks. This coordination center is, as well, deployed in large mobile infrastructures provided with general computation devices, however, in this case, tends to be placed in a fixed position, especially if satellite communications are employed.
At radio or physical level, we are using a Cyber-Physical System approach to define a feedback control loop integrating the physical and the computational processes affecting the communication services at the ratio links. To define these loops (one for each service and access point), we are considering three basic indicators: the Bit Error Rate (BER), the Signal over Interference and Noise Radio (SINR) and the available resources and congestion level at each moment. Using these state variables, we are controlling the power and bandwidth of signals at real time. As output, the access points generate a report about radio congestion which is processed by base stations (network level).
At network level, an optimization problem is posed. The objective is to distribute among VNF composing a service (and deployed in the different access points), the assigned resources to that service by the main coordination center. This problem considers the number of users and the provided Quality-of-Service (QoS), as well as the mobility of base stations moving at speed . As communication services in our proposal are supported by virtualization technologies and 5G network slicing techniques, resources can be assigned to different VNF in a dynamic and variable way. As output, this optimization problem generates a report about the quality of the final resource distribution, so the main coordination center may learn about the global network situation.
Finally, at service level in the coordination center, all reports from the different services are collected. Then, using a priority algorithm, the coordination center decides if a new service may be deployed, some of them have to be cancelled or modified, etc., according to services described in a catalogue including their minimum requirements and priority. The objective of this algorithm is to guarantee the QoS of services with higher priority before deploying any service with a lower priority, and adapting the global situation to the current emergency evolution.
3.2. Physical Level: Power Signal Control
In the proposed architecture, radio and link levels are following the design principles for future 5G networks [
41]. In particular, the frequency spectrum is organized using OFDMA (Orthogonal Frequency Multiple Access) and TDMA (Time Division Multiple Access) techniques. Then, each VNF (service instance) at each access point is provided with a set of time slots
over a set of orthogonal frequencies
. Radio resources are then represented by a set
(1) of ordered pairs
, where
is the numerical order of the time slot,
is the assigned orthogonal frequency,
is the number of available time slots per orthogonal frequency, and
the number of frequency channels. Different modulations could be employed, although in this paper we are considering the family
-QAM (Quadrature Amplitude Modulation),
being a natural number, usually between four and seven.
On the other hand, each frame at link level is protected through a Convolutional Error Correction Code (CECC). Frames have a length of
bits, including a header of
bits, enabling receptors to detect up to
bits and correct up to
bits. Using this code, the Bit Error Rate (BER) of the connection between the access point and the user device (at this point we are focusing on a given service, no difference among emergency or supplementary services is done at physical layer) may be calculated after collecting
different frames. Then, in this context, BER turns into a discrete measurement with an associated (power) quantification noise
(2) and a maximum value depending on the employed CECC (3).
Although BER shows univocally the QoS at physical level, this parameter is very complicated to manipulate in a direct manner, and physical parameters affecting that indicator are preferable improved. In particular, BER in OFDMA solutions depends on the Signal over Interference and Noise Ratio (SINR). This ratio (4) depends on the information signal power
, the interference power
and the noise power
. In MIMO (Multiple Input Multiple Output) solutions, this ratio is improved by considering a set of radio antennas. Although in standard 5G systems MIMO technologies are employed by default, they are very difficult to find and implement in ad hoc deployment for emergency situations. As in a realistic scenario we are not finding this technique, we are not considering it.
The information signal power may be aeasily increased or reduced if required. However, power associated to interferences, , and noise, , is more complicated to manage. In general, as these phenomena are environmental and uncontrollable effects (for example, in urban environments, caused by the high density of buildings and pollution), but frequency dependent, any change in the frequency channel employed to communicate causes a change in those powers. Thus, if the SINR is not adequate, a new radio resource may be assigned to the user device to improve the situation.
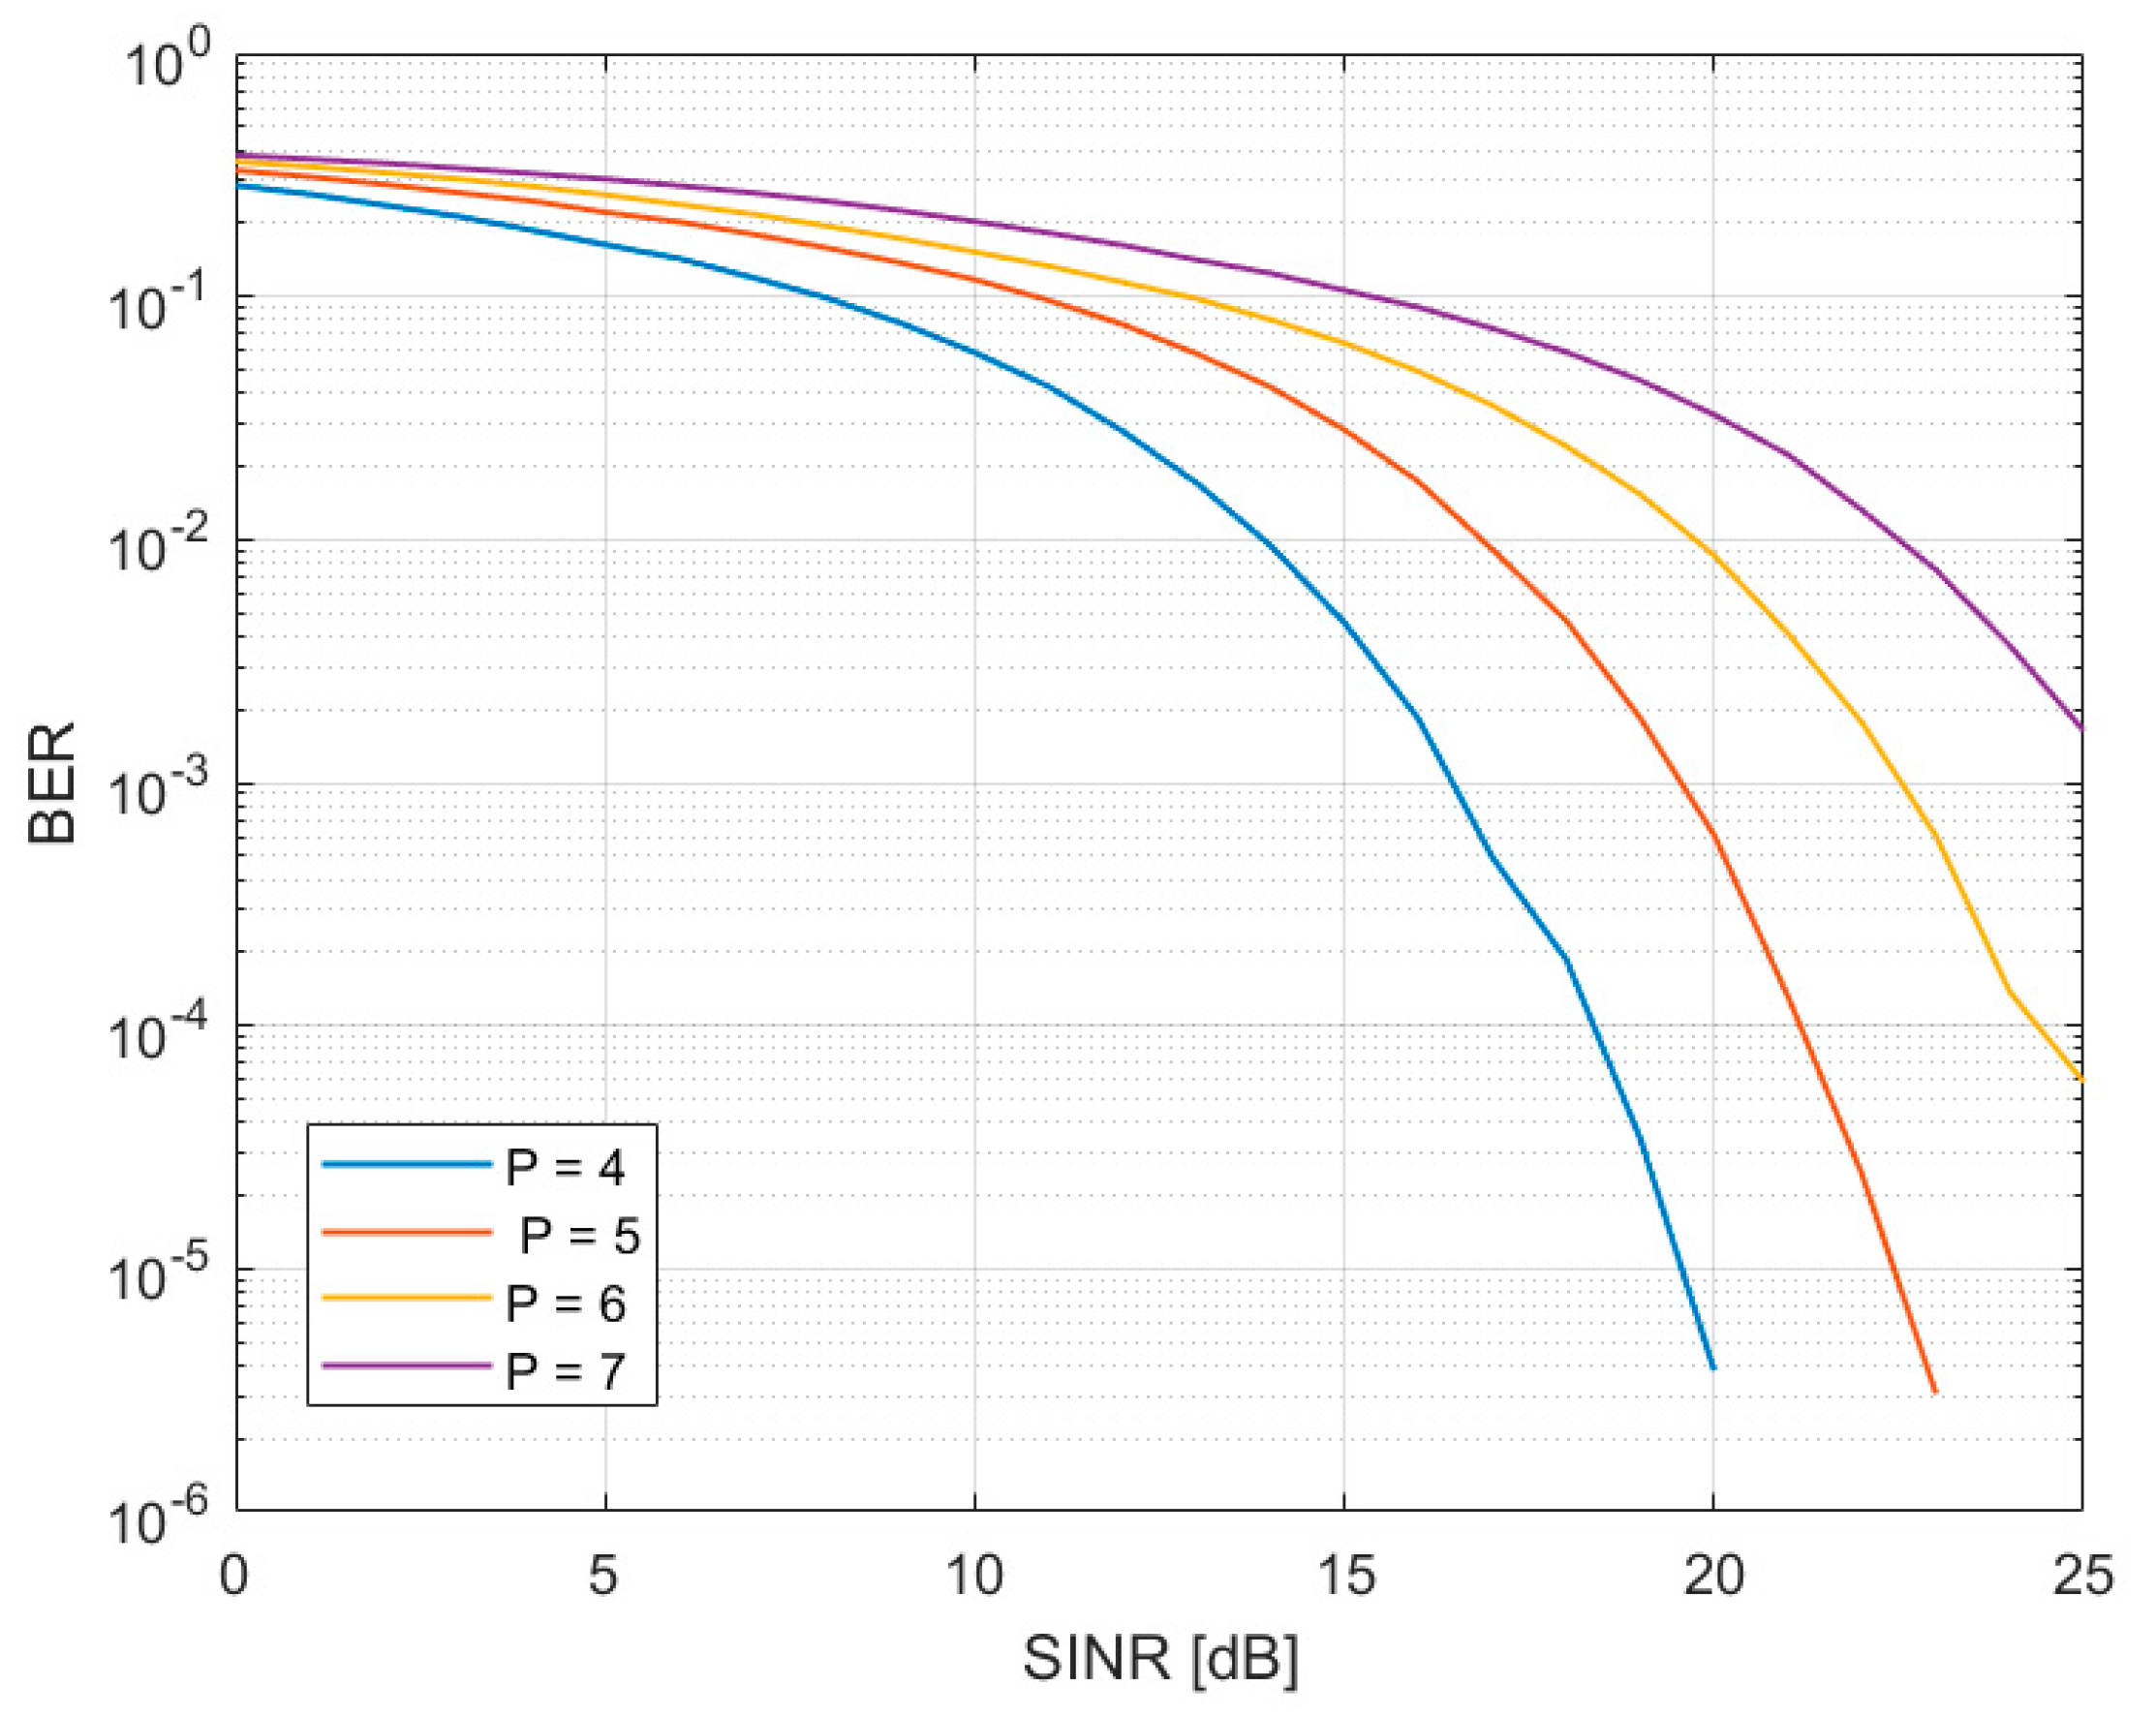
The relation between BER and SINR depends on the selected modulation and spectrum structure. Specifically, in OFDMA solutions, this relation is not analytical and a numerical analysis involving the Discrete Fourier Transform must be developed.
Figure 2 shows that relation for different
p values.
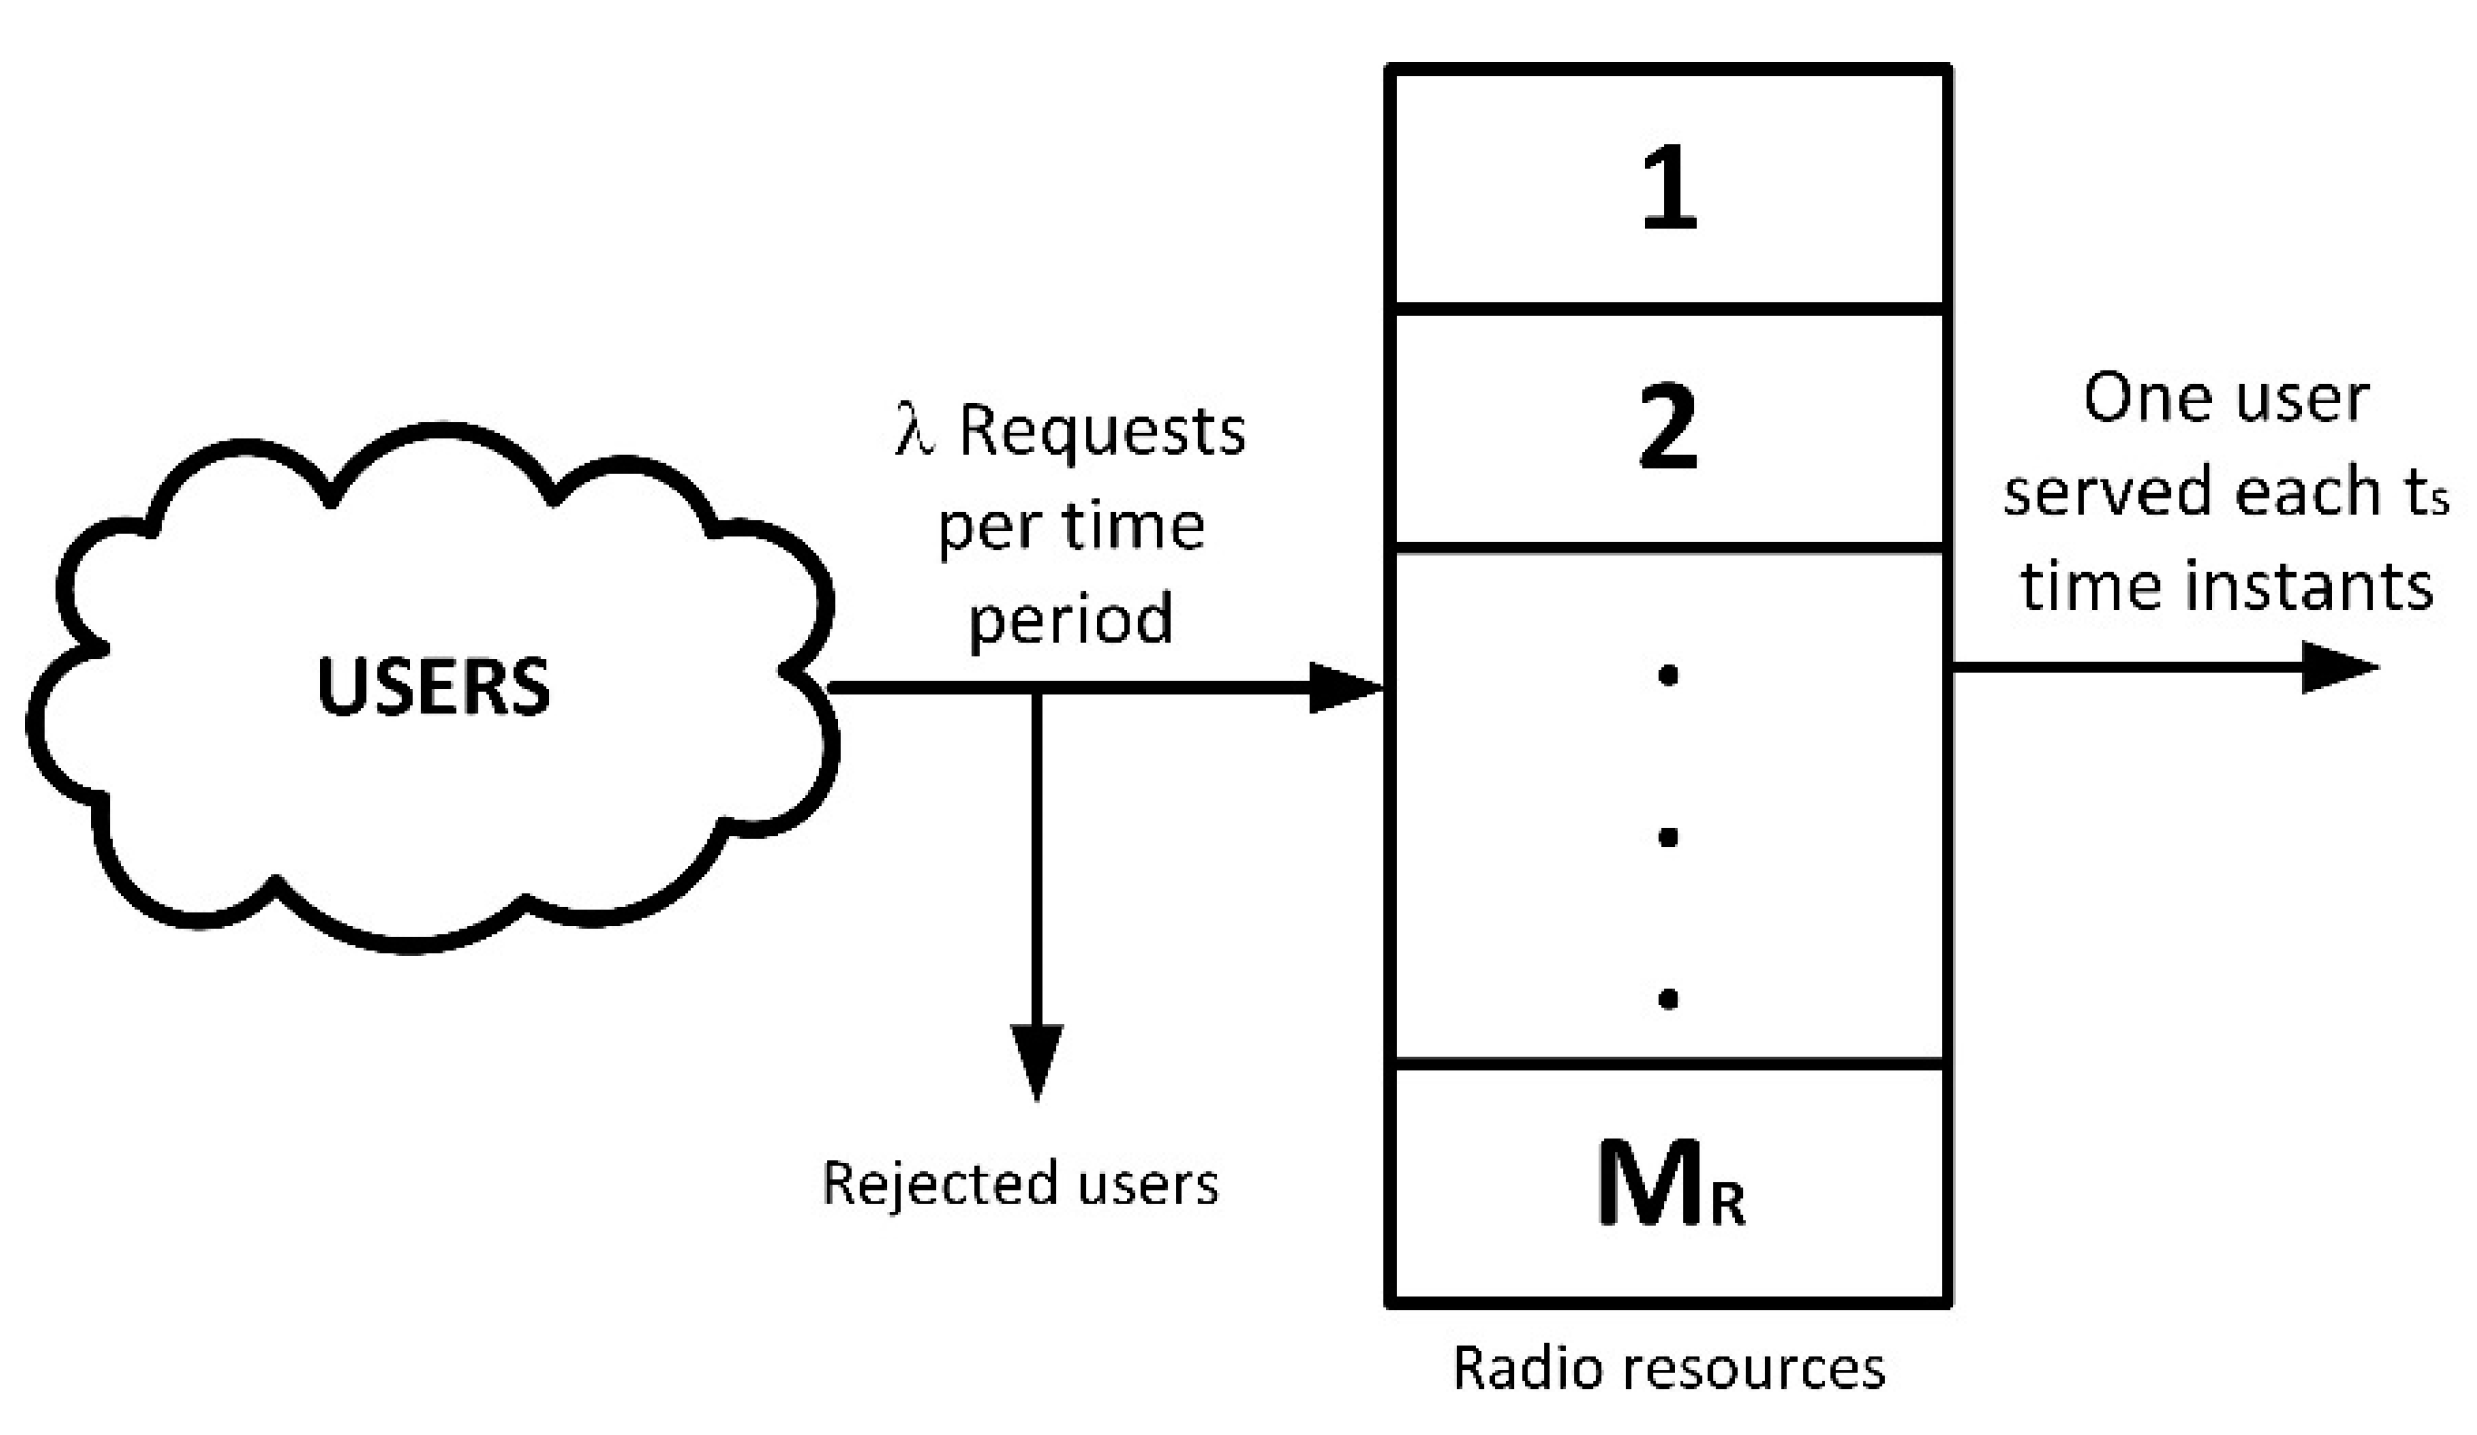
BER and SINR characterizes the provided QoS, however, a second interesting analysis to consider is how users experience the service. This parameter is known as “Grade of Service” (GoS). As the number of available radio resources at each service and access point is limited (5), eventually, some users may be rejected as they cannot be served. The ratio between served
and unserved
(rejected) users is called GoS (6). However, GoS cannot be calculated in a deterministic manner (like BER), as the number of accepted/rejected users does not follow a specific function, but a probabilistic distribution. Moreover, GoS evolves slowly, and a great amount of damage may be caused before a reduction in that value is detected. Then,
To determine the probability of a user to get rejected by the service, we are using the teletraffic theory. The community of
users associated to the analyzed service and access point, in general, will be much greater than the available radio resources (5). Then, hereinafter, we are considering the number of users
as infinity. Besides, no waiting queue is included. In emergency situations, no delays are admissible, and users must either communicate immediately or be rejected at the moment, so they can look for a different communication option. Then, if all radio resources are assigned to current users, any additional and new user is automatically rejected (see
Figure 3).
Two additional physical parameters are, besides, considered: the medium service time (usually expressed in hours) and the demand rate (typically in user per hour). Then, at any moment, the medium number of new users trying to get service will be and the number of users finishing their communications and liberating radio resources is 1/. Besides, we are calling to the probability of being assigned radio resources. Then, using simple equilibrium equations and a recursive process, we can calculate that probability (7).
This expression perfectly matches the Erlang-B distribution
. Now, the probability of a user to get accepted
is the probability of all radio resources not being assigned (8). Hereinafter, we are using
to name the “congestion ratio” (9). This value must be below the unit (typically round 0.7 as maximum) to guarantee the service is not congested and near a relevant degradation of GoS parameter.
Using these expressions, we can obtain the probability distribution for GoS (11). It is enough to consider all service requests as independent events and the Poisson distribution with mean value
(10) as the probability of receiving
service requests in a time period (typically expressed in hours)
—usually one hour.
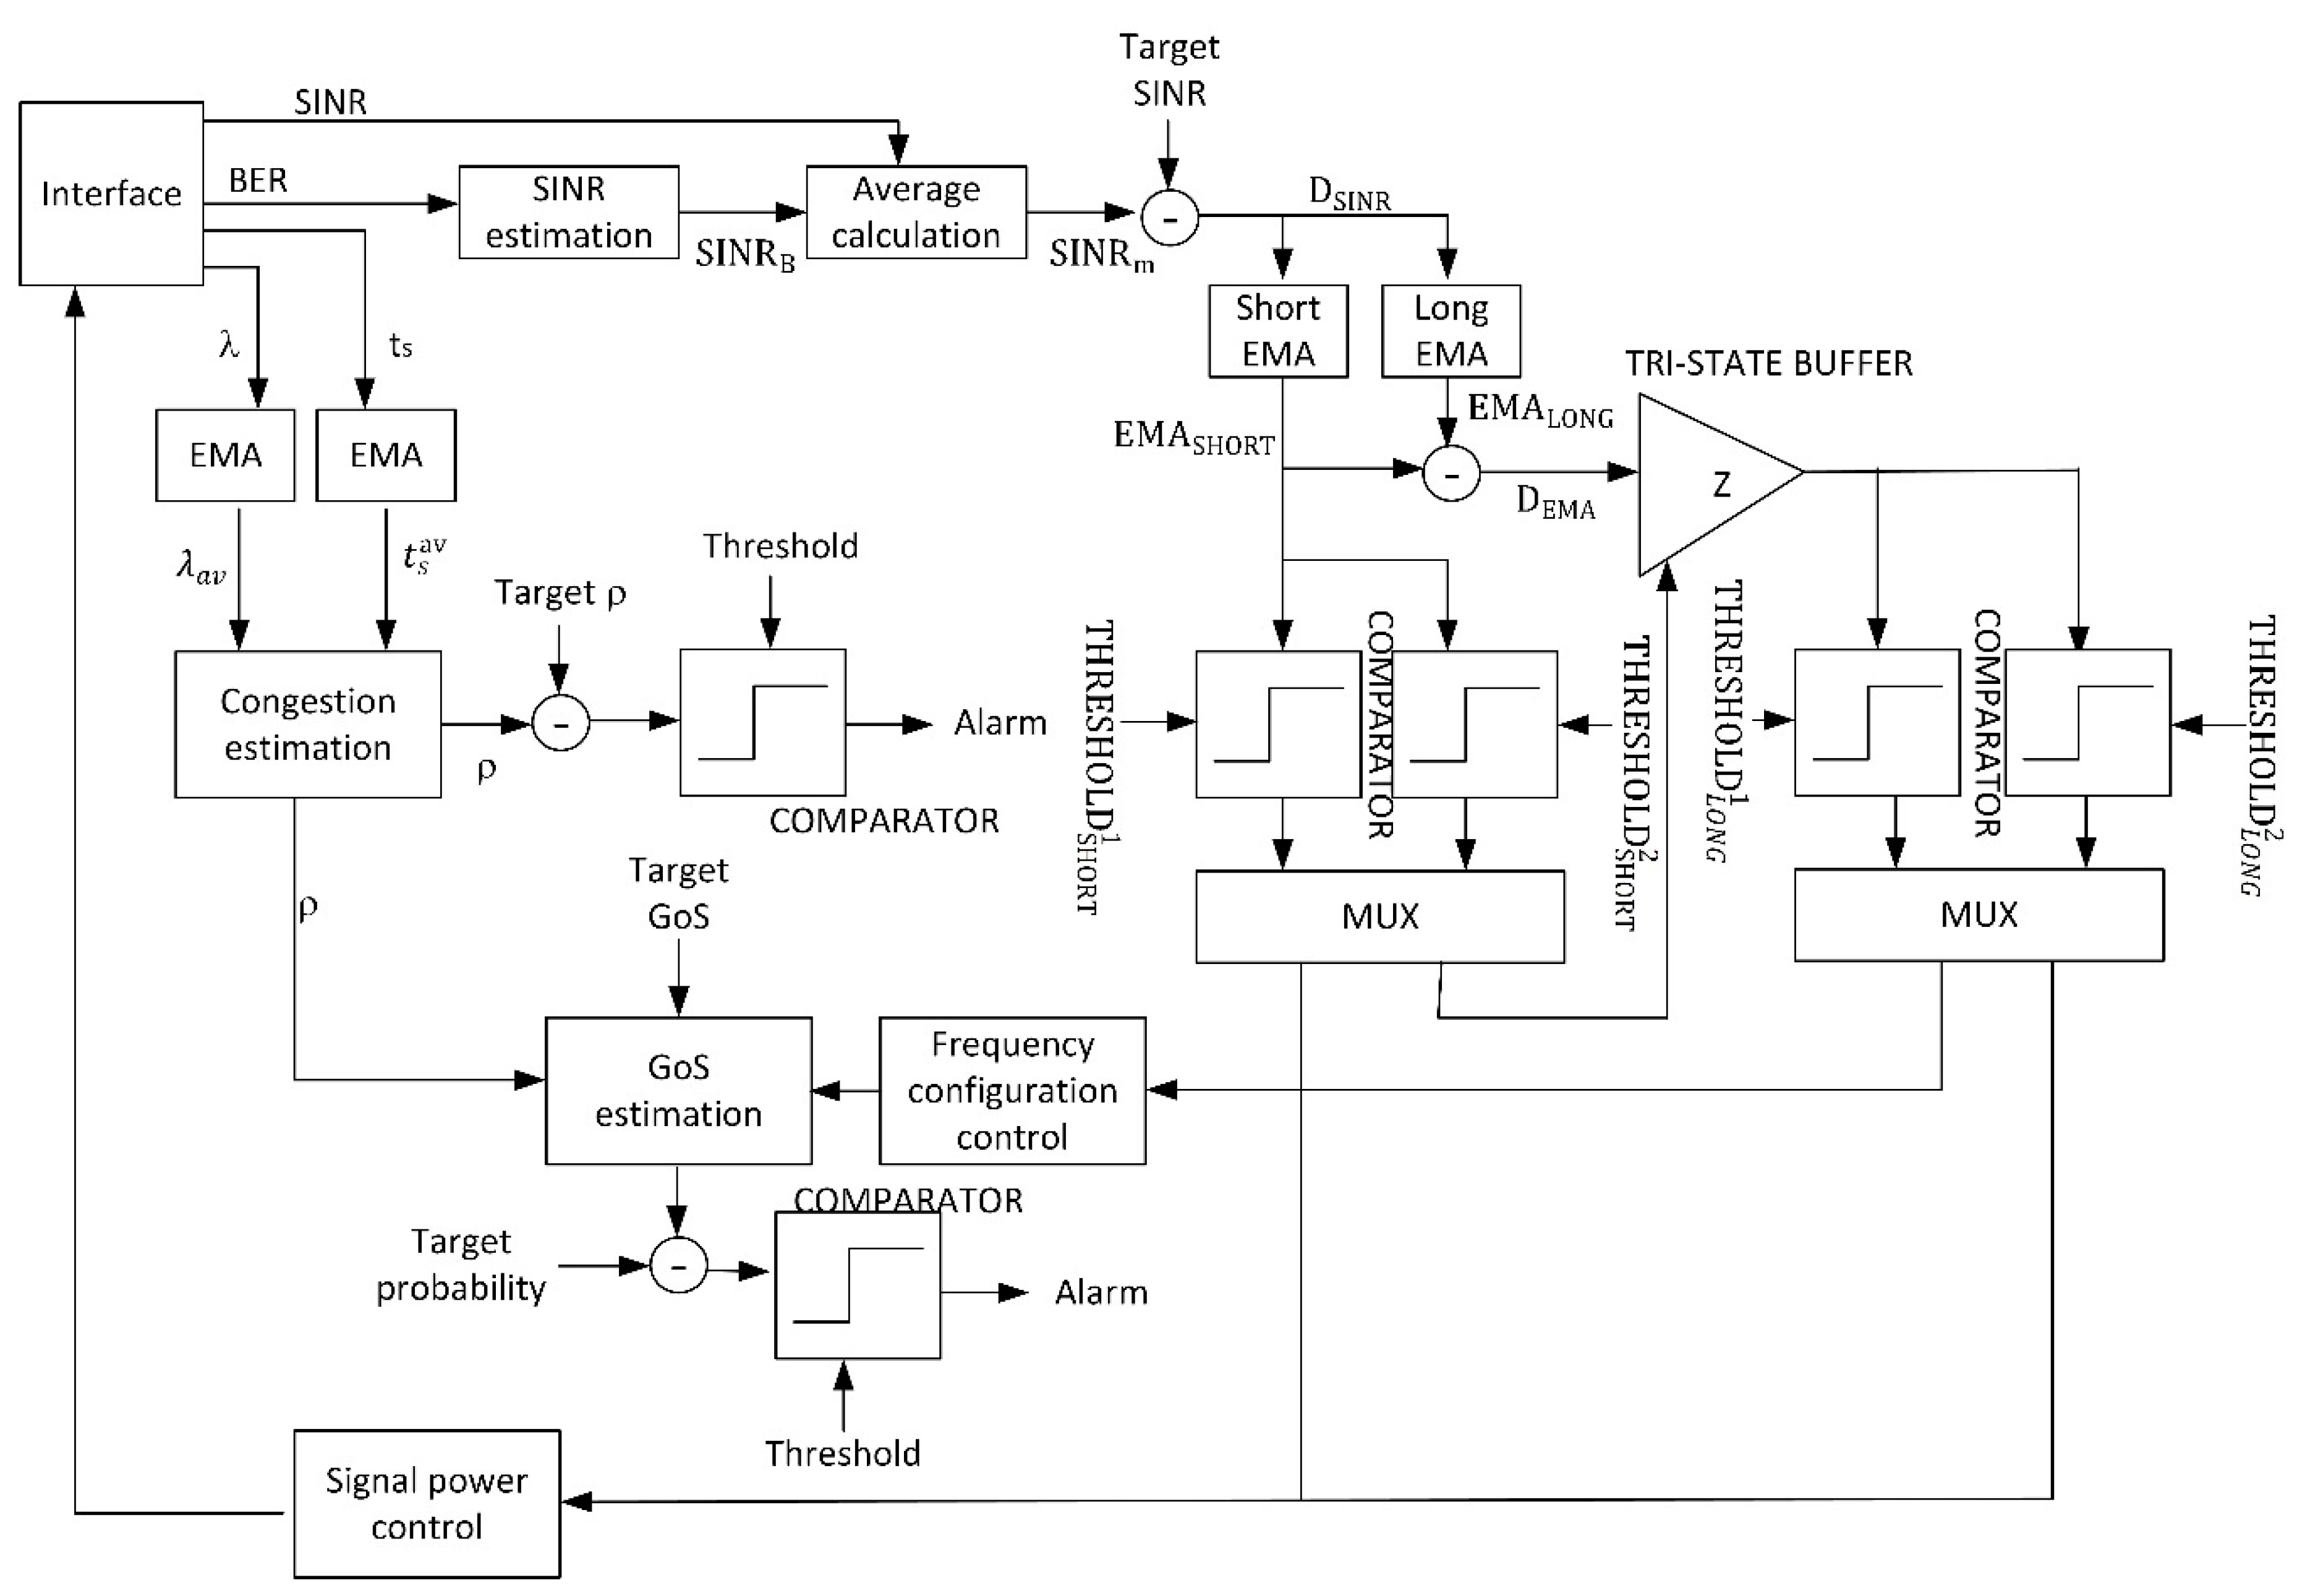
Now, with all this previous information, it is possible to describe a Cyber-Physical System (CPS) based on a complex control feedback loop, in order to guarantee the service instance (VNF) in the access point under study reaches the expect and target values for QoS (BER and SINR) and GoS. The control loop will manage the radio resources in such a way the service presents the maximum quality, if possible. If, because of environmental conditions, the control loop cannot ensure a good enough quality according to the proposed targets, a congestion report will be sent to the network level. This report may be also sent periodically, to enable the algorithms at network and service level to operate.
Figure 4 shows the proposed CPS using a block diagram.
This CPS is implemented in the wireless access points, where radio signals are generated. A similar solution could be deployed in user devices, but this approach would enforce ERT to employ a specific communication equipment. As said before, different ERT (even international teams) using different user and communication devices, could be integrated to address a particular emergency situation, and all of them should be easily connected through the proposed communication system. Thus, in our proposal, user devices may be standard mobile devices as no interaction of special information is required from them. Proposed CPS is implanted in access network (access points) estimating the user perception using different indicators and measures.
The interface module extract and monitors from the physical world four different state variables: SINR, BER, the service time and the demand rate . Different techniques may be employed to estimate these physical variables, from analog circuits to digital signal processing. All of them are adequate to be integrated into the proposed CPS. These variables connect the physical and the computational processes, and (as response) the algorithm may change the physical signal configuration (power and frequency). Those signals are generated using the signal generation module. It is important to note that, formally, the obtained variables are referred to the uplink, while we are acting over the downlink. However, in common scenarios, quality parameters present worse values for the uplink (as user devices have more limited capabilities), so, any case, we are considering a worse case than we are supposed to. The obtained results, then, are equally valid.
As BER cannot be manipulated directly, as previously said and using numerical functions in
Figure 2, it is obtained a second SINR estimation
. The new value, and the physical value are merged using a standard average (12).
This value is compared to the target SINR (so the QoS reaches the expected value) (13). The residue is aggregated into two historical records controlled by two Exponential Moving Average (EMA) (14), where is the temporal index. The first one is a short-period average (), designed to remove fast variations and temporary effects, ensuring the stability of the proposed CPS. Its output is introduced into a bank of two comparators with thresholds and (15). Both thresholds must fulfill a strict order condition, so the control loop can work properly (16). The first comparator is active at a low level. For values of between both thresholds, no action is taken. The difference between both thresholds is the tolerance margin the control loop accept as “standard situation”. Typically, it is around 10% of the higher value (), although higher or lower tolerances could be considered depending on the application scenario. For values above (they would be above as well because of the order condition), the power signal control module is activated. For values below (they would be below as well because of the order condition), the second exponential average is employed. Basically, if is near the target SINR no action is taken, if is much higher than the target SINR a reduction in the information signal power may be done (so energy resources are saved), and if is much lower than the target SINR, a large processing is required.
To select the specific value of both thresholds, the Shannon–Hartley theorem is considered (17), being
the bandwidth of the radio channel and
the channel capacity. The minimum bitrate to be provided at radio level may be employed to, though this law, obtain the lower threshold
. Later, and according to the selected tolerance level for the application scenario,
can be easily calculated.
The second EMA is a long-term average employed to determine if a certain situation has turned structural (
). Its output is named
. Both
and
are subtracted (18) and the difference
is introduced into a new bank of two comparators with thresholds
and
(19). The first comparator is active at a low level. For values
between both thresholds, changes in the frequency spectrum are required and the second branch of the proposed control loop is activated (the low value for
is structural). For any other value, the information signal power must be increased to improve the real SINR. This indicates either the SINR is upgrading from a low value or the SINR is suffering a decrease that is not structural, but it is not a temporary and transitory phenomenon.
On the other hand, the physical variables
and
are also injected into two EMA modules (20), but analyzing changes at medium period (
), so the real-time values for both parameters are obtained. The obtained results are injected into the congestion analysis module. The output of this module (9) is introduced into a comparator and, if the value is above the proposed threshold, an alarm is triggered to the network layer.
Moreover, if a change in the frequency spectrum is required the congestion parameter is introduced into the GoS analysis module. A new radio resource is, then, assigned to the user controlled by the corresponding CPS using the power signal control module. This new assignment, actually, is understood as a reduction in the total number of radio resources , as we are consuming this new resource, but no new users are served. Then, the GoS distribution must be calculated (11) for the new value of . If the probability for a given and limit value of GoS goes above a certain maximum admissible value (we are using a comparator to perform this check), then, an alarm is triggered to the network layer.
The signal power control module, basically, considers the interference and noise powers are constant in time, so it is easy to calculate the new information signal power to improve the SINR (4), just using the expression for electromagnetic losses in the vacuum (21), being
the power of an electromagnetic wave,
the transmitted power and
the transmission distance.
As a result, the proposed loop and CPS will improve the physical configuration of the service in order to reach the target quality, until it is not possible to reach that objective (because of resource limitations); then, an alarm is triggered.
It is important to note that the proposed CPS is limited by the numerical noise of the BER and SINR estimations, but (in general) we can control this effect and guarantee the stability of the control loop by considering a large value for .
3.3. Network Level: Optimal Resource Distribution
At a network level, we are focusing on only one service, but in all the access points and mobile base stations that may be supporting that service. In future 5G systems, virtualization technologies will be employed. For example, as seen in the previous section, VNF will be employed to create service instances in access points. To coordinate all these service instances (run the instance, control its lifecycle, etc.) commercial solutions may be used. For example, Kubernetes and Docker [
13]. However, these virtualization and management technologies do not control where the different service instances are run or where and how the base stations are deployed and move. These basic variables are addressed in the proposed solution, through an optimization problem whose solution is here calculated.
Given a service
, the main coordination center allows this service to run simultaneously a maximum of
service instances (VNF) at
different access points, being
. These two parameters,
, represent the resources assigned to the service by the coordination center. Then, we are considering an ordered list
describing the number of connected or served users through each one of the
available access point at
-th time instant (22). We are representing as
the total number of service users across the entire network.
The first objective of the optimization algorithm at network level is, then, to maximize the number of served users , while the number of service instances and employed access points is minimum. This problem, more precisely a bidimensional equalization problem, is solved to determine the geographical distribution of service instances before any further processing.
We are assuming each access point is provided with a hardware device, so it can inform the base station about its geographical position (typically using global coordinates),
(23). Besides, each access point
is characterized by the number of service instances
it is running (24). Then, the base station managing the service can create a discrete vector function
(bidimensional). The input vector represents the geographic position
of an access point, and output values
represent a measure about the number of served users (Grade of Service) and the provided service quality (network congestion). The proposed function (25) is linear with respect to the GoS and logarithm regarding the network congestion. Both measures are combined in a natural product as any increasing or decreasing in any of the partial measures causes a global increasing or decreasing in the user perception. Any other function or mathematical definition could be freely selected for other application scenarios, but proposed function is selected to match the subjective perception of service quality by users [
42] (which is linear for GoS and logarithmic for network congestion). If one access point is not executing an instance of the service, the corresponding geographical point is not considered.
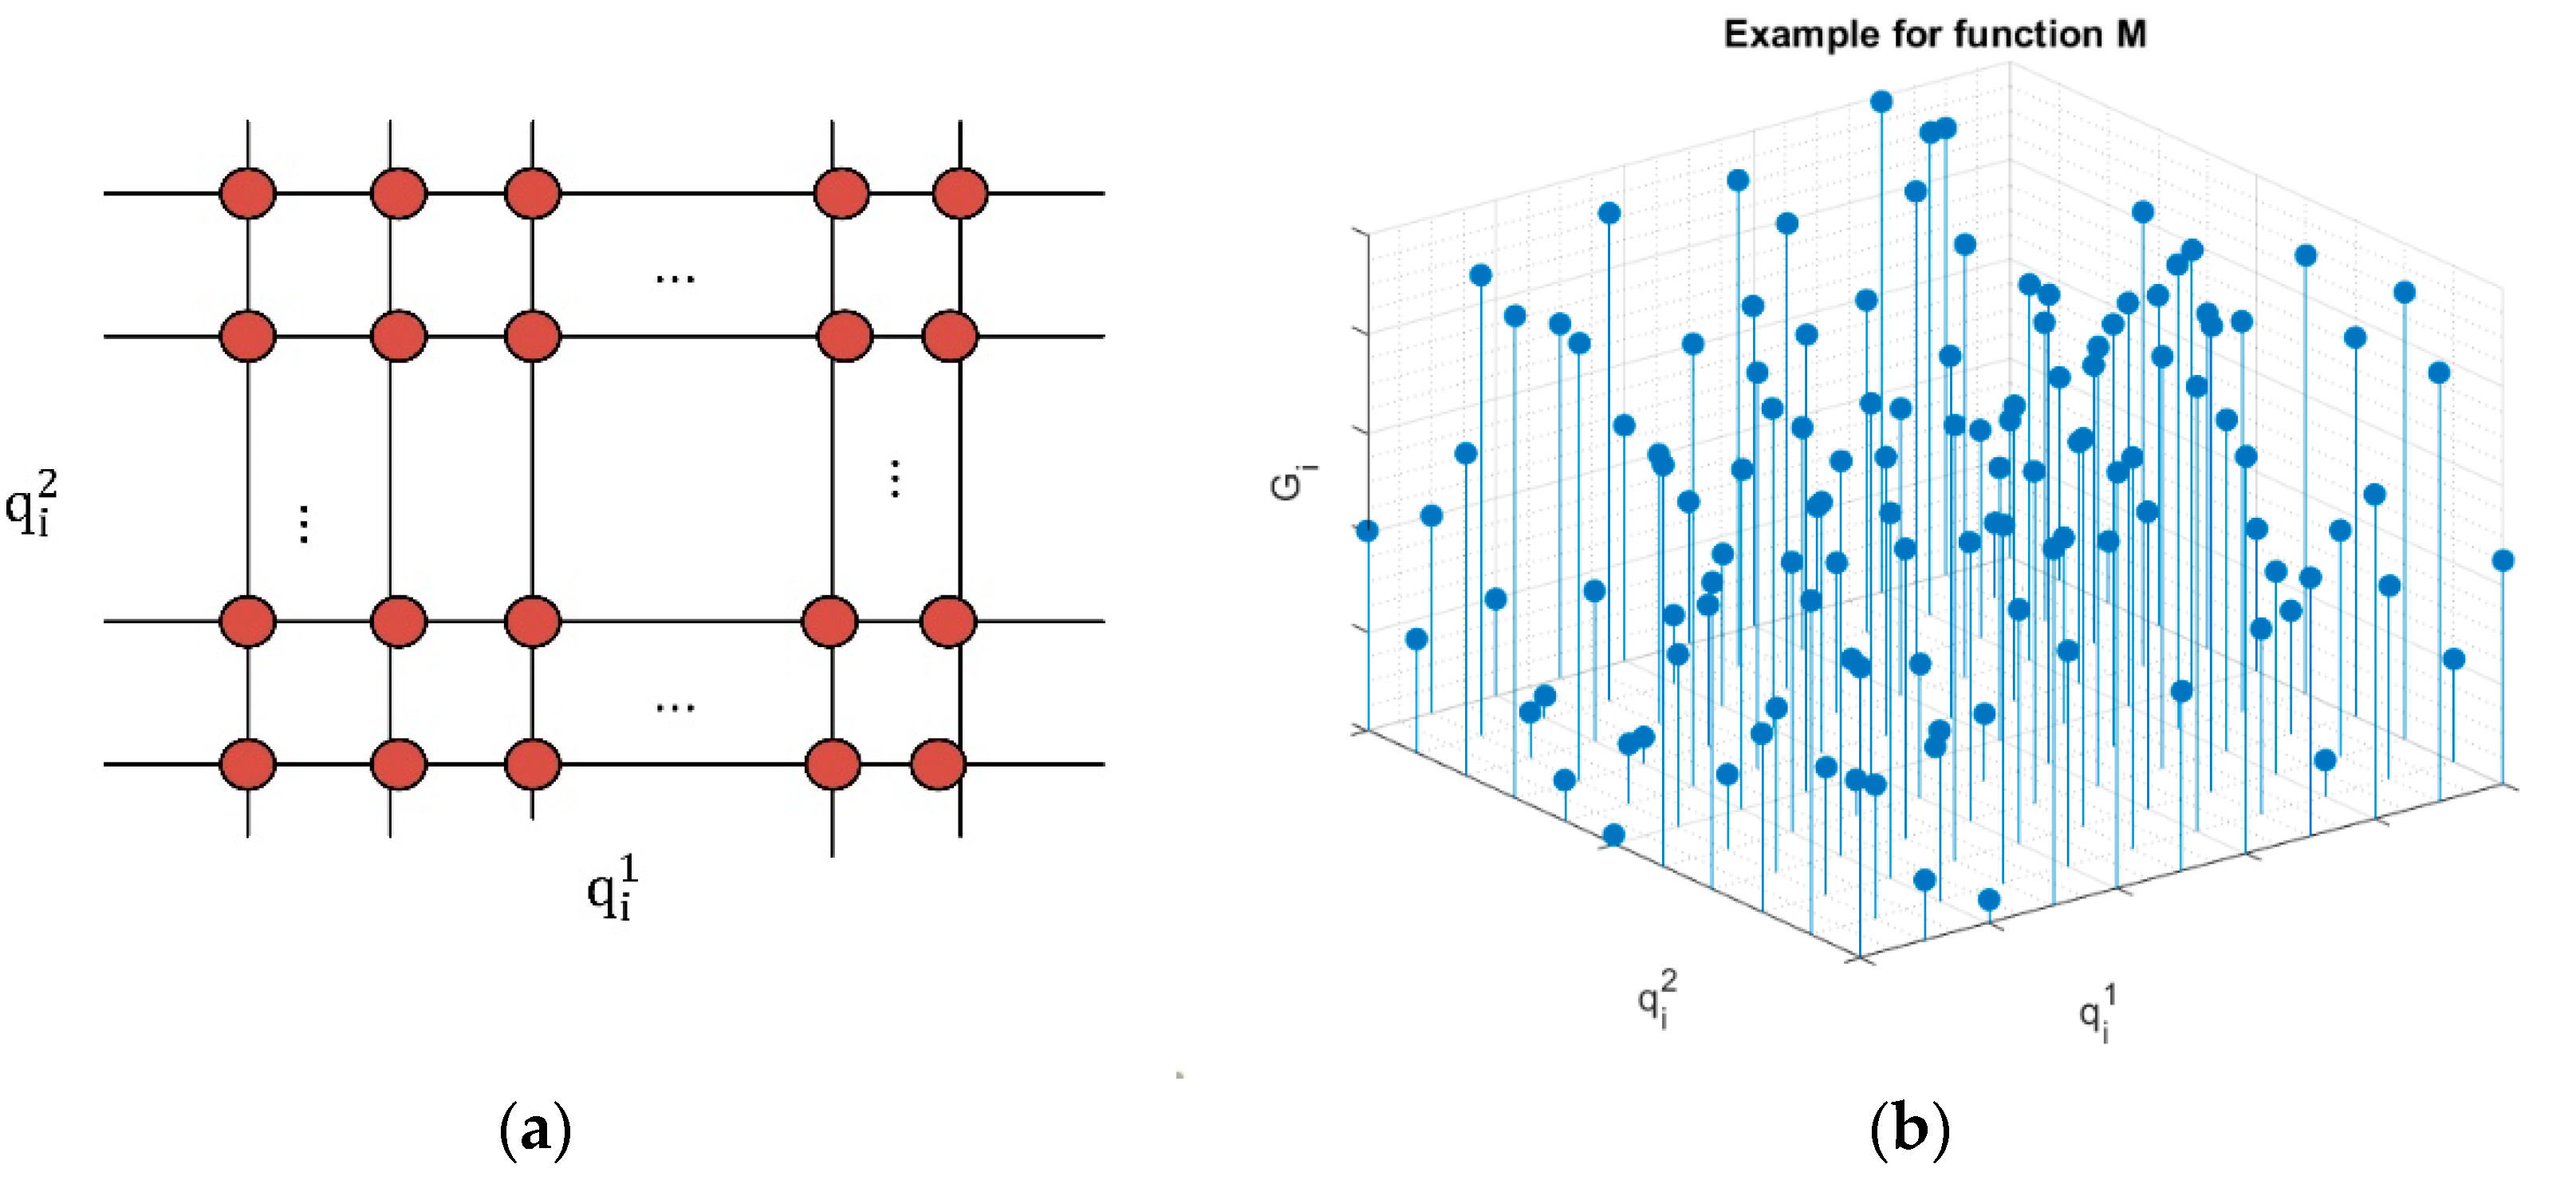
For this function,
, we are representing the area where services are deployed as a squared reticulum
(see
Figure 5a), so the resulting function is a three-dimensional discrete surface, where peaks represent access point with a good performance (lots of server users and non-congested services), and low values represent congestion situations to be addressed. With the unique purpose of showing the formal shape of this function,
Figure 5b represents a possible result for function
(this example does not represent any real situation, so particular values are meaningless and must not be taken into account).
For every service and function,
, a minimum value is defined,
, that must be reached at every point. Then, the problem we must solve is to determine the set
(26) of access points with the lower cardinality and the lower global number of service instances
, so function
is maximum for every input point and all of them get, at least, the value
(27).
To solve this problem, we are assuming it is created a solution reticulum including all activated access points and the service instances each one of them is executing. Using this default configuration, and at any other moment, the following algorithm is run (see Algorithm 1).
The entire reticulum with all values
is analyzed. If all values meet the optimization condition, no additional action is taken. However, if any point where
is detected, then the area
around the point
is analyzed. If the studied area
only that point
is executing a service instance, then any other point in the area
is a candidate to get activated. In that way, the coverage area is enlarged, and more users could be served, reducing the congestion in the original access point.
| Algorithm 1. Service Instances Allocation |
| Input: Default reticulum and coverage distance for access points |
| Output: New service instance distribution and reticulum |
| Create list of candidates to execute a new service instance |
| Create list of candidates to remove a service instance |
| for eachdo |
| if
then |
| if then |
| Calculate area such that if |
| if for all then |
| Add to , being randomly selected in |
| else |
| for each do |
| Calculate all |
| end for |
| Calculate the average of all |
| if
then |
| Add to so is minimum in |
| else |
| Add to |
| end if |
| end if |
| end if |
| end if |
| end for |
| Calculate a partition of in subareas with radius |
| for eachdo |
| Calculate all , being |
| Calculate the average of all |
| if then |
| Add to so is maximum in |
| end if |
| end for |
| if then |
| Update the reticulum, instances are removed/added from all candidates |
| elseifthen |
| Remove service instances from candidates randomly selected |
| Add service instances to all candidates |
| else |
| Remove all service instance from candidates |
| if then |
| Add service instance to all candidates |
| else |
| Add service instances to candidates randomly selected |
| Trigger an alarm |
| end if |
| end if |
On the other hand, if in the area , more than one access point is executing the service and the spatial average value in the area according to function is above , the point is a candidate to execute an additional service instance. In the last case, if the average value in the area according to function is below , the point in the area with a lower value is the candidate to execute a new service instance.
Equally, the reticulum is analyzed in subareas . Areas where the medium value is much above are detected (typically more than five time the value ). In these areas, a candidate to remove a service instance can be located. The candidate is the access point with a higher value according function .
After this analysis process, if candidates to execute a new service instance are equal in number to candidates to remove service instances, the network is updated. If the number of candidates to remove service instances is higher, only 50% of these candidates are requested to remove a service instance. In that way, we guarantee an uncontrollable decreasing in the service quality is not produced. If the number of candidates to execute a new service instance is higher, new instances are executed if possible (if there are available resources). If that is not possible, an alarm is sent to the service layer.
Once service instances are geographically distributed, the distribution and movement of base stations must be analyzed. The position of the base station
(28) may vary at speed
m/s. To select the most appropriate position for this base station, we are considering a new optimization function. In this case, the base station must be placed or moved in such a way that all access points can communicate with the base station with the best possible quality. The distance
between any access point and the base station (29) can be easily calculated using the Euclidean distance. On the other hand, an according to electromagnetic propagation laws, the power
of an electromagnetic wave decreases inversely proportional to the square distance (21), being
the transmitted power. Finally, the second Shannon’s law (or Shannon-Hartley theorem) describes the capacity
of a wireless radio channel (17), with bandwidth
hertz. Now all this information may be put together and simplified to relate the distance between access point and base stations to the bitrate between both elements (30). Two constant parameters
and
are considered, whose value may be obtained from the physical scenario under study. It is important to note that we are considering the channel bandwidth and noise (an interferences) as time constant variables.
Now, we can formally define an aggregated function along the entire mobile base station trajectory, so we can optimize the resulting expression (31). Basically, we must find the sequence of values
, so the function
takes the maximum possible value. If the optimal trajectory is composed of only on point, the base station will be fixed. On the contrary, it will be mobile.
All access points must be served, so all of them must reach, at any moment, a minimum bitrate
. Besides, the base station trajectory may be open, i.e., the base station is not forced to return to the same point it starts moving. To solve this problem, we are using a Dynamic Time Warping (DTW) algorithm [
43,
44]. Other mechanisms for optimum path calculation have been reported, but DTW is a very computationally low-cost solution, which perfectly meets the real-time requirements of control loops and CPS. In this technology, it is calculated the optimal path between two points, so a global cost function is minimum (or maximum, in our case). Basically, the idea is, at each point, to select the position which adds the higher cost the aggregate function as the next step. Besides, next step must be next to the current position (mobile base stations are moving in a continuous trajectory). The cost of each point may be easily calculated using previous expressions (30). The resulting path is open, no return is obtained. However, it could be calculated using the same procedure in reverse. Algorithm 2 describes the proposed solution.
| Algorithm 2. Mobile Base Station Path Calculation Using DTW Technologies |
| Input: Reticula describing the coverage area and geographical distribution of access points |
| Output: Optimal base station trajectory |
| Create analysis reticula |
| for each point do |
| for each
do |
| Calculate and add value to |
| end for |
| end for |
| for each possible value of i do |
| for each possible value of j do |
| Obtain the maximum value in for the set of points |
| Add the point with maximum value to |
|
end for |
| end for |
3.4. Service Level: Service Catalogue Management
Finally, at service layer, in the main coordination center, all services are considered together. This center takes profit from 5G solutions based on virtualization technologies to dimension services, so the largest possible catalogue is deployed, but only essential services are totally guaranteed. Besides, the service configuration can be dynamically modified, according to the environmental situation.
We are assuming our system is able to provide a catalogue of services
(32), so each individual service
is characterized by four parameters (33): the code of the VNF to be executed
, the minimum number of access point where the service must be deployed
, the minimum number of service instances
and the service priority
.
Service priority is an integer number, so as higher the number, the priority goes down. Besides, service priority may be labeled as
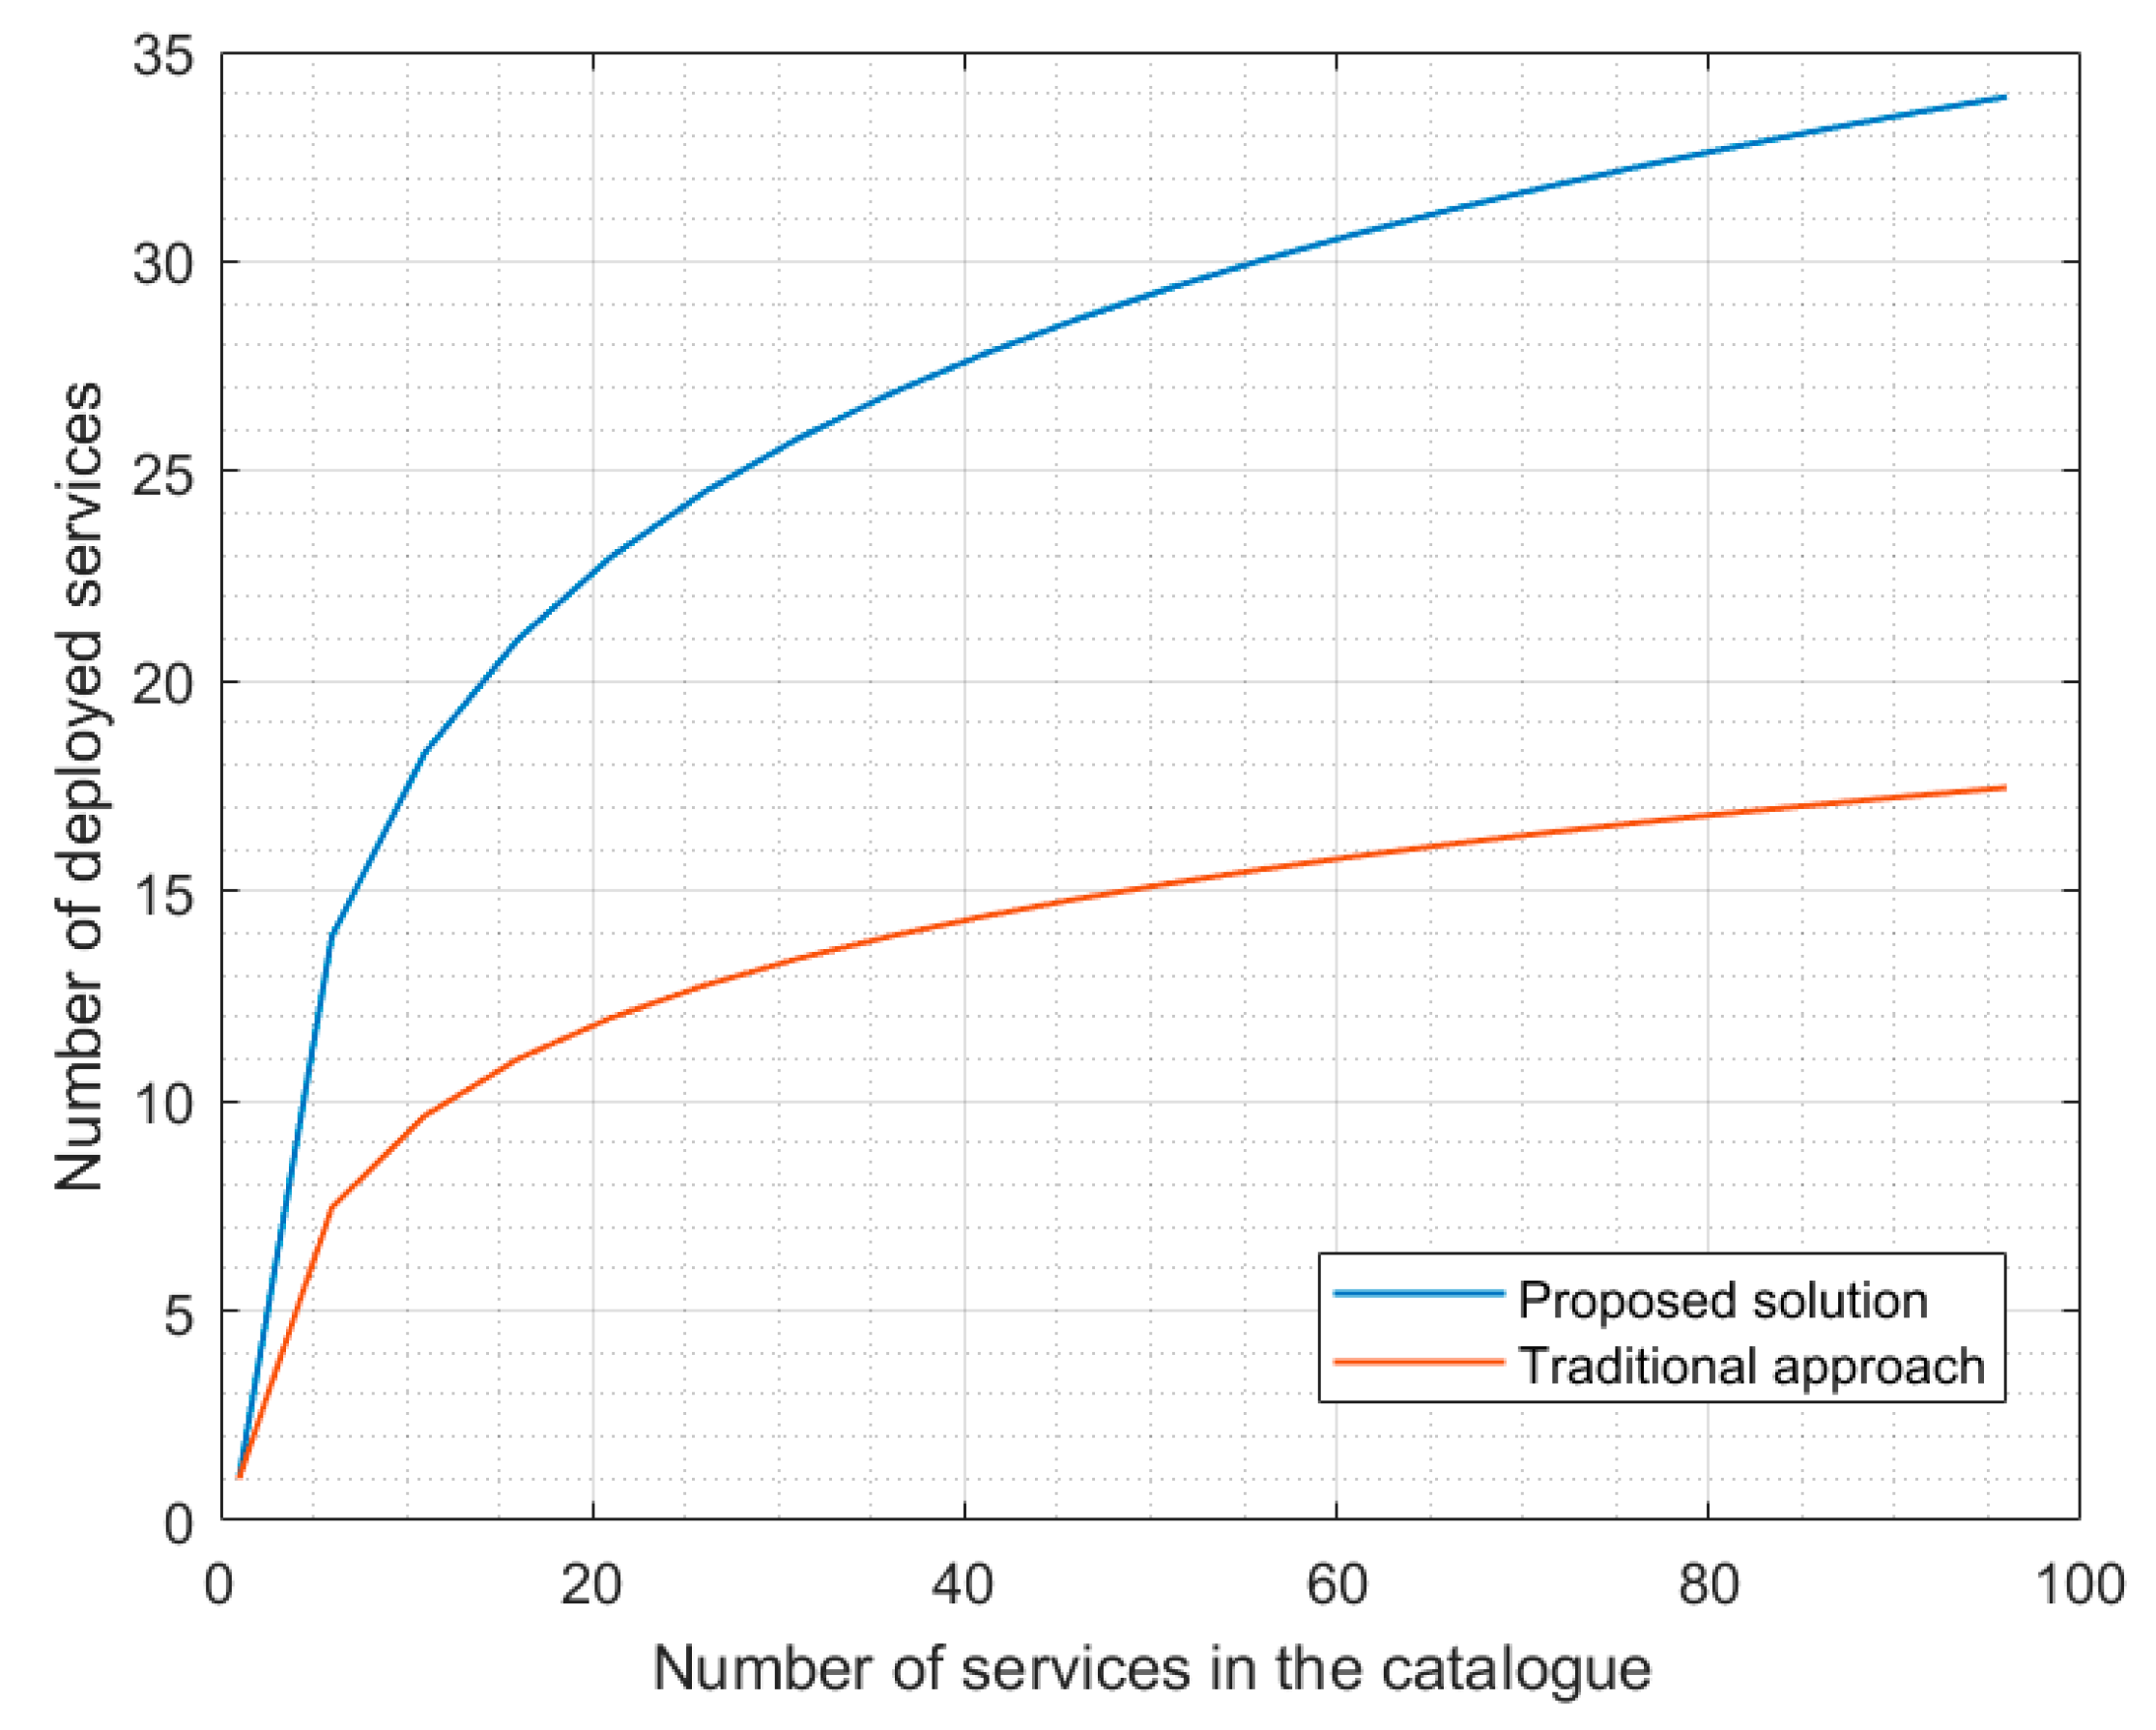
, indicating that is an essential service for ERT (34). The function we would like to maximize is the number of deployed services
. The main constrain to be considered is the available resources
in the network (35); being
the number of access points in the networks and
the number of service instances these points can support.
Then, to select what services are finally deployed and the amount of assigned resources, three main design principles are followed:
Essential services are guaranteed, and their resources are exclusively assigned, i.e., each essential service makes a network slice.
Services with any other priority are packet and may share resources, according to a reutilization parameter , which is related to the service priority: as priority is higher, the reutilization parameter is lower.
A strategic reservation of resources is done to address unexpected situations. This reservation includes a percentage of total available resources.
Then, the initial service deployment is made following these principles, and always deploying first services with a higher priority (see Algorithm 3).
| Algorithm 3. Initial Service Deployment |
| Input: Service catalogue and network resources |
| Output: Initial service deployment |
| Available access points are defined and equal to |
| Available service instances are defined and equal to |
| Update |
| Update |
| for each service in the service catalogue do |
| if
|
| if
|
| Deploy service with resources |
| Update |
| Update |
| else |
| Obtain |
| Deploy service with resources |
| Update |
| Update |
| end if |
| end for |
| Algorithm 4. Service Reconfiguration Process |
| Input: Networks alarms |
| Output: Service redistribution |
| if then |
| for each service referred in do |
| if is the lowest among deployed services then |
| is removed |
| else |
| Look for service so |
| if
then |
| Resources of are fixed to |
| Increment resources of in units |
| else |
| is removed |
| Increment resources of in units |
| end if |
| if then |
| Increment resources of in units |
| end if |
| end if |
| end for |
| else |
| for each service do |
| if then |
| Resources of are fixed to |
| end if |
| Run the service deployment procedure |
| end for |
| end if |
After the initial service deployment proposal, the main coordination center monitors the service performance. If from network level no alarm is received in network reports, it is assumed services are running adequately, and no action is taken. However, if alarms are received, a resource redistribution is required. In particular, congested services need more resources. If services with lower priority are deployed, they are cancelled or reduced, so their resources are assigned to the congested service. If no service with lower priority is deployed, the congested service is cancelled. Only essential services can obtain resources from the strategic reservation if they are congested. This assignment is, any case, temporary. Besides, periodically, services with assigned resources above the minimum are modified to reduce their resources, so new services can be deployed. Essential services do not participate from this periodical revision process. Algorithm 4 shows this reconfiguration process.


