Reinforcement Learning Based Passengers Assistance System for Crowded Public Transportation in Fog Enabled Smart City


Abstract
:1. Introduction
Motivation and Goals
- To assist the passengers in finding less crowded and most suitable transportation points at a particular instant of time.
- To minimize the waiting and traveling time of the passengers by maximizing the reward in the proposed RL model.
- To minimize the service time and data transmission latency in the fog computing environment.
2. Related Works
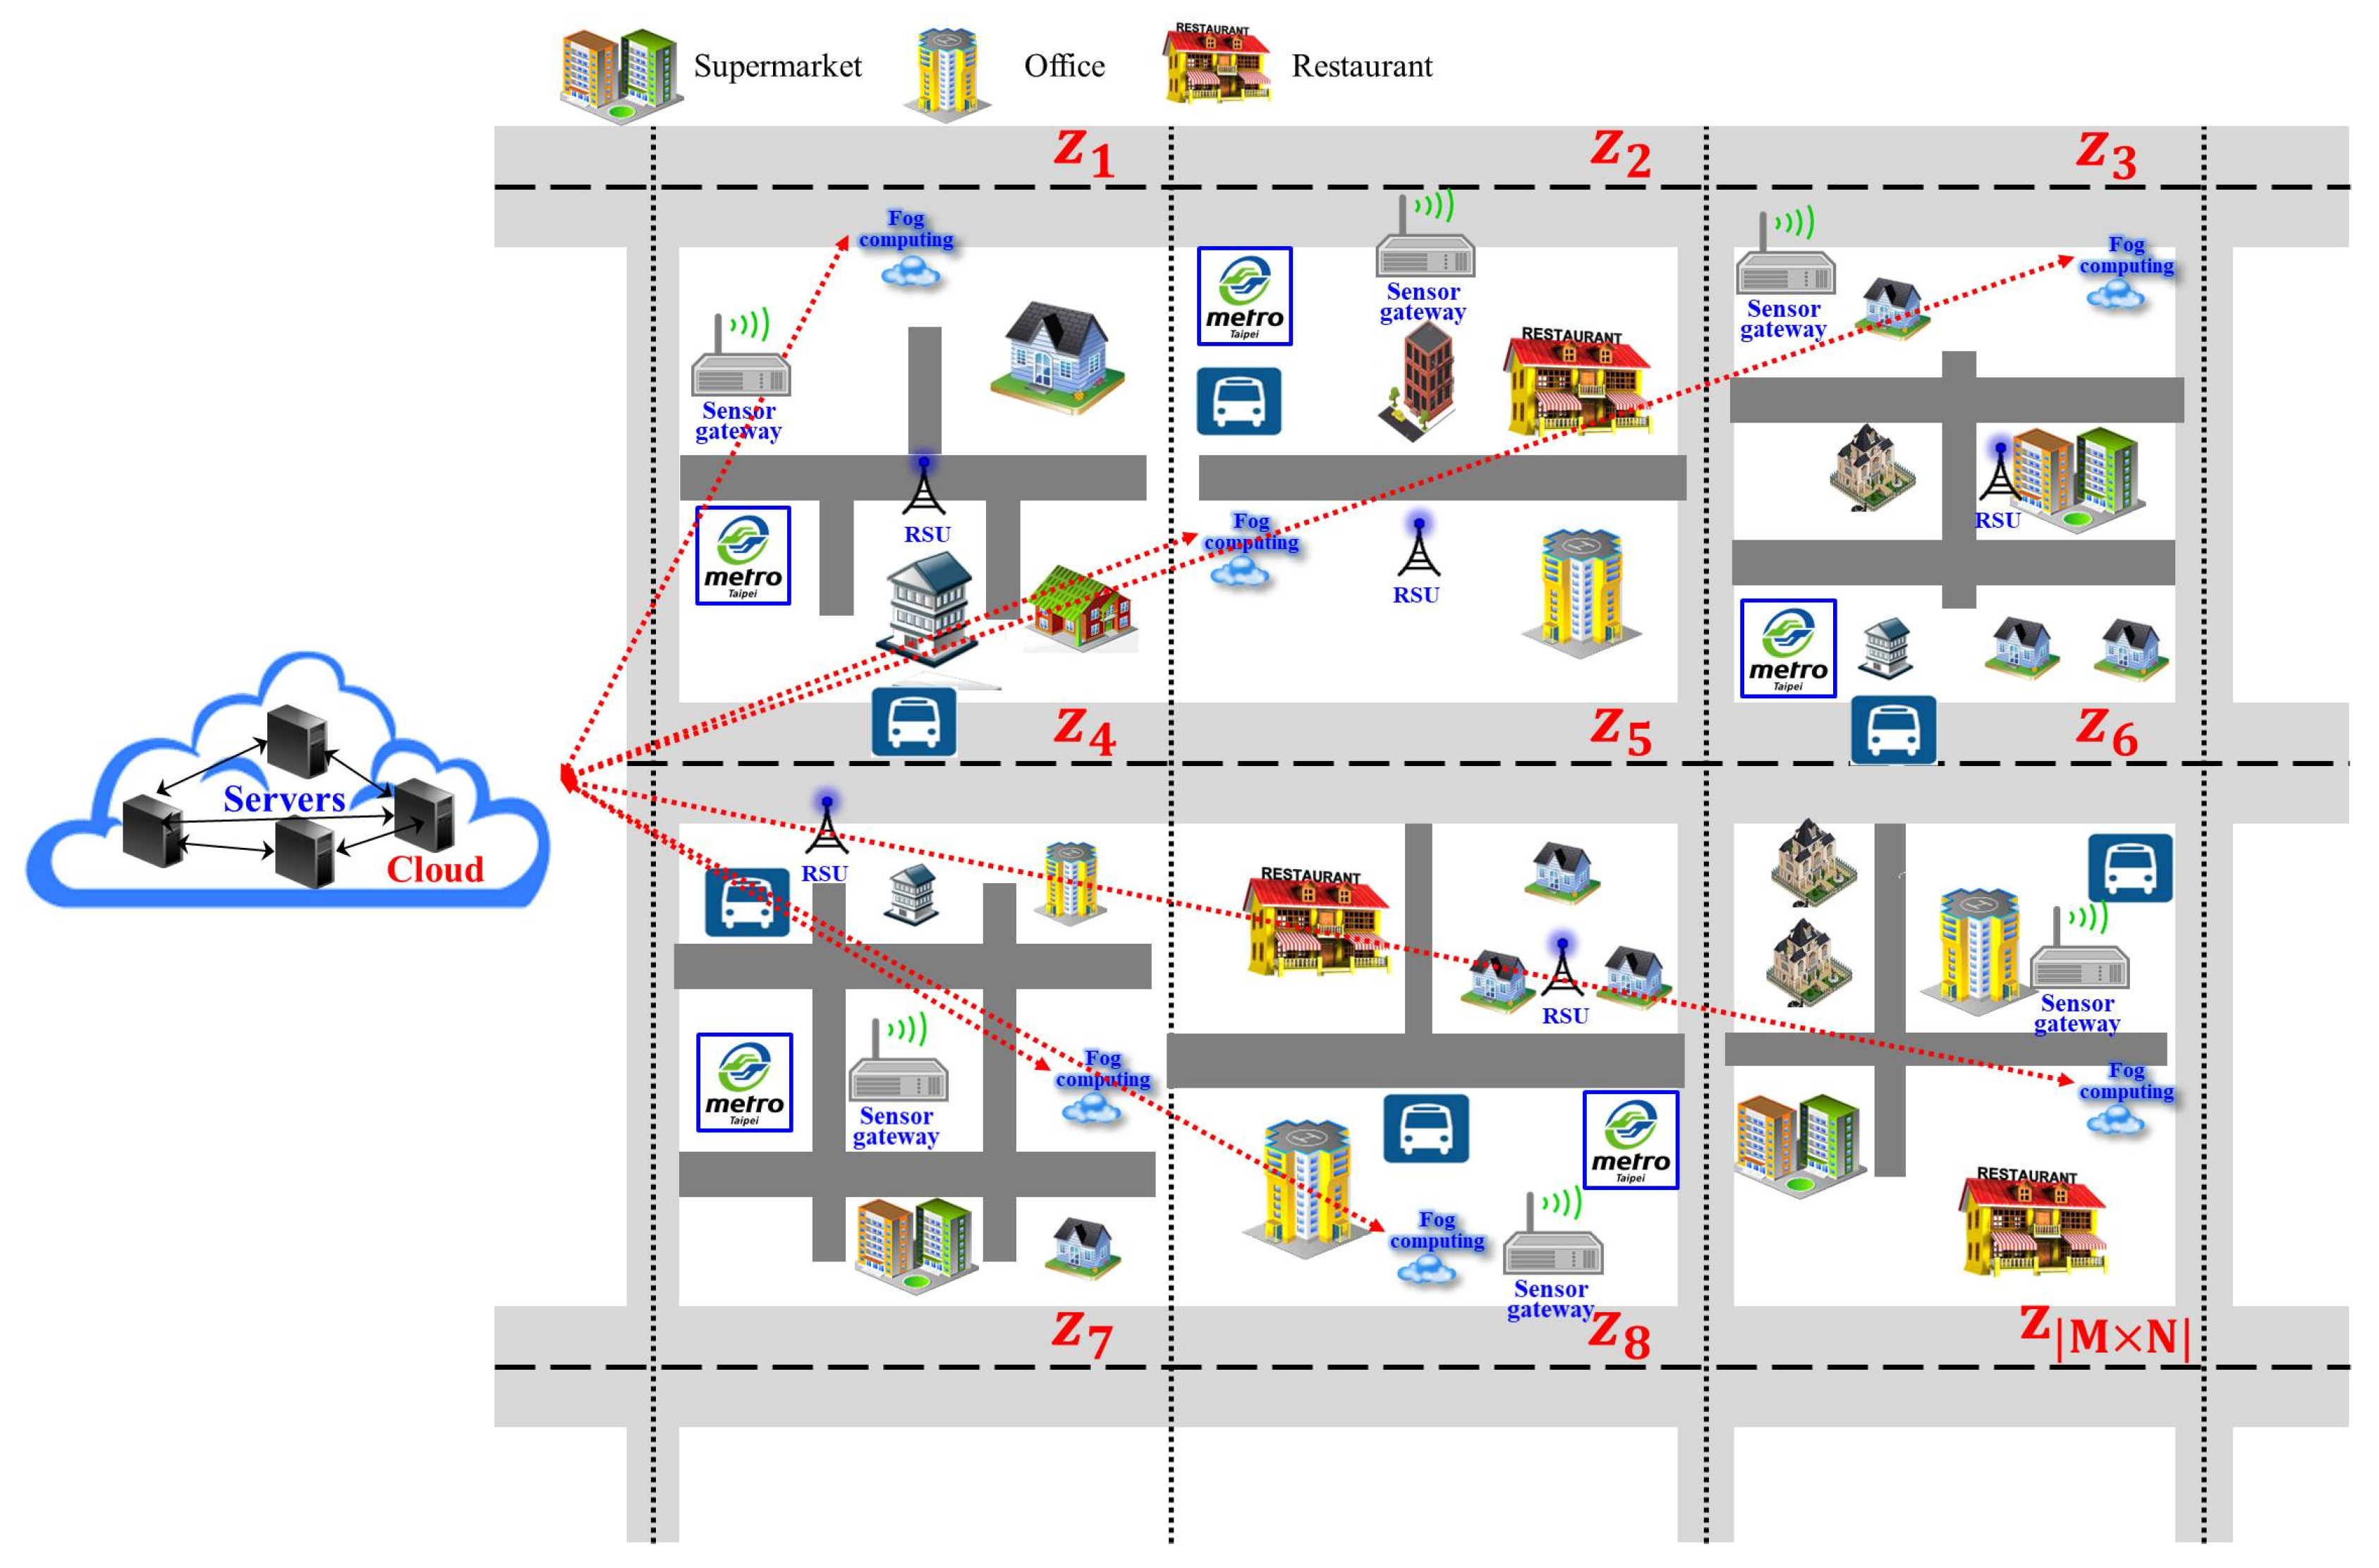
3. System Model
3.1. Data Collection Phase
3.2. Data Analysis Phase
3.3. Objective Function
3.3.1. Passenger Waiting Time
3.3.2. Context Awareness at Stations
- EventsAn event around the station environment is detected by IoT devices installed in and around the station. Events can be of organized programs like concerts by the popular stars, while unorganized hazardous events like bomb blasts lead to blocking the stations with overcrowded passengers. Thus, IoT devices detect the events and store the event information of a station in binary values as illustrated in Equation (3).where if any unpredictable crowding situation occurs, otherwise .
- Passenger DensityThe passenger density is determined by the inflow and outflow of passengers at a particular station. The passenger crowding is occurred in the stations having more than one transit platforms where passenger transits from one metro train to another by changing the platform within station. Alongside, the passengers aligning from other transportation change to the nearest stations, and the passengers exit from the station. The following Equation (4) describes constraints for large passenger density l or crowding at the station .The inflow of passengers at a station leads to huge crowds. It is the summation of total number of passengers arriving from different station and departing from the current station as given in Equation (5). Passengers who are waiting in a station may board or wait for the next bus or train as represented in Equation (7).
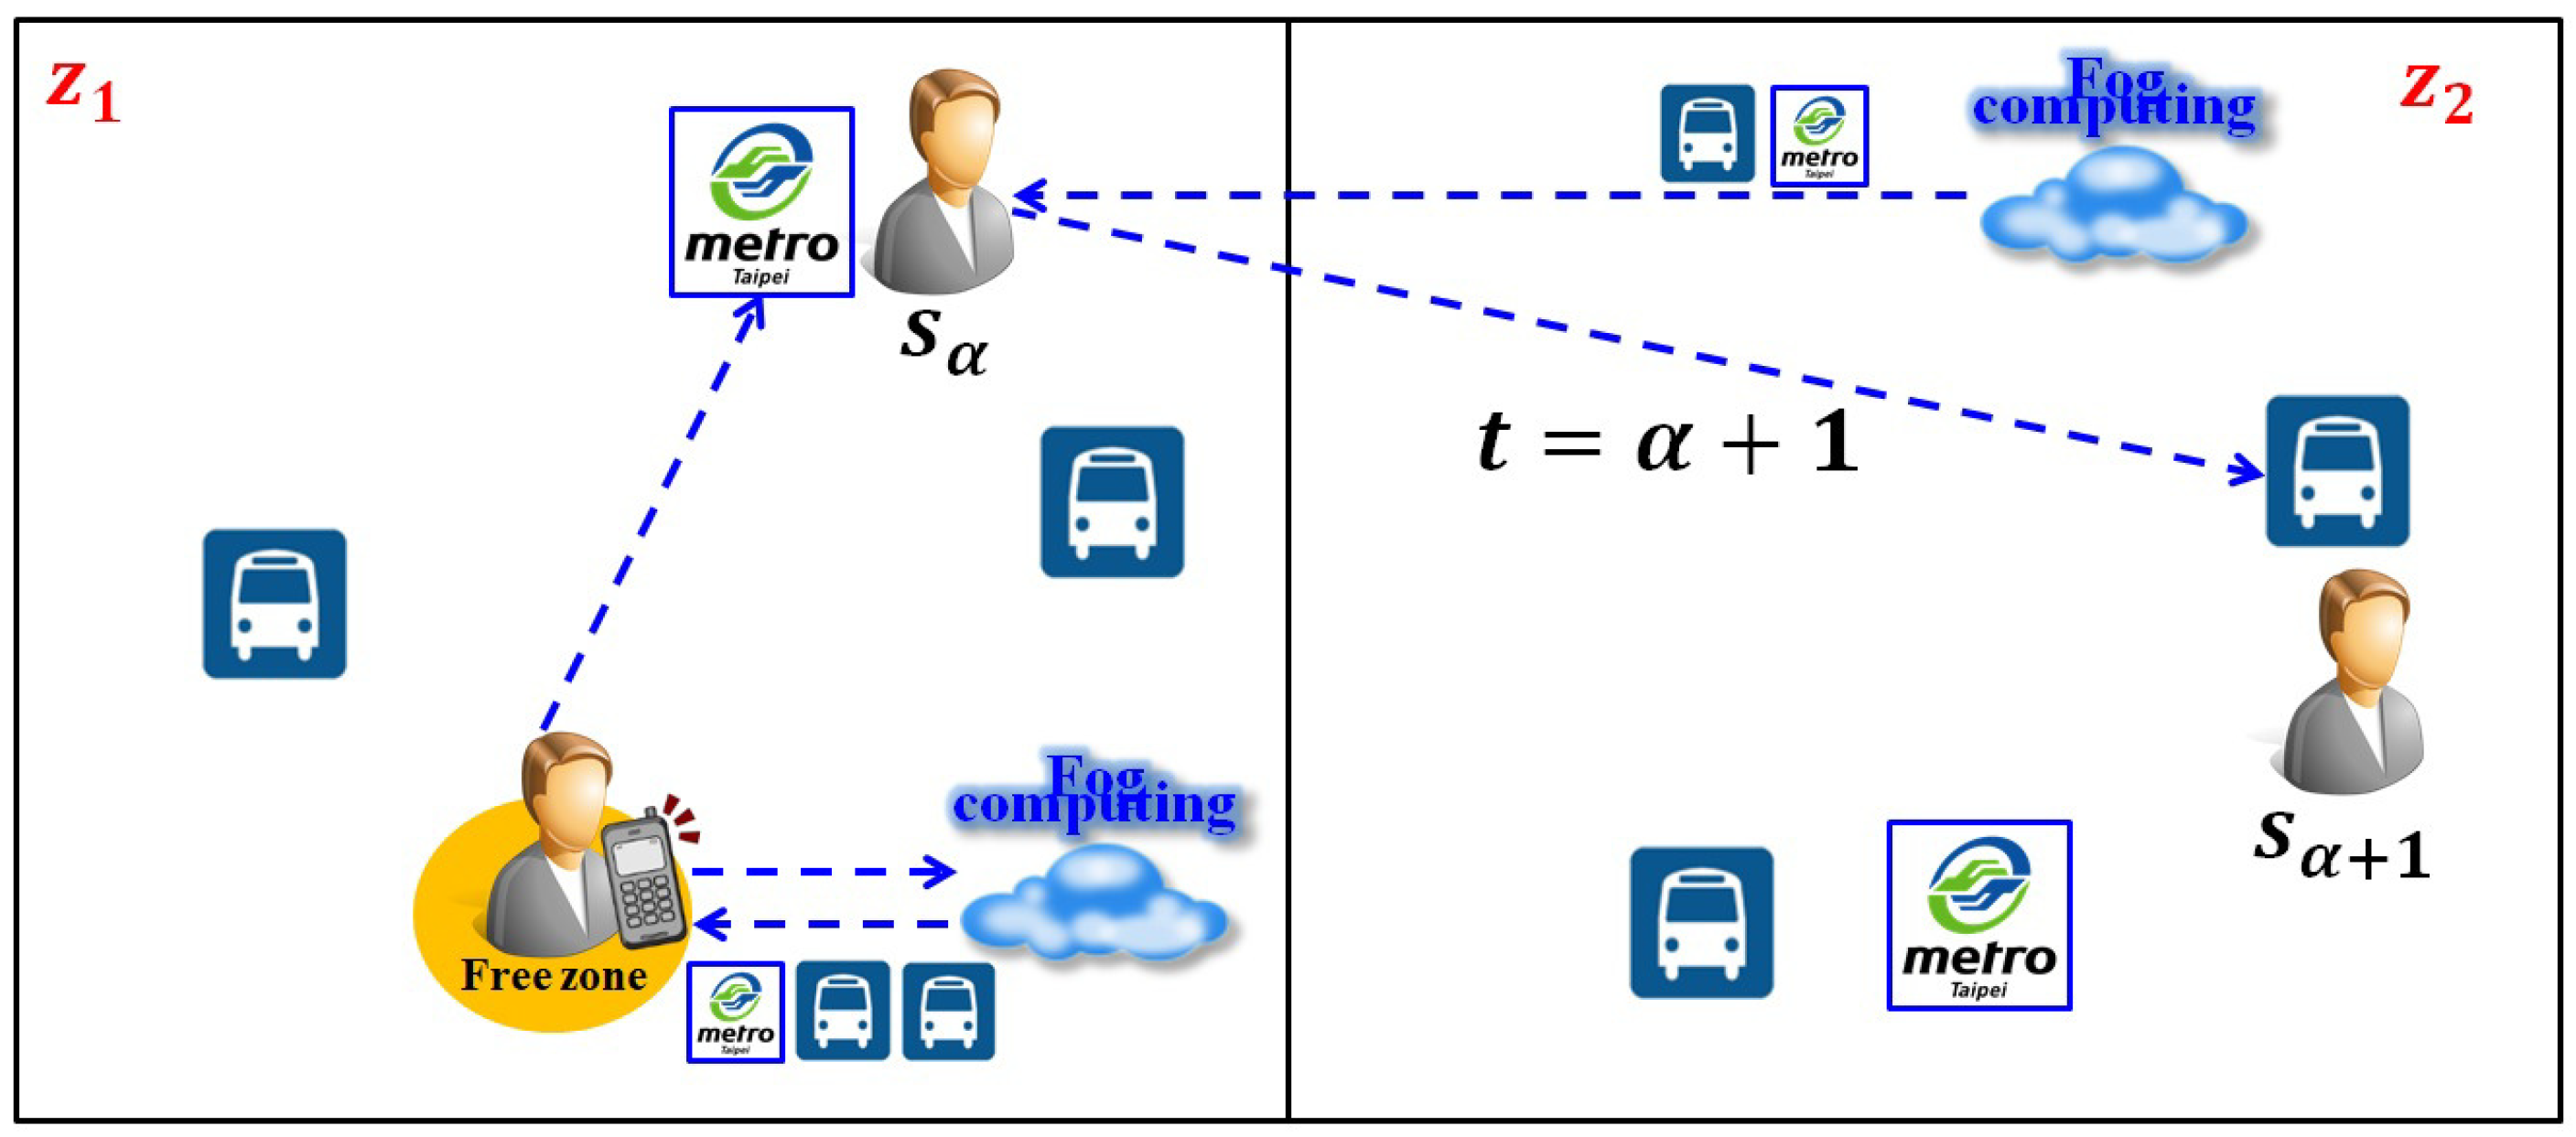
4. Reinforcement Learning Based Passenger’s Assistance System
4.1. State
4.2. Action
4.3. Reward
4.4. Reinforcement Learning Algorithm
| Algorithm 1 Prediction of suitable transportation point |
For passenger Input: Passenger request Parameter: Event , passenger density Process: 1:Agent send a request: 2:Fog node receive () 3:Check station nearby 4: IF TRUE 5: Check station 6: FOR each station 7: DO 8: 9: IF TRUE () 10: Predict and send suitable transportation point () 11: Agent select the transportation point () 12: Else 13: Fog node search for other possible 14:END |
| Algorithm 2 Selection of most suitable transportation system |
Input: Total visited stations h, Total number of metros or buses I, Passenger waiting time Parameter: Alpha , , Policy Process: 1:For episode 1 to M do 2:Initialize state or /based on Algorithm 1 3:Repeat for each step of episode 4:Choose action a 5: Calculate (using Boltzman-Distributed Exploration [33]) 6: Take an action a based on 7:Observe 8:Calculate Reward r (Equation (14)) 9:Calculate 10:Update 11: 12:Until 13:END |
4.5. Service Time Latency Minimization
5. Performance Evaluation
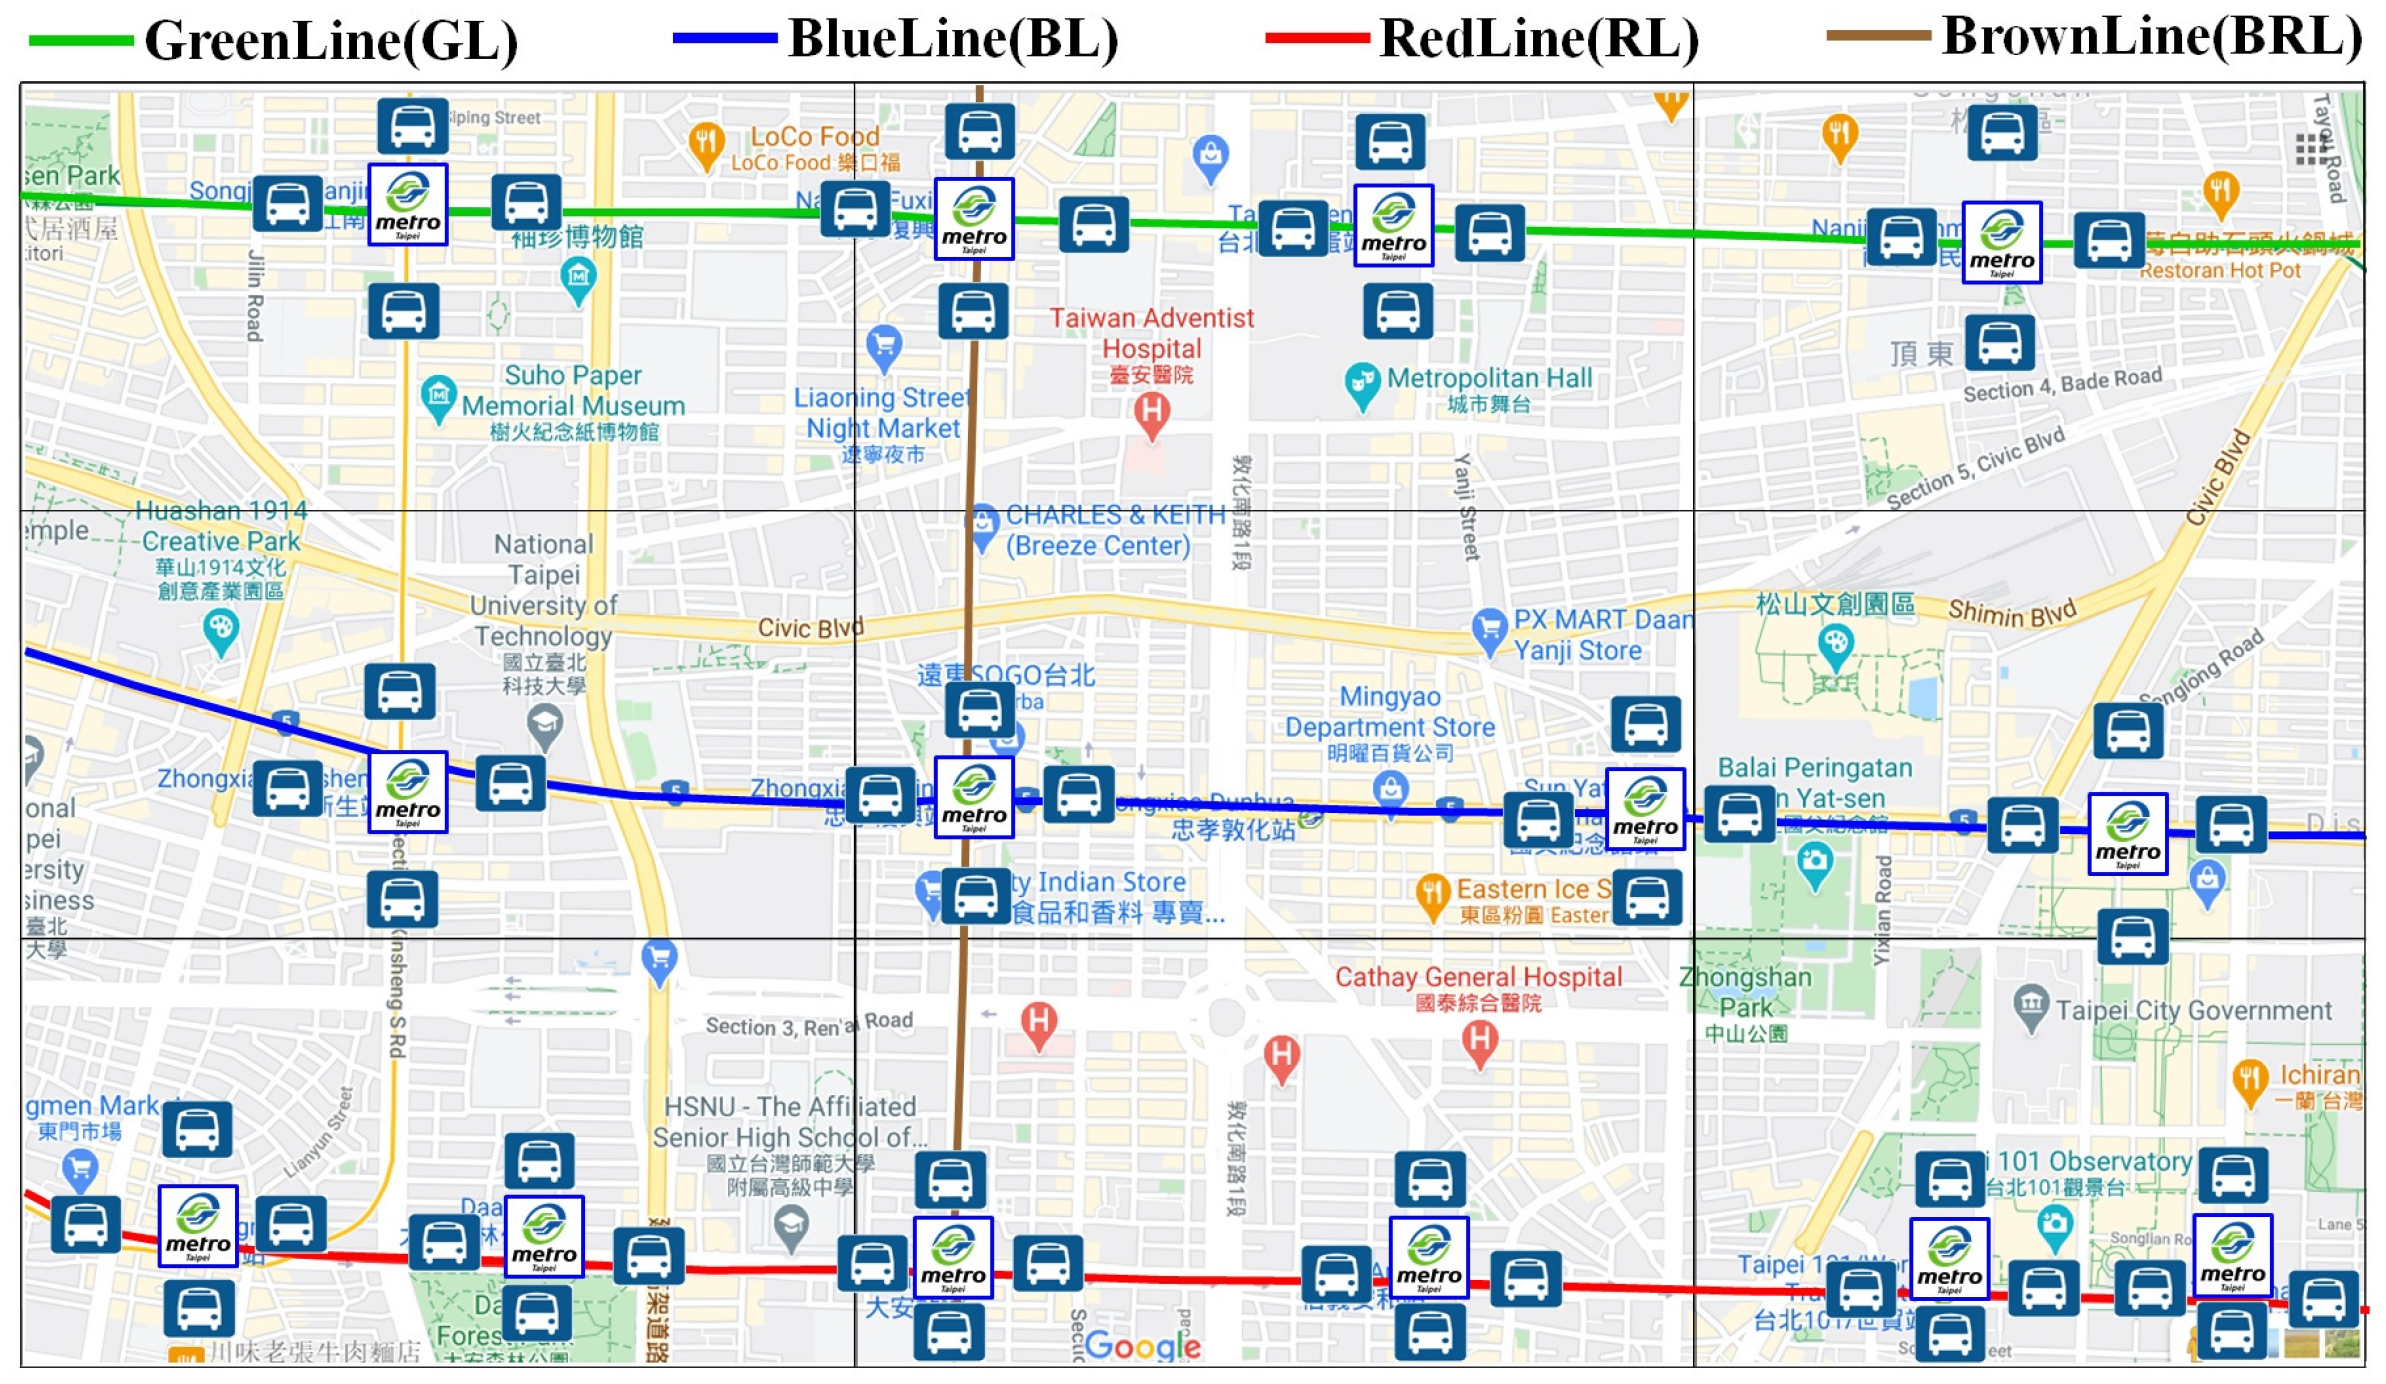
5.1. Simulation Environment
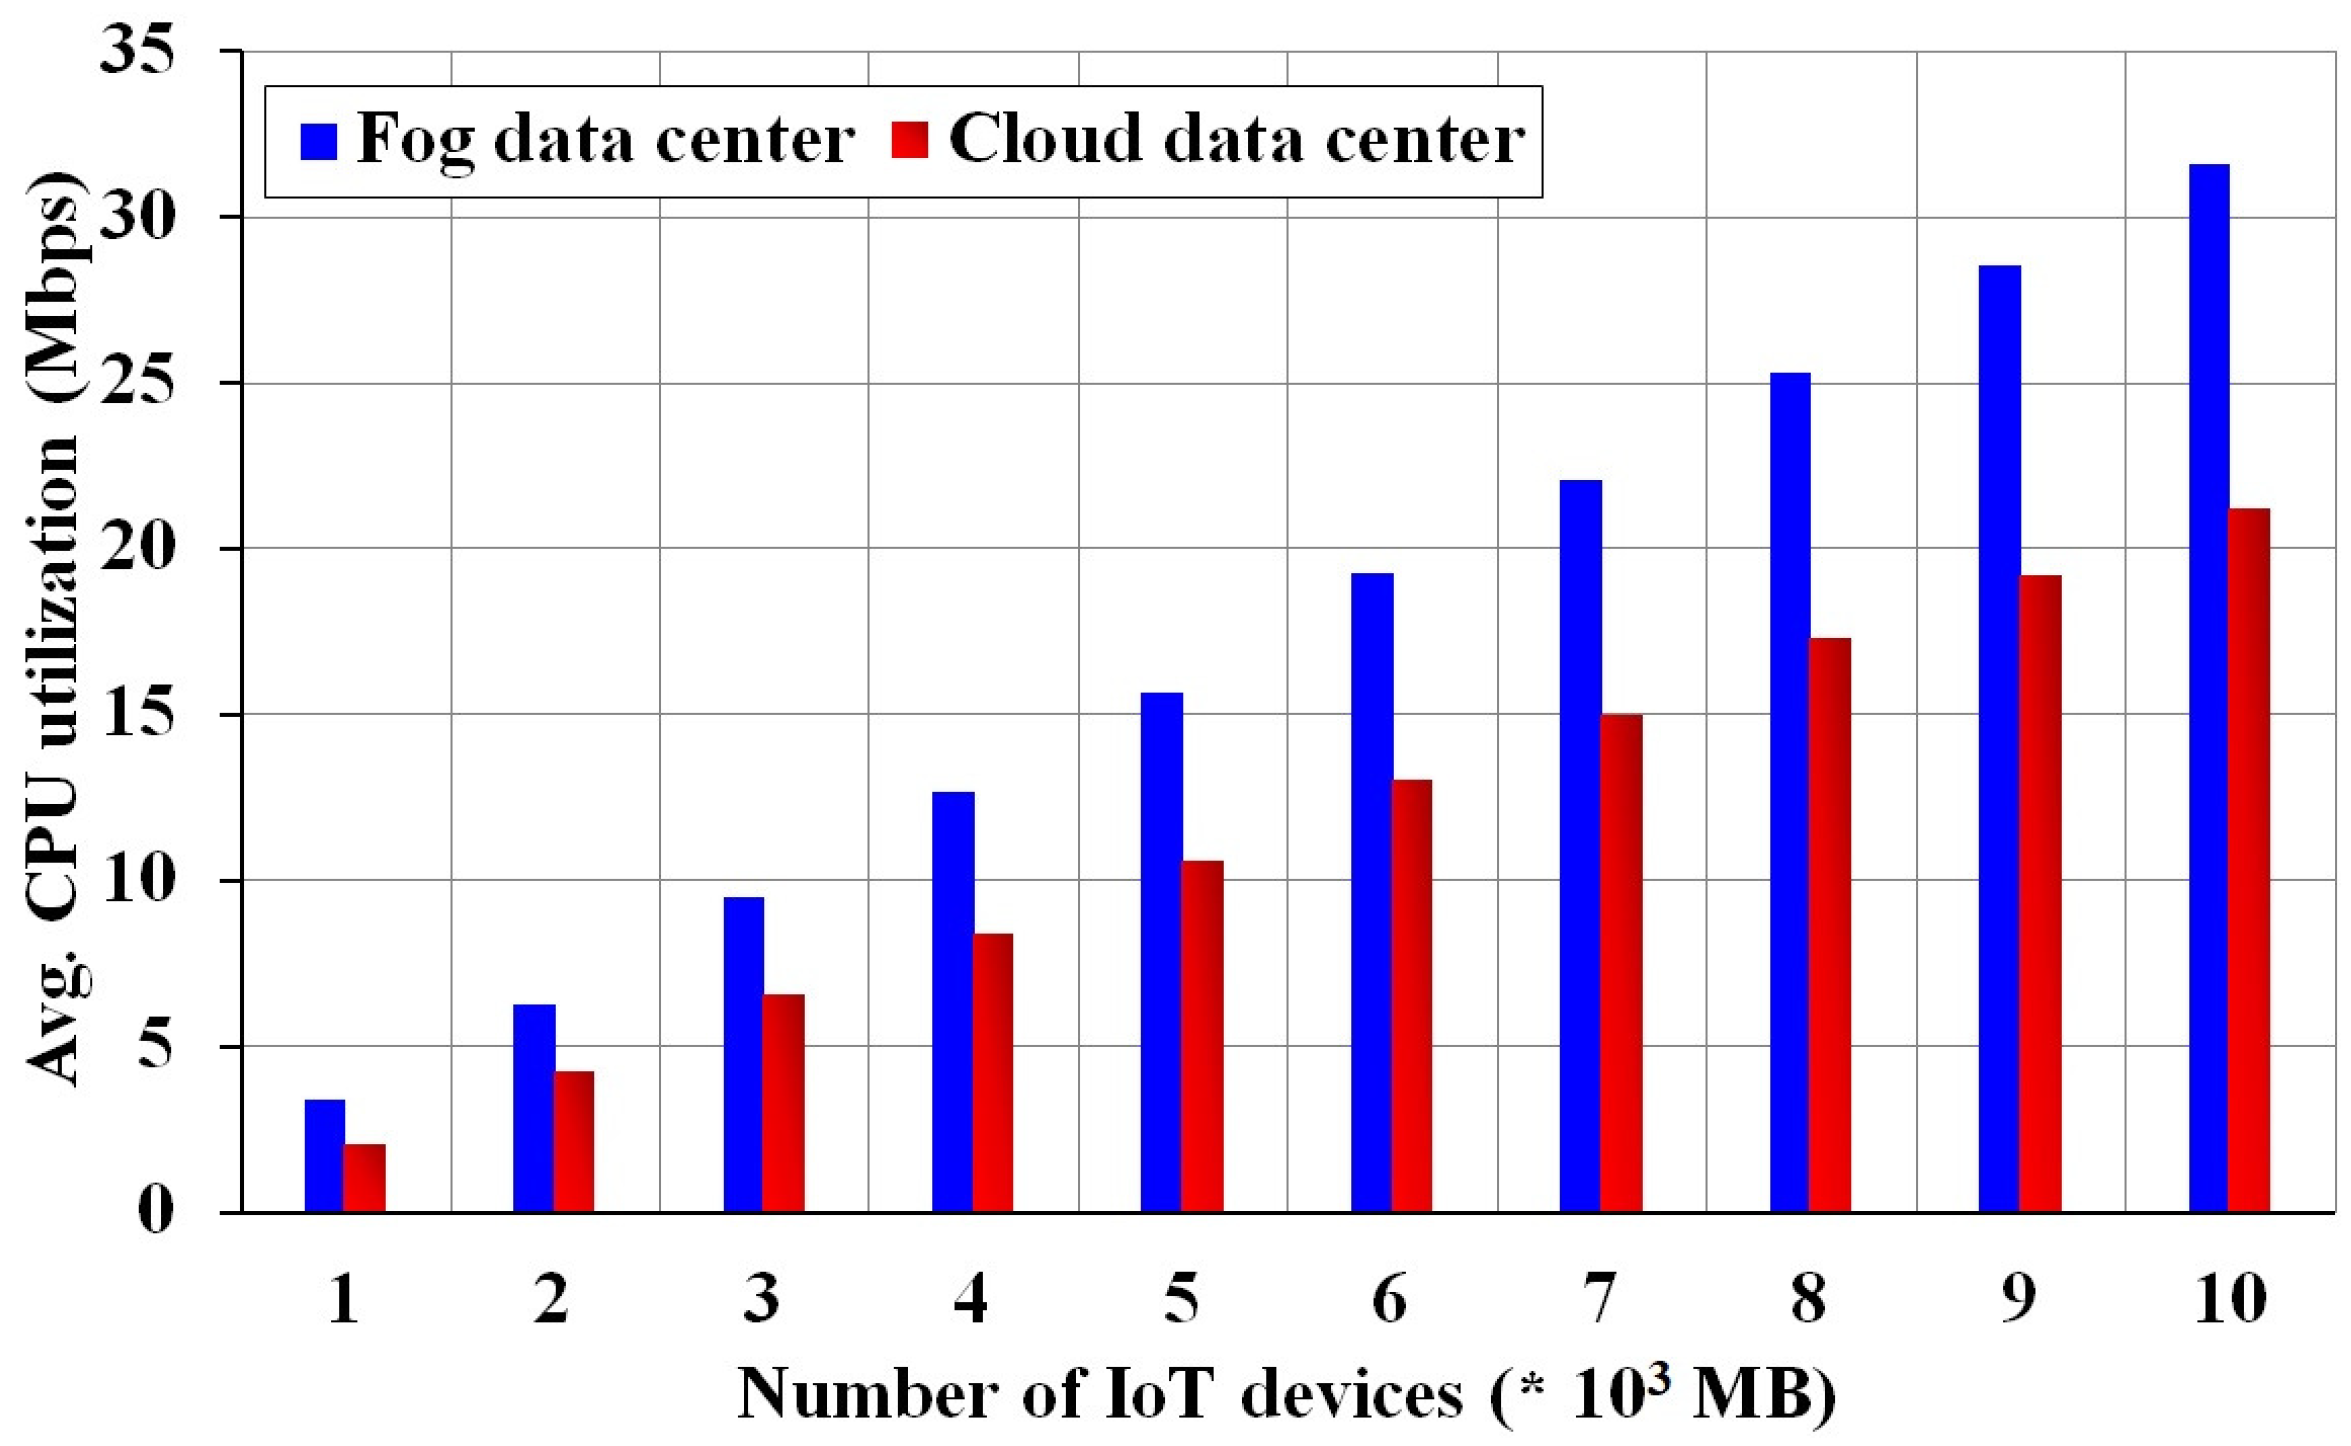
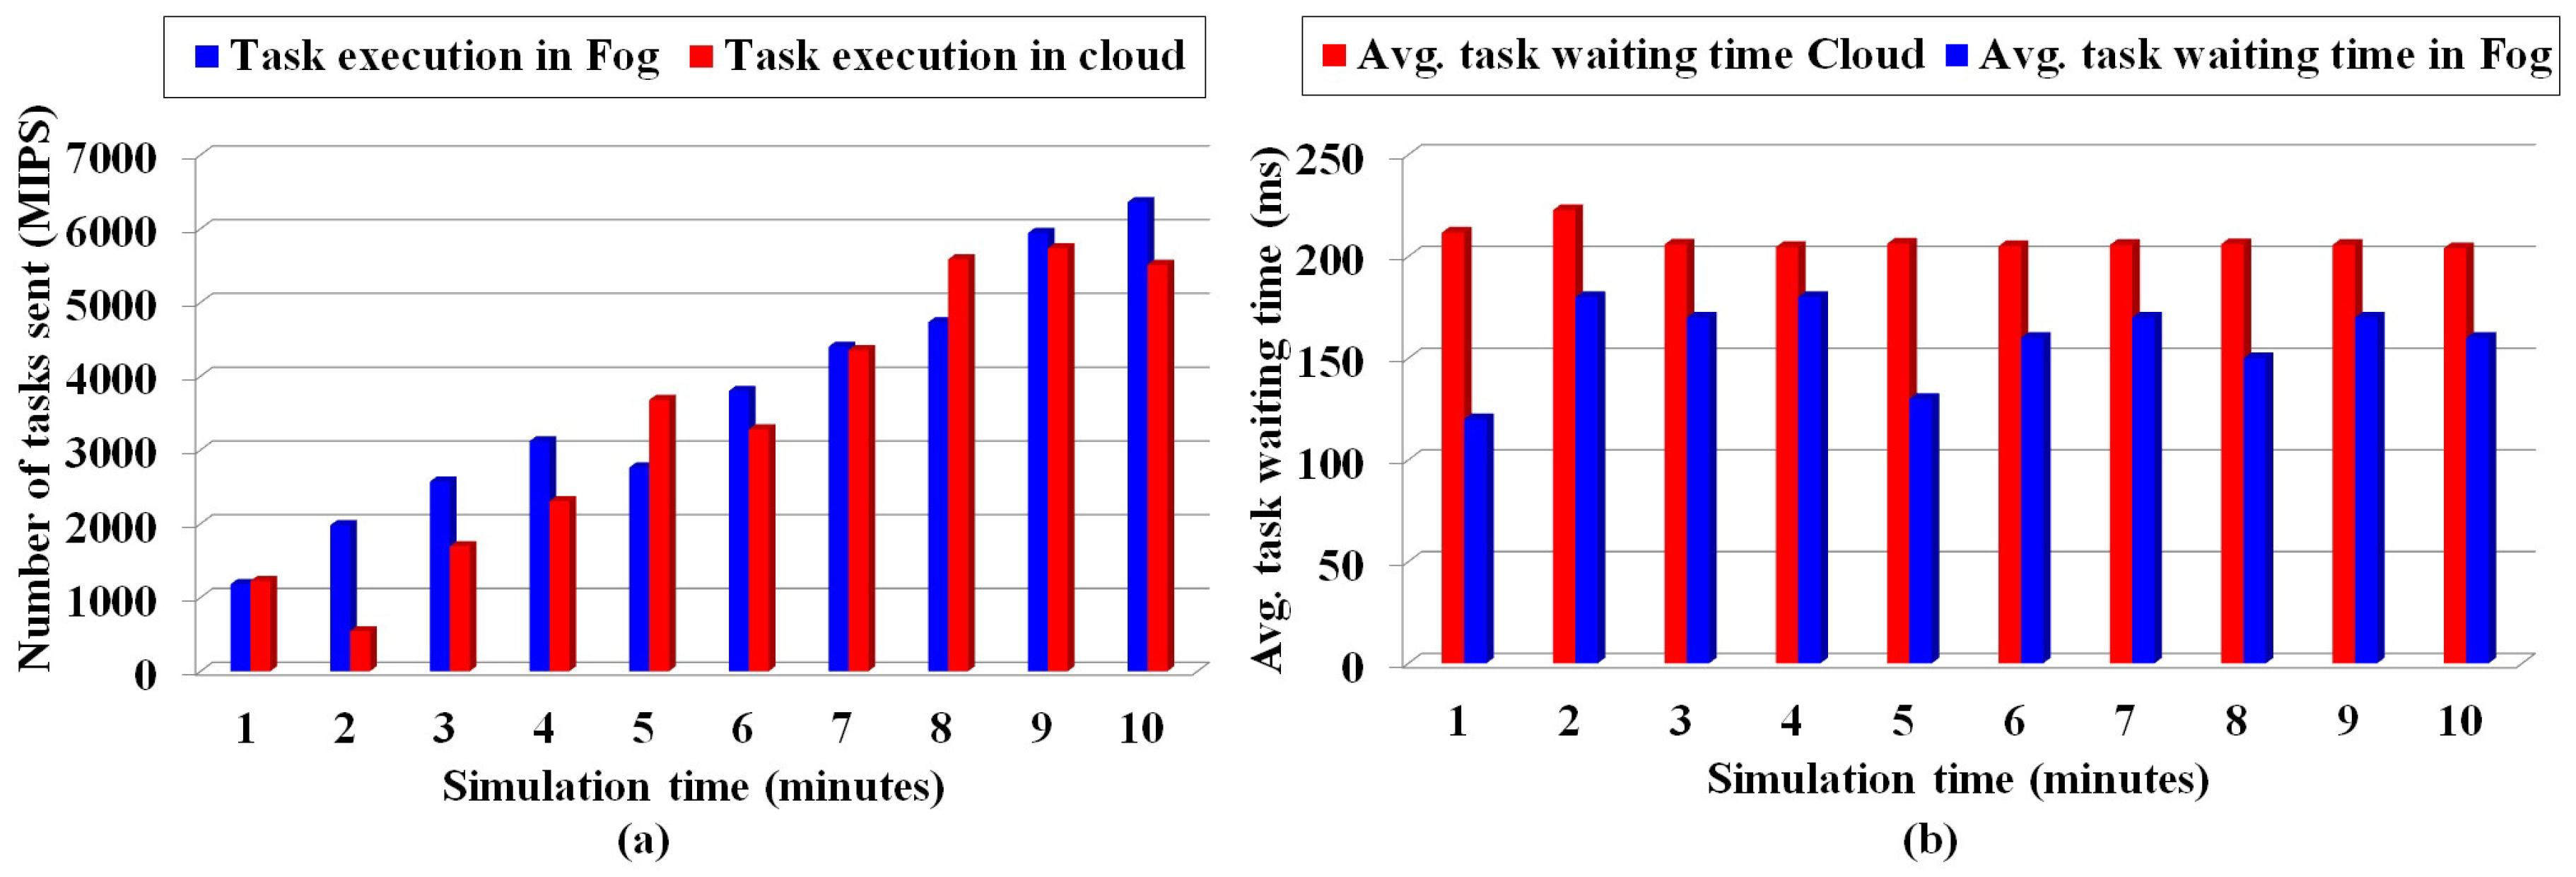
5.2. Simulation Results: Fog Computing
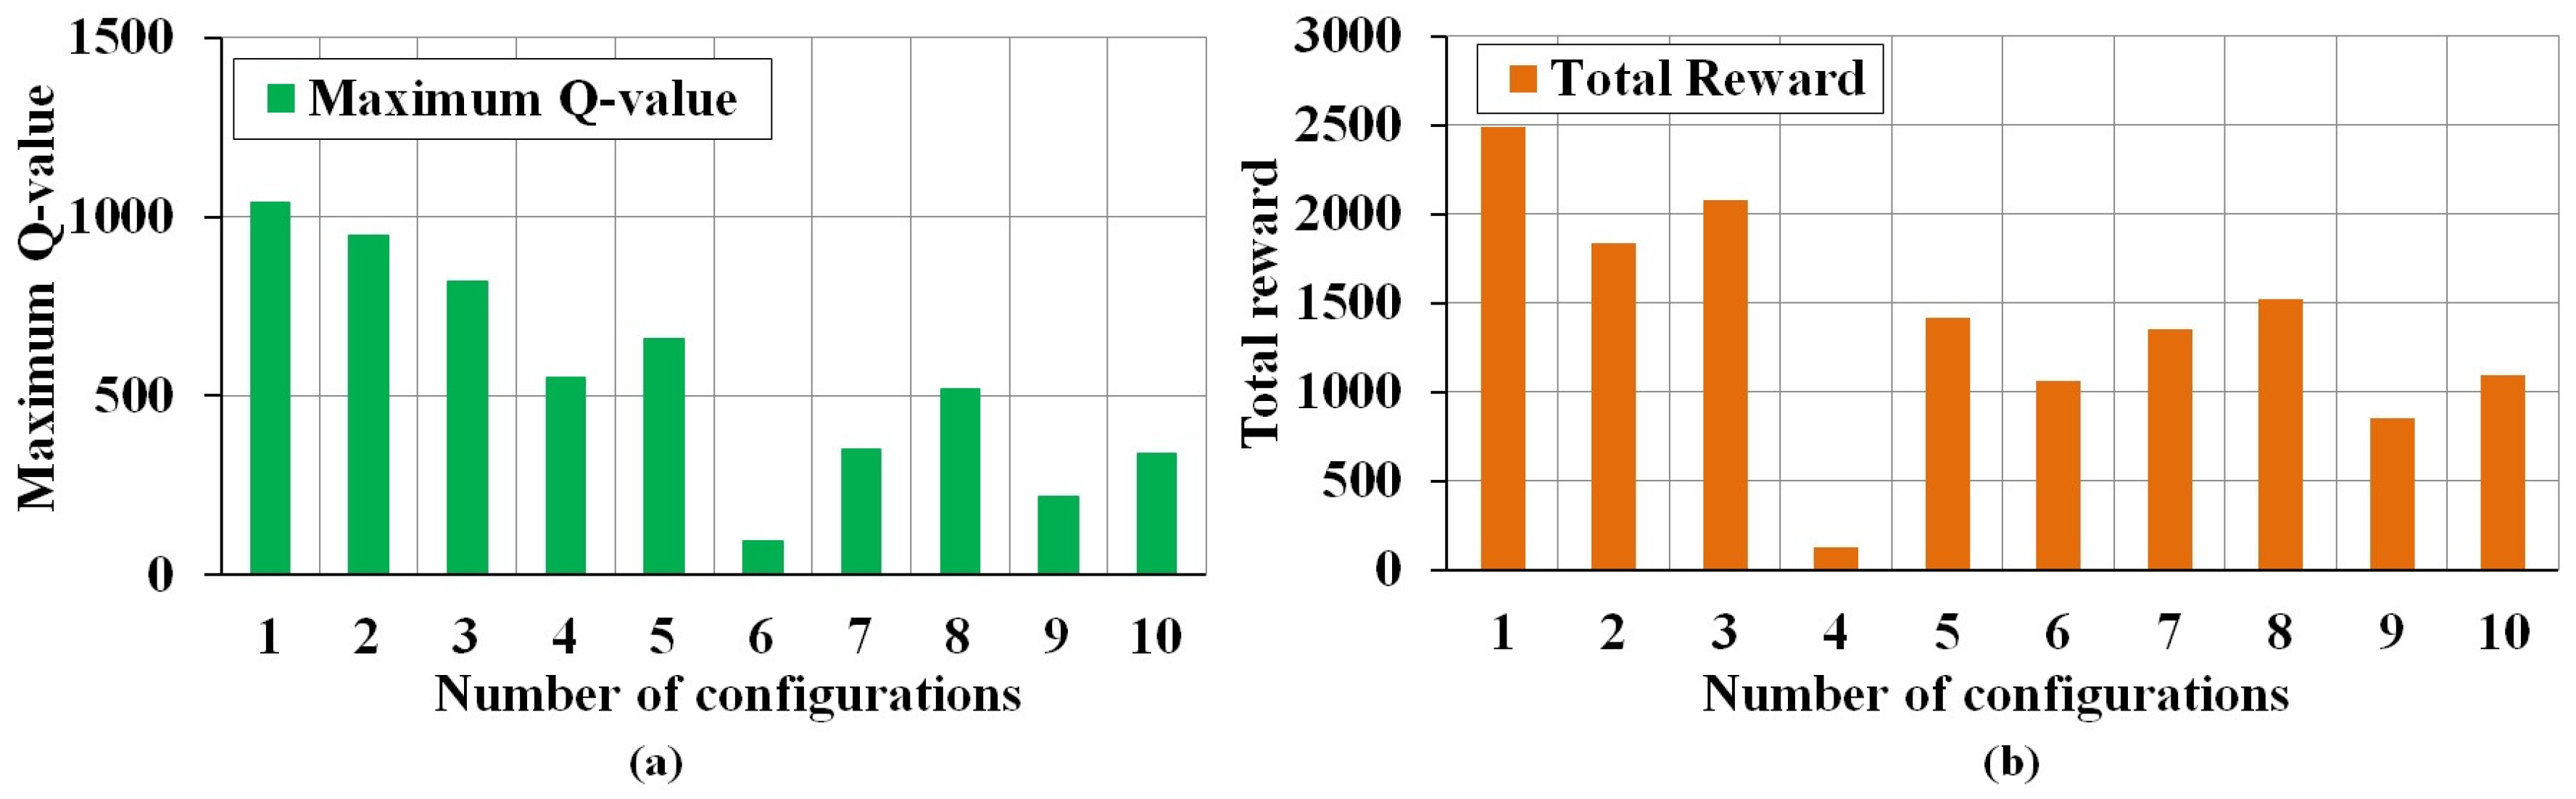
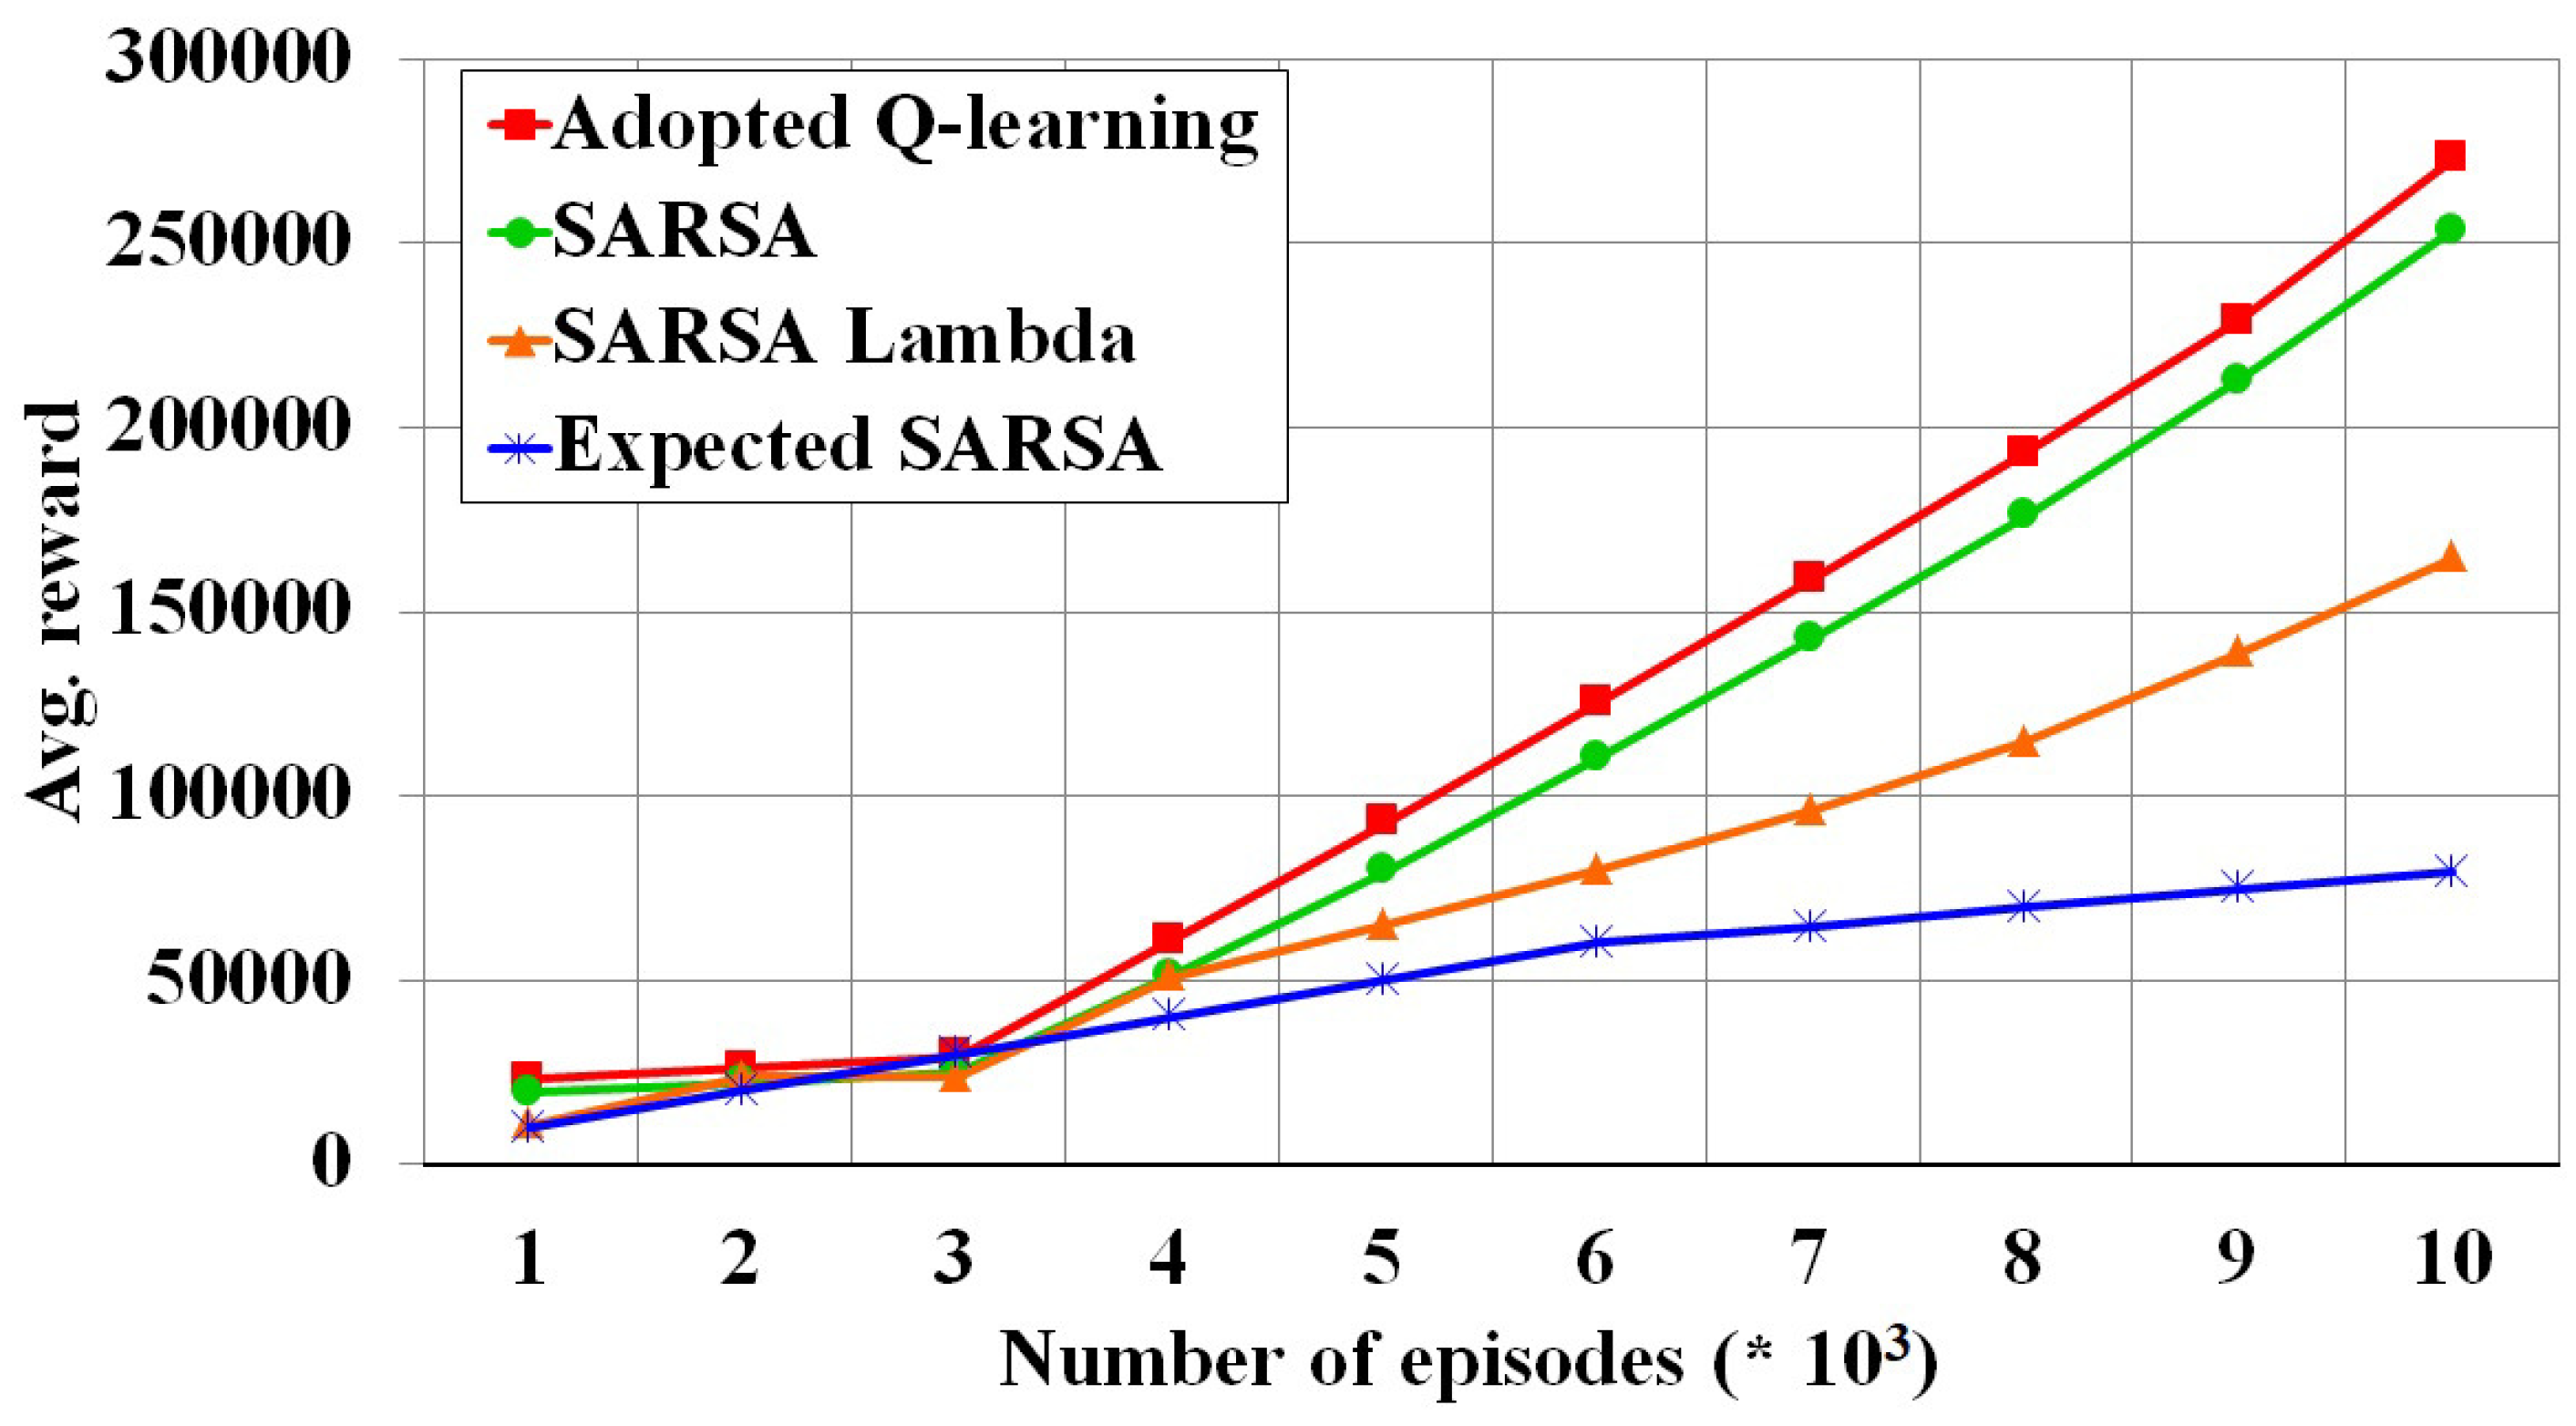
5.3. Simulation Results: Reinforcement Learning
6. Conclusions
Author Contributions
Funding
Acknowledgments
Conflicts of Interest
References
- World Urbanization Prospects, The 2018 Revision. Available online: https://population.un.org/wup/Publications/Files/WUP2018-KeyFacts.pdf (accessed on 18 May 2019).
- Wang, T.; Hussain, A.; Bhutta, M.N.M.; Cao, Y. Enabling bidirectional traffic mobility for ITS simulation in smart city environments. Future Gener. Comput. Syst. 2019, 92, 342–356. [Google Scholar] [CrossRef]
- Jung, C.R.; Chung, W.T.; Chen, W.T.; Lee, R.Y.; Hwang, B.F. Long-term exposure to traffic-related air pollution and systemic lupus erythematosus in Taiwan: A cohort study. Sci. Total Environ. 2019, 668, 342–349. [Google Scholar] [CrossRef] [PubMed]
- Shi, X.; Shao, X.; Guo, Z.; Wu, G.; Zhang, H.; Shibasaki, R. Pedestrian trajectory prediction in extremely crowded scenarios. Sensors 2019, 19, 1223. [Google Scholar] [CrossRef] [PubMed] [Green Version]
- Department of Tranportation, Taipei City Governament. Available online: https://english.dot.gov.taipei/News.aspx (accessed on 28 April 2019).
- Xiao, Z.; Dai, X.; Jiang, H.; Wang, D.; Chen, H.; Yang, L.; Zeng, F. Vehicular Task Offloading via Heat-Aware MEC Cooperation Using Game-Theoretic Method. IEEE Internet Things J. 2019, 7, 2038–2052. [Google Scholar] [CrossRef]
- Wang, D.; Fan, J.; Xiao, Z.; Jiang, H.; Chen, H.; Zeng, F.; Li, K. Stop-and-wait: Discover aggregation effect based on private car trajectory data. IEEE Trans. Intell. Transp. Syst. 2018, 20, 3623–3633. [Google Scholar] [CrossRef]
- Lin, C.; Zhao, G.; Yu, C.; Wu, Y.J. Smart City Development and Residents’ Well-Being. Sustainability 2019, 3, 676. [Google Scholar] [CrossRef] [Green Version]
- Singh, S.P.; Nayyar, A.; Kumar, R.; Sharma, A. Fog computing: From architecture to edge computing and big data processing. J. Supercomput. 2019, 4, 2070–2105. [Google Scholar] [CrossRef]
- Transit Crowdedness Trends From Around the World, According to Google Maps. Available online: https://www.blog.google/products/maps/transit-crowdedness-trends-around/ (accessed on 23 August 2020).
- Costa, D.G.; Duran-Faundez, C. Open-Source Electronics Platforms as Enabling Technologies for Smart Cities: Recent Developments and Perspectives. Electronics 2018, 7, 404. [Google Scholar] [CrossRef] [Green Version]
- Cui, X.; Huang, X.; Ma, Y.; Meng, Q. A load balancing routing mechanism based on SDWSN in smart city. Electronics 2019, 8, 273. [Google Scholar] [CrossRef] [Green Version]
- Hossain, M.S.; Muhammad, G. Environment classification for urban big data using deep learning. IEEE Commun. Mag. 2018, 56, 44–50. [Google Scholar] [CrossRef]
- Franke, T.; Lukowicz, P.; Blanke, U. Smart crowds in smart cities: Real life, city scale deployments of a smartphone based participatory crowd management platform. J. Internet Serv. Appl. 2015, 6, 27. [Google Scholar] [CrossRef] [Green Version]
- Liao, Y.; Zhang, J.; Wang, S.; Li, S.; Han, J. Study on Crash Injury Severity Prediction of Autonomous Vehicles for Different Emergency Decisions Based on Support Vector Machine Model. Electronics 2018, 7, 381. [Google Scholar] [CrossRef] [Green Version]
- Malik, S.; Ahmad, S.; Kim, B.W.; Park, D.H.; Kim, D. Hybrid Inference Based Scheduling Mechanism for Efficient Real Time Task and Resource Management in Smart Cars for Safe Driving. Electronics 2019, 7, 344. [Google Scholar] [CrossRef] [Green Version]
- Goh, C.G.; Lim, W.H.; Chua, J.; Atmosukarto, I. Image Analytics for Train Crowd Estimation. In Proceedings of the 2018 Digital Image Computing: Techniques and Applications (DICTA), Canberra, Australia, 10–13 December 2018. [Google Scholar]
- Liu, L.; Chang, Z.; Guo, X.; Mao, S.; Ristaniemi, T. Multiobjective optimization for computation offloading in fog computing. IEEE Internet Things J. 2018, 5, 283–294. [Google Scholar] [CrossRef]
- Neto, A.J.; Zhao, Z.; Rodrigues, J.J.; Camboim, H.B.; Braun, T. Fog-based crime-assistance in smart iot transportation system. IEEE Access 2018, 6, 11101–11111. [Google Scholar] [CrossRef]
- Lai, Y.; Yang, F.; Zhang, L.; Lin, Z. Distributed public vehicle system based on fog nodes and vehicular sensing. IEEE Access 2018, 6, 22011–22024. [Google Scholar] [CrossRef]
- He, Y.; Ni, J.; Niu, B.; Li, F.; Shen, X.S. Privacy-preserving ride clustering for customized-bus sharing: A fog-assisted approach. In Proceedings of the 16th International Symposium on Modeling and Optimization in Mobile, Ad Hoc, and Wireless Networks (WiOpt), Shanghai, China, 7–11 May 2018; Volume 6, pp. 1–8. [Google Scholar]
- Amini, M.H.; Karabasoglu, O. Optimal operation of interdependent power systems and electrified transportation networks. In Proceedings of the 16th International Symposium on Modeling and Optimization in Mobile, Ad Hoc, and Wireless Networks (WiOpt), Shanghai, China, 7–11 May 2018; Volume 11, p. 196. [Google Scholar]
- Verma, P.; Sood, S.K. Fog Assisted-IoT Enabled Patient Health Monitoring in Smart Homes. IEEE Internet Things J. 2018, 5, 1789–1796. [Google Scholar] [CrossRef]
- Huang, Y.; Guan, X.; Chen, H.; Liang, Y.; Yuan, S.; Ohtsuki, T. Risk Assessment of Private Information Inference for Motion Sensor Embedded IoT Devices. IEEE Trans. Emerg. Top. Comput. Intell. 2020, 4, 265–275. [Google Scholar] [CrossRef]
- Bogale, T.E.; Wang, X.; Le, L.B. Machine intelligence techniques for next-generation context-aware wireless networks. arXiv 2018, arXiv:1801.04223. [Google Scholar]
- Zhang, Z.; Chen, H.; Hua, M.; Li, C.; Huang, Y.; Yang, L. Double Coded Caching in Ultra Dense Networks: Caching and Multicast Scheduling via Deep Reinforcement Learning. IEEE Trans. Commun. 2020, 68, 1071–1086. [Google Scholar] [CrossRef]
- Chen, Y.; Yao, M.; Cai, Z. Research on the Classification of Urban Rail Transit Stations-Taking Shanghai Metro as an Example. In Proceedings of the 15th International Conference on Service Systems and Service Management (ICSSSM), Hangzhou, China, 21–22 July 2018; pp. 1–6. [Google Scholar]
- Jiang, Z.; Gu, J.; Fan, W.; Liu, W.; Zhu, B. Q-learning approach to coordinated optimization of passenger inflow control with train skip-stopping on a urban rail transit line. Comput. Ind. Eng. 2019, 127, 1131–1142. [Google Scholar] [CrossRef]
- Jiang, Z.; Fan, W.; Liu, W.; Zhu, B.; Gu, J. Reinforcement learning approach for coordinated passenger inflow control of urban rail transit in peak hours. Transp. Res. Part C Emerg. Technol. 2018, 88, 1–16. [Google Scholar] [CrossRef]
- Zhang, X.; Liu, G.; Yang, C.; Wu, J. Research on Air Confrontation Maneuver Decision-Making Method Based on Reinforcement Learning. Electronics 2018, 7, 279. [Google Scholar] [CrossRef] [Green Version]
- An, H.; Jung, J.I. Decision-Making System for Lane Change Using Deep Reinforcement Learning in Connected and Automated Driving. Electronics 2019, 8, 543. [Google Scholar] [CrossRef] [Green Version]
- Christopher, W.; Peter, D. Q-learning. Mach. Learn. 1992, 8, 279–292. [Google Scholar]
- McFarlane, R. A Survey of Exploration Strategies in Reinforcement Learning; McGill University: Montreal, QC, Canada, 2018. [Google Scholar]
- da Silva, R.A.C.; da Fonseca, N.L.S. On the Location of Fog Nodes in Fog-Cloud Infrastructures. Sensors 2019, 19, 2445. [Google Scholar] [CrossRef] [Green Version]
- Li, J.; Zhang, T.; Jin, J.; Yang, Y.; Yuan, D.; Gao, L. Latency estimation for fog-based internet of things. In Proceedings of the 2017 27th International Telecommunication Networks and Applications Conference (ITNAC), Melbourne, VIC, Australia, 22–24 November 2017; Volume 1–6. [Google Scholar]
- PureEdgeSim. Available online: https://github.com/CharafeddineMechalikh/PureEdgeSim (accessed on 28 August 2020).
- Statistical Yearbook of Transportation, Taipei City. Available online: https://english.dot.gov.taipei/ (accessed on 24 August 2020).
- Ridership Counts. Available online: https://english.metro.taipei/ (accessed on 28 August 2020).


| Parameters | Description |
|---|---|
| Each zone | |
| Metro train a, bus b | |
| Metro station | |
| Bus station | |
| Fog node | |
| Time stamp t, total duration T | |
| p | Passenger |
| Passenger’s current location ID | |
| Passenger’s destination ID |
| Parameters | Description |
|---|---|
| Passenger arrival time at station | |
| Passenger arrival time at a station from the bus or metro train | |
| Passenger waiting time at station | |
| Events occur at station | |
| Passenger density at station | |
| Total number of passengers | |
| Total number of passengers that entered the platform | |
| Total number of passengers transited | |
| Total number of passengers exited | |
| h | Total number of stations visited by passenger |
| Total number of passengers transited at station from arrived bus or train |
| Parameters | Description |
|---|---|
| t | Time step |
| S | Set of environment states s |
| A | Set of actions a |
| T | Set of transition probabilities |
| R | Set of reward, |
| Parameters | Cloud DC | Fog DC | Laptop | Mobile Phone | IoT Actuator | IoT Sensor |
|---|---|---|---|---|---|---|
| Layer | 0 | 1 | 2 | 2 | 2 | 2 |
| CPU | MIPS | MIPS | ||||
| Memory | 150 GB | 40 GB | 8 GB | 4 GB | 2 GB | 2 GB |
| Storage | 10 TB | 2 TB | 300 GB | 30 GB | 20 GB | 0 |
| VMs | 16 | 16 | 1 | 1 | 1 | 0 |
| Hosts | 2 | 2 | - | - | - | - |
| Configuration Number | Learning Rate () | Discount Factor () | Greedy |
|---|---|---|---|
| 1 | 0.6 | 0.9 | 0.09 |
| 2 | 0.7 | 0.7 | 0.07 |
| 3 | 0.8 | 0.8 | 0.08 |
| 4 | 0.9 | 0.3 | 0.07 |
| 5 | 0.7 | 0.5 | 0.05 |
| 6 | 0.8 | 1 | 0.04 |
| 7 | 0.2 | 0.6 | 0.03 |
| 8 | 0.3 | 0.7 | 0.01 |
| 9 | 0.4 | 0.1 | 0.02 |
| 10 | 1 | 0.2 | 0.1 |
© 2020 by the authors. Licensee MDPI, Basel, Switzerland. This article is an open access article distributed under the terms and conditions of the Creative Commons Attribution (CC BY) license (http://creativecommons.org/licenses/by/4.0/).
Share and Cite
Neelakantam, G.; Onthoni, D.D.; Sahoo, P.K. Reinforcement Learning Based Passengers Assistance System for Crowded Public Transportation in Fog Enabled Smart City. Electronics 2020, 9, 1501. https://doi.org/10.3390/electronics9091501
Neelakantam G, Onthoni DD, Sahoo PK. Reinforcement Learning Based Passengers Assistance System for Crowded Public Transportation in Fog Enabled Smart City. Electronics. 2020; 9(9):1501. https://doi.org/10.3390/electronics9091501
Chicago/Turabian StyleNeelakantam, Gone, Djeane Debora Onthoni, and Prasan Kumar Sahoo. 2020. "Reinforcement Learning Based Passengers Assistance System for Crowded Public Transportation in Fog Enabled Smart City" Electronics 9, no. 9: 1501. https://doi.org/10.3390/electronics9091501
APA StyleNeelakantam, G., Onthoni, D. D., & Sahoo, P. K. (2020). Reinforcement Learning Based Passengers Assistance System for Crowded Public Transportation in Fog Enabled Smart City. Electronics, 9(9), 1501. https://doi.org/10.3390/electronics9091501