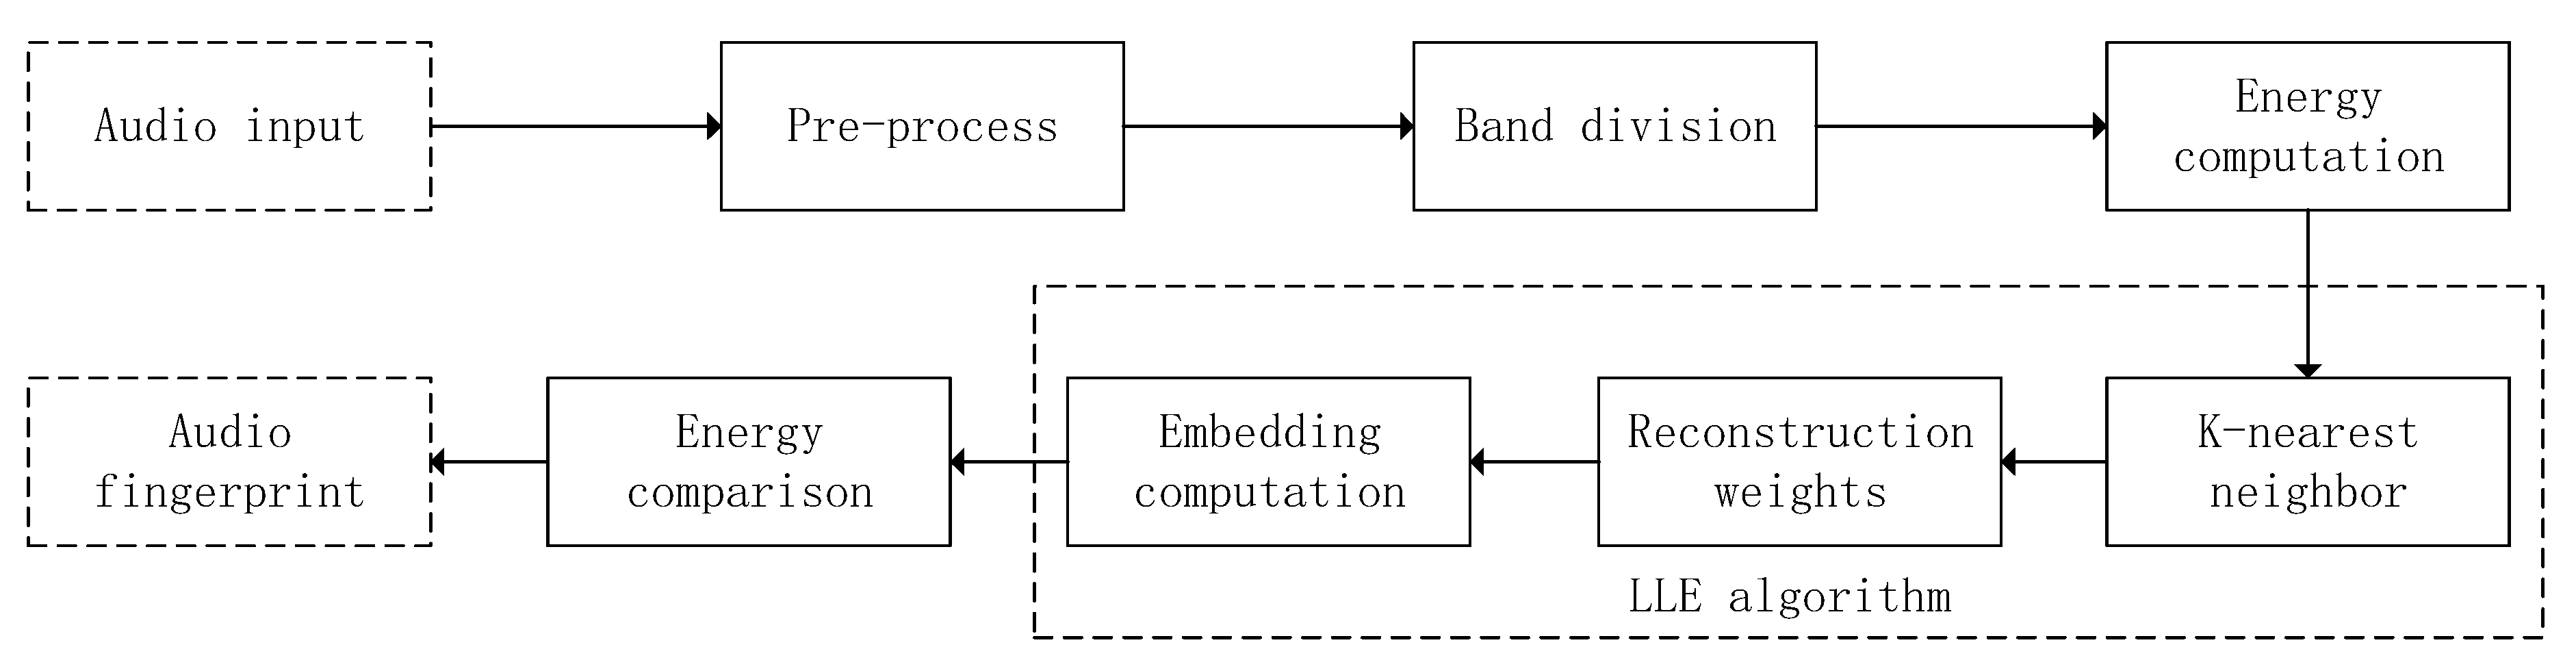
A typical audio fingerprint is encoded by comparing the energy of bands or sub-regions in the frequency domain. This paper introduces LLE into audio fingerprint extraction which maps the energy vector to a lower dimension so that smaller fingerprint can be obtained. The newly-acquired fingerprint can represent the audio signal uniquely with fewer bits and it is more efficient in audio retrieval. The extraction process is as follows: first the data is pre-processed, then band division is implemented in the frequency domain and a set of energies is computed. Finally, after being processed by LLE, the audio fingerprint is encoded by comparing the adjacent energy.
2.2. Audio Fingerprint Extraction
(1) Maximum Spectral Points Extraction
The discrete Fourier transform (DFT) is applied to the pre-processed audio signal and the spectrum is divided into 18 bands. In this work, we select a peak which has the maximum amplitude for each frame recording its current frame number and band number. To maintain a wide time coverage the number of selected peaks should be in the range of 70 to 100 samples.
(2) MASK Region Construction
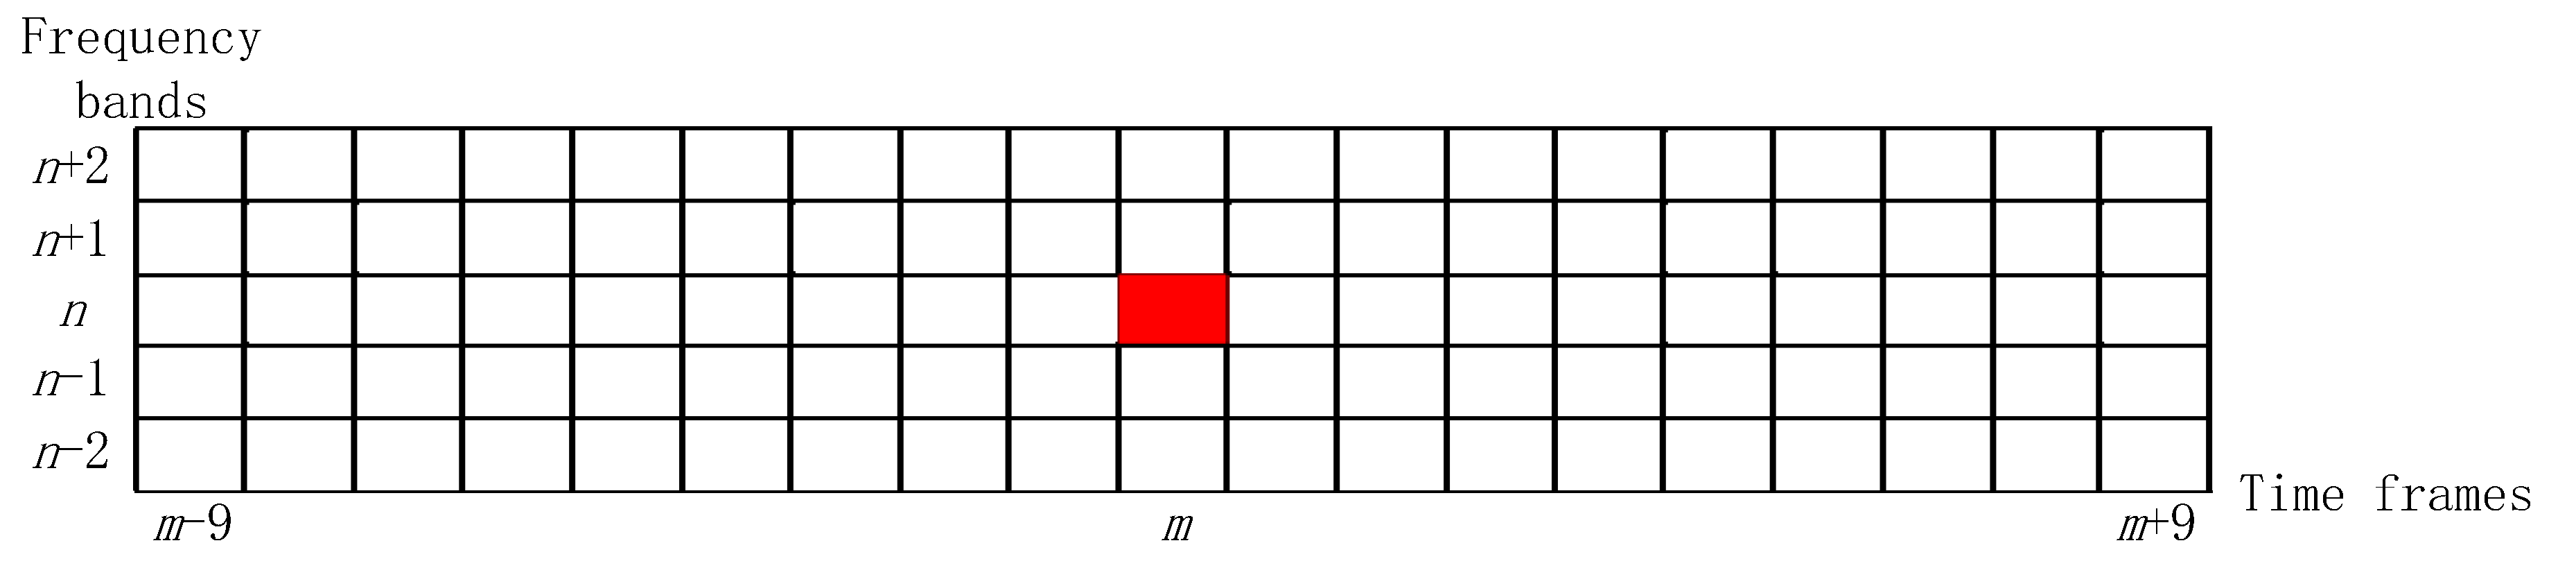
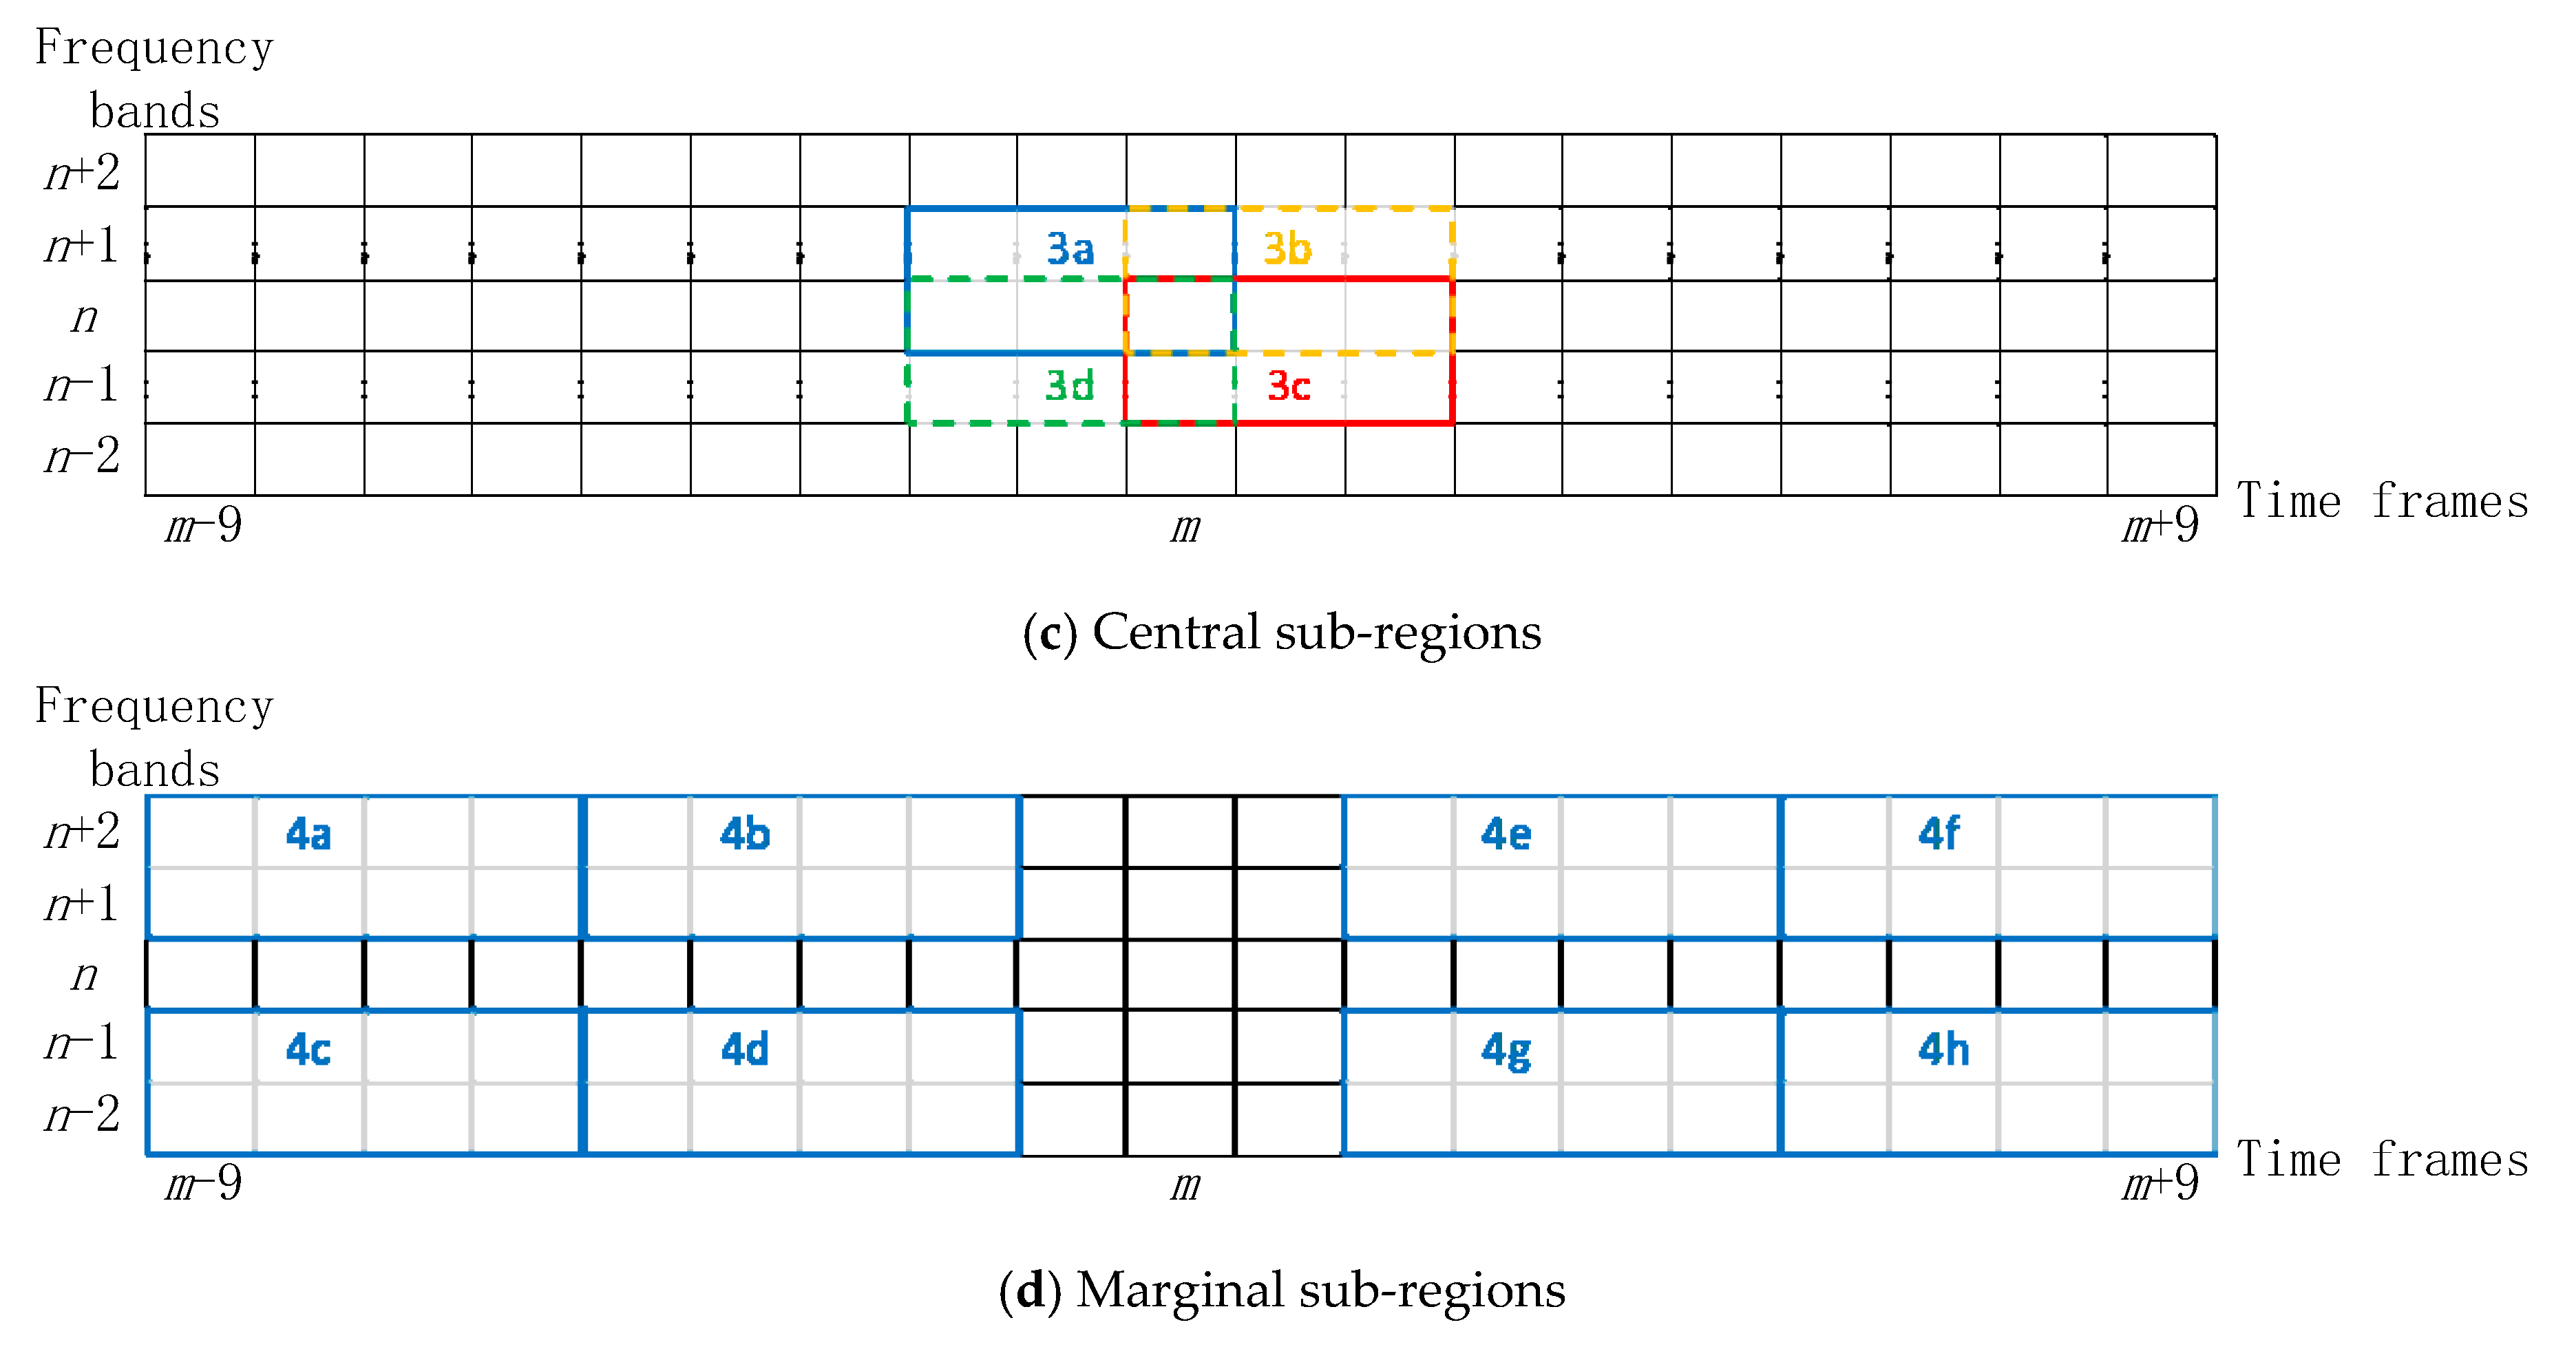
After the peak selection step, two index sets of data is obtained, namely the frame index and frequency band index where the selected peak of each frame is located, which is equivalent to the coordinate information of each salient point. Then these data are used to construct MASK regions centered by each selected peak, so there should be one MASK region for each frame. The region covers five frequency bands (one located band, two bands above, and two bands below) and the time span is 19 frames (one located frame, nine frames before, and nine frames after). It is worth mentioning that overlaps are allowed between regions with different peaks during the construction process. To prevent peaks from appearing at the band boundary, the first and last two bands are not used as a selection area so there is no case where a region is built out of scope.
Supposing that the peak is in
n-th band of
m-th frame and its MASK region is shown in
Figure 3. Note that the frequency bands and time frames are distributed symmetrically. The MASK region is represented as a grid range of 5 × 19, and the ordinate has five frequency bands and the abscissa consists of 19 time frames.
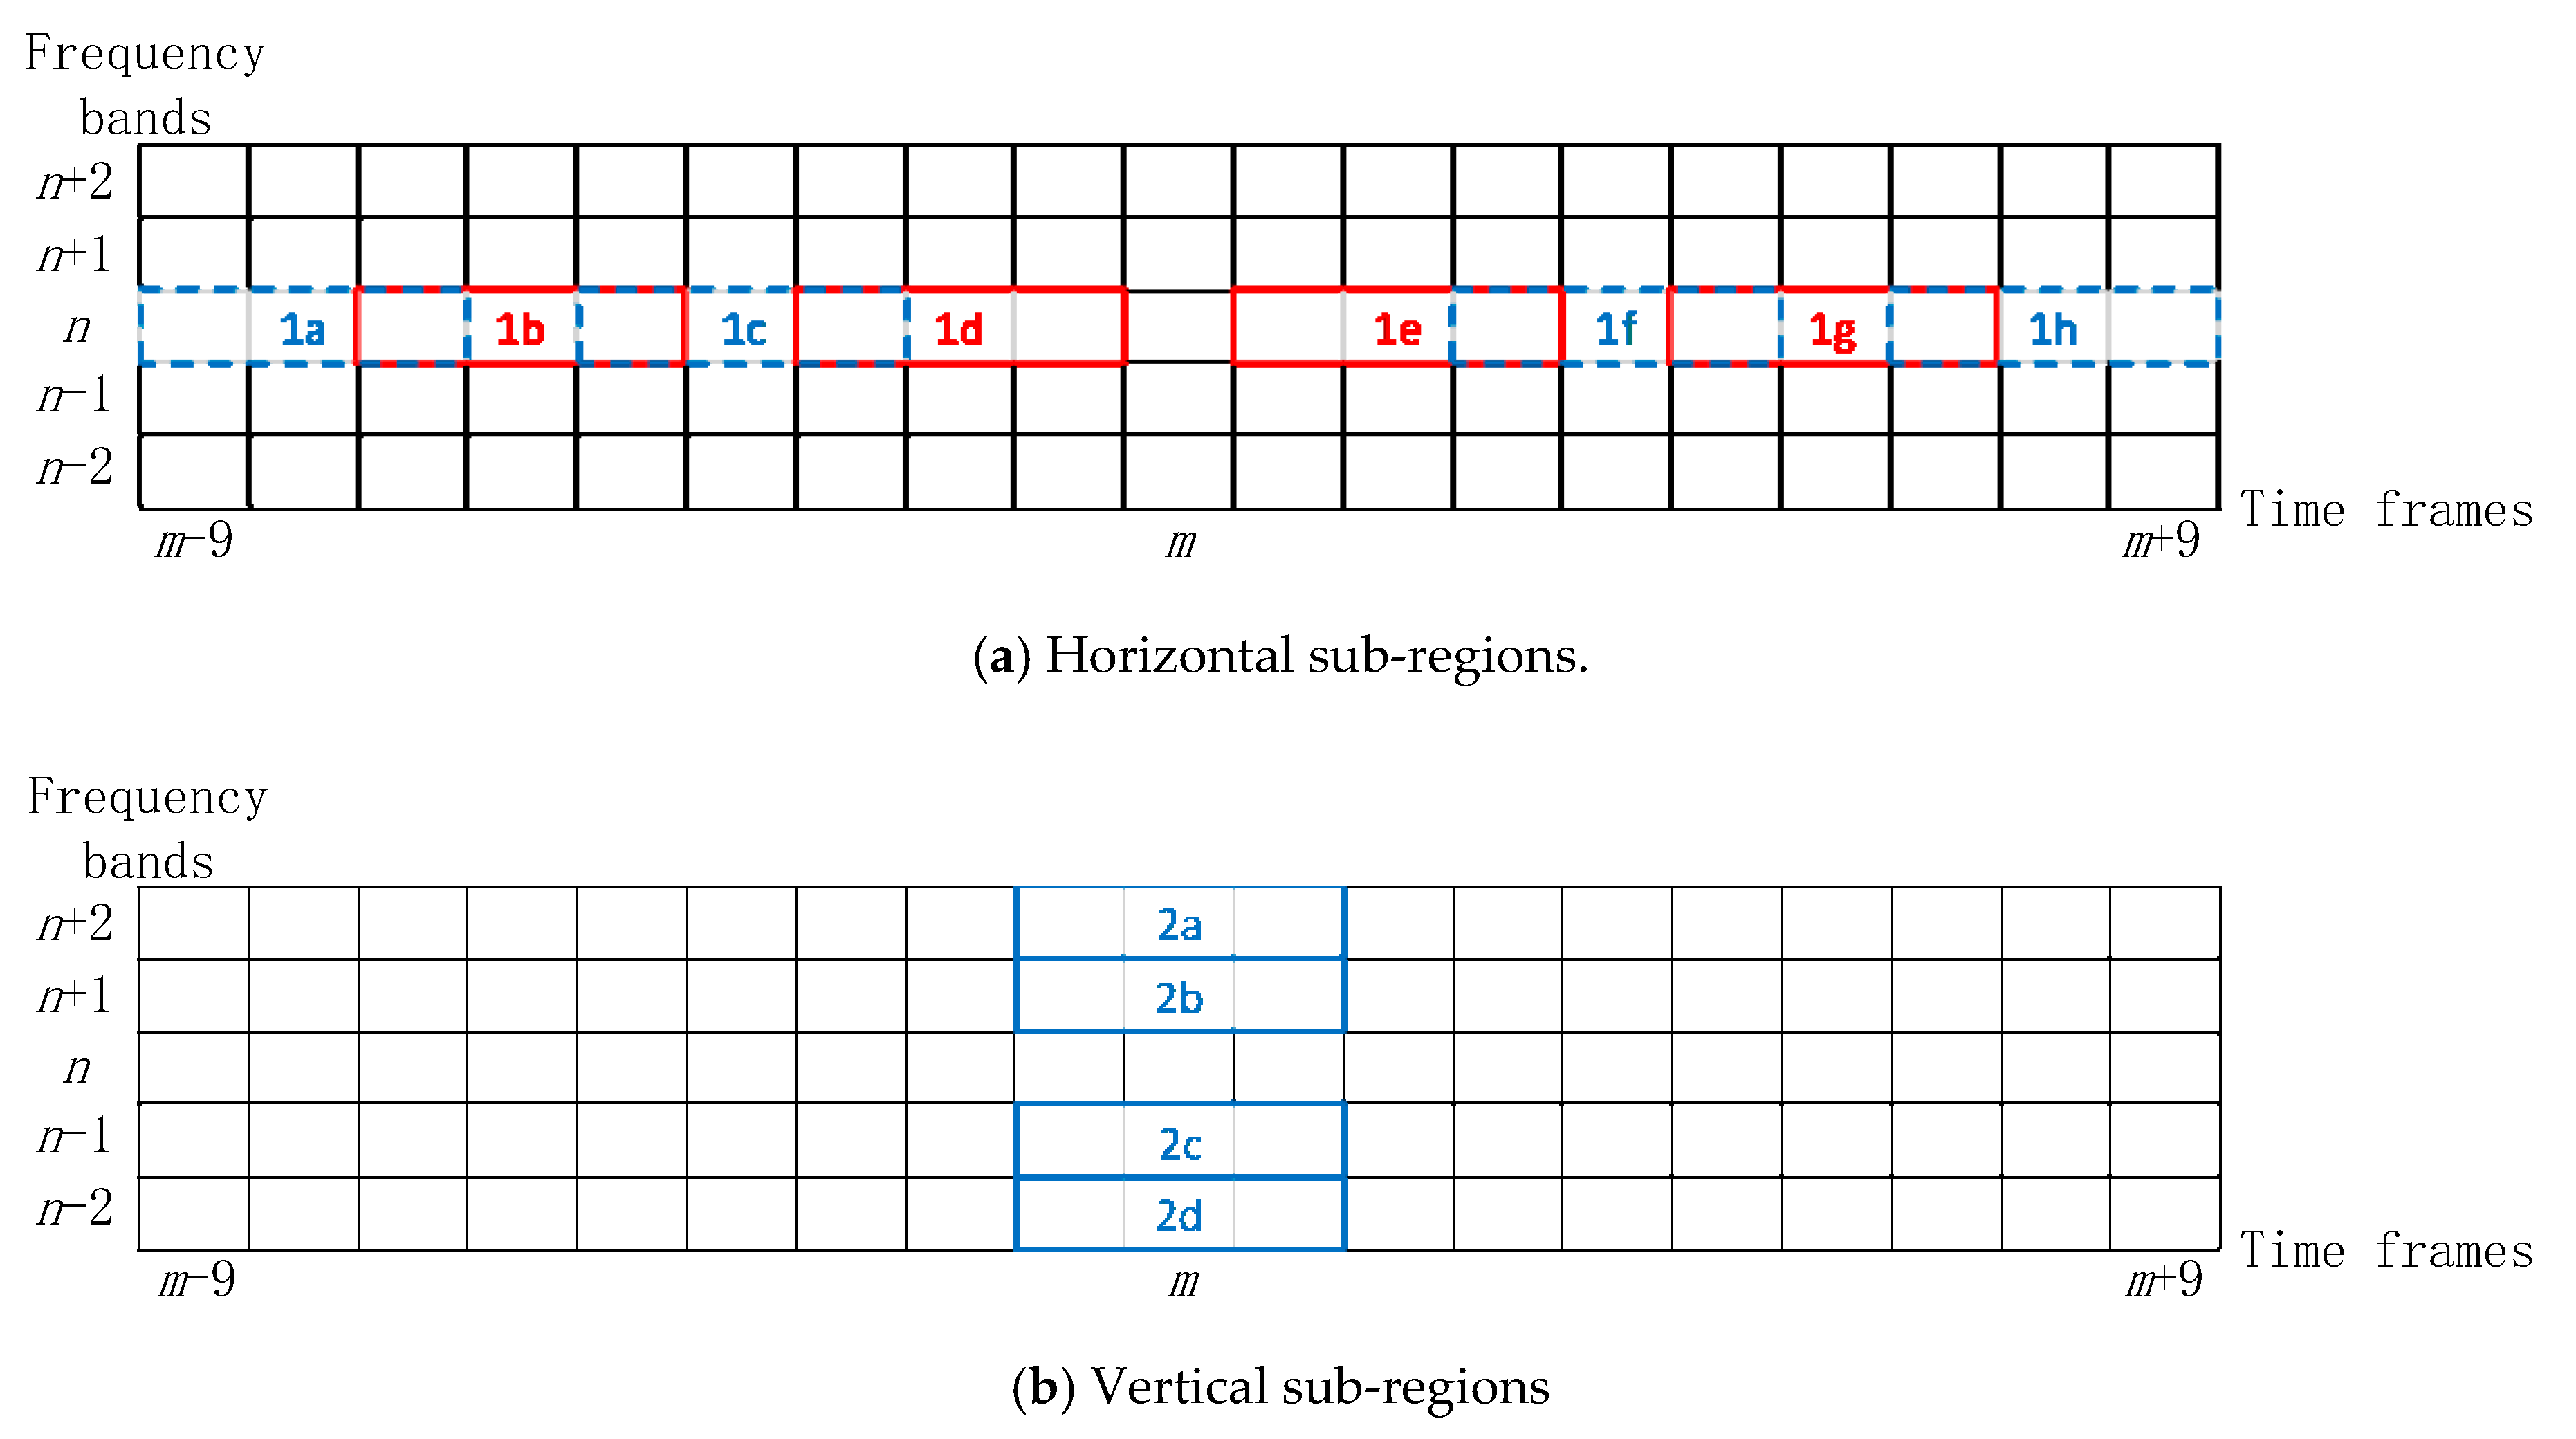
(3) Sub-region Division
The MASK region is divided into 4 groups of sub-regions as shown in
Figure 4. The four groups of sub-regions are defined as follows: the first group is horizontal sub-regions which corresponds to 1a–1h; the second group is vertical sub-regions including 2a–2d; the third group represents central sub-regions with 3a–3d; the fourth group represent marginal sub-regions in the form of 4a–4h. It can be seen that the horizontal and marginal groups have eight sub-regions, while the vertical and central groups have four sub-regions. All of them correspond to the same number of energies which represented as
L (
L = 4 or 8). Then the energies of these sub-regions are calculated and the energy vector of a single group is denoted as
,
,
and
which means the energy vector of horizontal, vertical, central and marginal group in that order. We take
to uniformly present
,
,
, and
for simplicity, where
is the energy of
l-th sub-region of
m-th frame and the value of
L depends on the group type.
(4) Audio Fingerprint Extraction based on LLE
The dimension of the energy vectors obtained above is still high and the redundancy can be reduced. Thus, in consideration of the relationship of the energies, this paper use LLE to reduce the number of energies of each group respectively and finally extracts smaller fingerprints. LLE algorithm is a typical nonlinear dimensionality reduction method, which considers that the observed data is actually a result of mapping from a low-dimensional space to a high-dimensional space. Due to the internal characteristics of the data, there is redundancy in some high-dimensional data which can be uniquely represented with less data. The algorithm needs to first obtain the reconstruction weights of the sample frame in the neighborhood, and then solve the mapping of the sample in the low-dimensional space according to the principle that the reconstruction weights remains unchanged equally to minimize the loss. The method in this paper fully considers the linear relationship between sample frames which corresponds to the time sequence structure of audio signals, and describes the essential characteristics of the data in the low dimension with the minimal feature loss. We reduce the dimension of the energy vector of audio signals belonging to the same group of sub-regions which also reduce the amount of energy involved in fingerprint calculation. The new energy vector is used to extract low dimensional fingerprints by comparing the adjacent energies.
(i) Selection of K nearest frames
The calculation is closely related to the group of its sub-regions. Therefore, the processed data is the energy vector composed of all the sub-regions’ energies of an audio frame in a same group which is denoted as mentioned above.
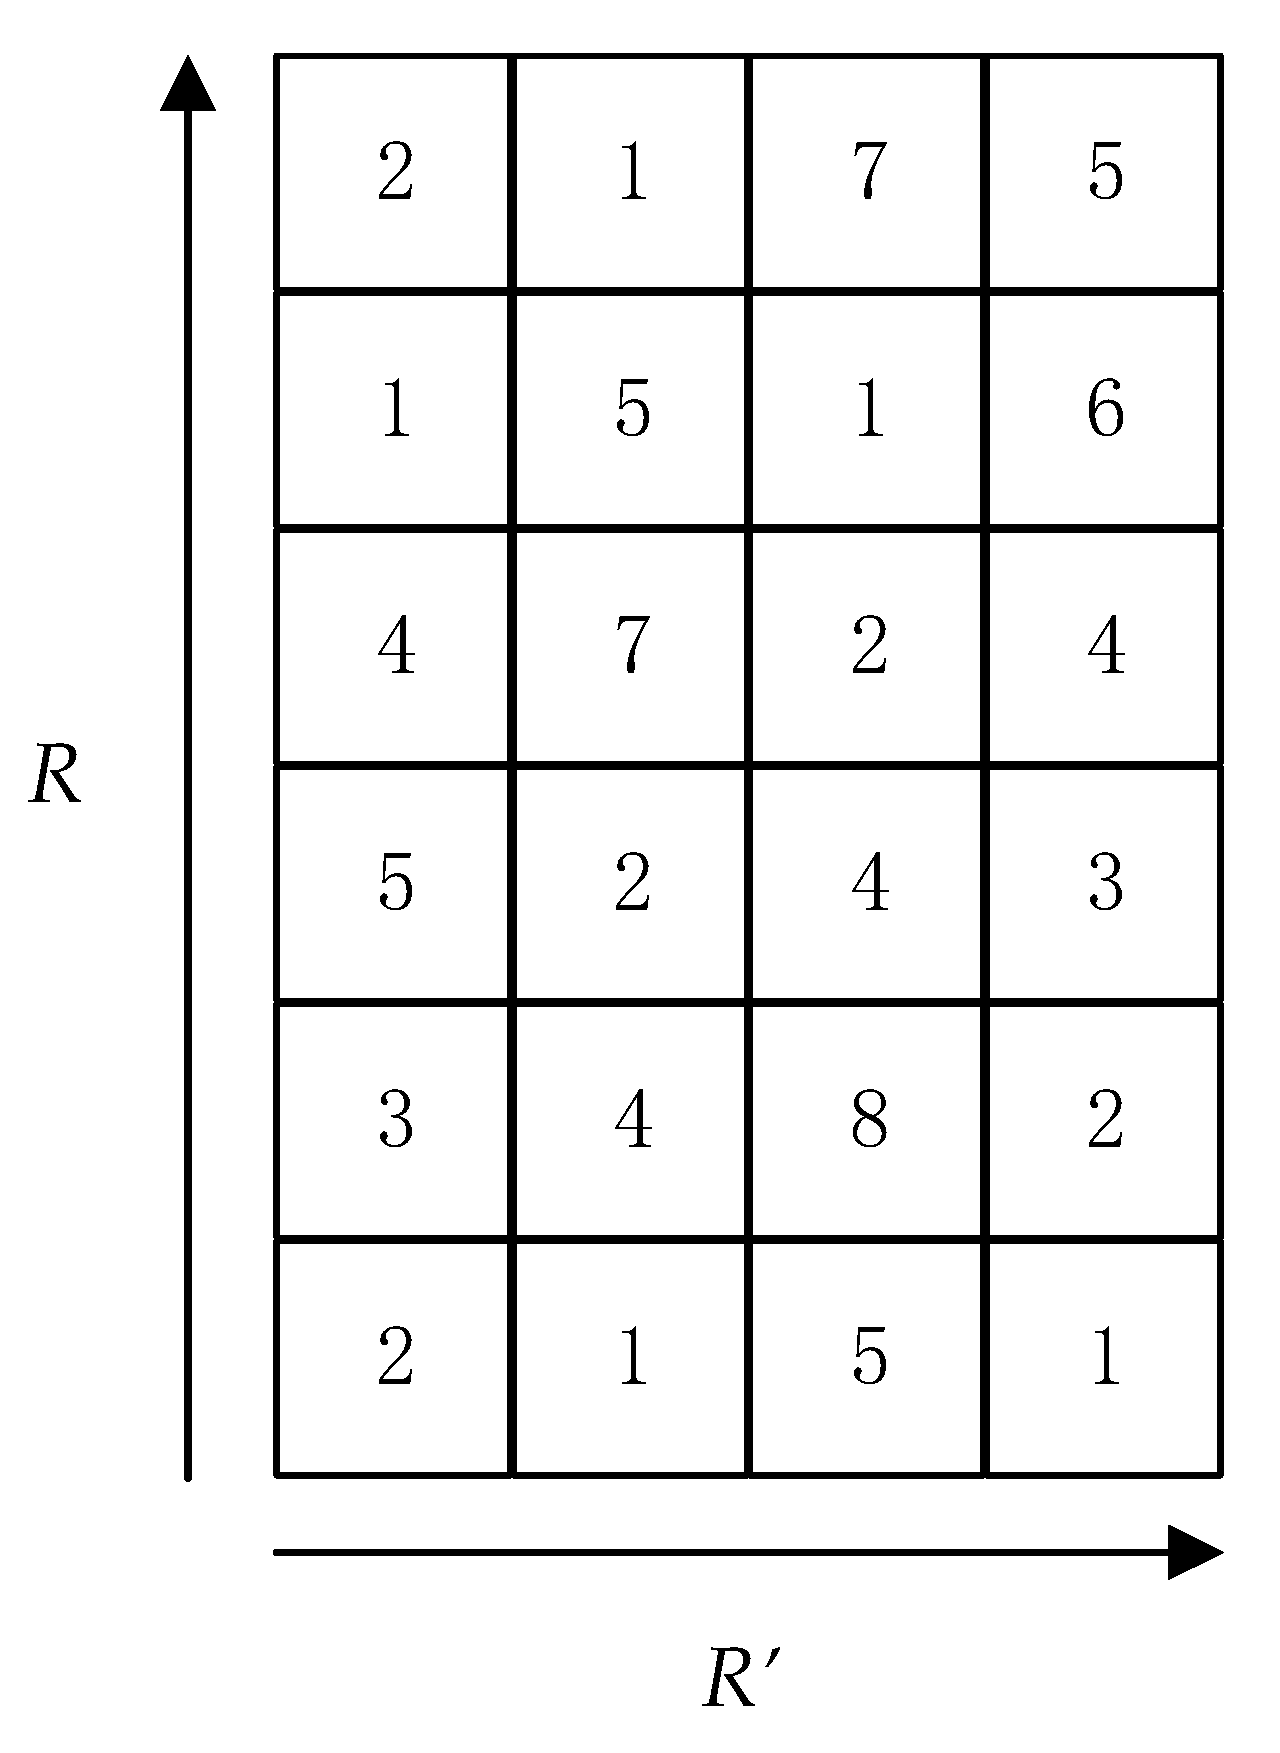
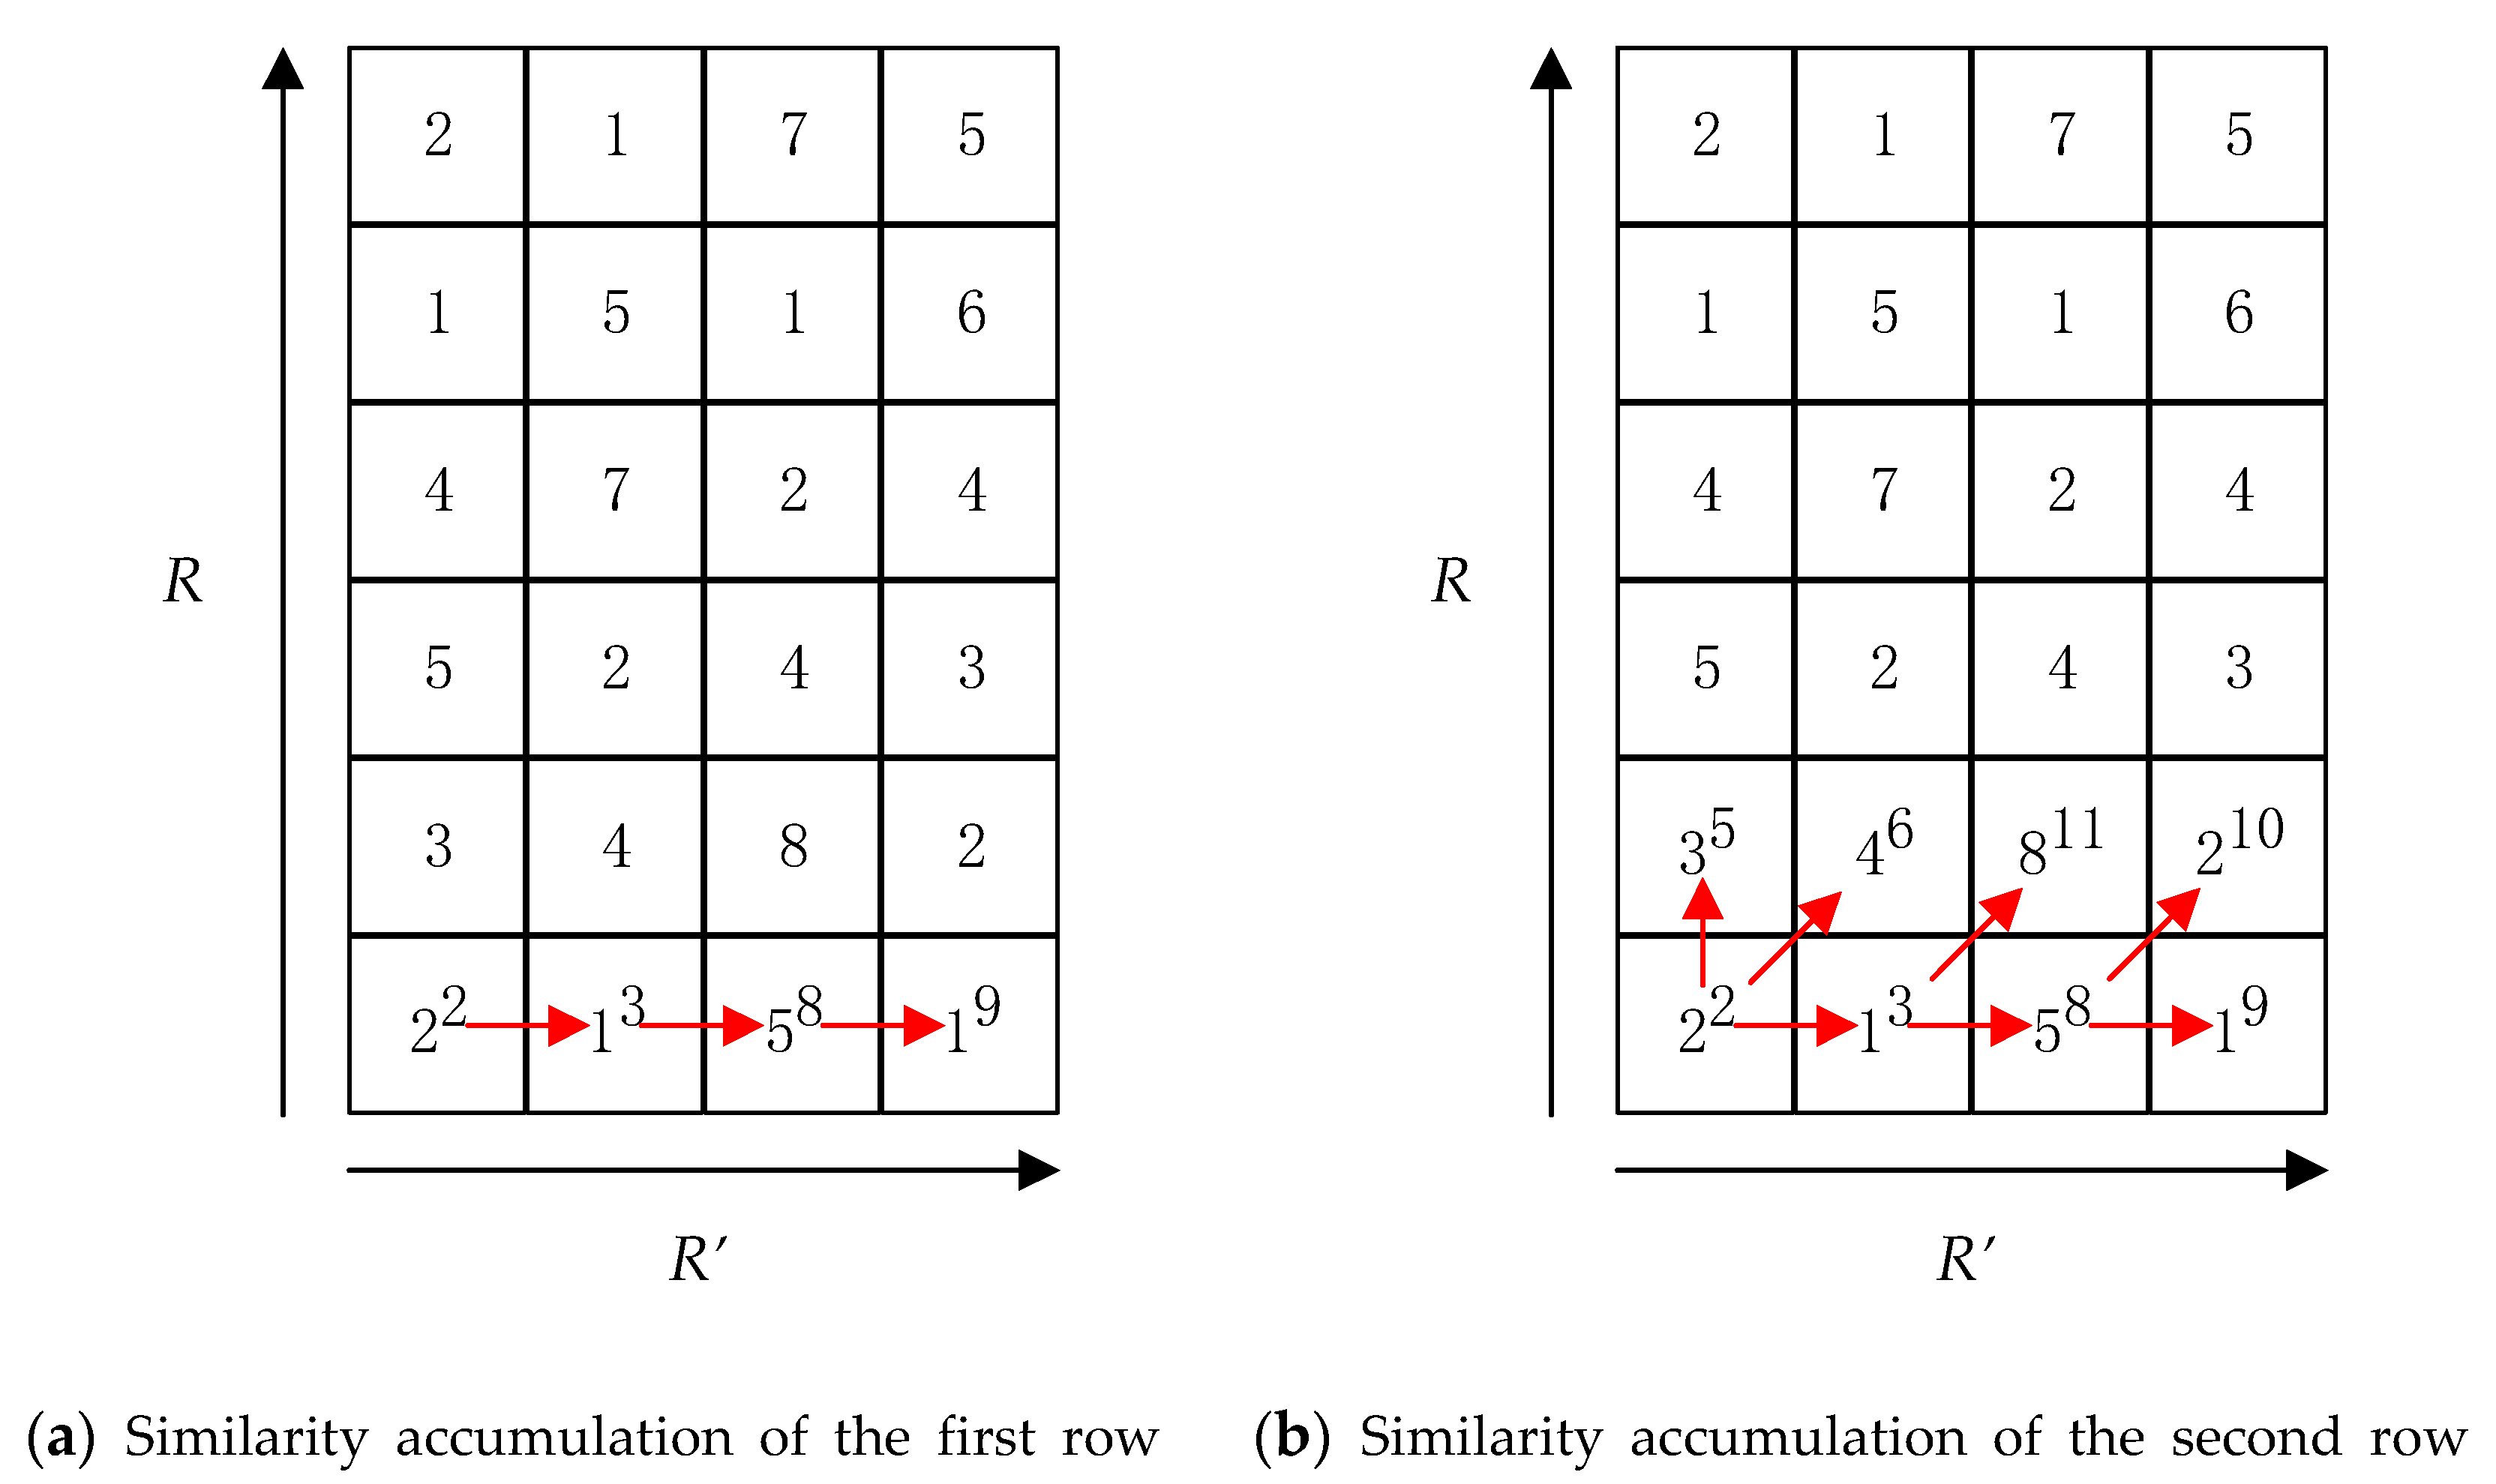
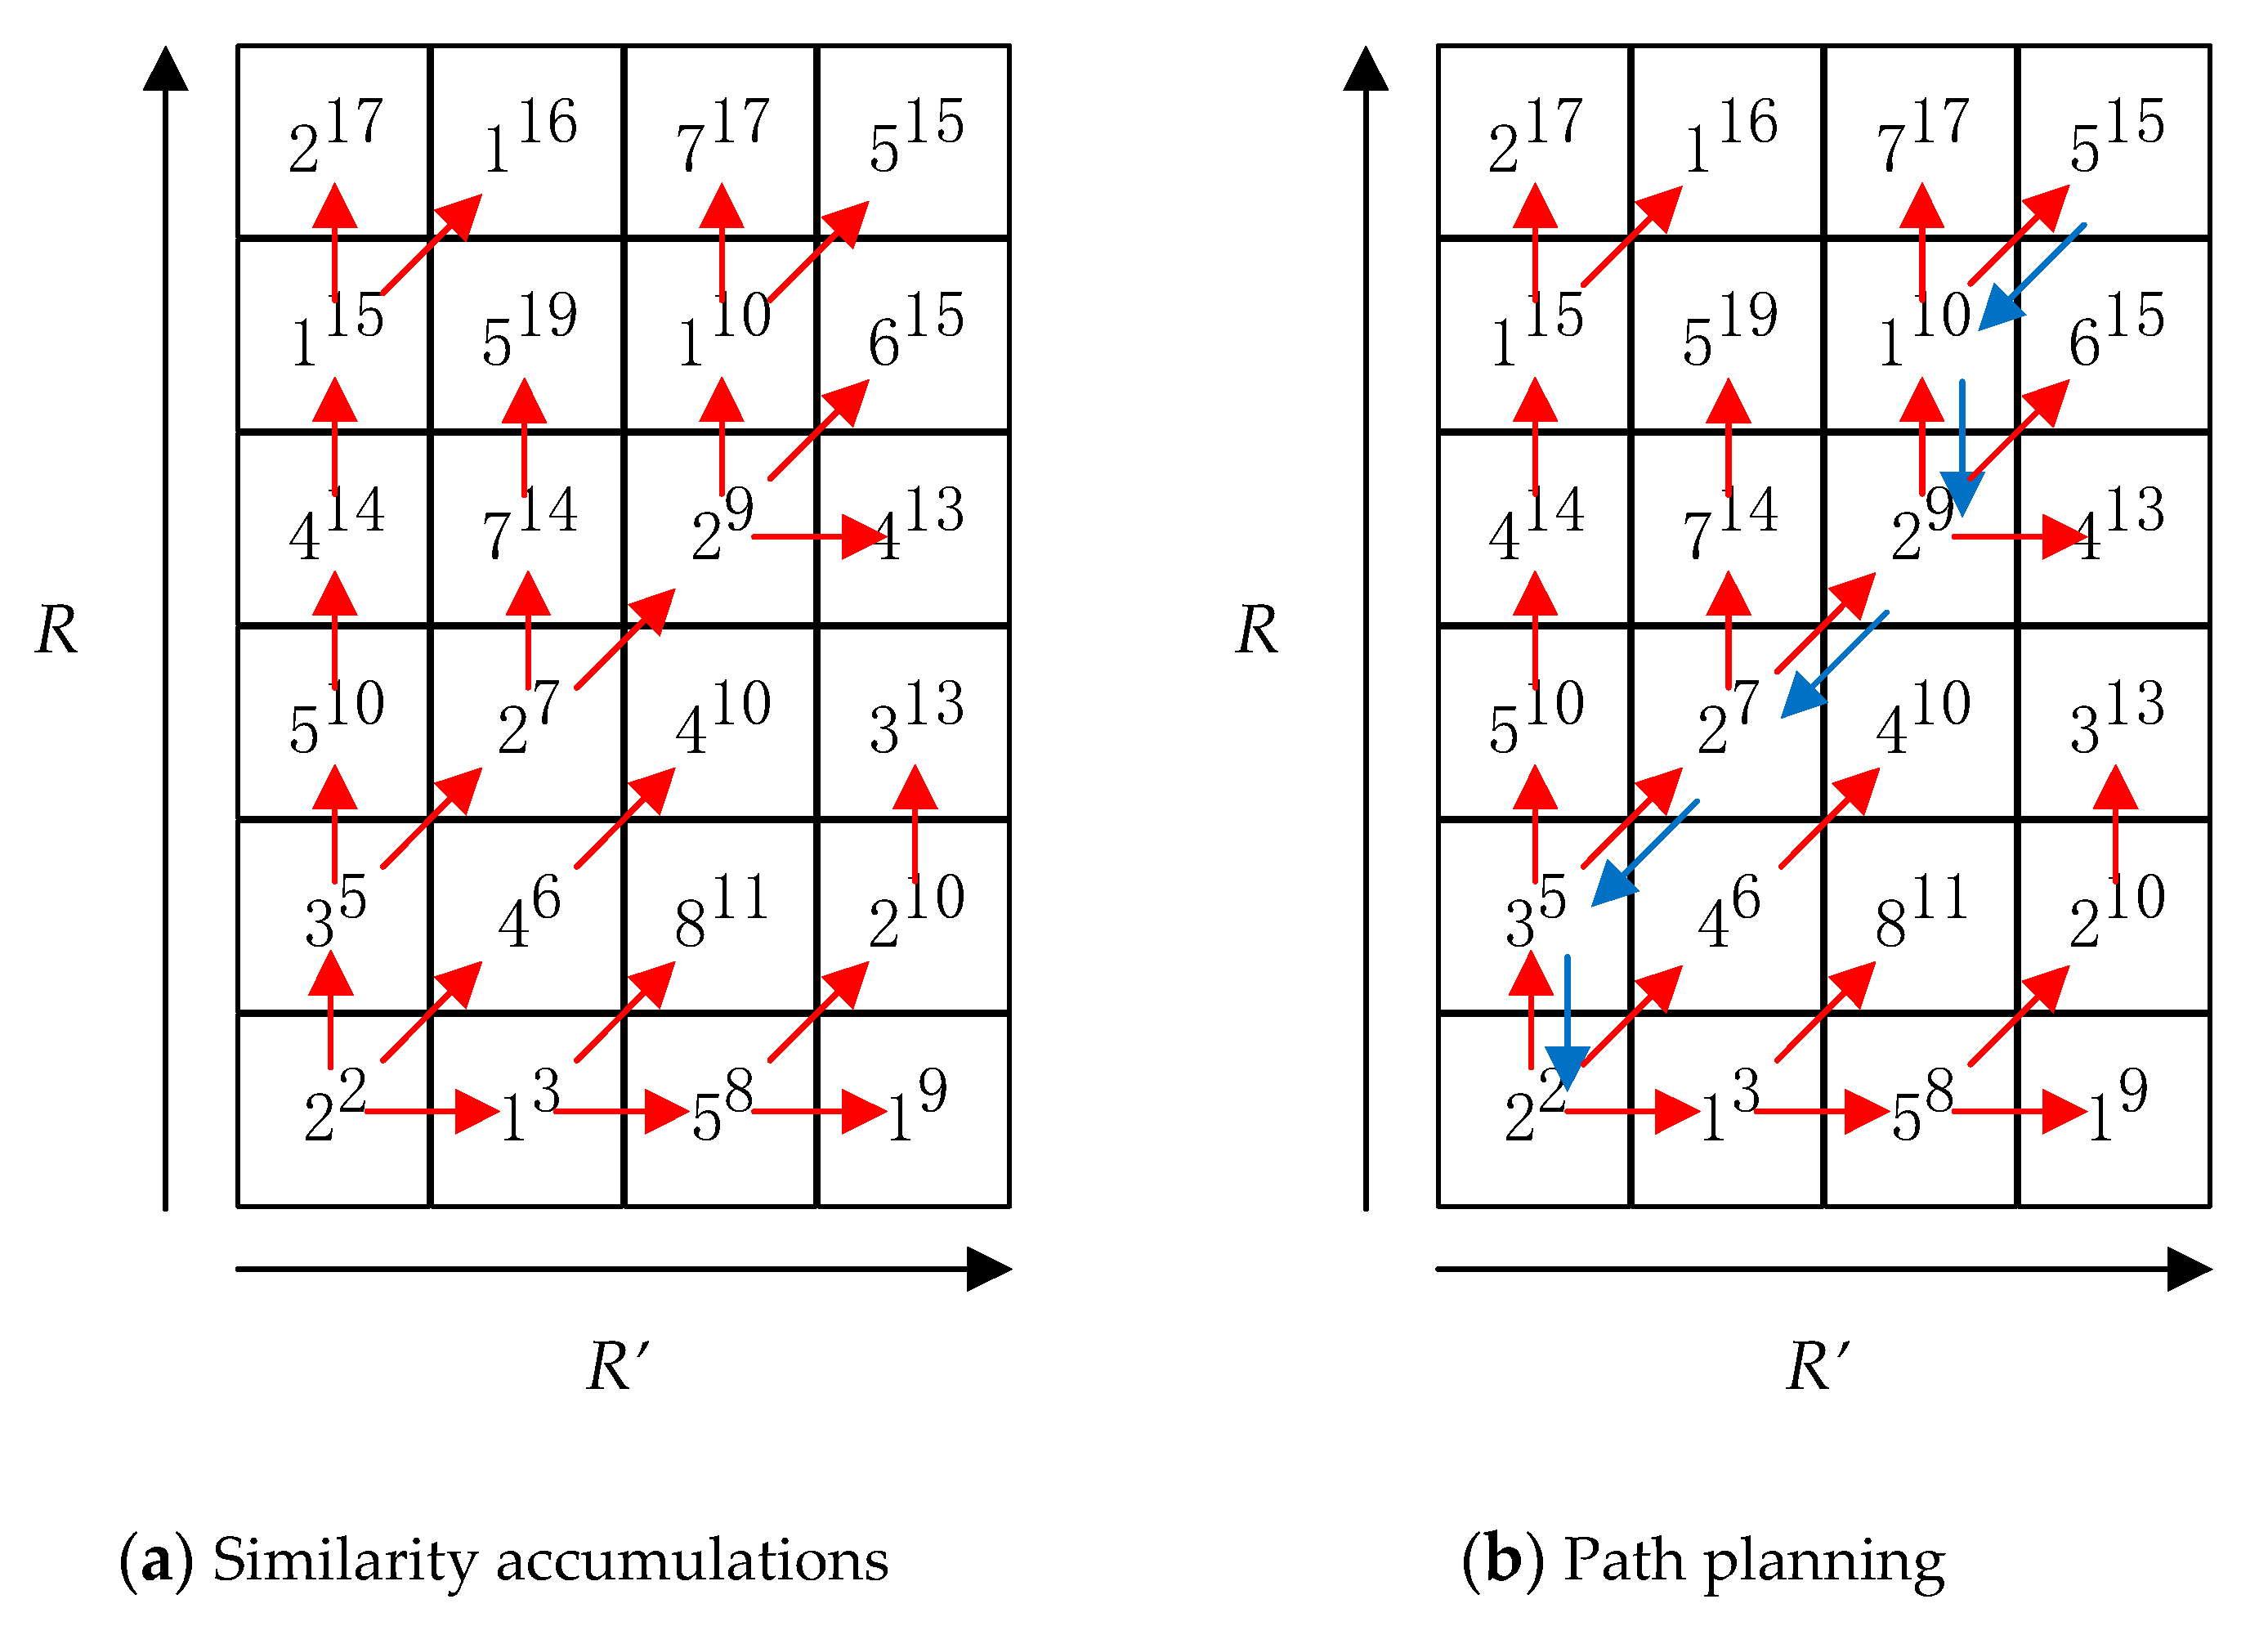
Assuming that there are M frames in the given audio data, the MASK region of each frame has four groups of sub-regions and L energies are calculated in a single group (L = 4 or 8) which forms an energy matrix with M L-dimensional data E = [e1, e2, …, eM]. The algorithm selects K nearest frames by finding the results with minimum Euclidean distance between the m-th energy vector and other data in matrix E. The results are arranged in ascending order of Euclidean distance and represented as where is the k-th nearest energy vector of and the value range of K is from 3 to 8 which can ensure the efficiency and prevent the complexity from becoming too high. However, if we only use Euclidean distance to select the proximities, it inevitably occurs that two frames are too far apart in time. In practical conditions, it is obviously unreasonable for two frames that are not related in information to be determined as proximity. In order to ensure that the times span of the nearest selection results is not too long and in view of the upper end of the K’s value range is 8, this paper limits the range of selection within 10 frames (five before and five after) which considers the correlation between audio frames and reduces the possibility of proximities appearing out of the matching segment, making a contribution to reducing the error of retrieval.
(ii) Reconstruction weights computation
The purpose of this step is to represent each energy vector by its
K nearest frames with linear weights, called reconstruction weights. For the regression problem of calculating the reconstruction weights, this paper uses the mean square error as the loss function of the algorithm:
where
is the set of energy vectors of
K nearest frames, the loss function
represents the construction error which aimed to minimize.
where
is the construction weight between the energy vector
em of the
m-th frame and its
k-th proximity
with the following constraint:
The normalized representation of the reconstruction vector
can be obtained by solving the Equation (1) with the Lagrange multiplier method:
where
is
K-dimensional 1 vector,
Zm is the local covariance matrix and its formula is as follows:
Finally, the reconstruction vectors of all frames are combined into a reconstruction matrix, denoted as .
(iii) Low dimensional mapping
Suppose the mapping result of the low dimension is
E’ =
[e1′,
e2′, …,
eM′], and the linear relationship is expected to be consistent with that of the high dimension. The loss function
also needs to be minimized which is solved by the Lagrange multiplier method. In this step the dimensionality reduction problem can be simplified as the eigenvalue decomposition of the target matrix
D:
where the constraint is:
where
= [
] is the energy vector in the low dimension.
To figure out
, the loss function should be also minimized in the low dimension and it can be rewritten as follow according to matrix theory:
Then the Lagrange multiplier method is adopted, then the equation can be represented as:
where
is the Lagrange multiplier. Finally the derivative of Equation (8) is taken and set it equal to 0:
Equation (9) formally conforms to the definition of matrix eigenvalues and eigenvectors. Thus, the optimization result of this paper is a matrix composed of the eigenvectors corresponding to the smallest
d non-0 eigenvalues of matrix
D (
d <
L). Until now, the algorithm has obtained a new energy vector
= [
] and the number of vector is still
M corresponding the
M frames audio signal. But the dimension of the elements reduces from
L to
d reflecting the reduction of sub-regions’ energy. Finally, the audio fingerprints are extracted by comparing the energies in adjacent sub-regions as follow.
where
is the energy of
i-th sub-region in the
m-th frame,
is the
i-th bit of the fingerprint in one of the sub-region group and the fingerprints in other groups can also be computed in the same way. By changing the
d and observing the retrieval results, the limitation of dimensionality reduction in a single group can be determined.


