1. Introduction
The rising energy demands and limited supply capacity of generators could stimulate severe electricity price spikes. On the other hand, residential applicants who have been receiving energy with fixed charges are now capable of controlling their load patterns in response to real-time prices [
1]. An efficient energy management scheme is a pivotal part of the smart grid infrastructure that integrates the effective execution of demand-side management (DSM) and the flexible operation of energy efficient controllable home appliances [
2,
3]. DSM inspires customer portals for optimal energy usage, real-time pricing, and energy consumption monitoring by the dual flow of electricity and communications [
4]. In recent times, effective means of reducing the gradually growing energy requirement and promotion of clean energy have gained paramount importance around the world. Traditional power generation methods rely heavily on fossil fuels, which contributes to massive greenhouse gas emissions. In order to meet the increasing power demand and promote clean energy generation with zero emissions, researchers have defined unique pathways of generating electricity such as sustainable and renewable energy resources (SRERs) [
5]. However, the distribution of renewable energy sources (RESs) significantly increases power system complexity [
6]. The current power system is not capable of maintaining its stability with high penetration of uncontrollable RESs and distributed generation (DG). In this context, one of the present solutions is the transformation of the existing power grid into the smart grid (SG) with advanced information and communication technologies (ICTs) [
7]. Cutting-edge ICTs not only enable SG to combine the DG and RESs but also improve the reliability and stability of the power system infrastructure. Smart meters (SMs), smart home appliances, RESs, and energy storage systems (ESS) are the significant resources of smart grid technology. The main features of the SG are the control of power generation, transmission, and distribution through advanced ICTs [
8].
DSM is an integrated part of a smart grid which allows flexible operation for the power system to improve system reliability. There are key factors that make smart grid superior over traditional power grids. Firstly, a two-way flow of power and communication via wireless technologies such as Wi-Fi, ZigBee, WiMAX, etc. Secondly, advanced metering infrastructure (AMI) via a power data aggregator and management unit (PDAMU). In SG, dual communication keeps the home users well informed regarding different utility parameters such as electricity prices, distribution network up-gradation scheduling, natural disasters, or equipment failures. However, the smart grid plays a crucial role to enable the operator to monitor operation activities and analyze real-time energy consumption and pricing [
9].
An automatic home energy management scheme (HEMS) can save energy and cost for the residential users and currently it is an integral part of the concept of smart grids and smart cities [
10]. Single or multiple groups of smart homes can act as a smart city. A little awareness of the home user’s energy consumption scheduling schemes is required to know the benefits from different aspects [
11]. The role of SG is not only to integrate renewable energy resources but also to incorporate residential consumers into DSM activities [
12]. The common objectives of the DSM in the smart grid are the reduction in the electricity price and minimization of energy use in peak hours [
13]. However, the current literature study shows that there is a gap in developing an efficient cluster-based energy management scheme which can reduce consumers’ energy prices with a higher level of customer satisfaction. To fill up these gaps, an efficient energy allocation algorithm (EAA) for a residence energy management (REM) system is proposed in this study.
The utility costs for residential consumers can be saved by the support of RESs and ESS [
14] in smart grid architecture. The work presented in [
15] outlined a detailed review of the current progression in the HEM system, challenges in appliance scheduling, and energy optimization in the smart grid community. In addition, the incorporation of RESs into households and their effects on utility tariffs have not been addressed properly. Researchers [
16] demonstrated the necessity and planning of energy management in smart cities based on generation, transportation, storage, and end-user energy demand. However, the dynamic pricing of the electricity market of residential appliances for energy consumption have not been discussed. Authors [
17] give insights regarding the ways and manners that facilitate the integration of RESs and distribution grid (DG) in the SG and the concept of smart cities has been comprehensively addressed. However, the integration of RESs and ESS for the residential applicants and their role in DSM programs have been ignored. The authors in [
18] presented a framework of methods and models for accounting the uncertainties due to distributed wind and solar photovoltaic power generation beyond the planning period in an AC multi-period optimal power flow (MPOPF) model for distribution systems with energy storage. In addition, the authors in [
19] focused on the model predictive control (MPC)-based energy scheduling of a smart microgrid equipped with controllable (i.e., with flexible and programmable operation) and non-controllable (i.e., with fixed power profile) electrical appliances, as well as photovoltaic (PV) panels, and a battery energy storage system (BESS) that allows for storing a surplus of energy for later use. However, two important issues, such as cluster-based energy management and self-satisfied power demand, were not considered. The authors in [
20] proposed a decision technique of an optimal reference schedule for distributed generators (DGs), battery energy storage system (BESS), and tap changing transformers to reduce line losses in the distribution system. However, energy and cost minimization considering self-satisfied power demand was not taken in to account. The authors in [
21] reviewed the energy management approaches in smart environments and extensively reviewed peak load shaving and demand response. The authors in [
22] outlined a brief overview on the architecture and functional modules of smart home energy management system (HEMS). The researchers in [
23] presented a versatile convex programming (CP)-based demand response optimization framework for the automatic load management of various household appliances in a smart home. The authors in [
24] suggested informing the community energy management system (CEMS) about the adjustable power in addition to the surplus and shortage information. However, a cluster-based energy management scheme has not been addressed to improve the efficiency and reduce the cost of residential users.
The authors in [
14] outlined a comprehensive overview of evaluating trends in smart homes and smart grids and examined the effectiveness of numerous communication technologies such as Wi-Fi, ZigBee, Z-Wave, and wired protocols. The researchers also figured out the benefits and drawbacks of existing technologies, and products available in the market. Moreover, the role and future trends regarding communication technologies and their barriers, challenges, and, benefits in the smart grid and smart homes were also discussed. However, this work did not take into account the cluster-based energy management and energy allocation algorithm (EAA) in the smart grid framework. The authors in [
15,
16] demonstrated a household energy supervising system interfaced with a data logger unit to measure and record the electricity generation and demand patterns. In addition, RESs, ESS, and self-satisfied power demand were not considered to generate an alternative source of energy and storage facilities while peak demand appears.
While several works dealt with the advanced methods, these methods are not typically adopted by industry due to the reliability and security issues of a power system. Therefore, to improve the cluster-based energy management system for residential consumers, this research develops an efficient energy management system using commercial software, C++, considering RESs, and an ESS in a smart grid framework. The proposed residence energy management (REM) system offers low energy costs compared to the existing methods with higher customer satisfaction. The contributions of this paper are listed as follows:
Efficient simulation techniques are developed to avert the peak load of the established model.
The proposed model enables an energy allocation strategy in a community to be assessed sequentially.
An advanced smart metering architecture is integrated into the proposed smart grid model to acquire real-time pricing and remote monitoring of energy consumption.
Mathematical modeling is developed to facilitate extensive analysis.
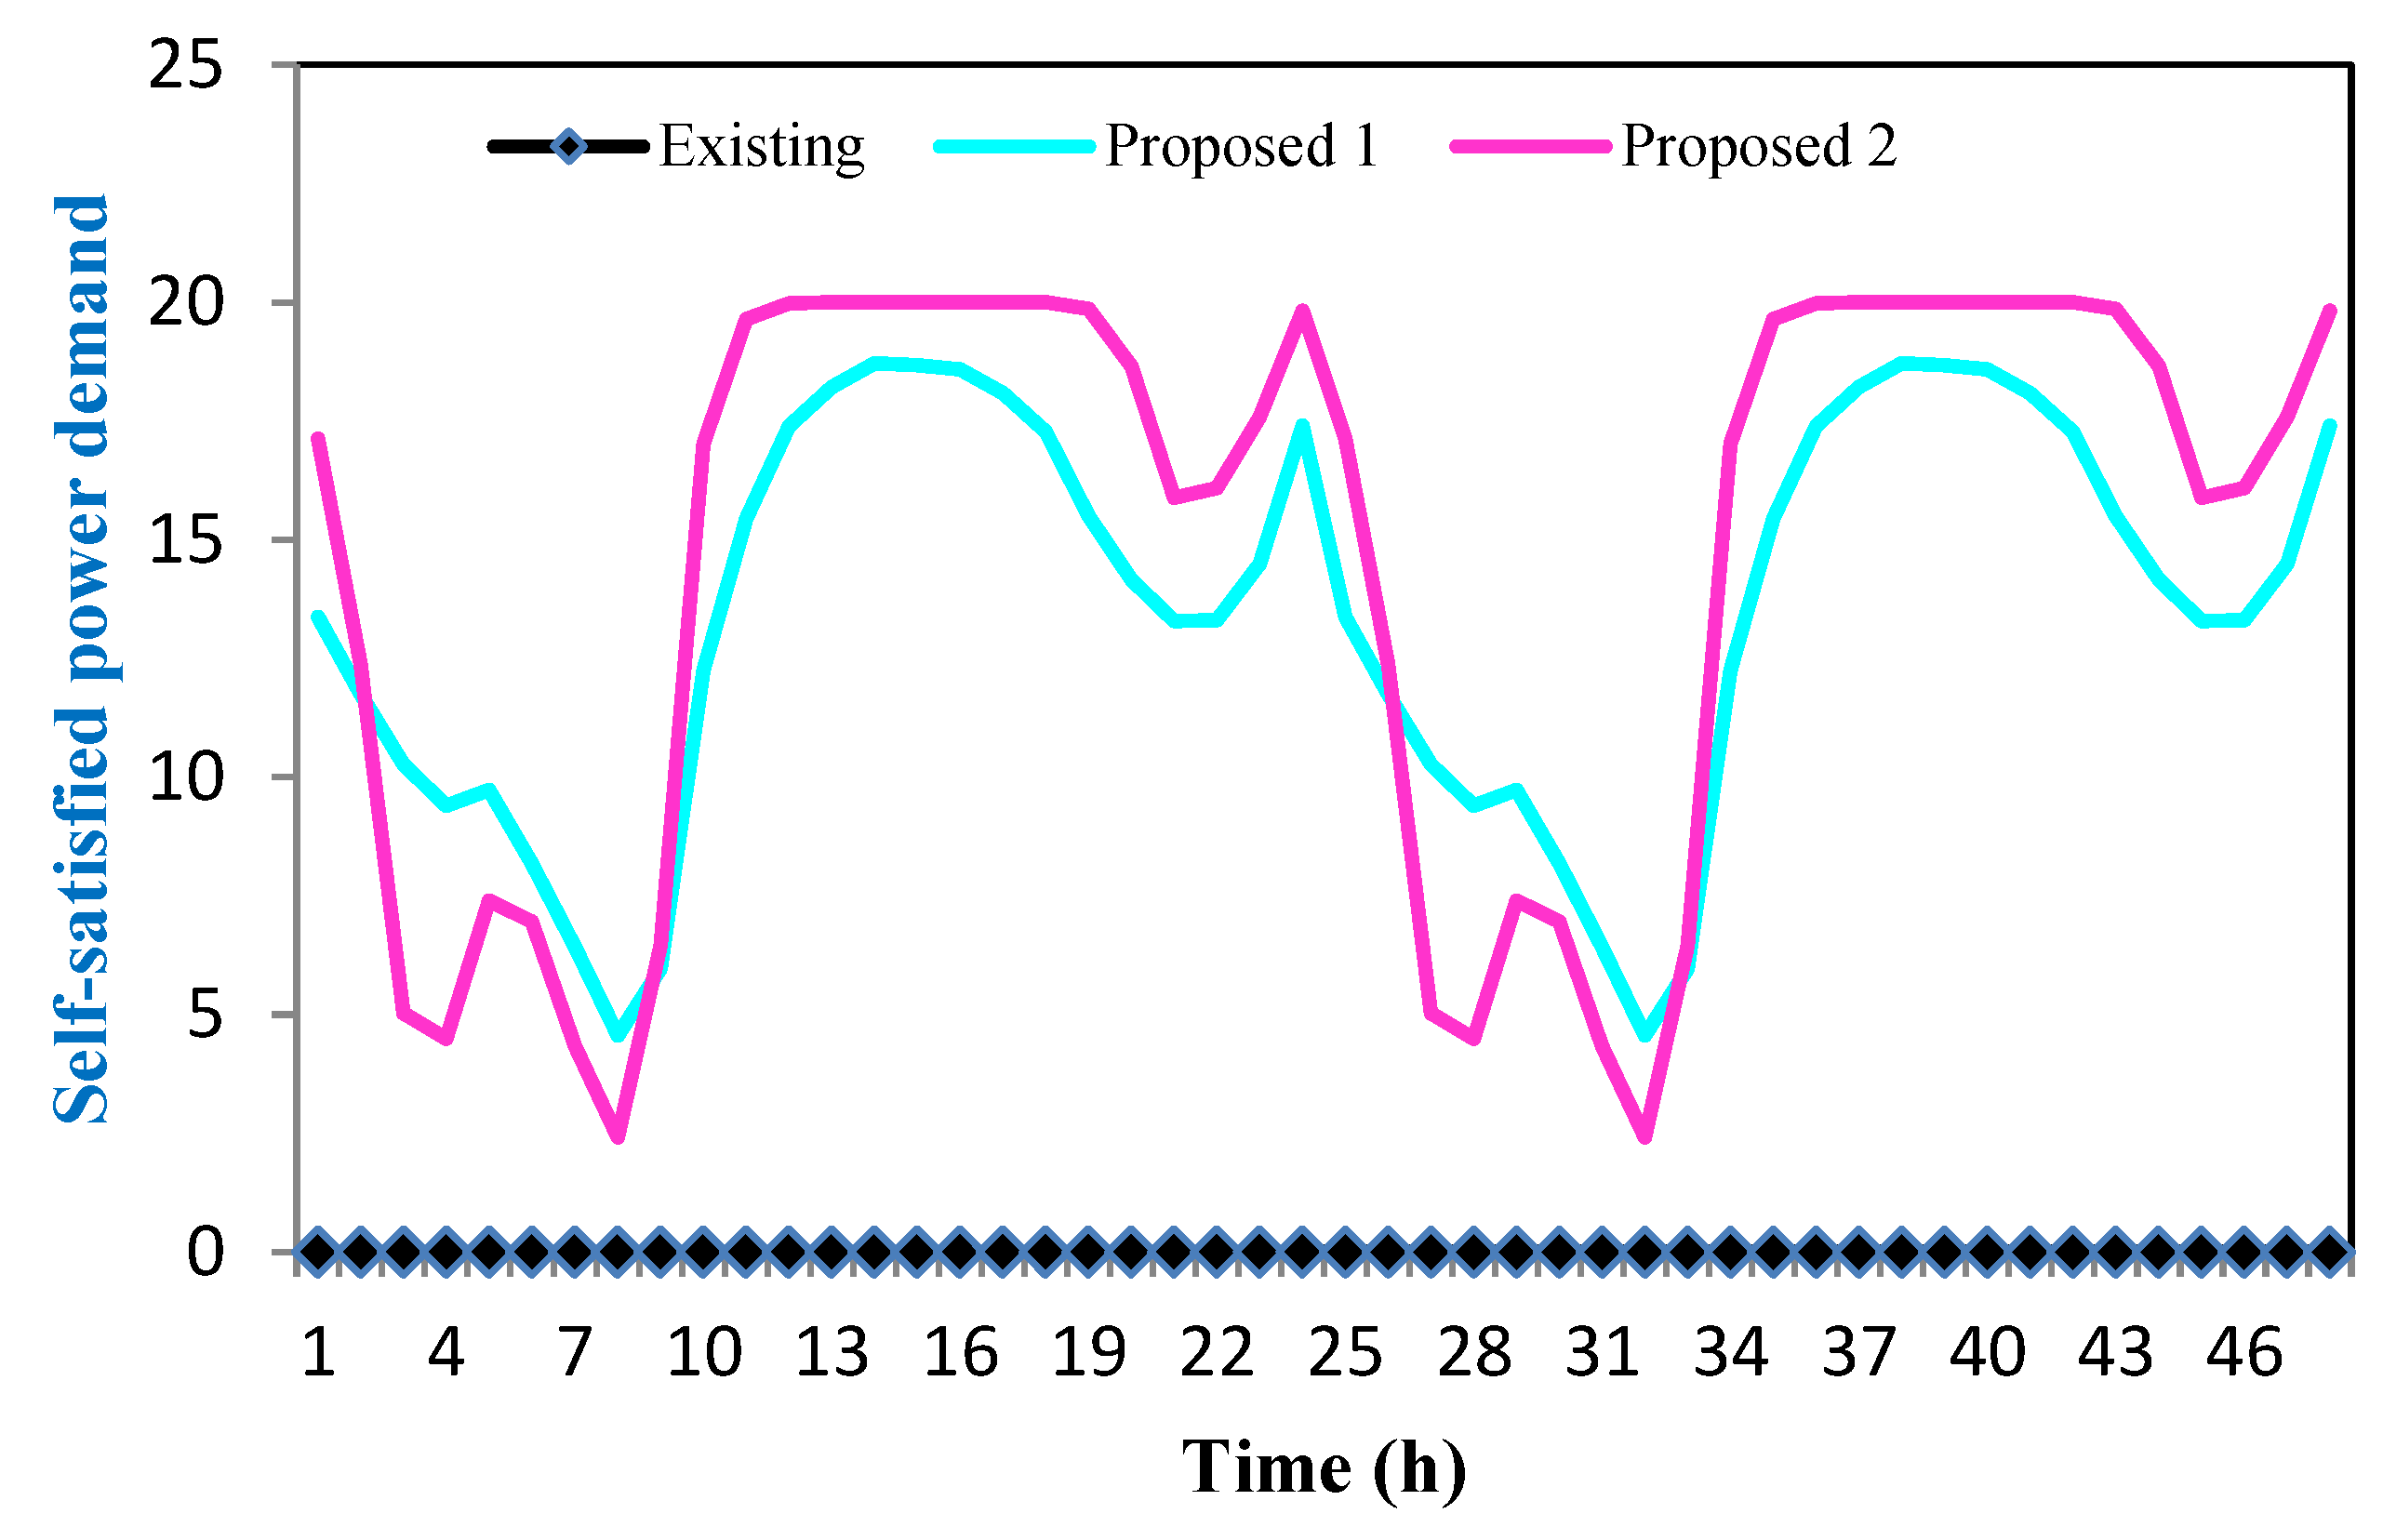
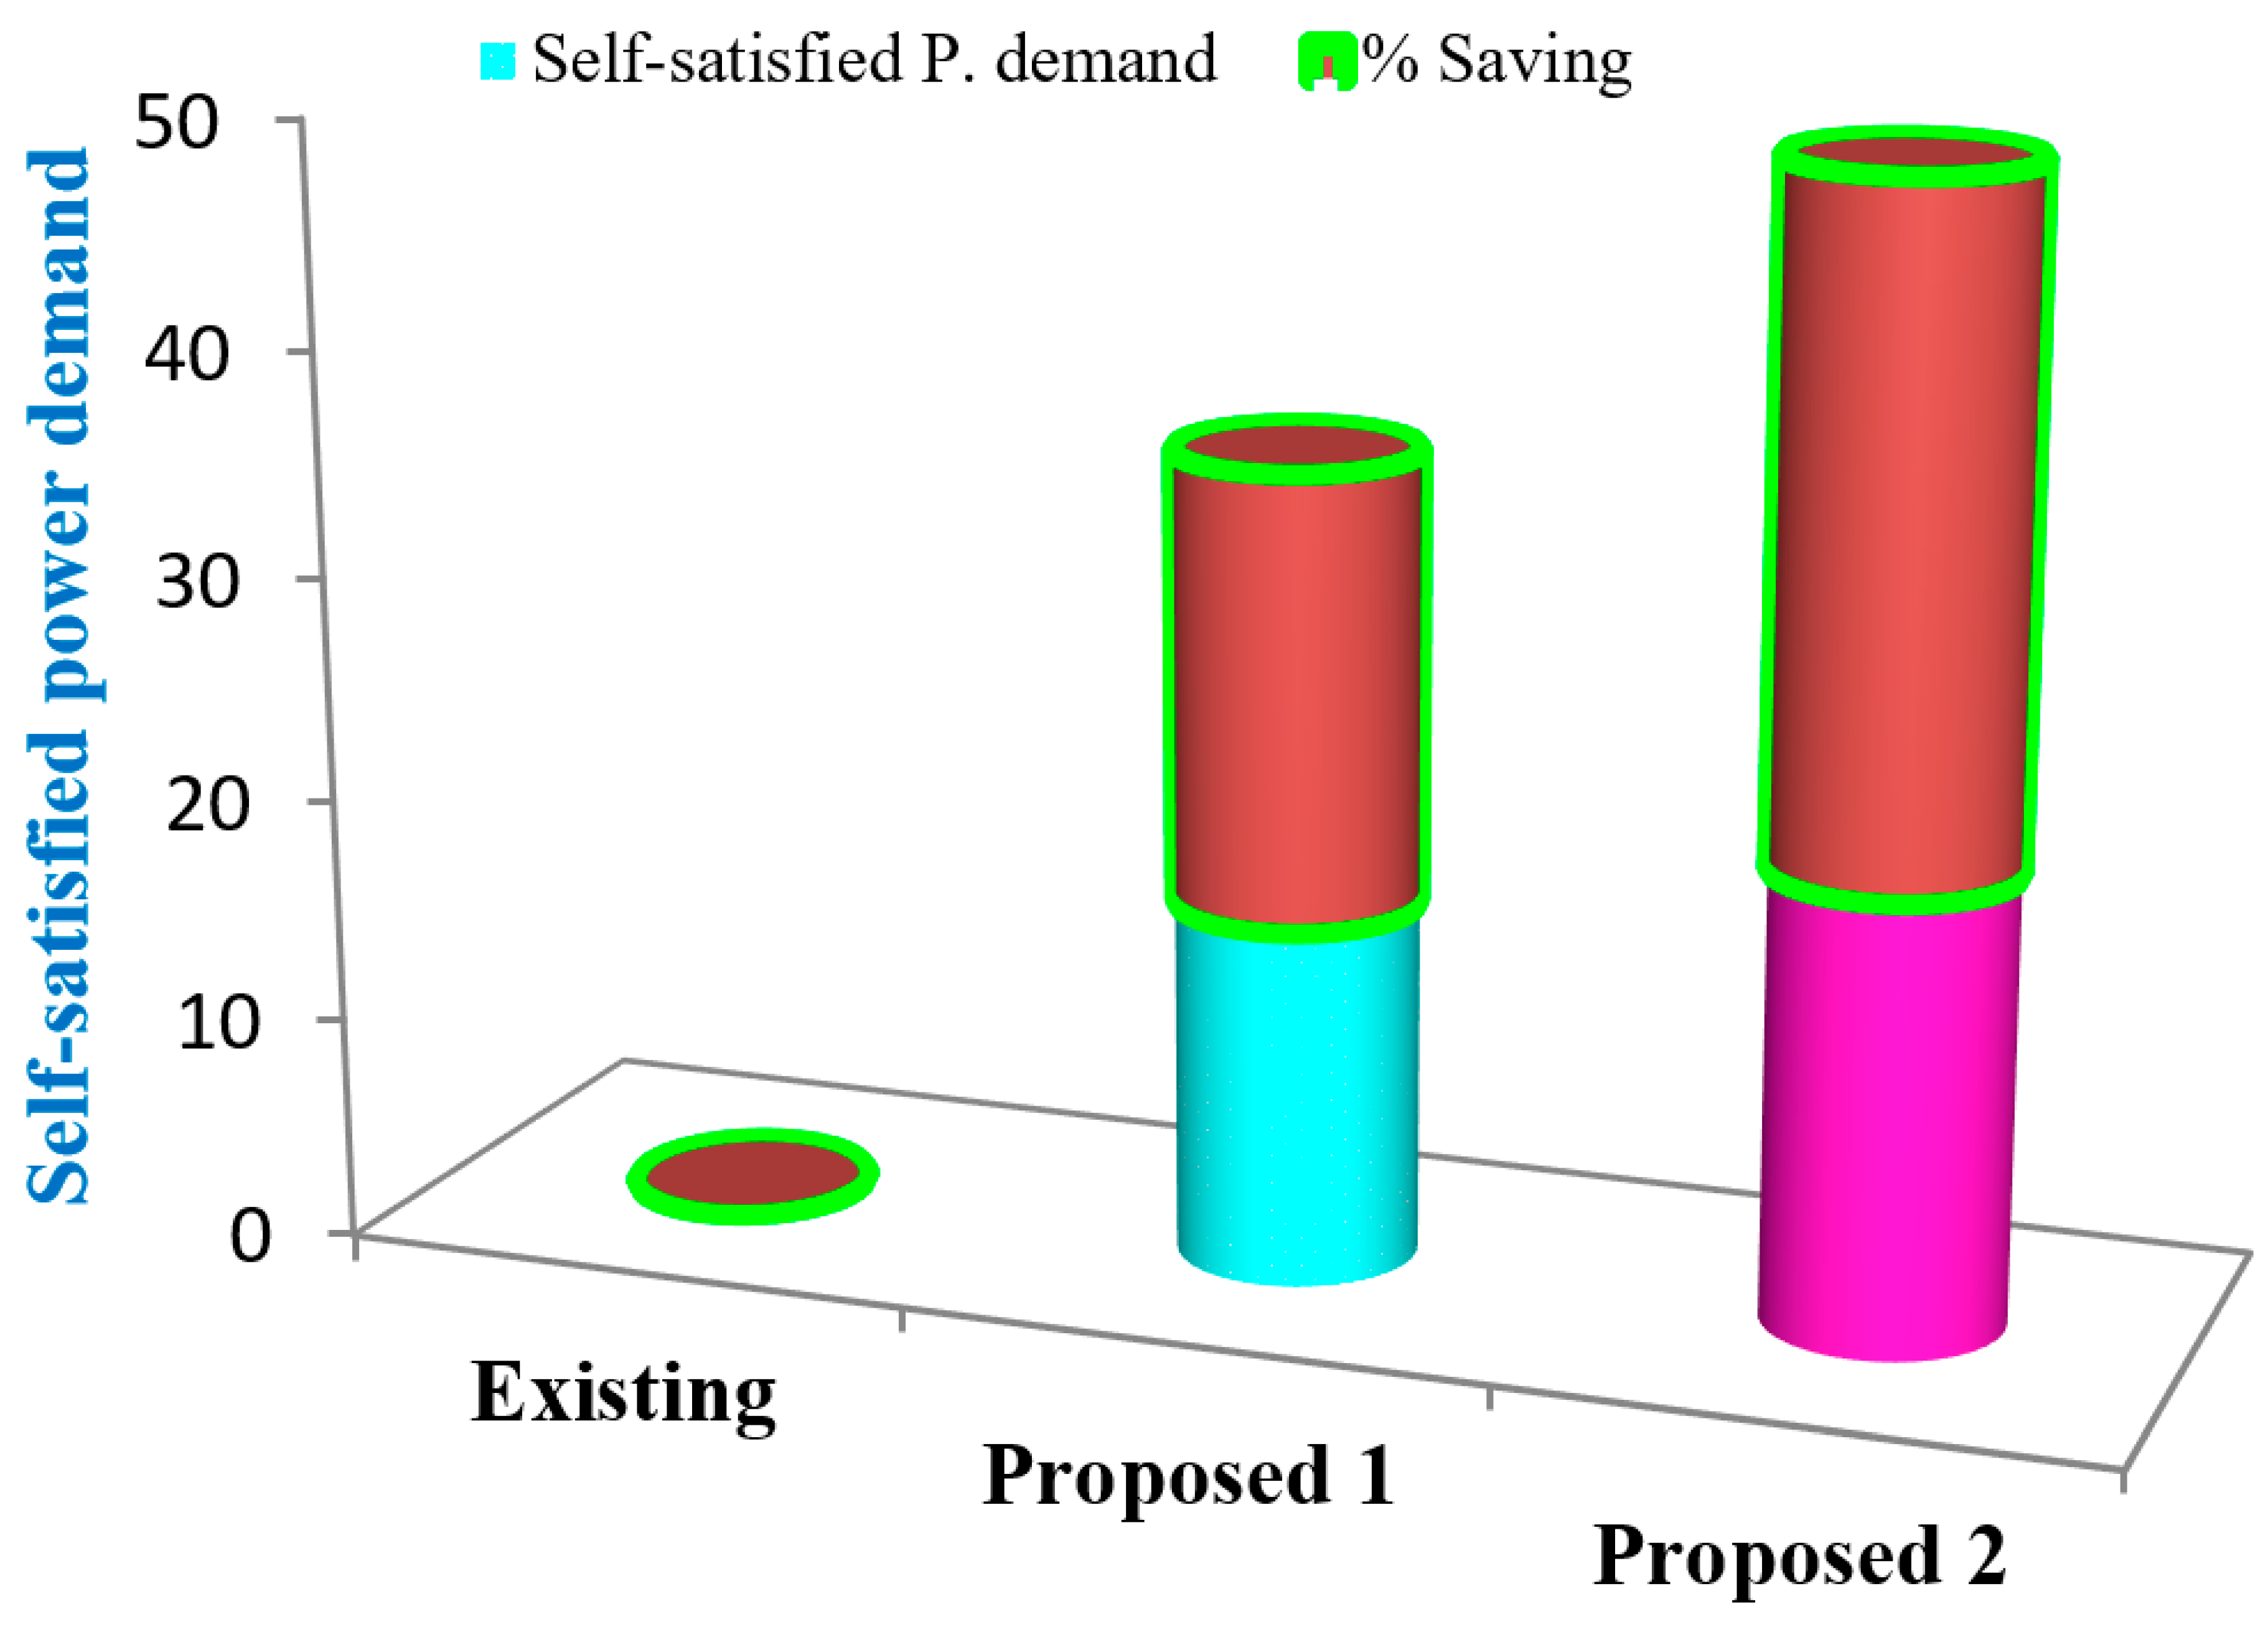
Self-satisfied power demand is achieved using energy allocation algorithm (EAA).
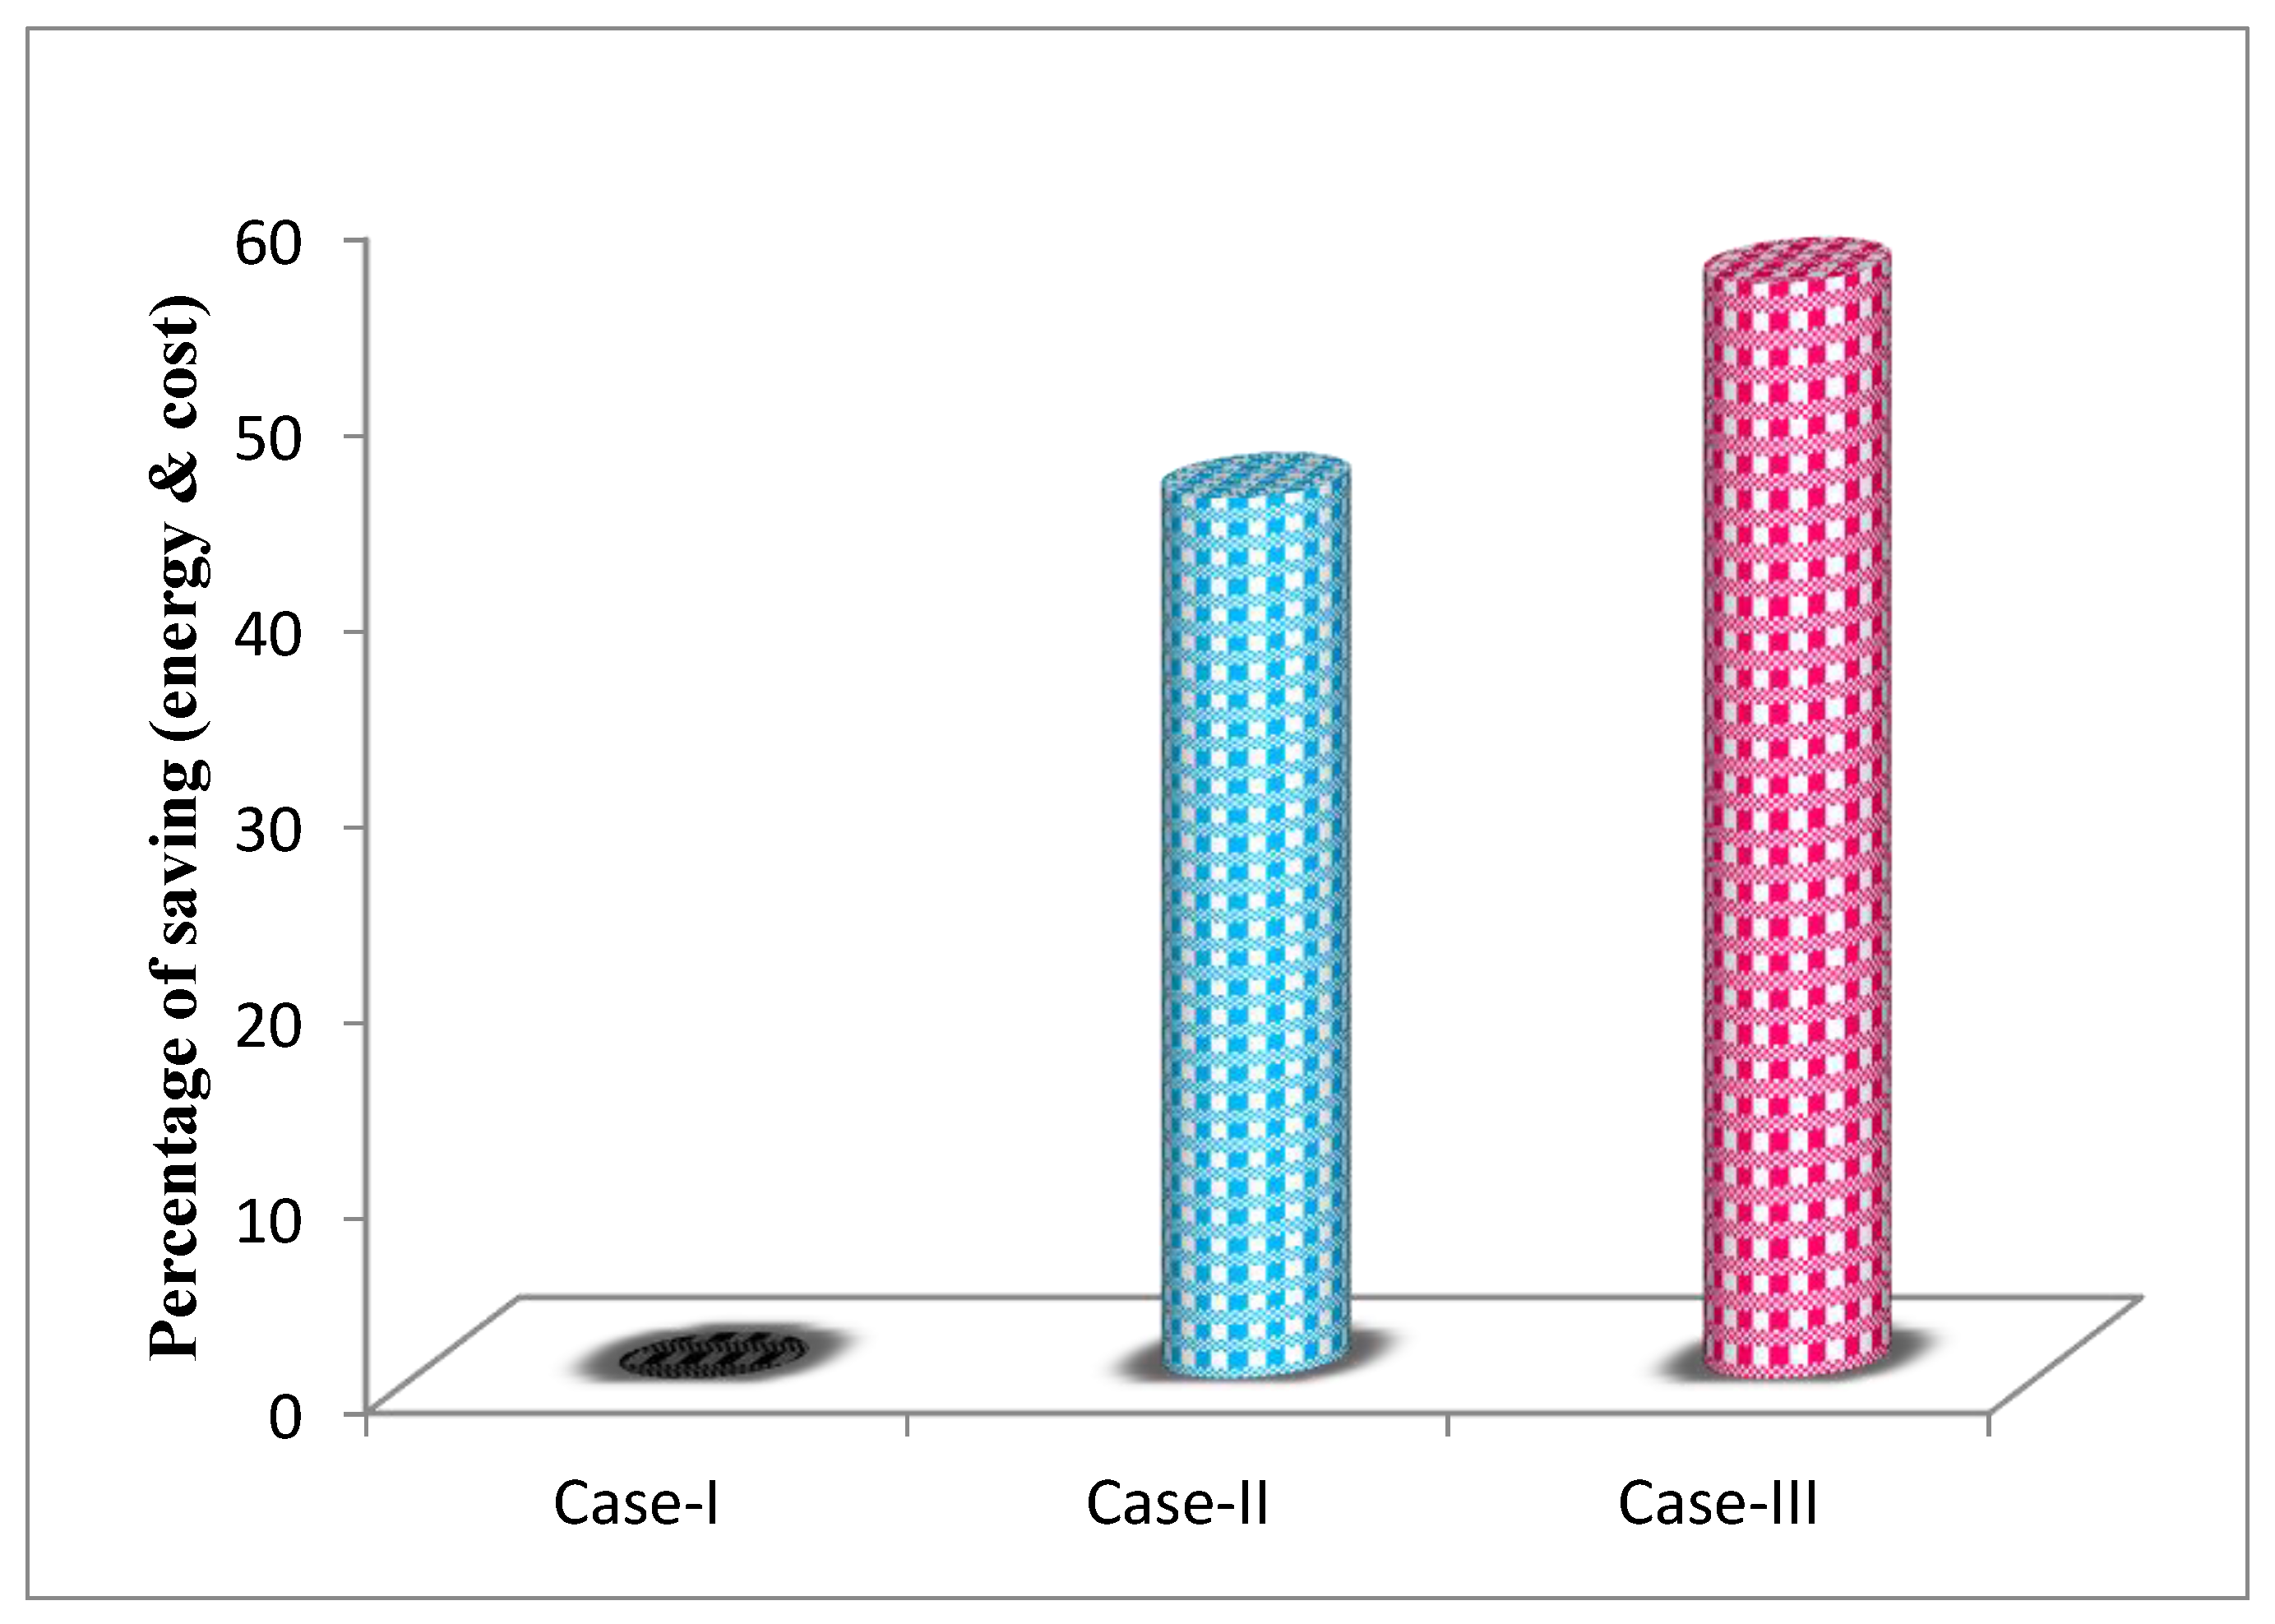
Optimal energy and cost saving are achieved and outlined properly.
The rest of the paper is organized as follows:
Section 2 discusses the problem description and smart grid architecture including advanced smart metering infrastructure.
Section 3 explains the system model including system components, such as a solar generator, wind generator, energy storage systems, loads and utility grid, mathematical modeling of a smart home, and the proposed algorithms are also presented in this section. Analysis of the results and graphical representation of simulation results are elaborated in
Section 4. Finally, the conclusion with some future research directions is depicted in
Section 5.
2. Problem Description
This section outlines the proposed smart grid architecture and its intelligent features with the application of smart metering infrastructure in the smart grid framework.
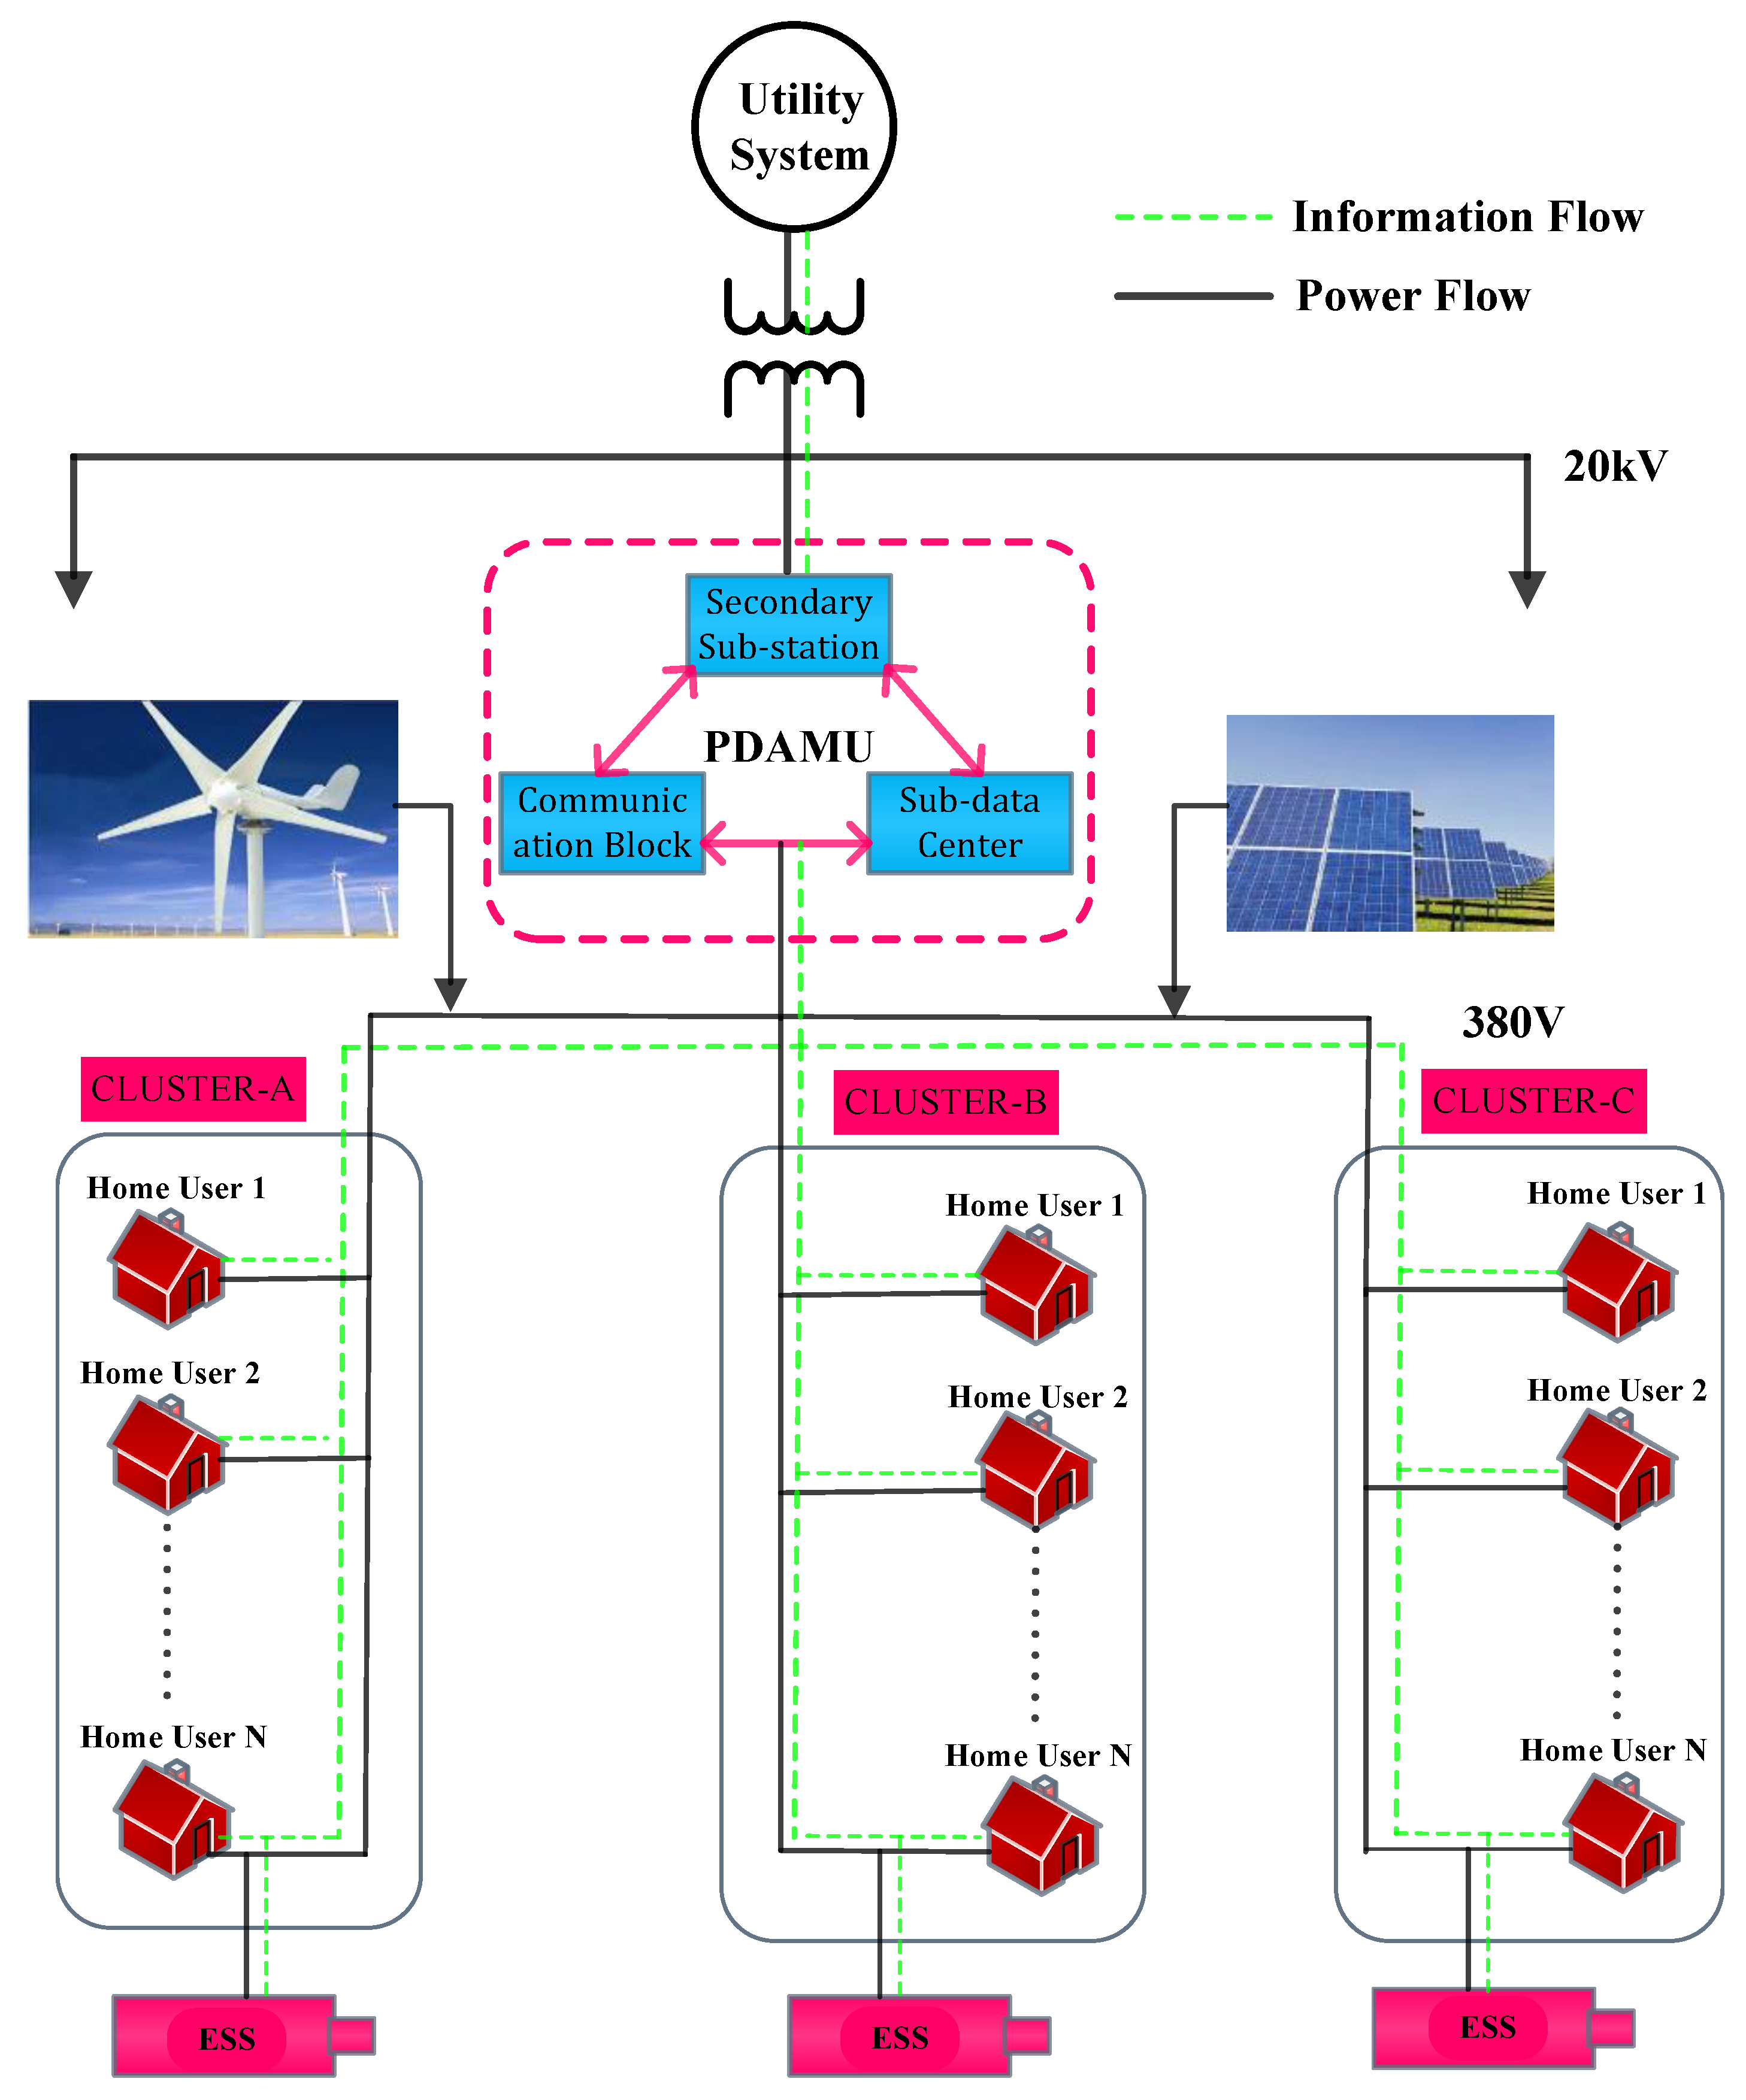
The proposed cluster-based smart grid architecture illustrated in
Figure 1 consists of several energy clusters to identify residential consumers rapidly to reduce operation time. The rapid growth in household appliances significantly increases the power demand for residential consumers. Nowadays, most of the electricity consumption is met by fossil fuel-based generation which severely affects the environment by emitting greenhouse gas [
17]. According to the international standard, each country must put a cap on their carbon emissions to save the environment. Thus, researchers are working hard to figure out new means of power generation. In this context, the integration of RESs and ESS is found to be one of the most cost-effective and environment-friendly solutions [
17,
25,
26]. Moreover, the existing power system is already vulnerable due to the large application of non-linear loads [
27].
The proposed smart grid architecture is designed and developed considering renewable energy sources (RESs) and energy storage systems (ESS). The smart grid community contains a group of residential consumers with smart meters, equipped with a wireless interface. All home appliances are connected via wireless connection with smart meters to monitor real-time energy consumption and pricing. If any residential consumer requires more power than the usual consumption, then the consumer sends the extra power demand signal to the power data aggregator and management unit (PDAMU) in real time. The energy community is divided into three energy clusters, namely clusters A, B, and C. Each cluster has independent energy storage to support energy while renewable energy generation and utility supply is off. In addition, when all forms of supply, including renewable energy, cluster storage, and power-sharing, are unable to provide power, then the utility company assists the power supply and the users have to pay for this energy demand as an extra cost.
Normally, household load consists of lights, fans, televisions, computers, refrigerators, space heaters, washing machines, dishwashers, and so on. Each premise has an energy meter to record utility consumption and convey back the collected energy data to the utility operator. The utility system reports back the power consumption bills to the users for a certain period and the user pays for the consumption. This structure does not allow customers to play an important role in the energy market. Thus, the customers are unable to reduce energy costs by selling their surplus energy if they have any rooftop PV solar or energy storage system (ESS).
Most of the residential consumers face some difficulties during energy reception from the utility operator such as unstable voltage supply, increased power losses in the service domain, peak load tariff, unexpected system maintenance, and so on. To minimize these drawbacks, the residence energy management (REM) system is an optimal solution. To address these issues, a cluster-based REM system is proposed to provide an economic and long-term solution. In this research, a cluster-based energy management scheme is applied to schedule household appliances based on peak, off-peak and mid-peak demands to reduce utility charges. If any particular consumer has an energy demand, PDAMU manages the user’s requested energy demand based on request priorities. Energy clustering is an efficient technique to manage energy demand as fast as possible by keeping individual energy use IDs. Each residence has a unique energy use ID to keep track of PDAMU and trace them while the energy crisis appears. For better understanding, this can be outlined as Rony-A or Rony-B or Rony-C. Here, Rony is the consumer name and A, B, and C are the energy clusters.
Smart meters (SM) are one of the vital parts of the smart grid architecture which is employed to track energy use and to facilitate information exchange between the consumers and utility companies [
28]. A smart home provides an interface between consumers and appliances to track consumption patterns and take essential optimized decisions [
29]. The smart meters connect residential appliances and facilitate the users to shift from peak hours to off-peak hours [
30]. The voltage, frequency, and power factors are key measurements which are utilized in smart meters to monitor real time energy consumption rates.
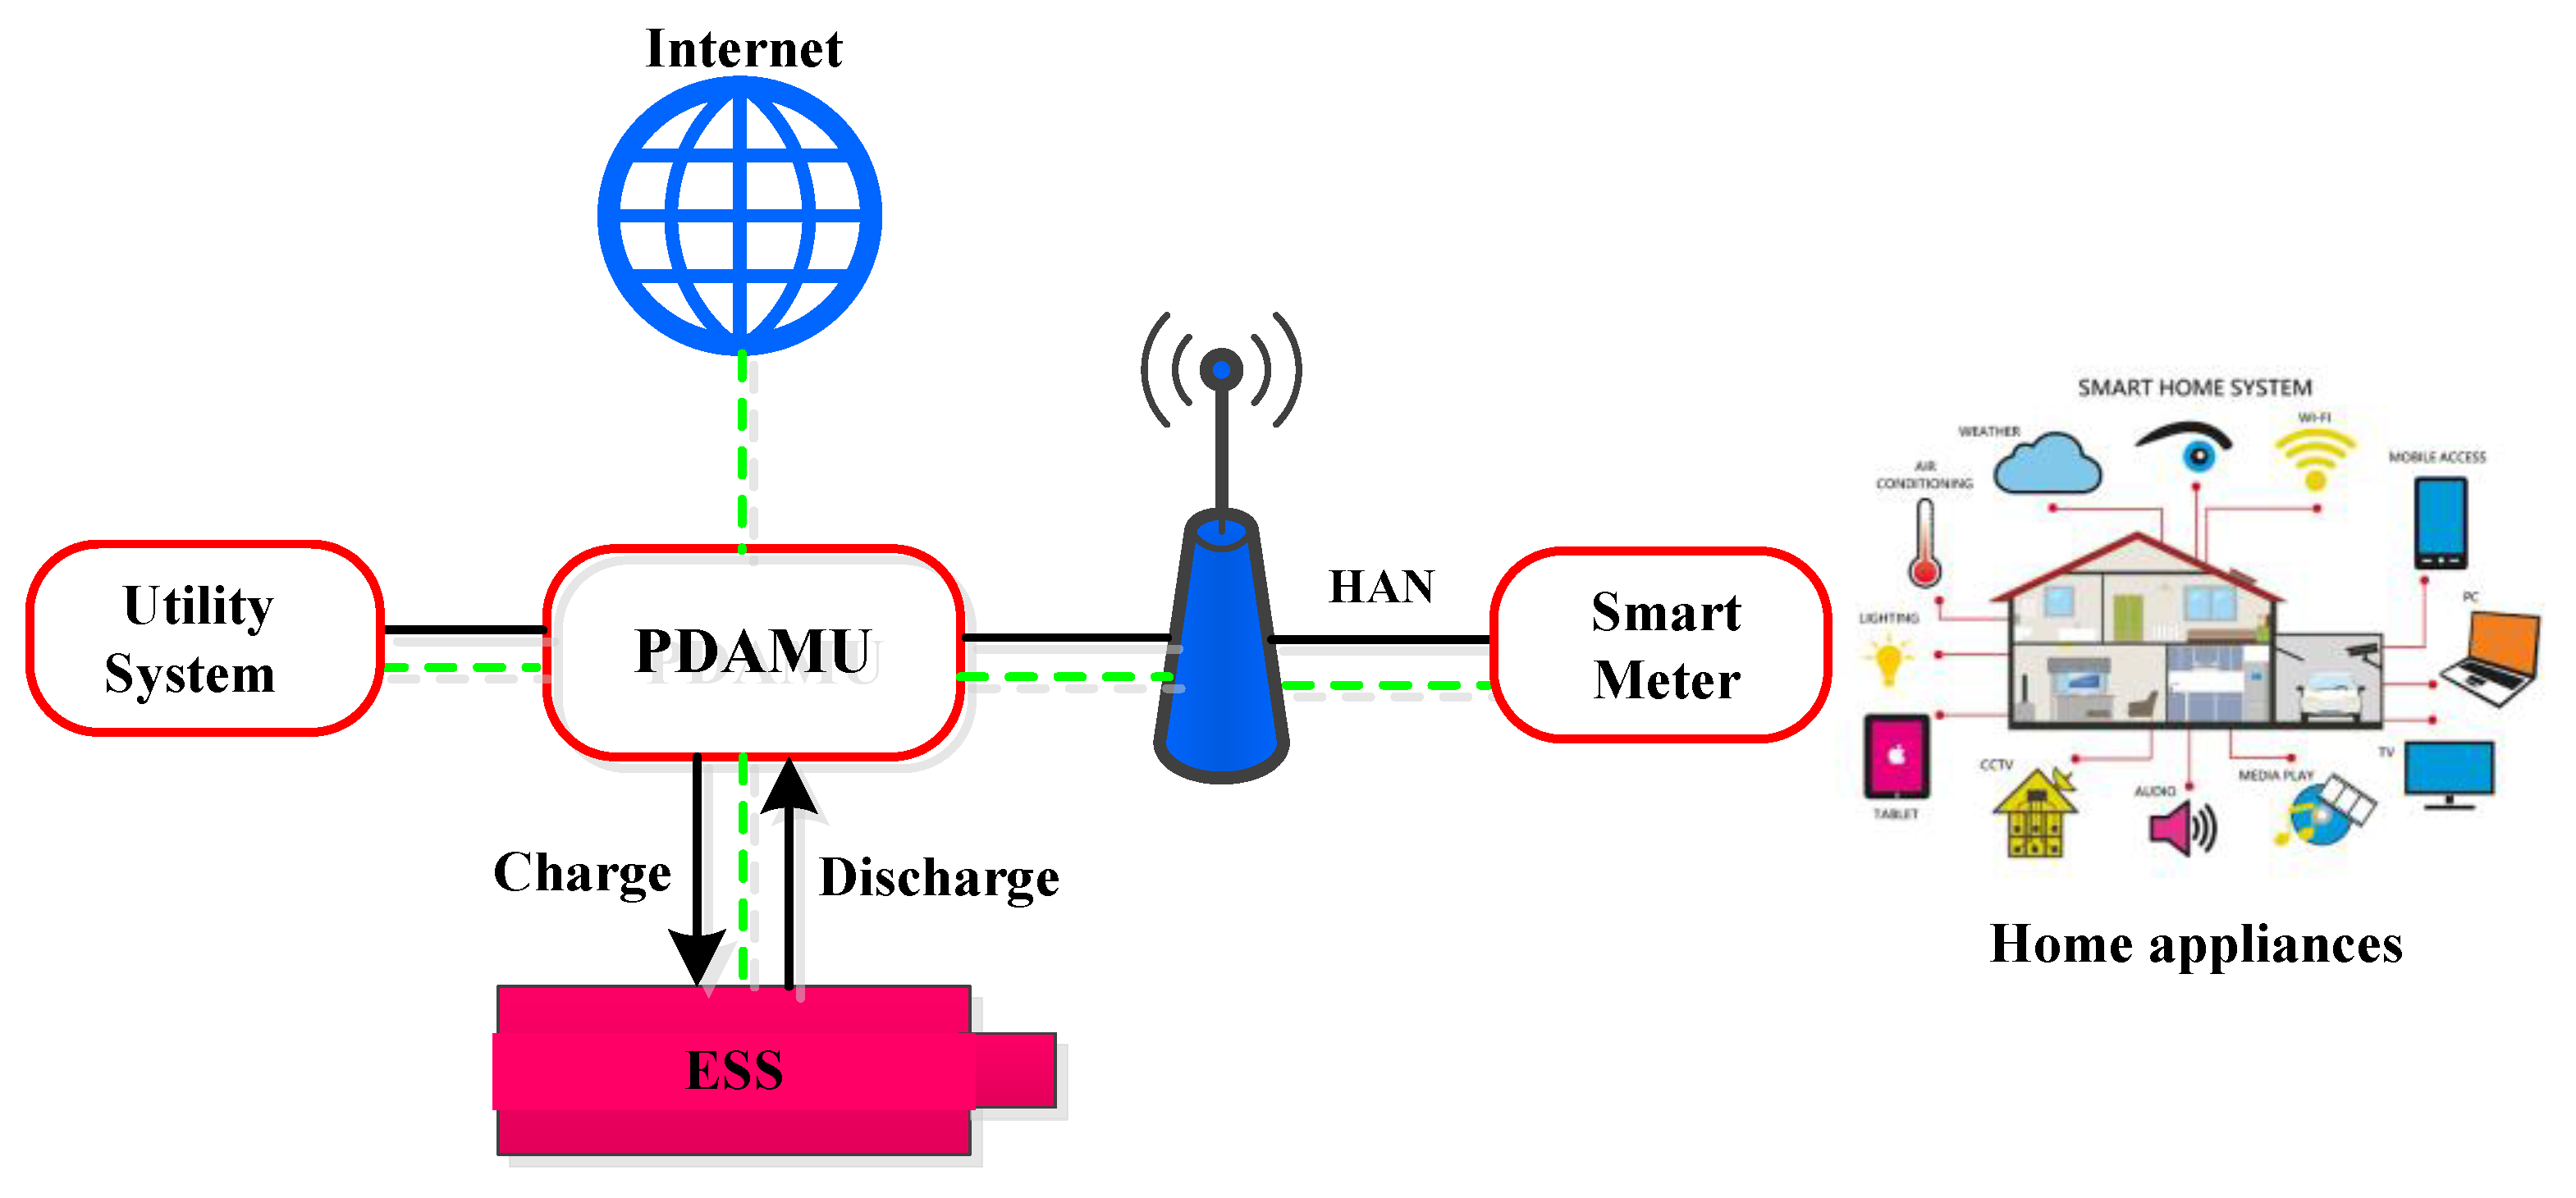
A smart metering system consists of measuring devices and communication links as visualized in
Figure 2. The time-of-use pricing, DSM, and automatic meter reading framework are the key features of the smart meter architecture. The home area network (HAN) is deployed within the residential units for linking several electrical appliances to the smart meter [
31]. PDAMU, the main controlling unit of the smart grid architecture, which is installed in a secondary sub-station in the distribution network, allows the smart meter to send and receive pricing information, the real-time energy consumption, and extra power demand. The several sub-data centers in PDAMU update the smart meter data via wireless communication links. The consumer extra power demand is sent to PDAMU using the smart meters through the communication links. Then, the PDAMU initiates the process to evaluate the battery state of charge of all users within the coverage area to meet this extra power demand [
32]. In this study, the PDAMU evaluation process and extra power demand are managed with the efficient energy allocation algorithm (EAA) which considers both users’ extra power and the supply from the utility company.
The total hourly and daily basis energy consumption with the cost is evaluated using a clustering-based energy management scheme for residential prosumers. In general, the peak load hours’ energy price is higher than that of the off-peak load hours, which is set by the utility operator. In addition, mid-peak hours have a regular price which is between the price of off-peak hours and peak hours. To overcome the peak demand, RESs and ESS support the smart grid system as alternative sources of energy. If the RES’s generation is not sufficient to meet the power demand, then communication is made with PDAMU for another source of energy. The requested power demand is managed by a forwarding message through the smart grid community and the users receive power according to the priority of the request. Any consumer shares individual battery power while they have at least 50% of his rated capacity due to self-sustainability.
3. System Modeling and the Proposed Algorithm
This section deals with system components for the cluster-based energy management scheme in the smart grid framework. Solar and wind generators, an energy storage system and a typical energy consumption profile for residential consumers are also considered. Furthermore, the home appliances considering peak-load, mid-peak, and off-peak loads and real-time electricity prices scenarios are modeled.
3.1. Wind Generator
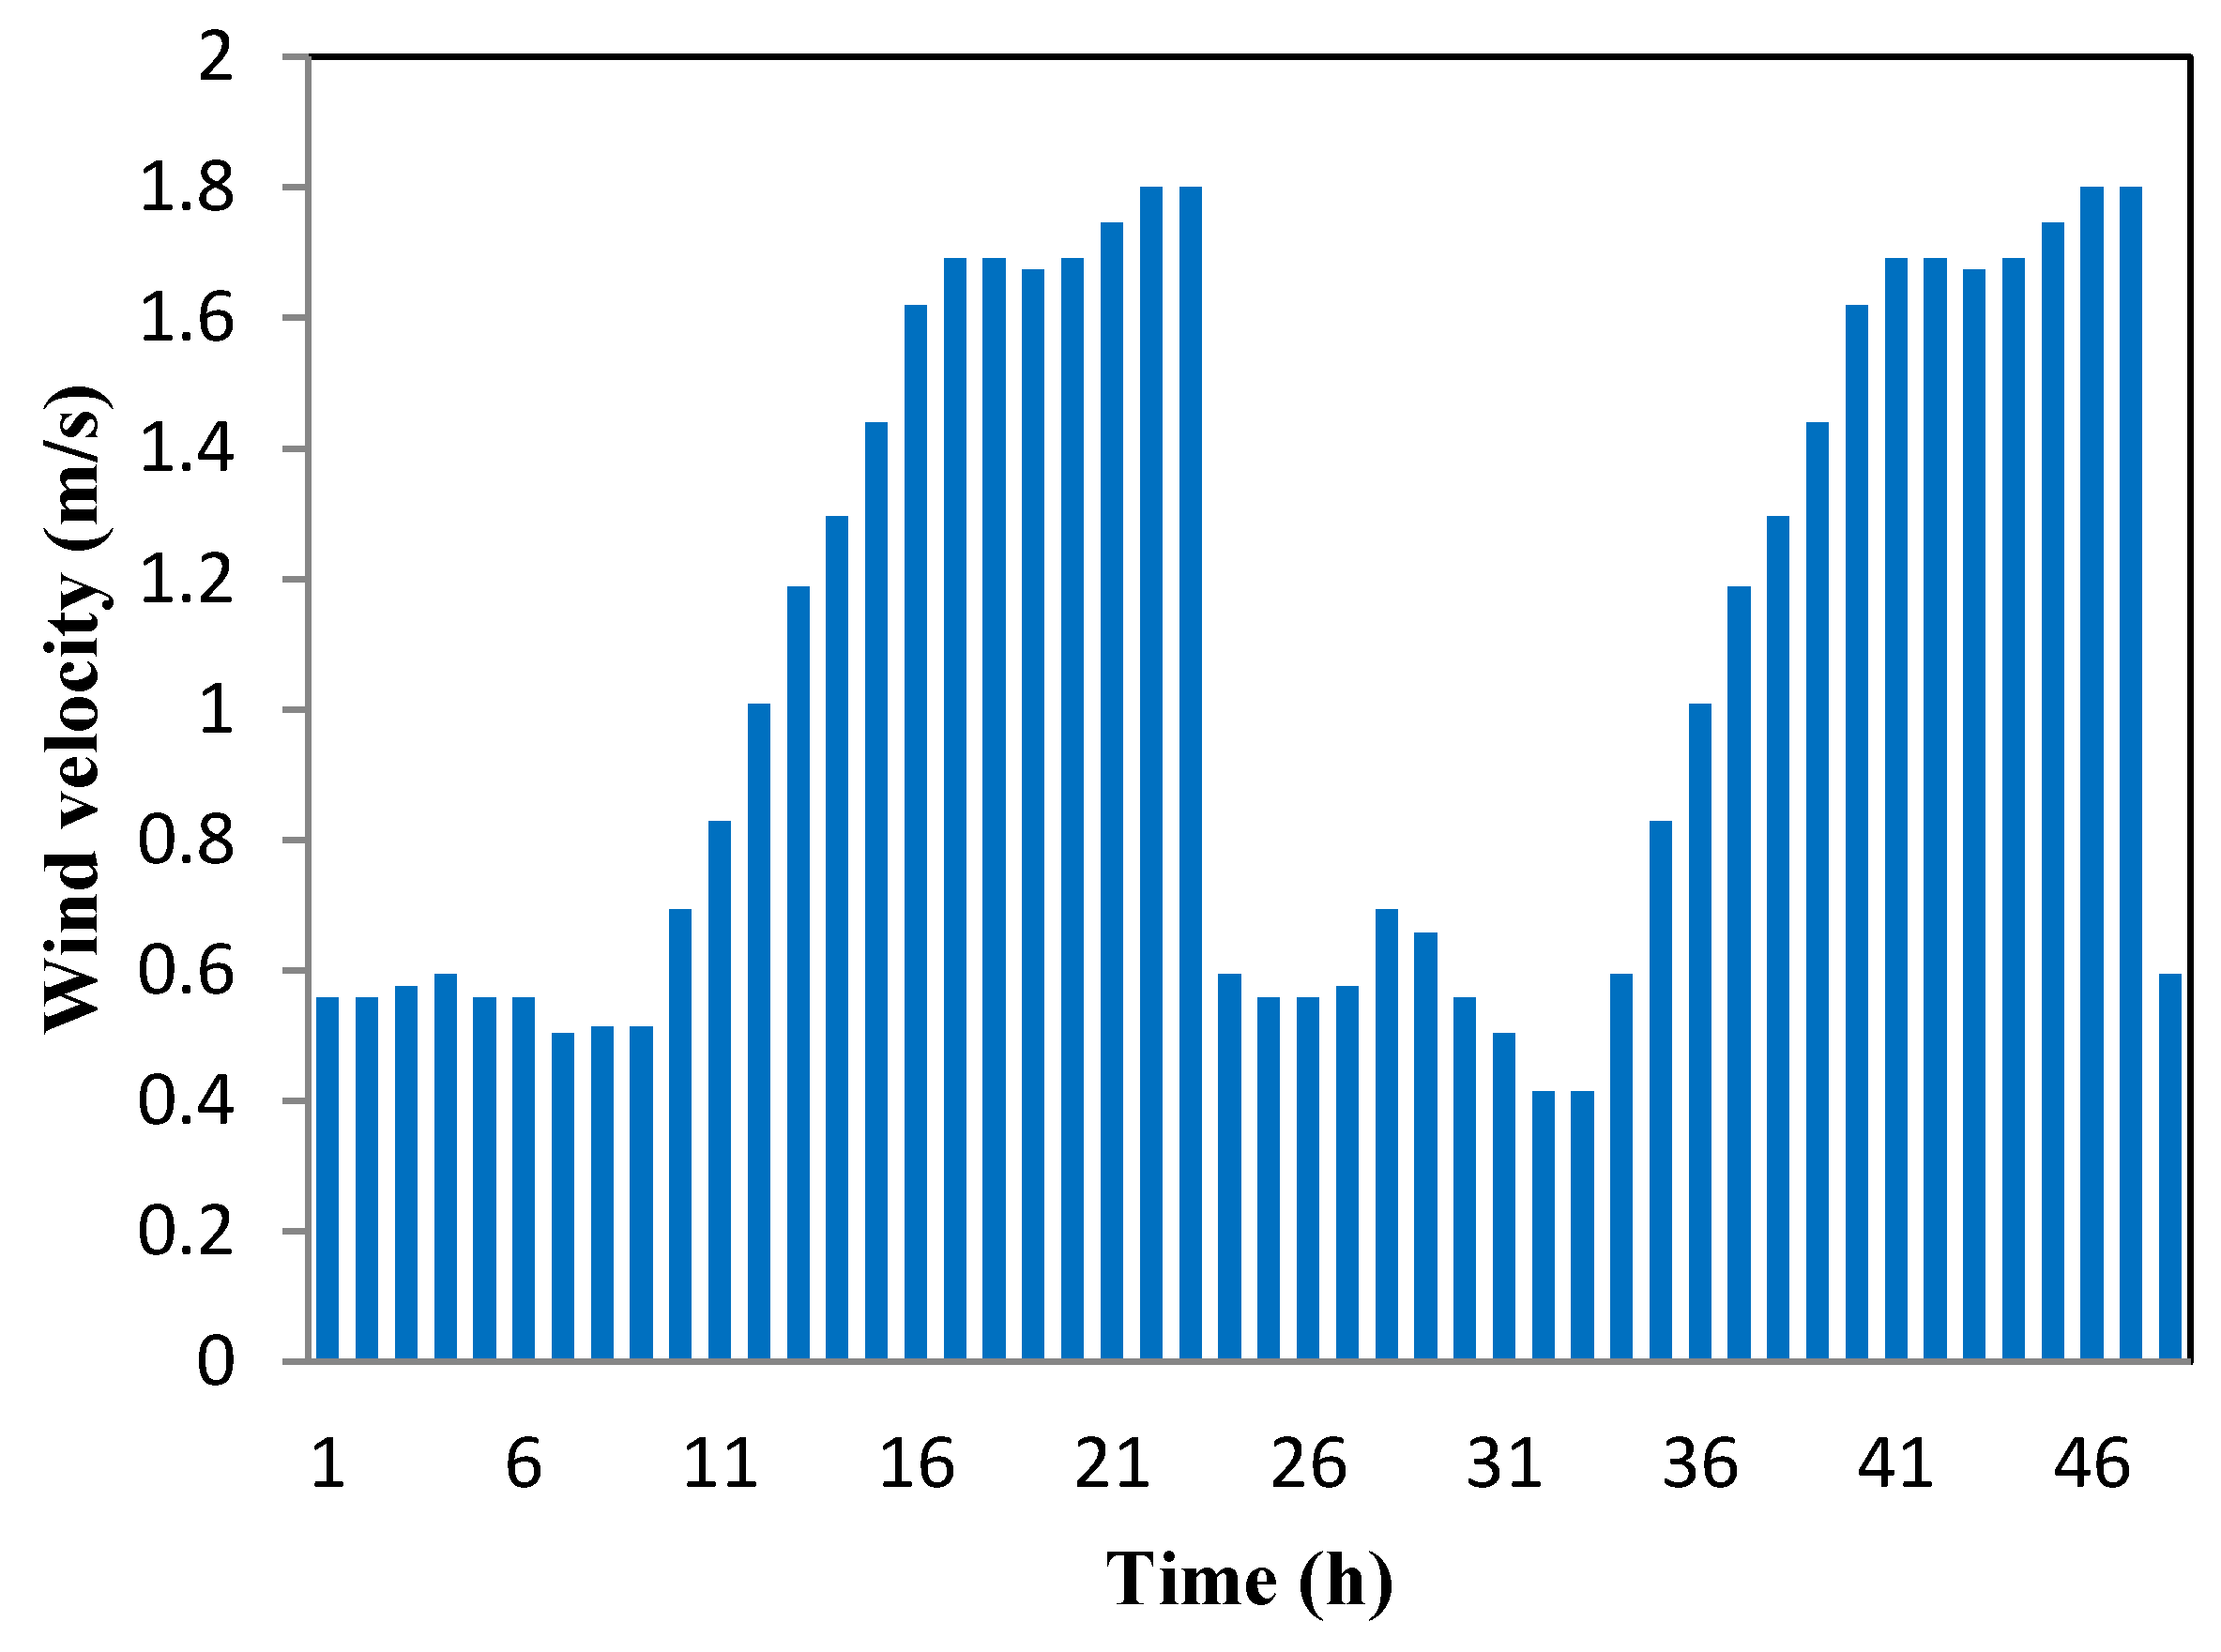
Wind power is an alternative source of energy available around the globe with abundant features. It is the method of power generation by rotating turbine blades installed at an elevated height. However, the power generated from wind turbines is highly intermittent and stochastic. It is highly dependent on the available wind speed and significantly varies based on the installation height.
Figure 3 below illustrates wind speed over a range of time. The following power-law equation is used to convert wind speed recorded by anemometer (installed at tower heights) and transfer them based on hub heights [
33]:
In the equation above,
v0 and
v are the wind velocity at the hub height
h0 and
h, respectively, and
α is the power-law exponent which is a function of parameters [
34]. The value of
α is generally considered as 1/7 for open space. The power generated by wind turbines is a function of wind velocity, and a piece-wise function relates the relationship between the wind speed and output power as follows [
35]:
where
Pr and
vr are the rated electrical power and rated wind speed, respectively, and
v,
vc and
vf represent wind speed, cut-in wind speed, and cut-off wind speed, respectively. Turbine manufacturers define a cut-in and cut-off speed due to safety concerns. The wind generator does not produce any power beyond the cut-off wind speed. The total output power for a number of wind turbines can be expressed as follows [
36]:
where
Nw is the number of wind generator.
3.2. Solar Generator
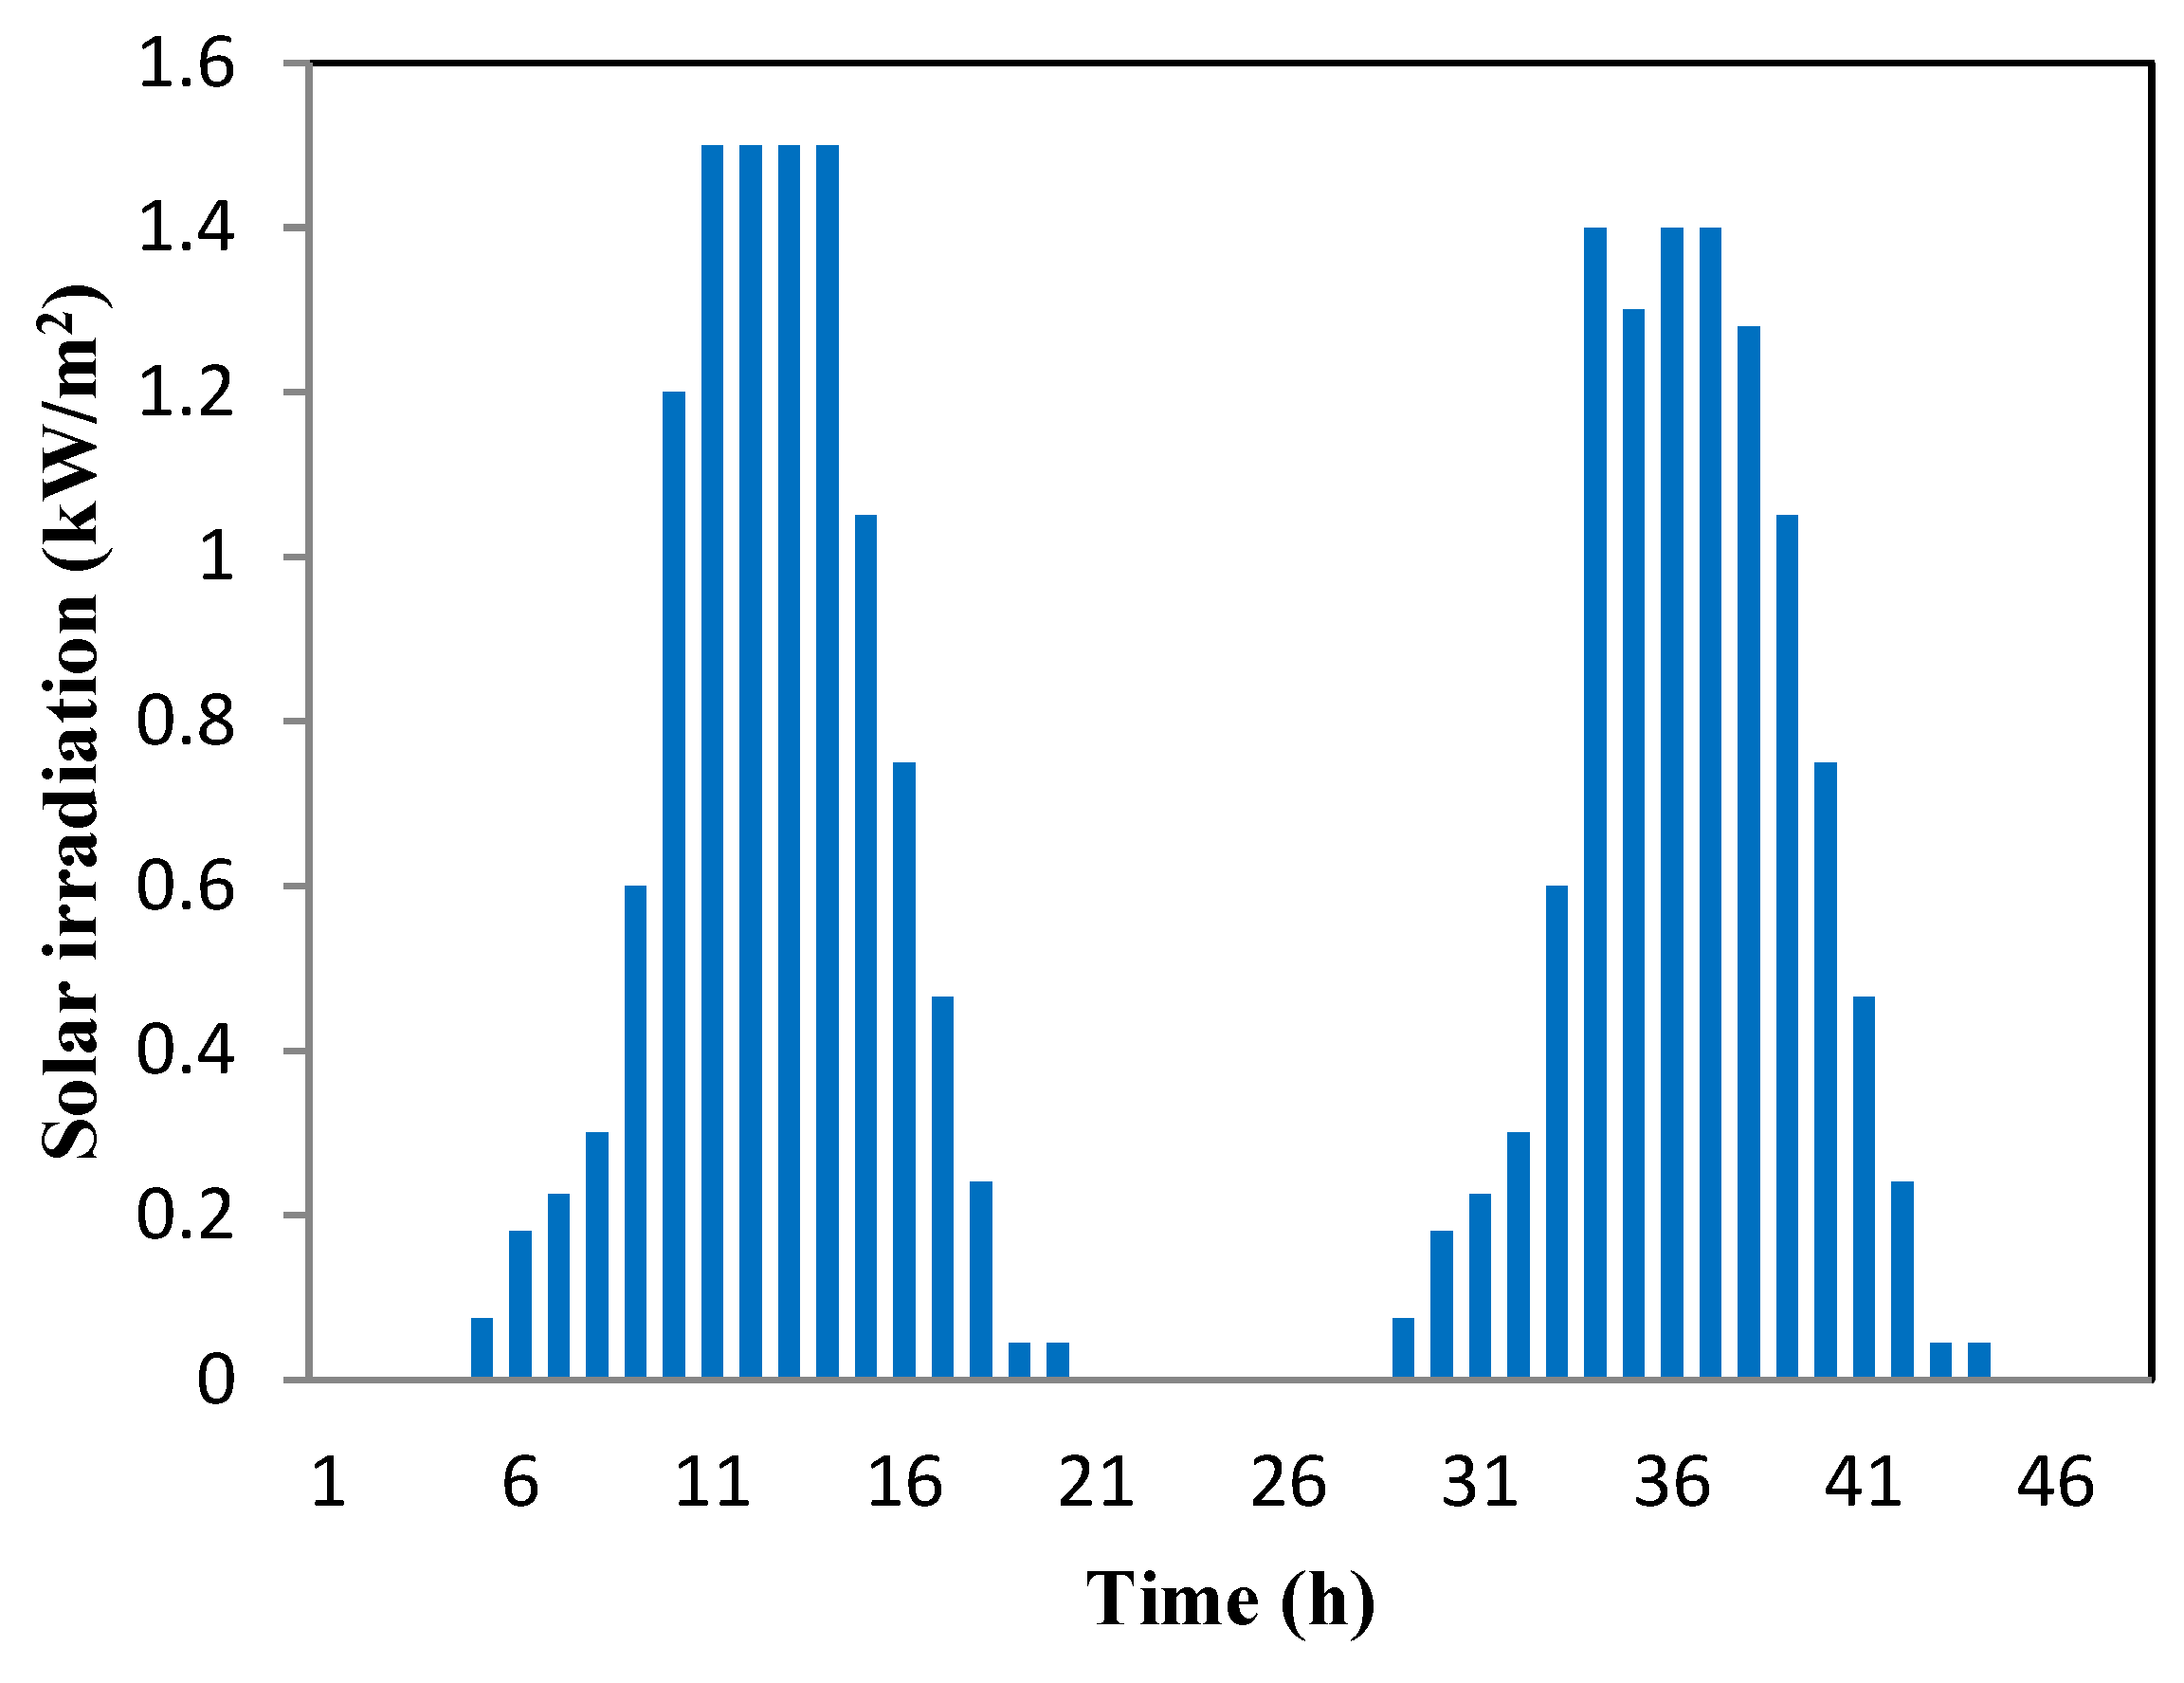
Photovoltaic (PV) panels use sunlight to convert solar energy into usable DC electricity. The amount of PV power generated depends on the array size, solar radiance and solar insolation. Solar radiance relies emphatically on the surrounding climate and varies significantly, as depicted in
Figure 4. The hourly pattern of solar irradiance as shown is used in this study for solar power generation and efficient cluster-based energy management development. To gain the maximum yield, PV panels are equipped with maximum power point tracking (MPPT) technology [
37]. The performance of a PV system is assessed based on its output power. Output power depends on the size of the array and the overall efficiency of the installed PV system. On the other hand, during dark and cloudy weather and the winter season, the output power generation is significantly lower than sunny days and this is a great drawback of this system. PV power output as a function of solar irradiance and being operated at the MPPT mode is defined using the following equation:
In Equation (1) above,
and
A are the overall system efficiency and area of PV panels respectively.
SI and
t0 denotes solar irradiation and surrounding air temperature, whereas
corresponds to the temperature coefficient of the maximum output power and is generally represented as a negative percentage per °C or K. The value of
depends on the PV technology and manufacturing parameters, it is considered as −0.005/°C for this study. The range of
for silicon cells is between 0.004 and 0.006 per °C [
38]. For several solar generators, the total output power can be extracted as follows:
where
Ns is the number of solar generators.
3.3. Energy Storage Systems
The several energy storage methods, such as flywheel energy storage, compressed air energy storage, superconducting magnetic energy storage, supercapacitor, and battery, are extensively employed in the smart grid system. These energy storage methods have numerous features, including response times, storage abilities, and peak current competences, which are used in many applications with several time-units. In this study, electrochemical batteries are used due to their capabilities to store energy for a long time compared to supercapacitors and others. The ESS facilitates a reduction in energy imbalance, by charging and discharging, which stems from the intermittent nature of RESs. The charging and discharging of the battery can be understood by the equations below [
25]:
Subject to the following battery constraints:
Battery energy level limits:
where
Pc(
t) is the charging power,
Pd(
t) is the discharging power,
t is the time,
BL(
t) is the energy storage, Δ
t is the time period, η
c is the charging efficiency, and η
d is the discharging efficiency.
3.4. Loads and Utility Grid
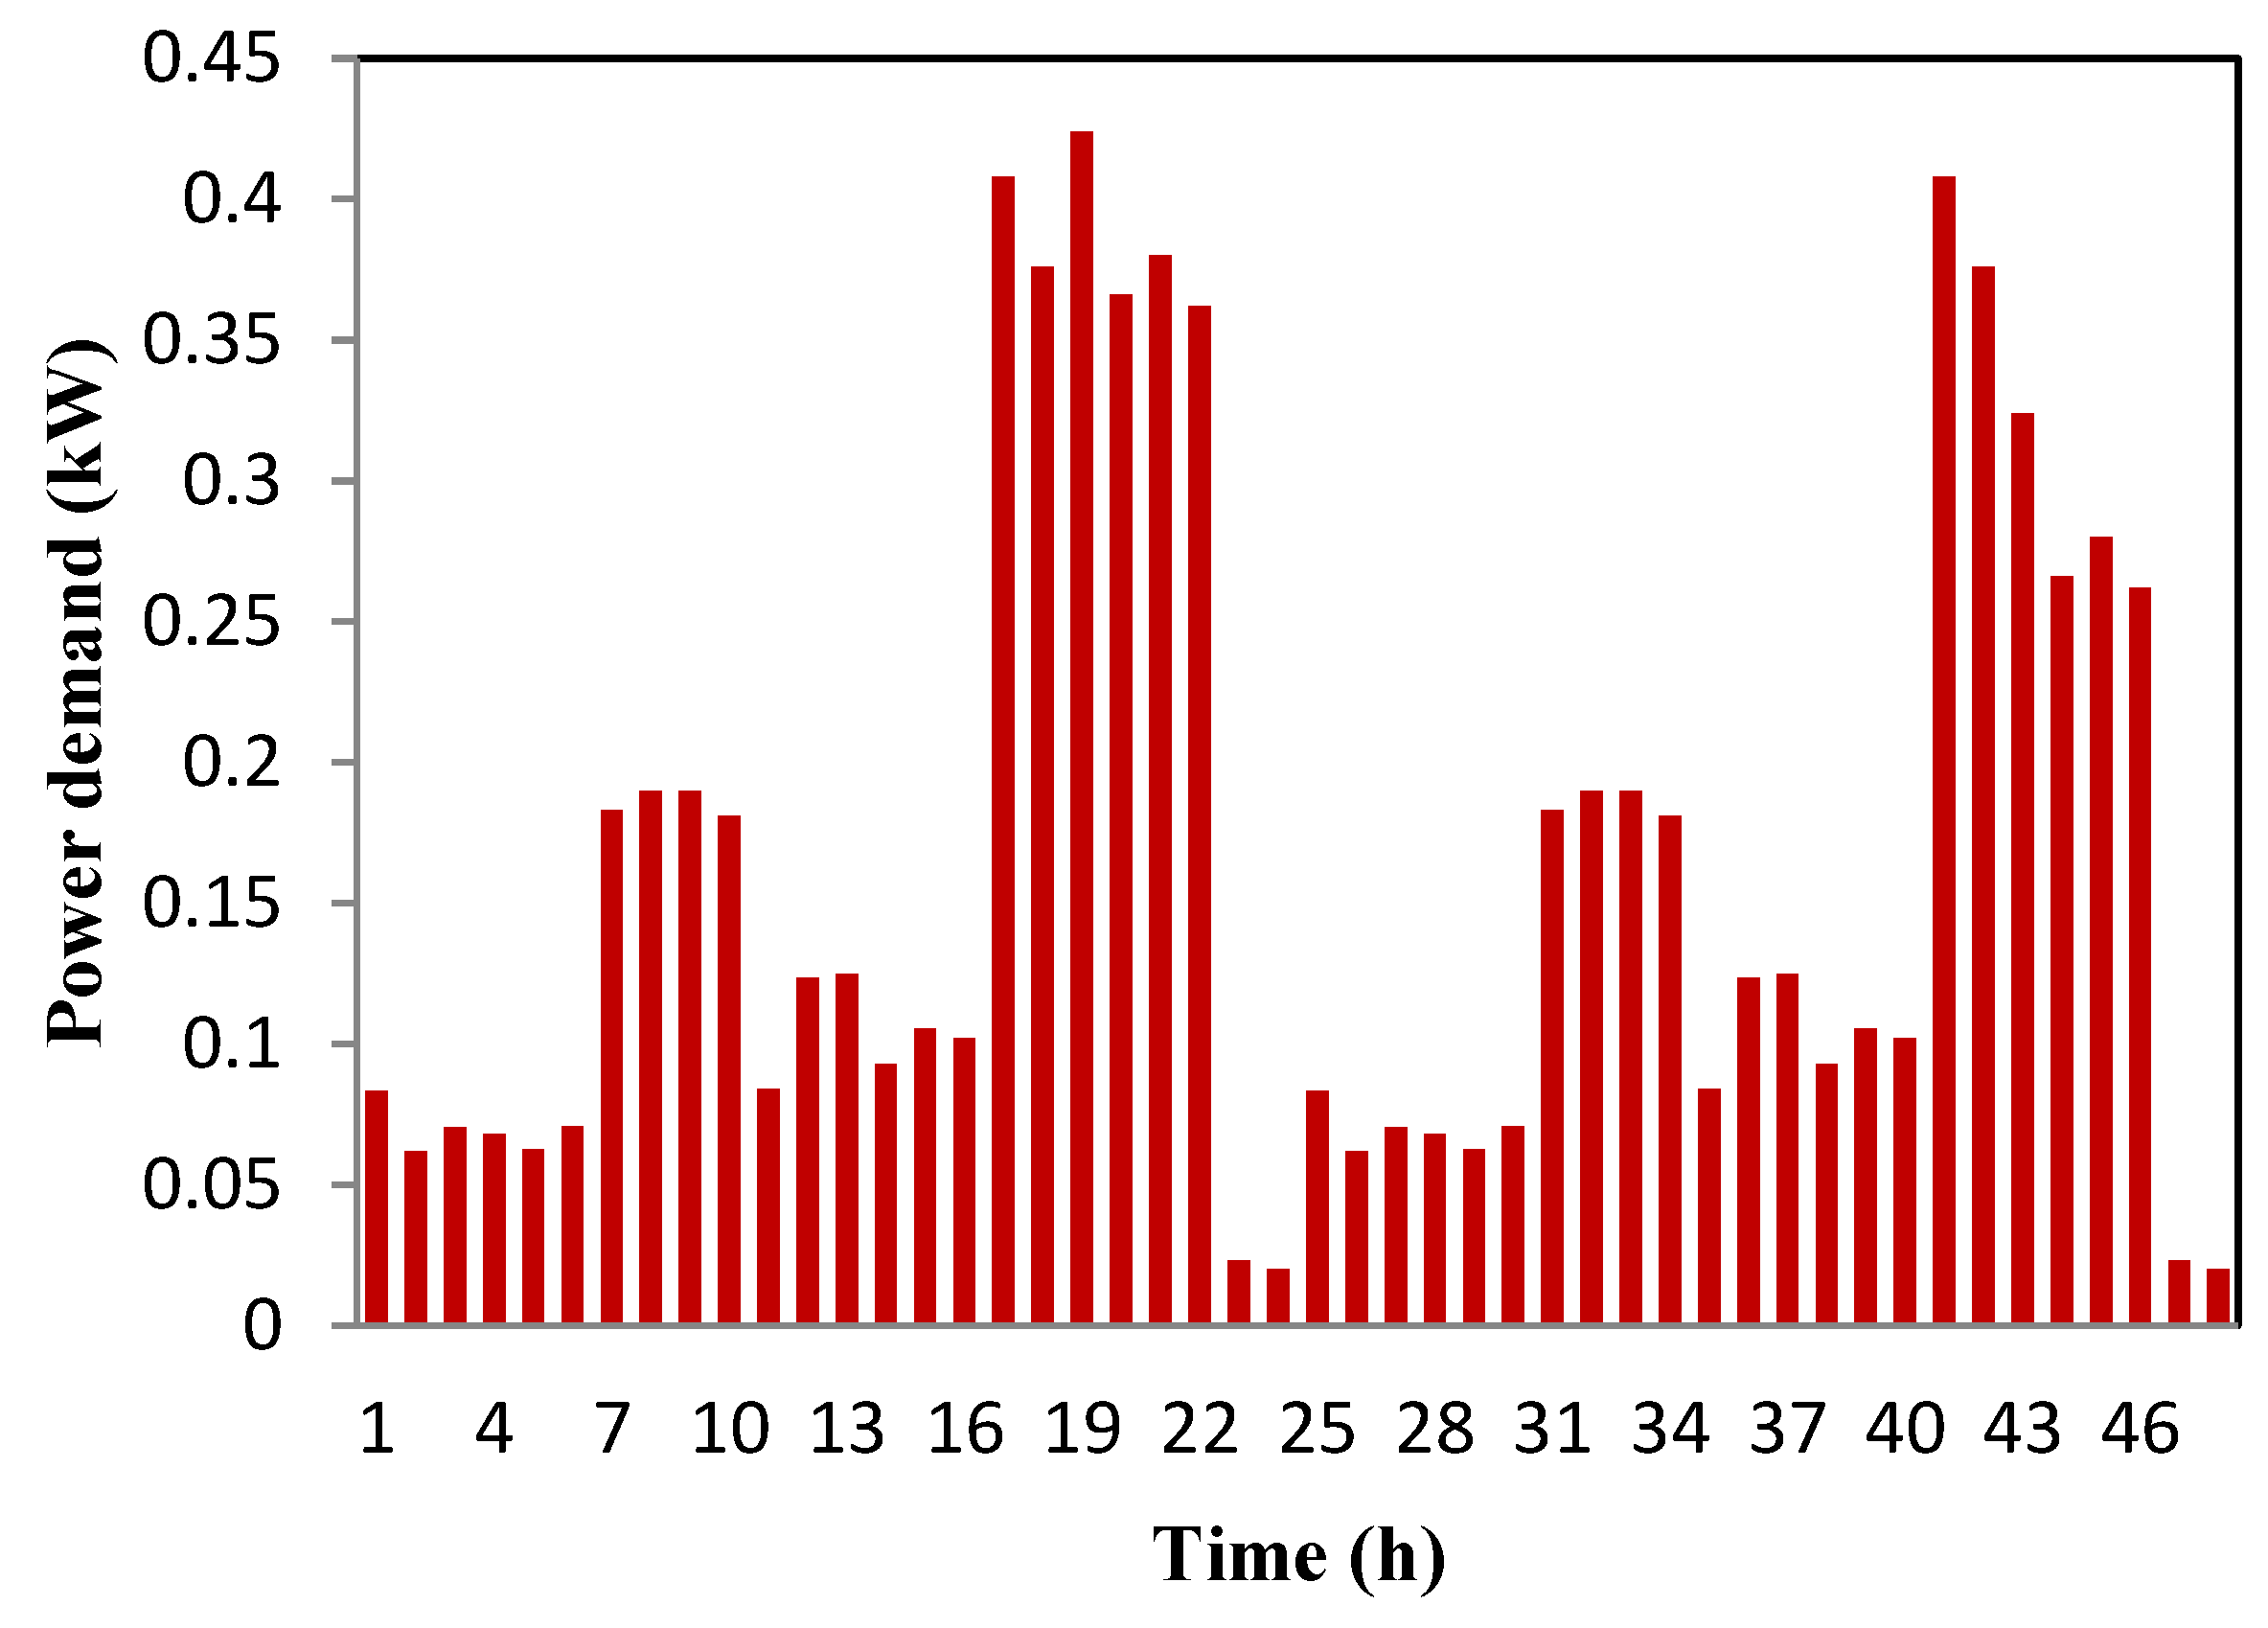
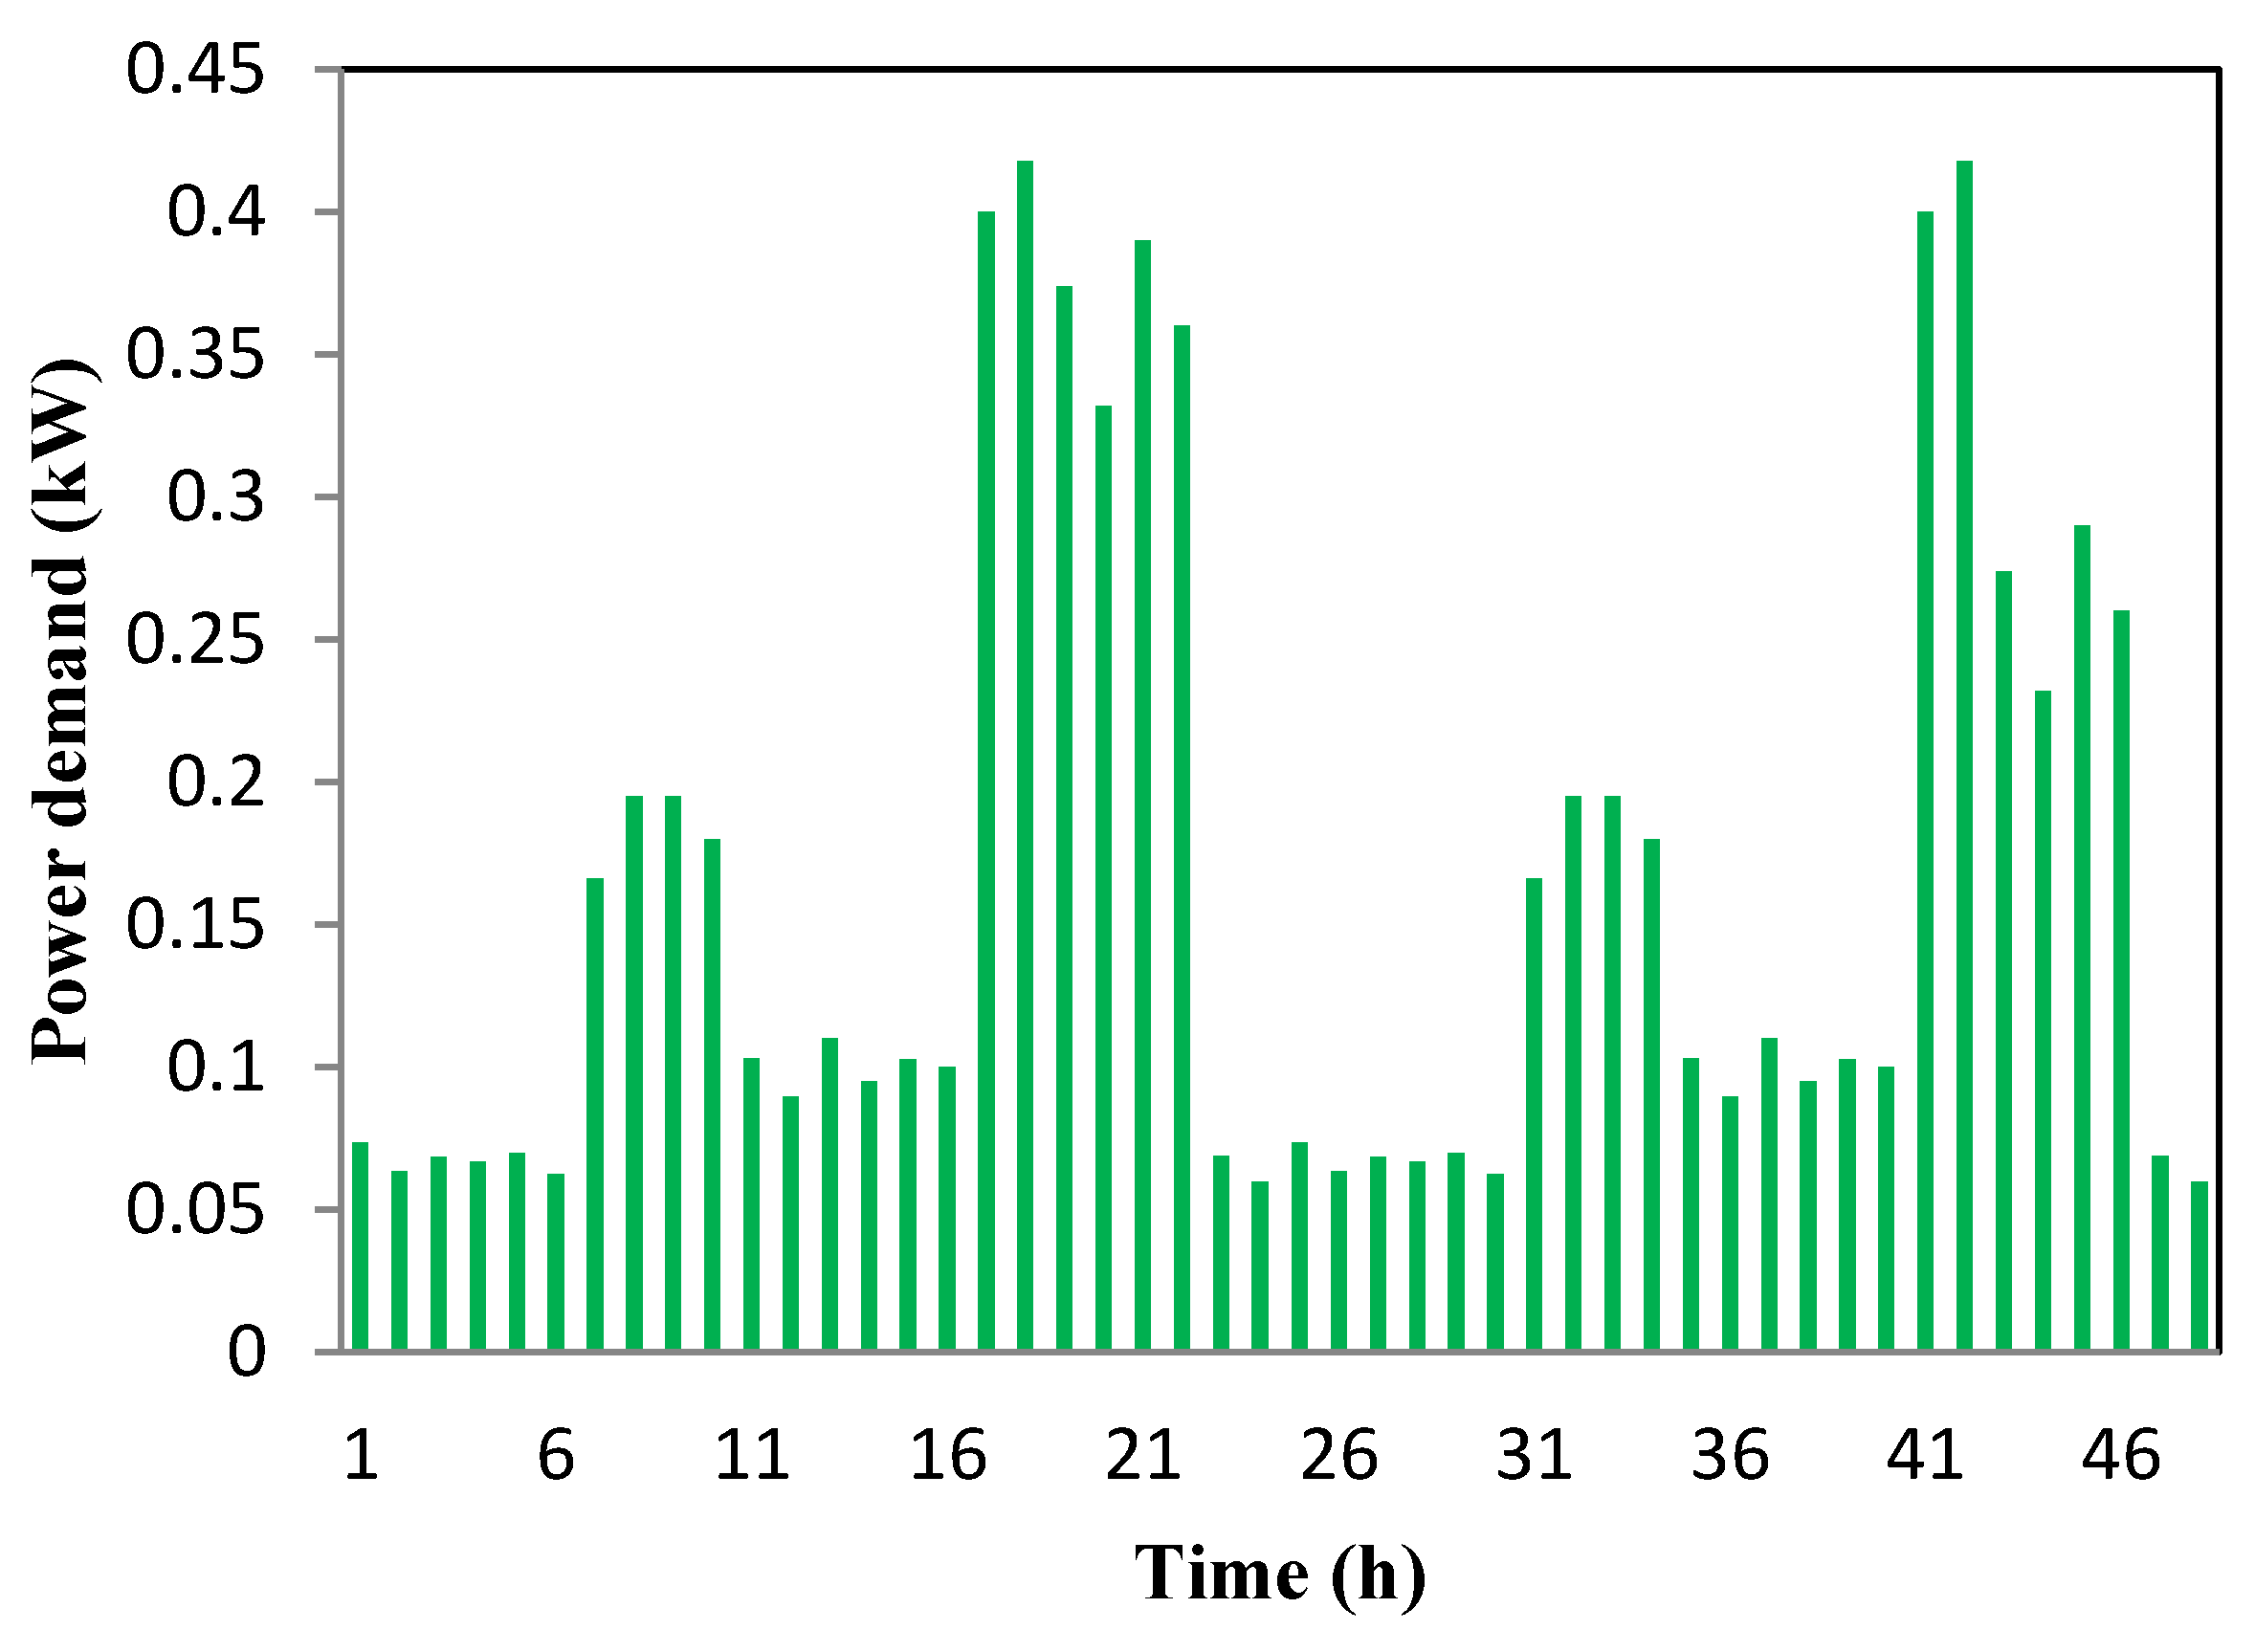
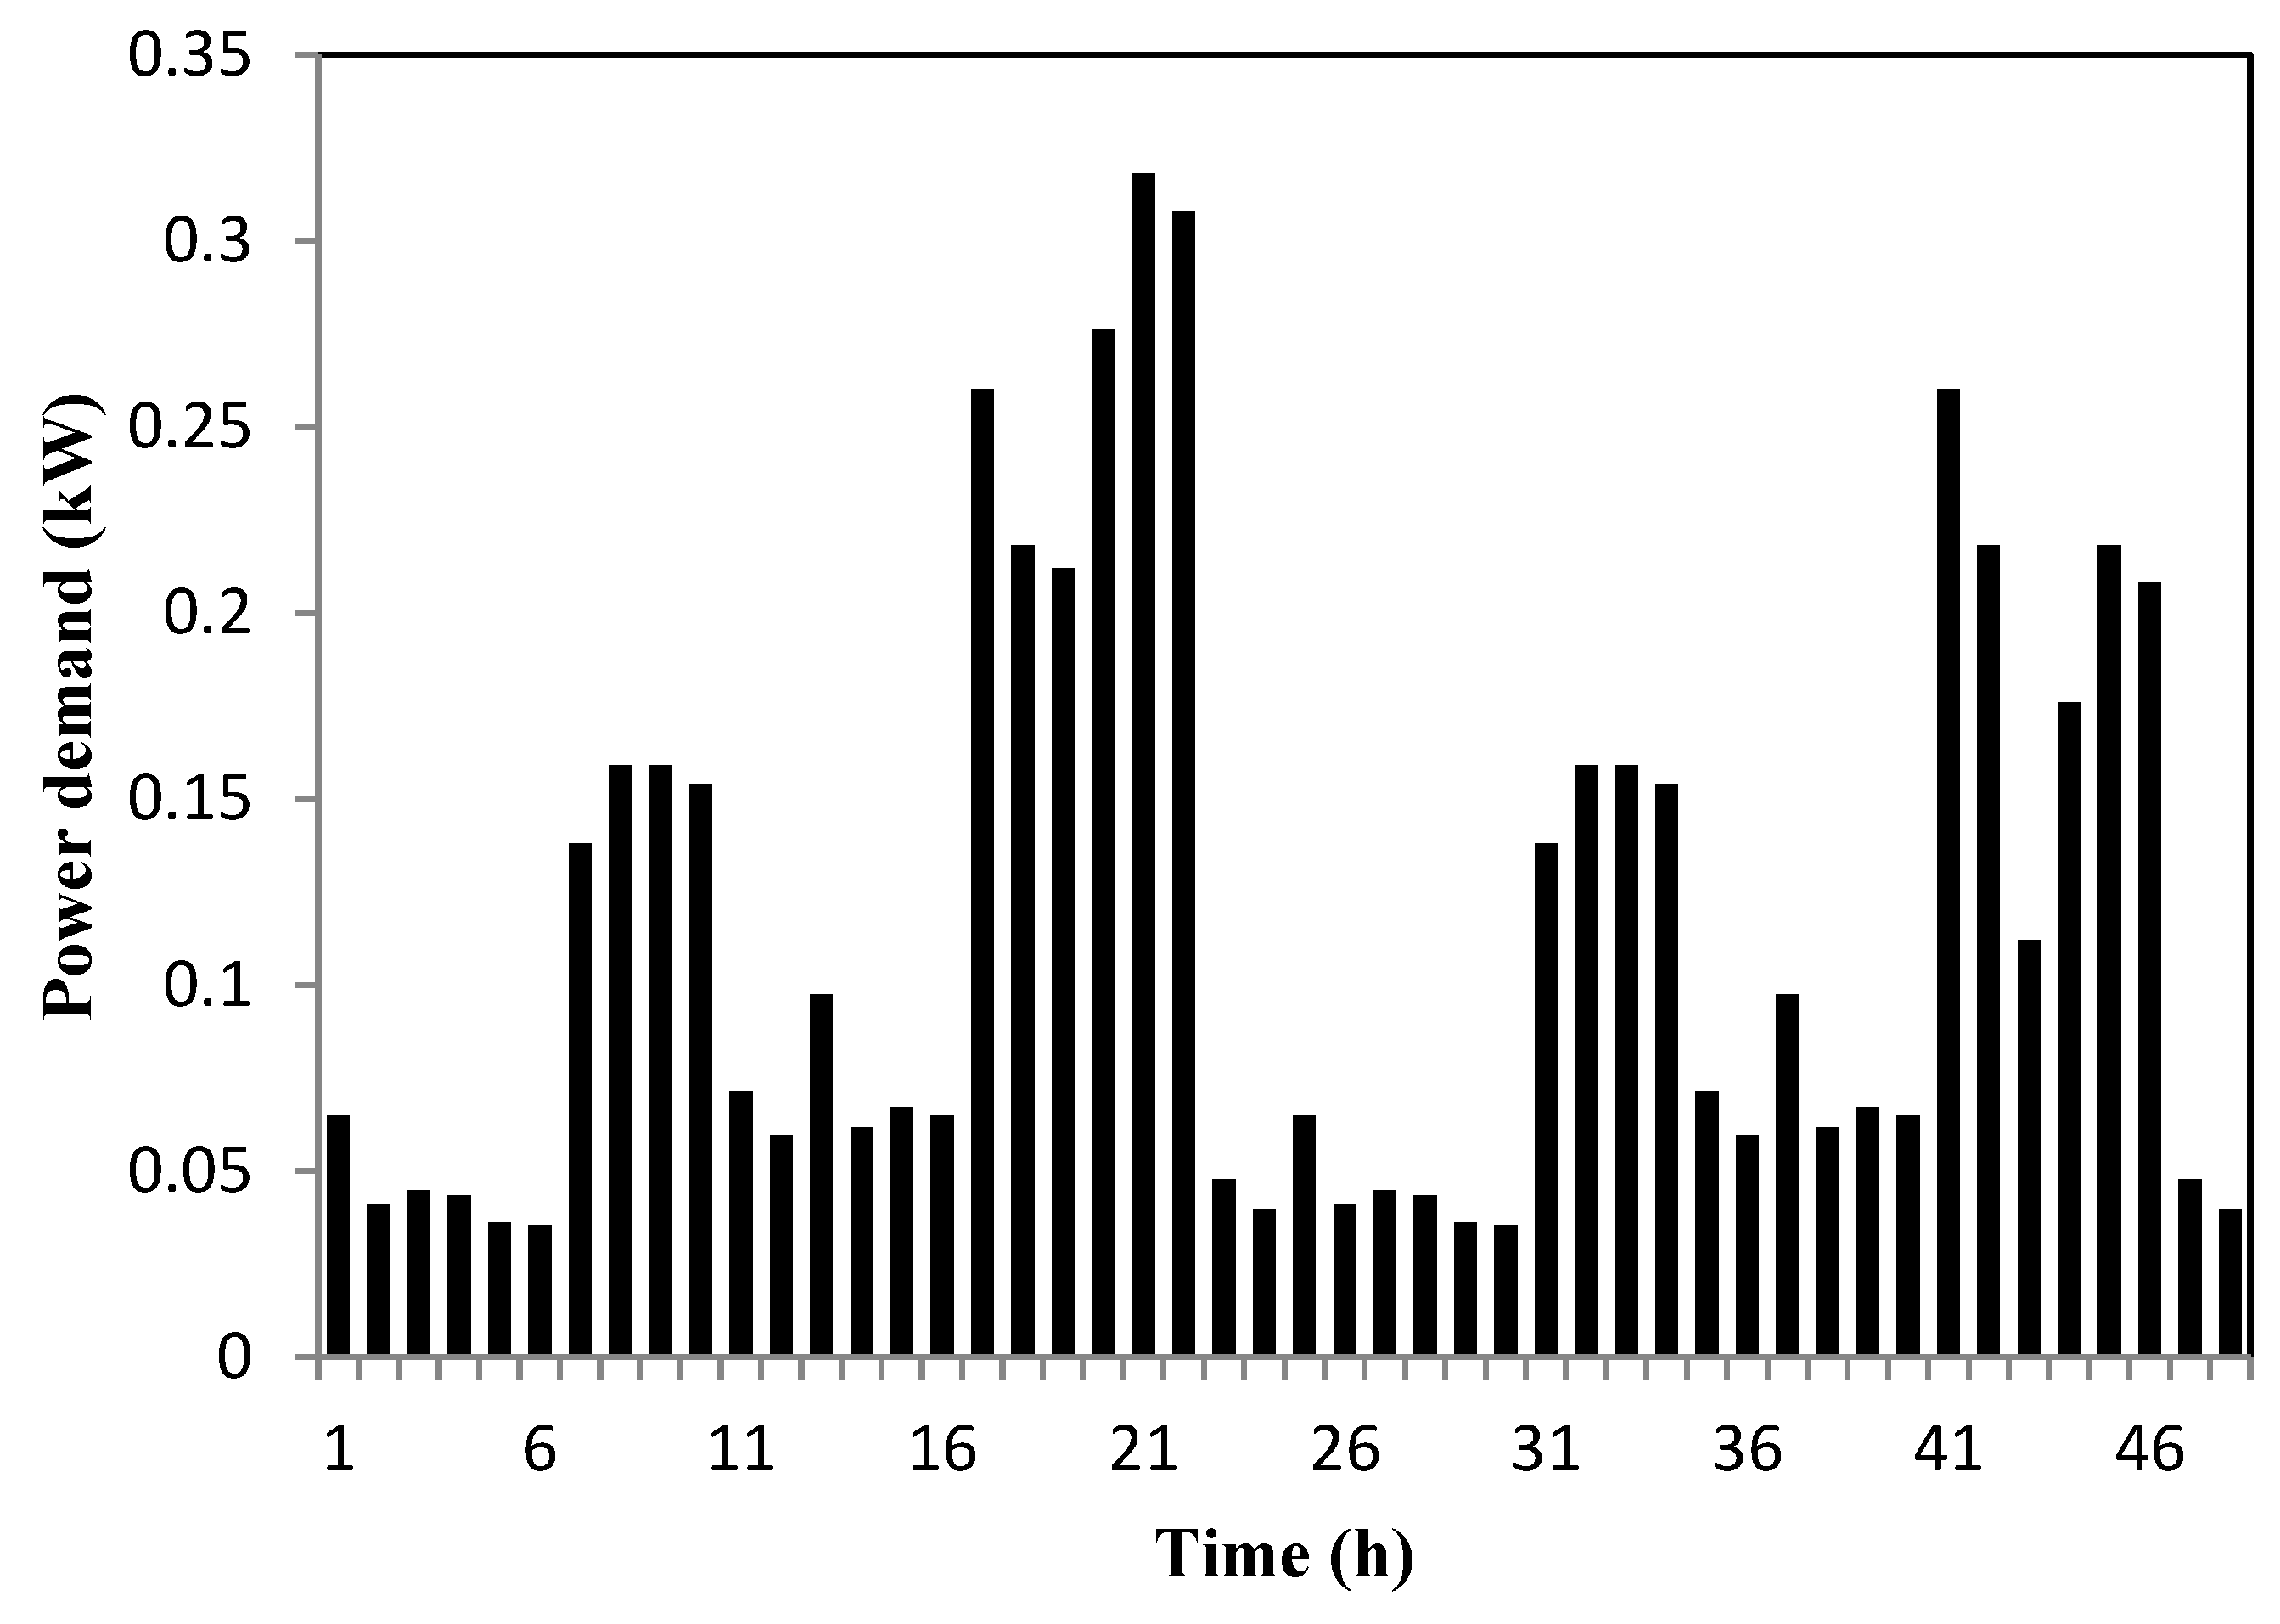
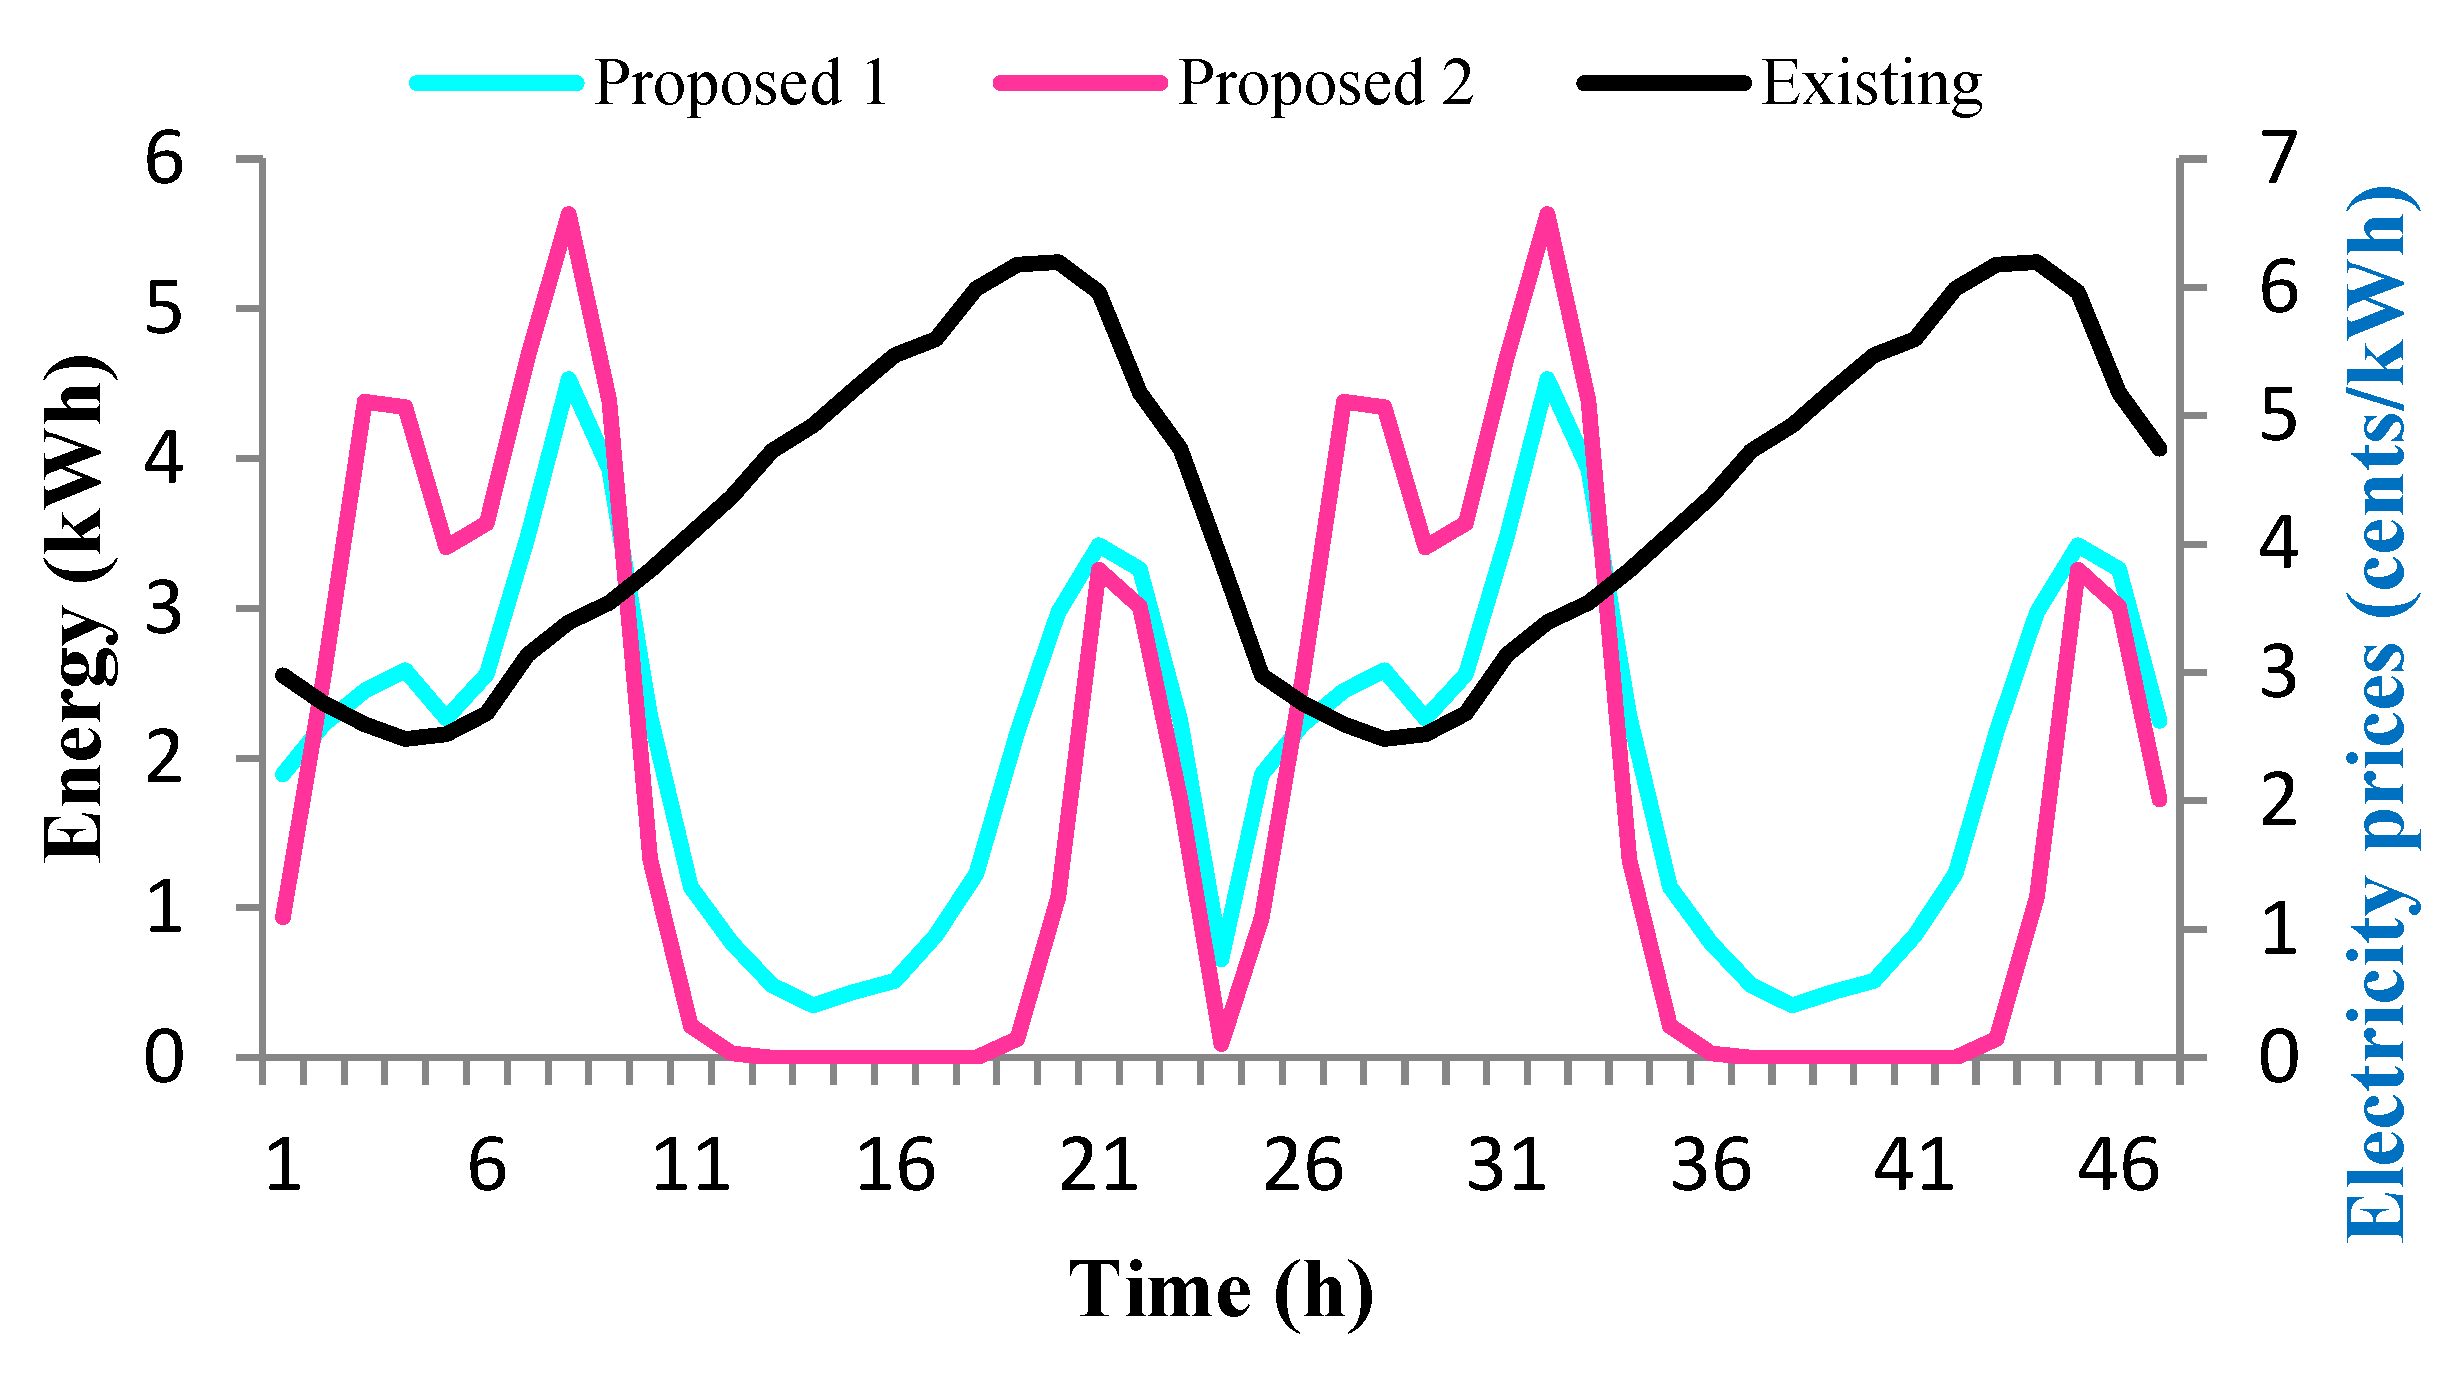
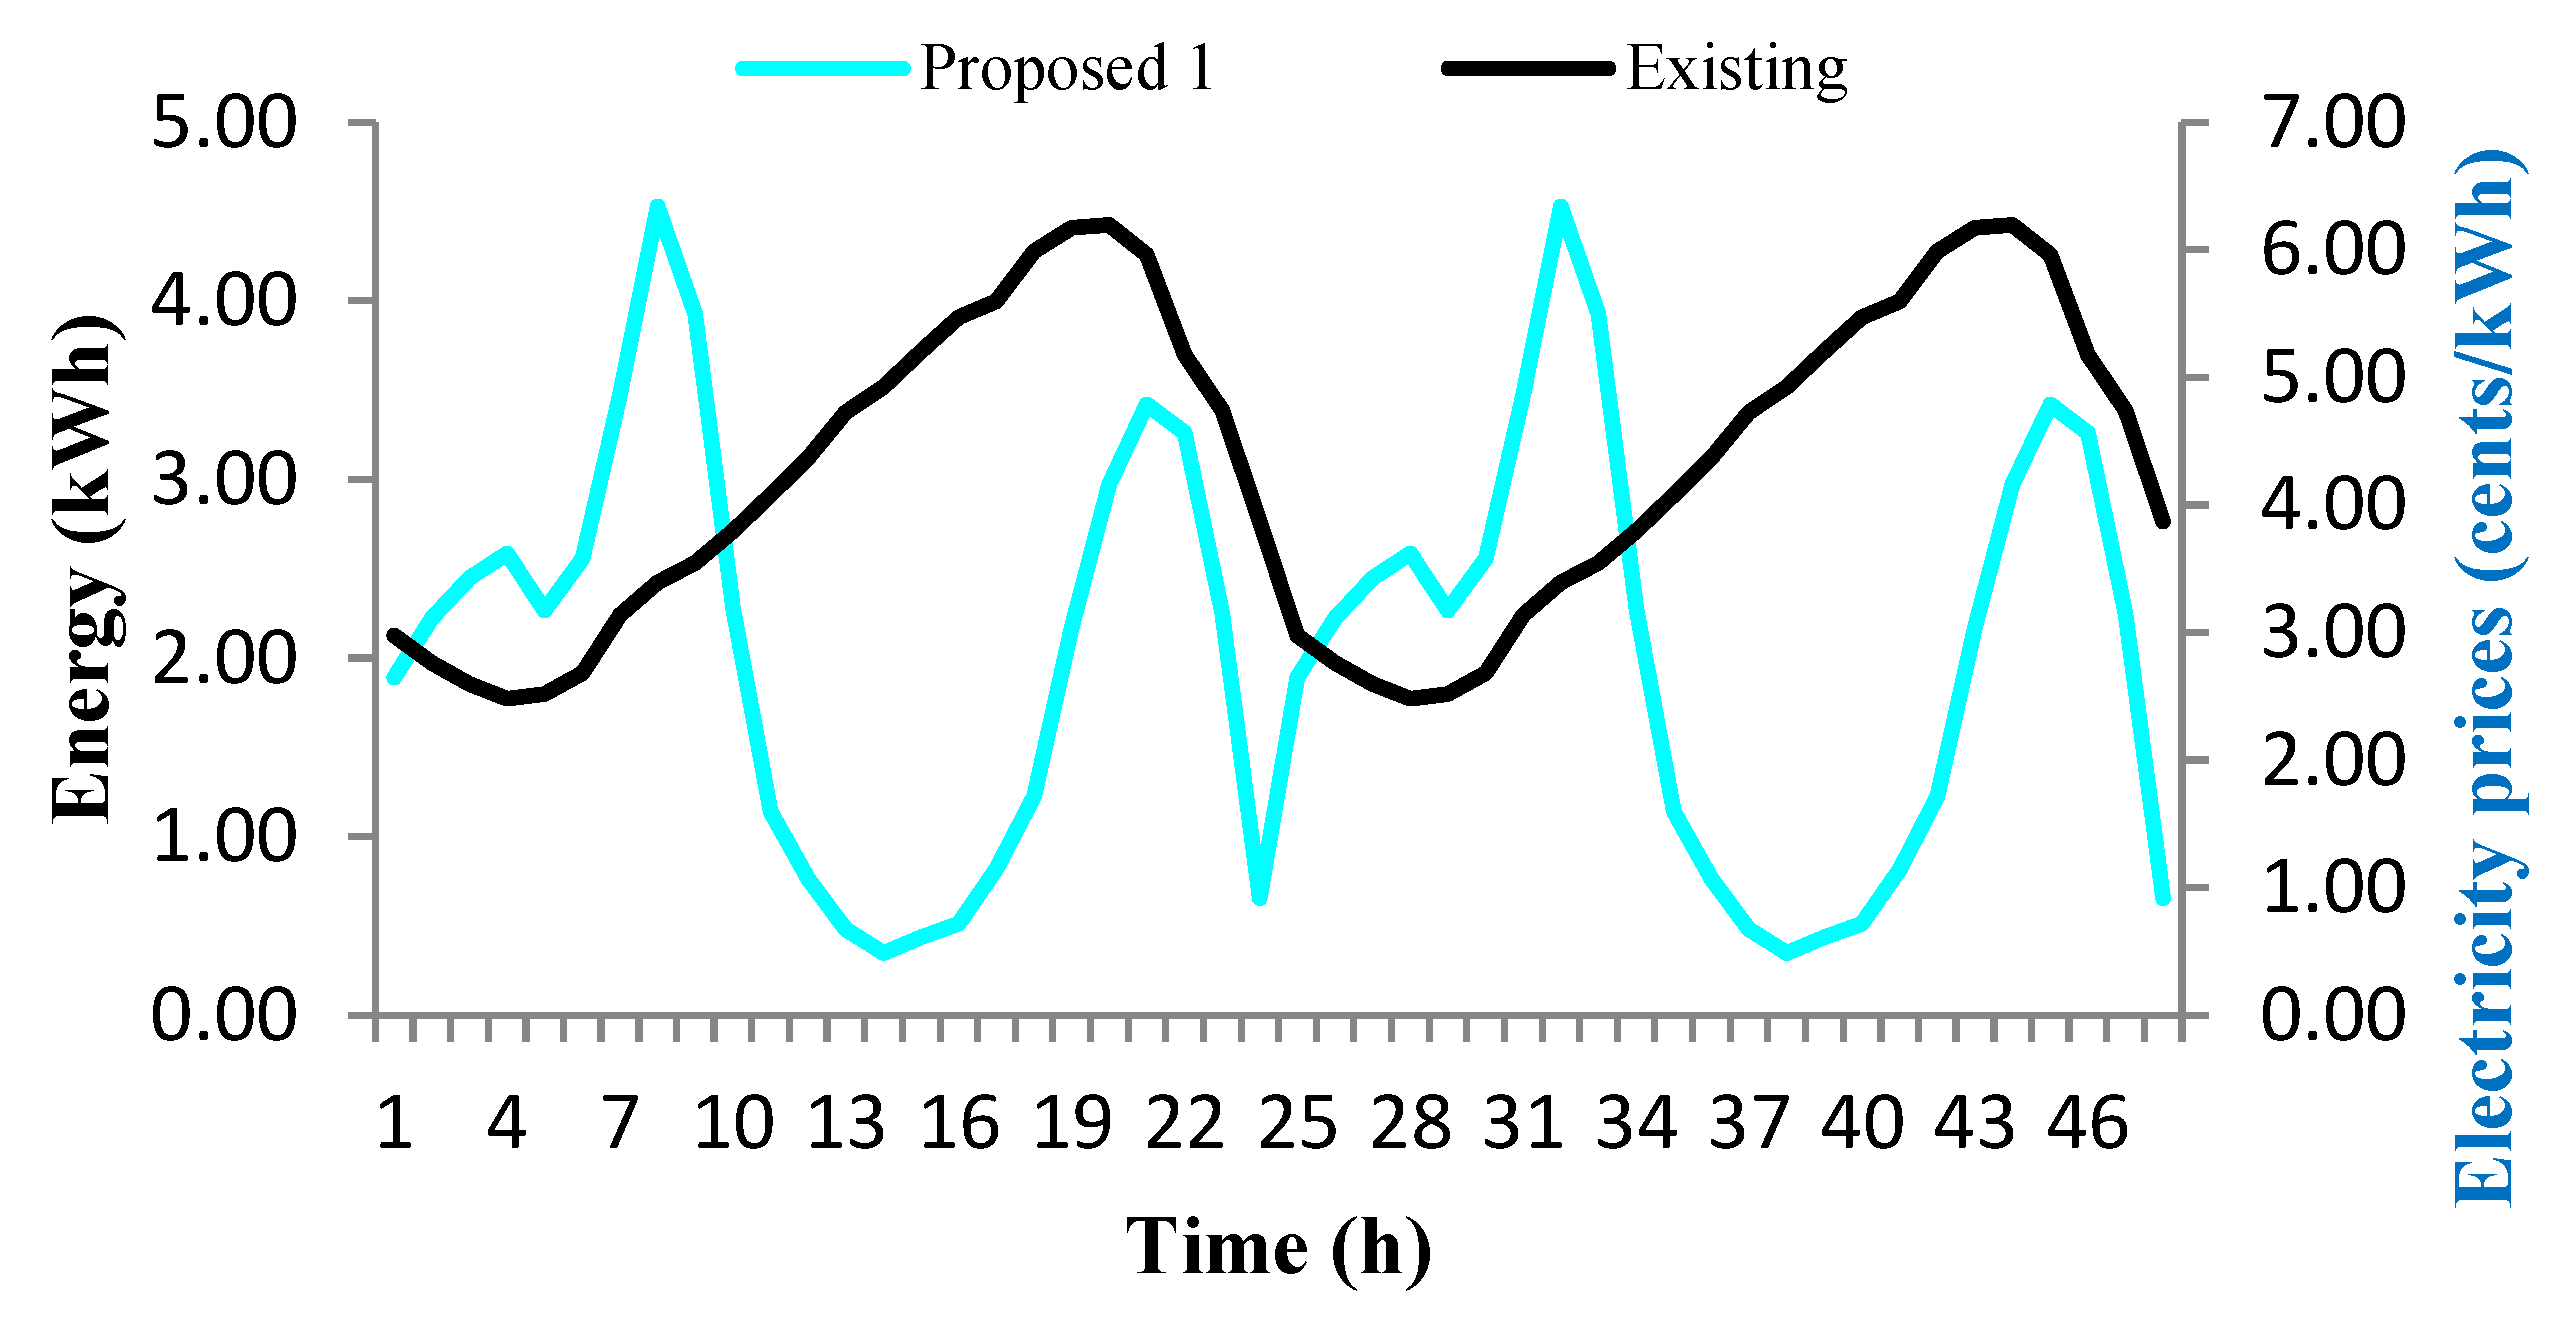
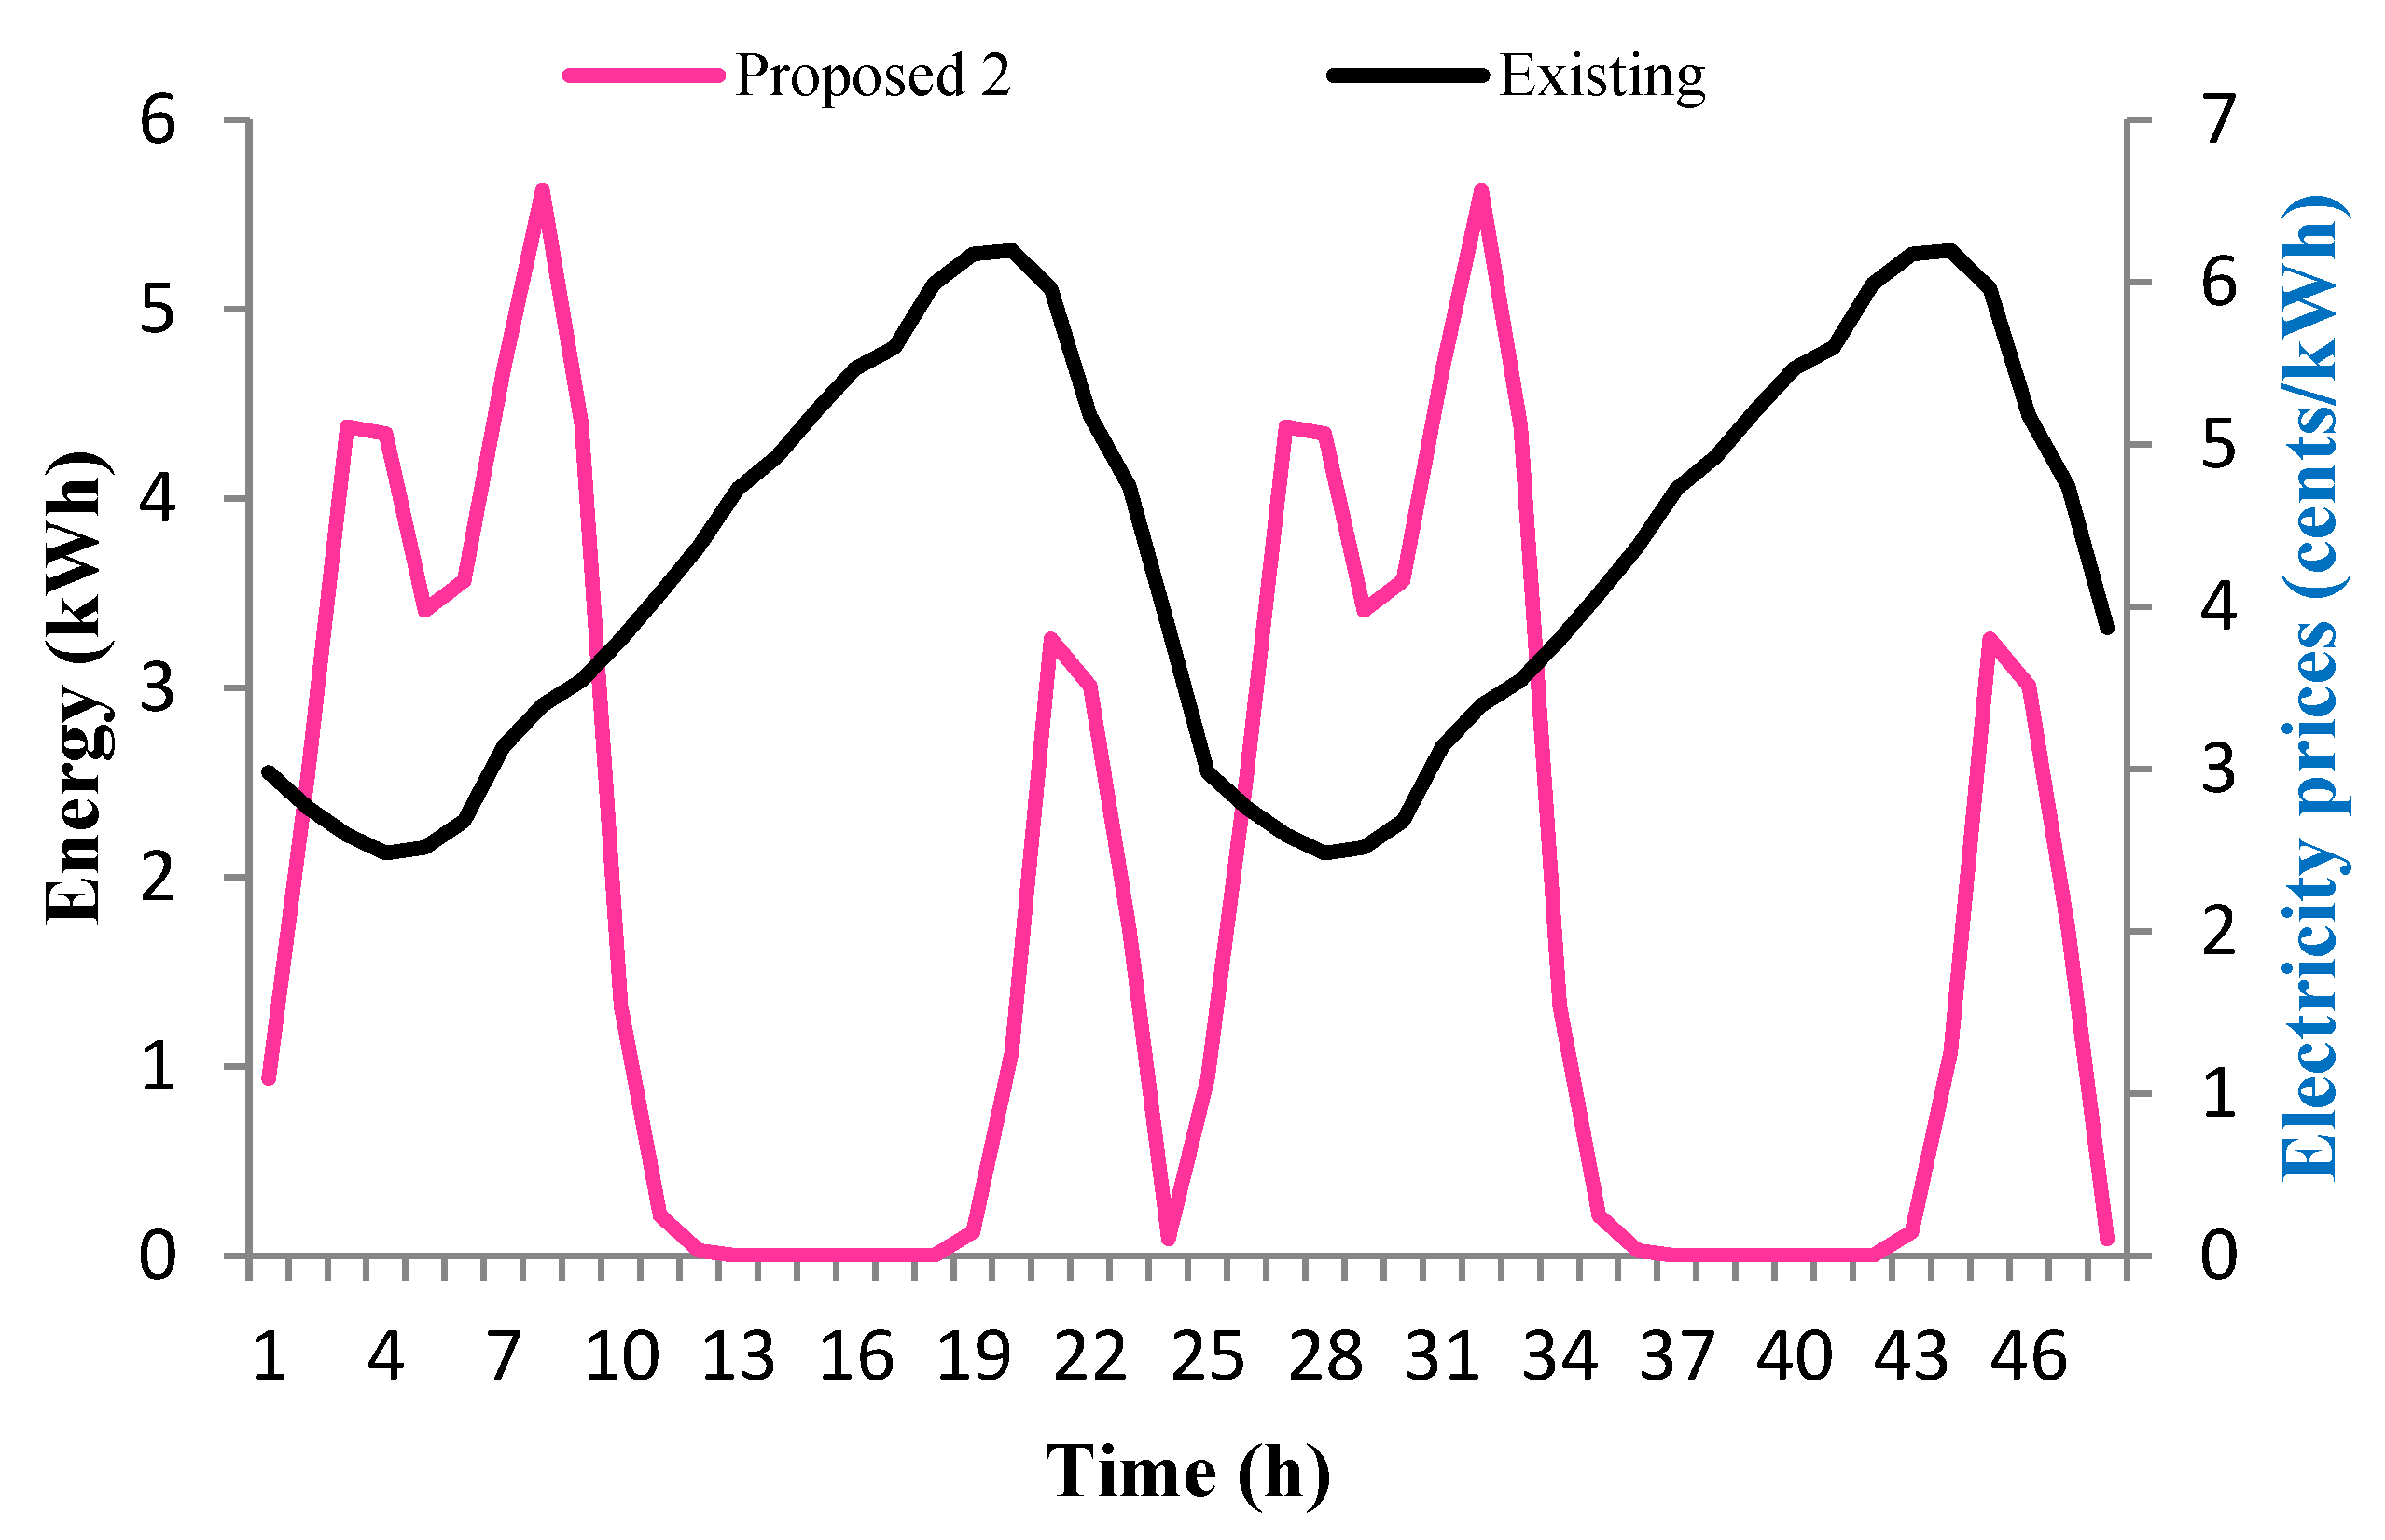
The load profiles of residential users are illustrated in
Figure 5,
Figure 6 and
Figure 7. Moreover,
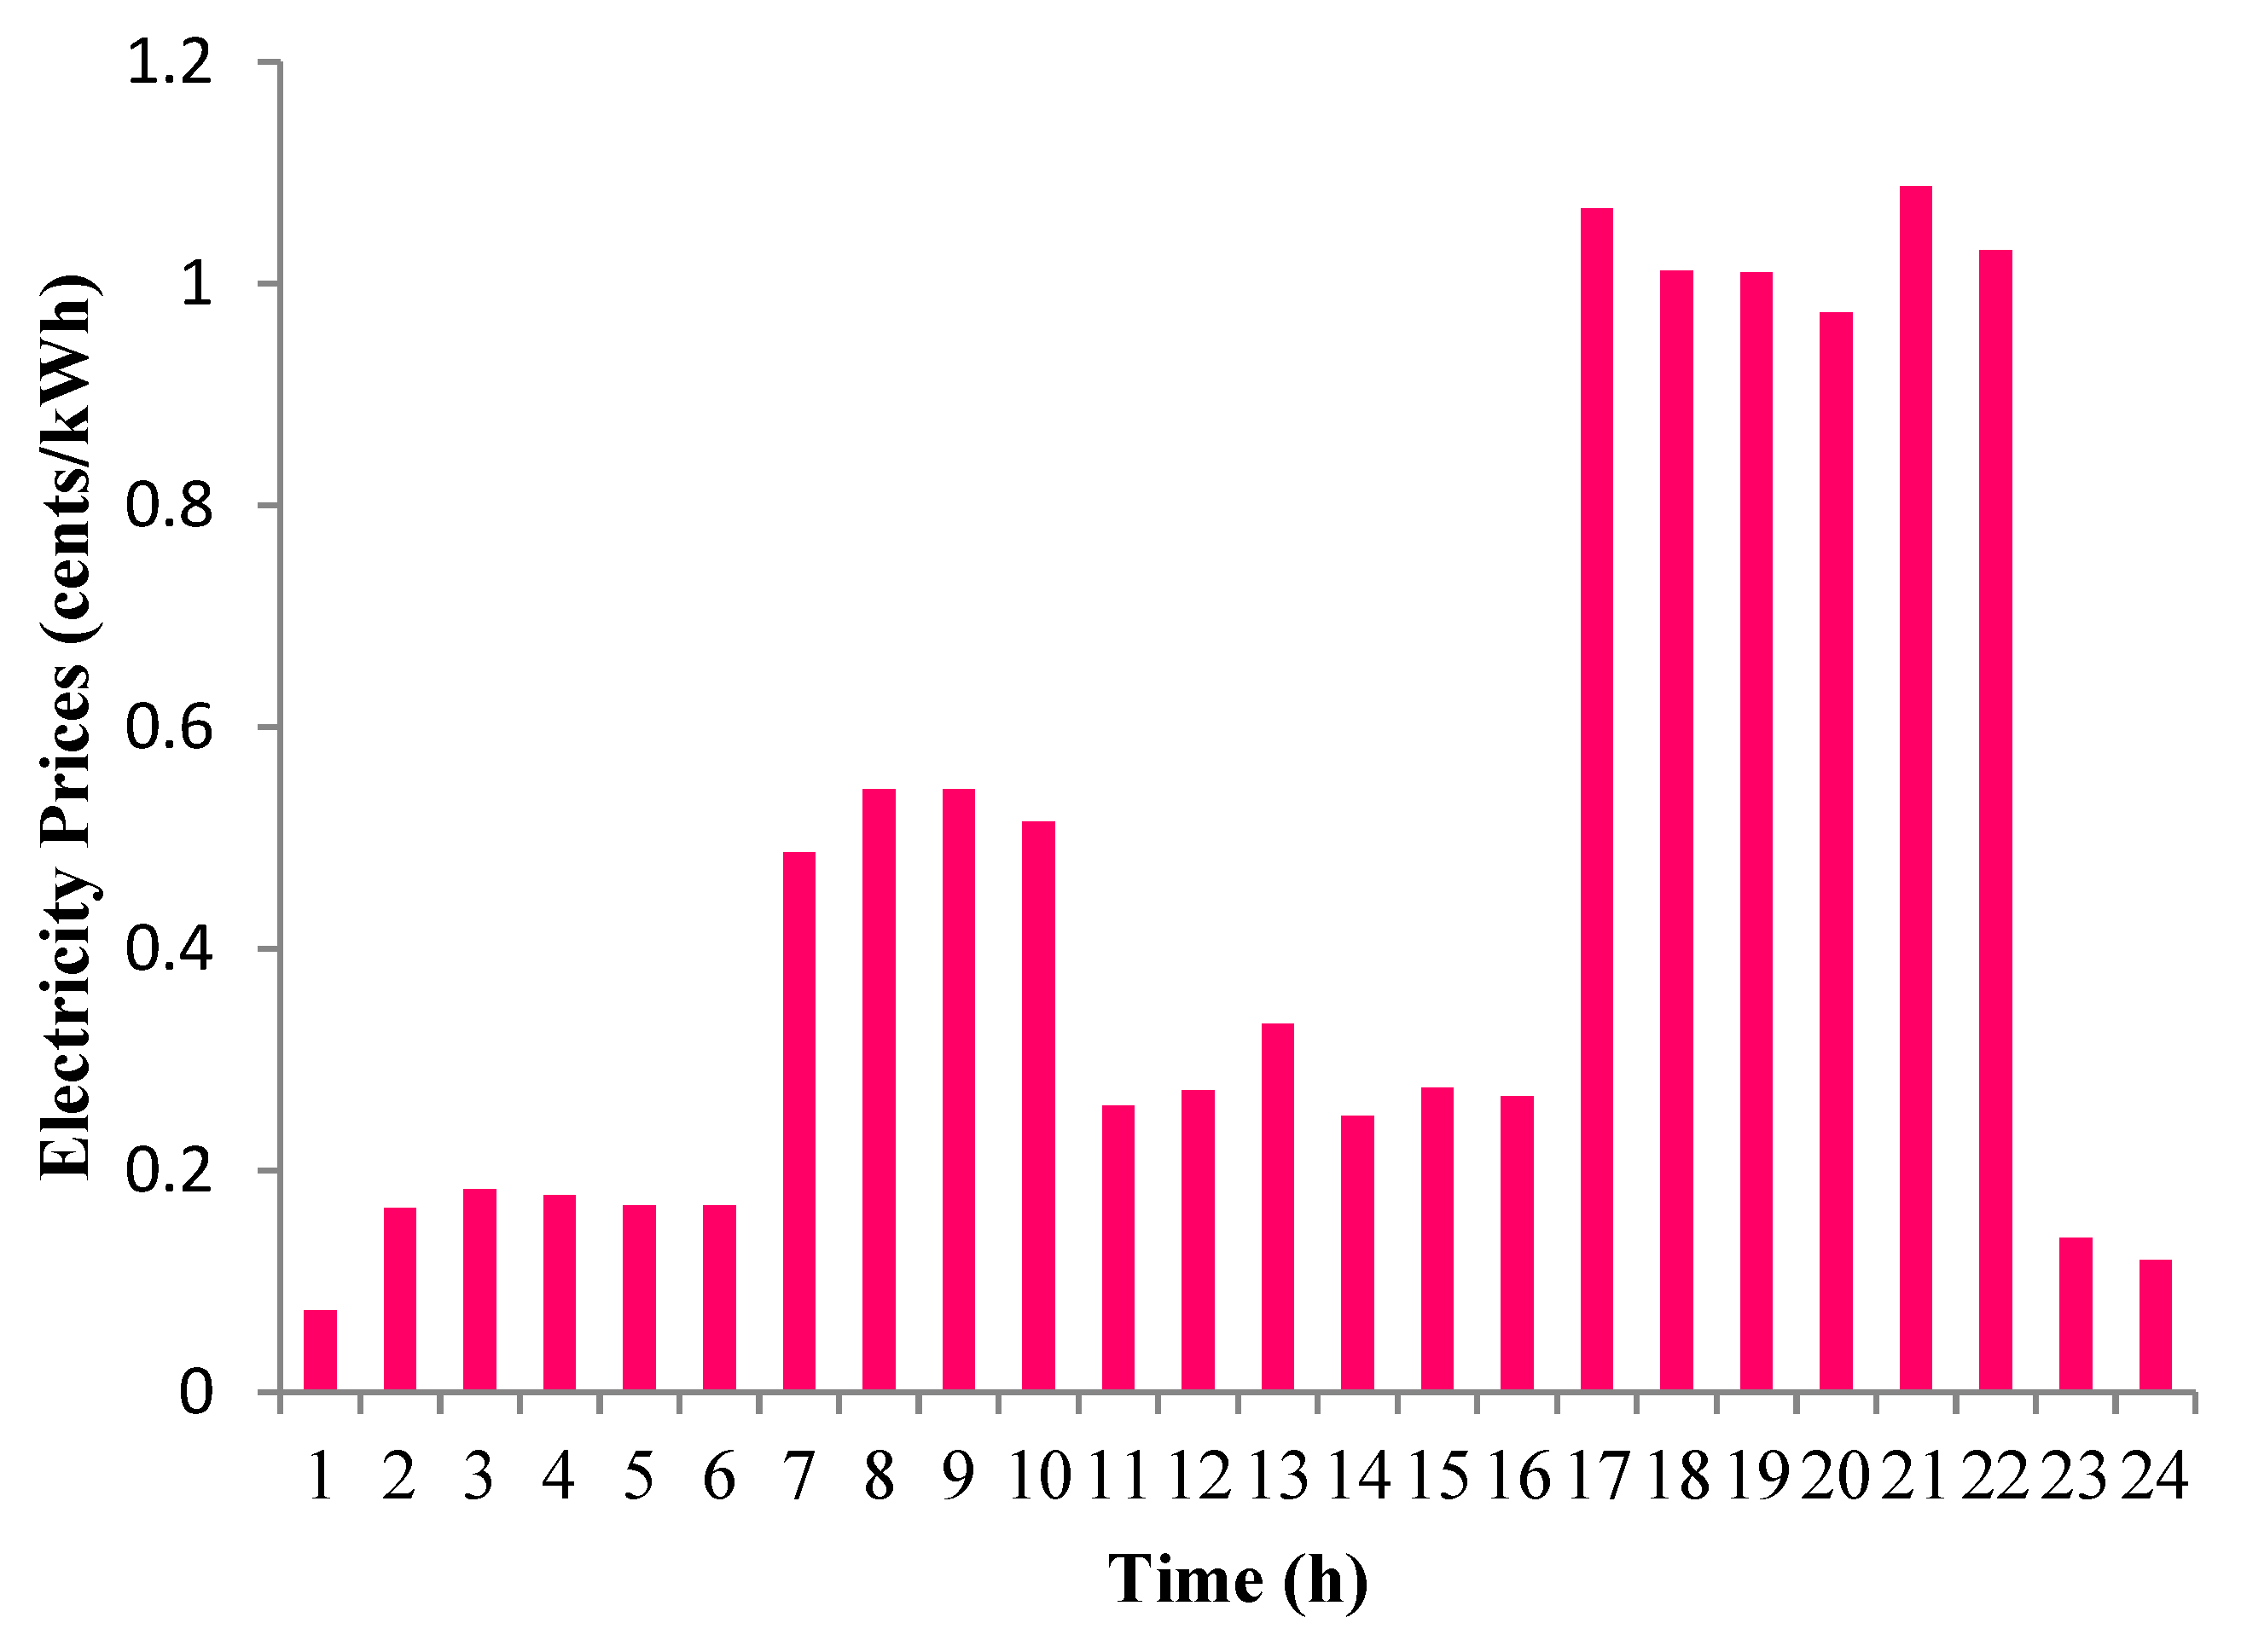
Figure 8 indicates related energy prices. The load patterns of peak-hours, mid-peak hours, and off-peak hours, as considered in this study, are illustrated separately. The maximum load is approximately 0.43 kW during peak-hours, the medium load is 0.42 kW during intermediate-hours and minimum load is 0.32 kW during off-peak-hours.
The estimated loads can meet the primary home appliances such as washing machine, freezer, fans, lights, laptops, television, heater, dishwasher, microwave oven, and so on. Home user energy demand patterns fluctuate with time. Several measurement output values can shape the diverse energy demands for the individual consumers.
Figure 8 indicates the real-time electricity prices for energy purchase per unit that is taken as a grid model in this study. These dynamic prices help electricity customers to schedule flexible loads, such as water heaters and washing machines. Electricity prices are generally announced an hour ahead from a distribution management company. A community smart grid that is connected to the main utility grid is investigated.
This study considers that the project is executed in an environment where building renewable energy plants is encouraged by the local government, for instance, in European countries, and the generated power can exchange to the utility grid without any transfer threshold. This process is due to insufficient power production, leading to low voltage outlines in the smart grid energy community. As a result, renewable energy owners can add more money to their utility business to help community inhabitants.
3.5. The Proposed Mathematical Modeling of a Smart Home
In this section, the electrical smart home appliances with renewable energy sources (RESs), energy storage systems (ESS), and related mathematical parameters are analyzed in detail. The mathematical model contains different parts such as a photo-voltaic system, a small-scale windmill, smart battery, utility tariffs, home appliances, and their expenditure. Renewable energy is generated by the solar cells and windmill, that store it in a smart battery. Total local renewable energy generation is formulated by the given equation:
where P
B is the battery power storage, and P
S and P
W denote the solar and wind power, respectively. Battery power is the sum of solar and wind power generation.
where P
ESS is the power of energy storage system, which is equal to the individual sum of battery power storage, denoted by P
B, and n is the total number of batteries.
A single residential consumer with all home appliances power consumption is defined by the given equation:
where P
TA denotes the total home appliances, P
L indicates the lighting load, P
WM illustrates the washing machine load, P
R represents the refrigerator load, P
C denotes computer power, P
DW is the power taken by the dishwasher and P
H is the heating load, respectively. All home users considered renewable energy as a primary source and utility as a secondary source. The user power demand is defined by Equation (11)
where p
U represents the user power, p
B is the battery power and p
ESS is the power of the energy storage systems. Similarly, p
TA indicates the total home appliance’s power of residential consumers. A home user’s extra energy demand is met by the utility system and it is defined by the given Equation (12) and extra energy cost is formulated by Equation (13).
where E
EE represents the extra energy, p
UO is the utility power and p
U is the user power. The user’s extra energy is calculated by subtracting the user power from the utility operator. Similarly, E
EEC defines the extra energy cost and p
UP illustrates the utility price. A group of 20 home users are considered in the proposed community smart grid framework and the total user energy is given by Equation (14)
where E
TUE represents the total user energy, E
UE denotes the user energy and E
U outlines the independent user energy consumption. The total user’s energy cost is carried out by the given Equation (15)
where E
TUEC represents the total user energy cost and E
UC denote the individual user energy cost. The total number of hours in a day is given by Equation (16).
where p
TNH represents the total number of hours and p
H denote the hourly user power consumption. Total energy consumption and cost for a week is given by Equation (17)
where p
TND represents the total number of day and p
D denote the daily user power consumption. Total self-satisfied power demand are carried out by Equation (18)
In Equation (12), P
TSSPD denotes the total self-satisfied power demand. Total number of energy clusters are carried out by Equation (19)
In Equation (19), pTNEC represents the total number of energy cluster whereas pEC denotes the power consumption of the independent energy cluster.
3.6. Flow Chart of the Algorithm
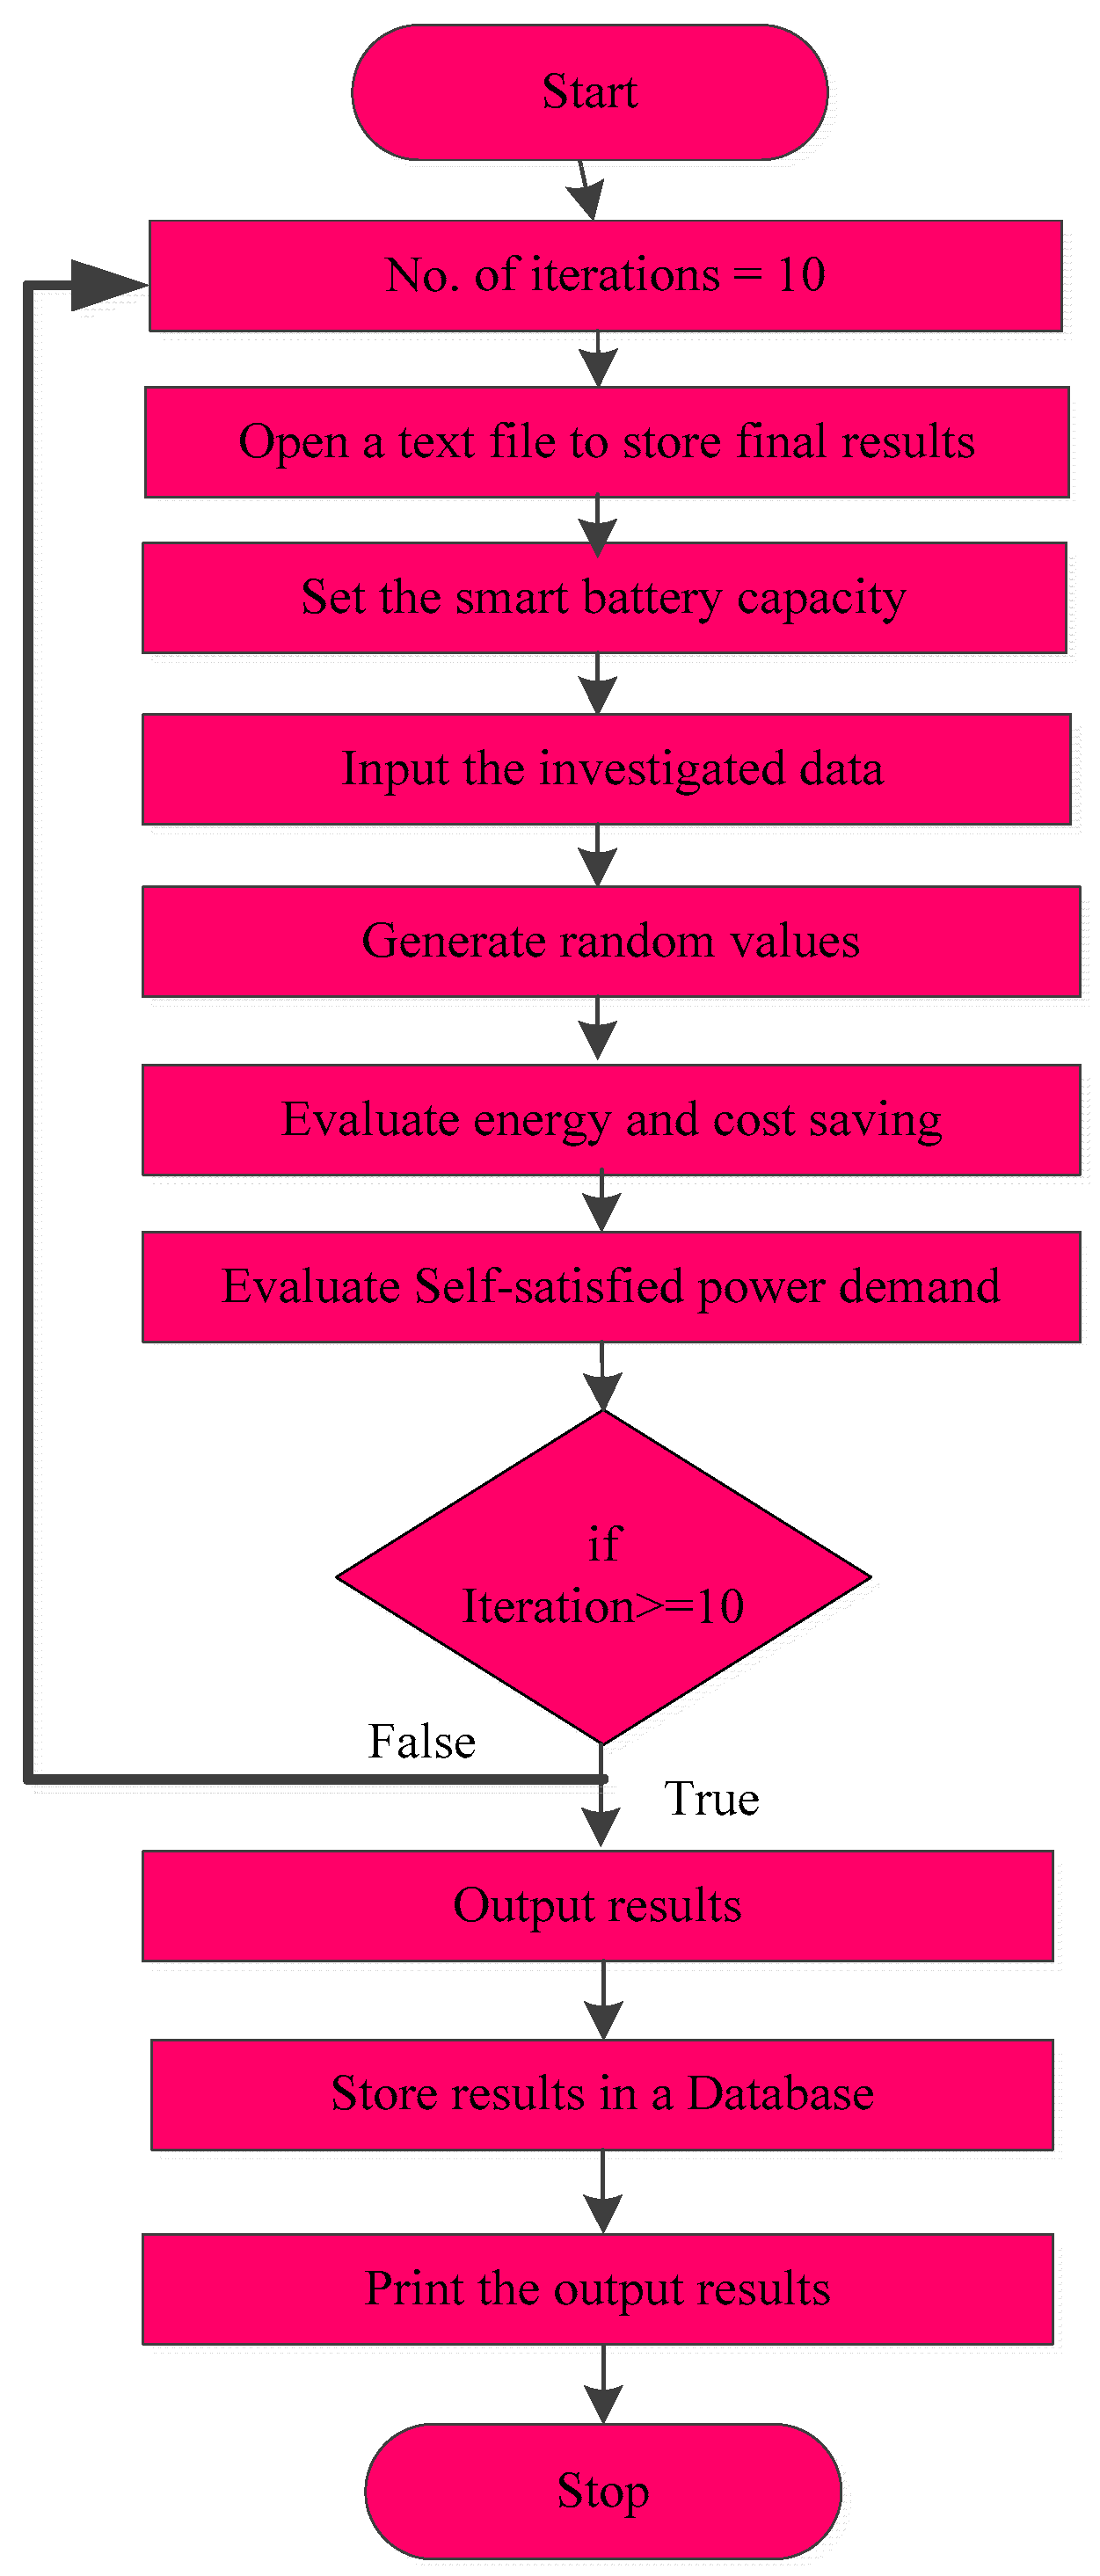
This section introduces a flow chart in
Figure 9 to identify and explain the graphical overview of the energy allocation strategy to share and support user energy demand and simulation procedure.
3.7. The Proposed Algorithm
In this section, the proposed algorithm for the community smart grid is documented. A precise and efficient algorithm is proposed which defines the step by step priority basis energy allocation and simulation execution process among the home uses in the community smart grid. The dynamic electricity prices are used for the simulation process. This may lead to complexity in solving it using conventional optimization problems. To solve this limitation, an efficient Energy Allocation Algorithm (EAA), shown the steps in Algorithm 1 and the flowchart in
Figure 9, is designed. The EAA is used to optimize the new proposed cluster-based energy management system in the smart grid environment considering an ESS [
39]. In this research, the EAA is also discussed effectively to share residential consumer’s battery power and energy storage system within the energy cluster in the smart grid community. The prime objective of the proposed algorithm is to minimize the energy cost with a high level of customer satisfaction. Residential users consume most of the energy to meet household appliances’ power demand. If a user’s power consumption is greater than the rated capacity of the battery, then the battery requires charging up to the maximum level. If a healthy battery is found, then it is charged using the user’s battery by sharing power. Otherwise, it continues to search to identify a healthy battery. Surplus energy selling is possible while RESs have sufficient power generation and after meeting user power demand.
| Algorithm 1 Energy Allocation Algorithm (EAA) |
| 1: | Initialization. |
| 2: | Load data. |
| 3: | Start simulation. |
| 4: | Iteration (i = 0). |
| 5: | Generate random values. |
| 6: | if user power consumption (PU) ≥ user rated battery capacity then (PB) |
| 7: | Charge user battery up to the maximum level (Bmax). |
| 8: | Otherwise, keep the user battery at the maximum level. |
| 9: | else if found a healthy charged battery (Bhealthy) then |
| 10: | Charge user battery up to the nominal level (Bnominal). |
| 11: | Otherwise, identify the other healthy charged battery. |
| 12: | end else if |
| 13 | end if |
| 14: | if sufficient RESs generation and off-peak loads confirmed then |
| 15: | Sell surplus energy to the utility operator (ES). |
| 16: | Otherwise, use household appliances inside the energy cluster. |
| 17: | end if |
| 18: | if RESs and utility supply off then |
| 19: | Use ESS up to backup capacity. |
| 20: | Otherwise, use RESs and utility. |
| 21: | end if |
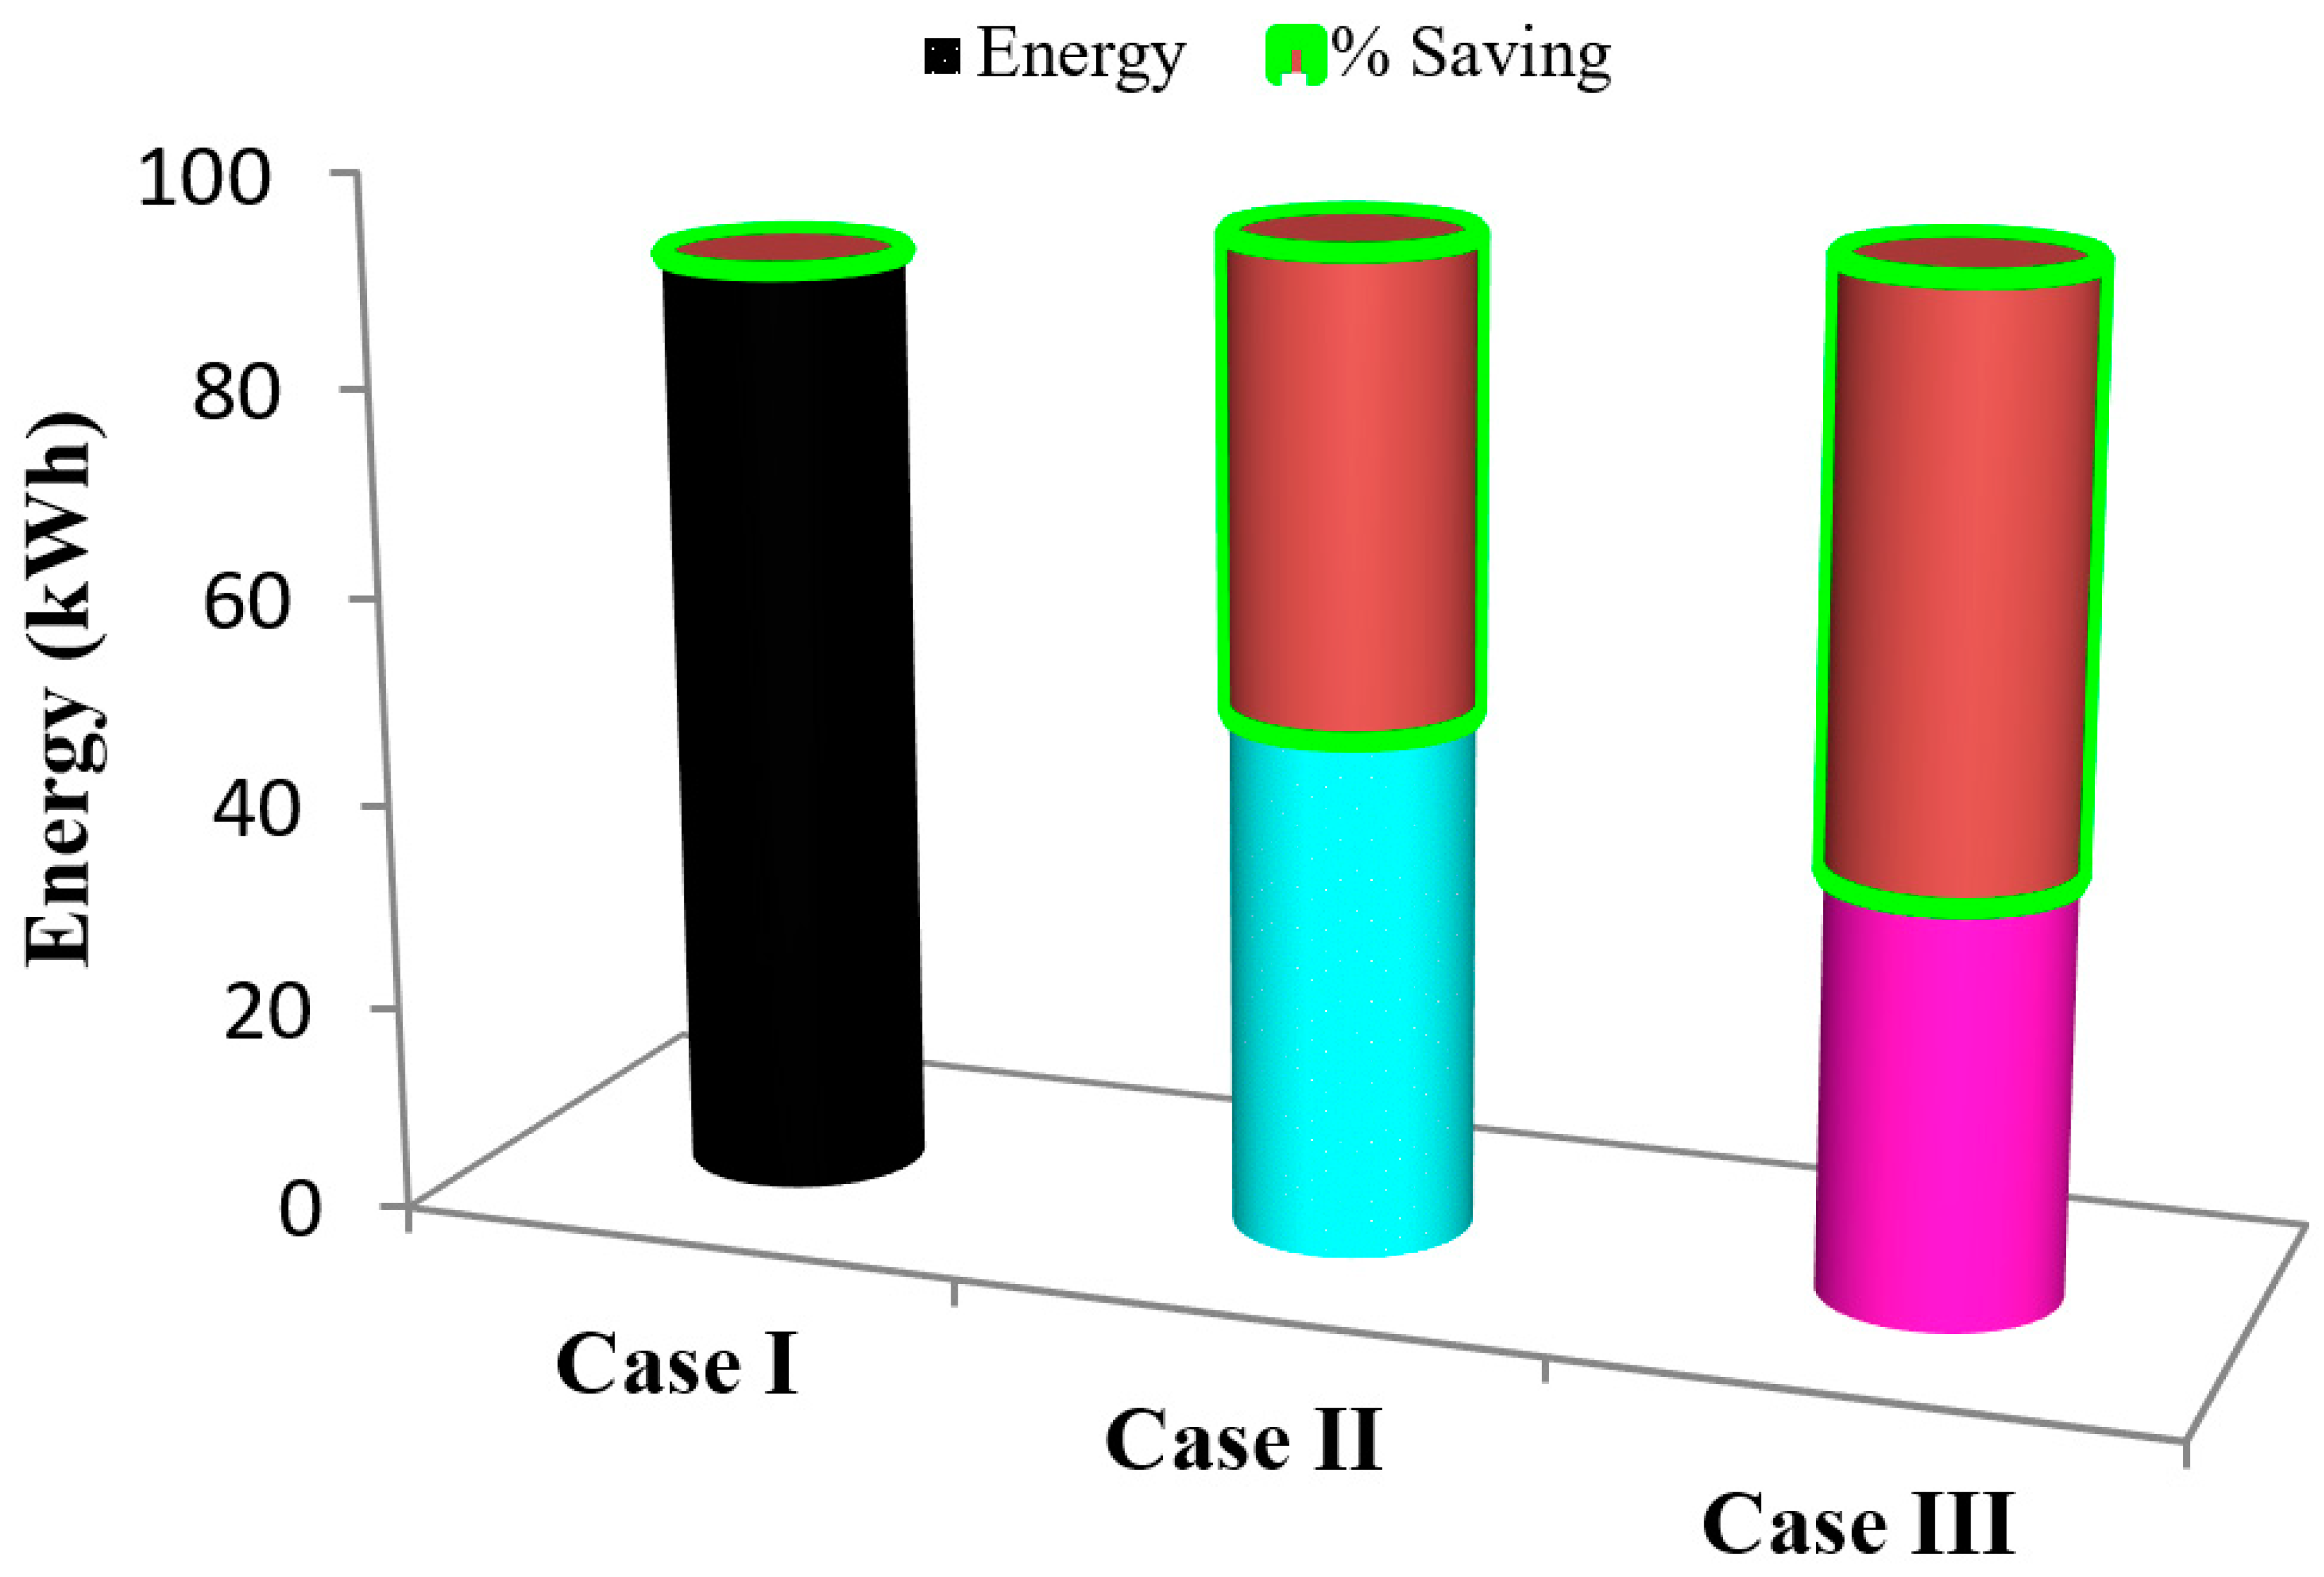
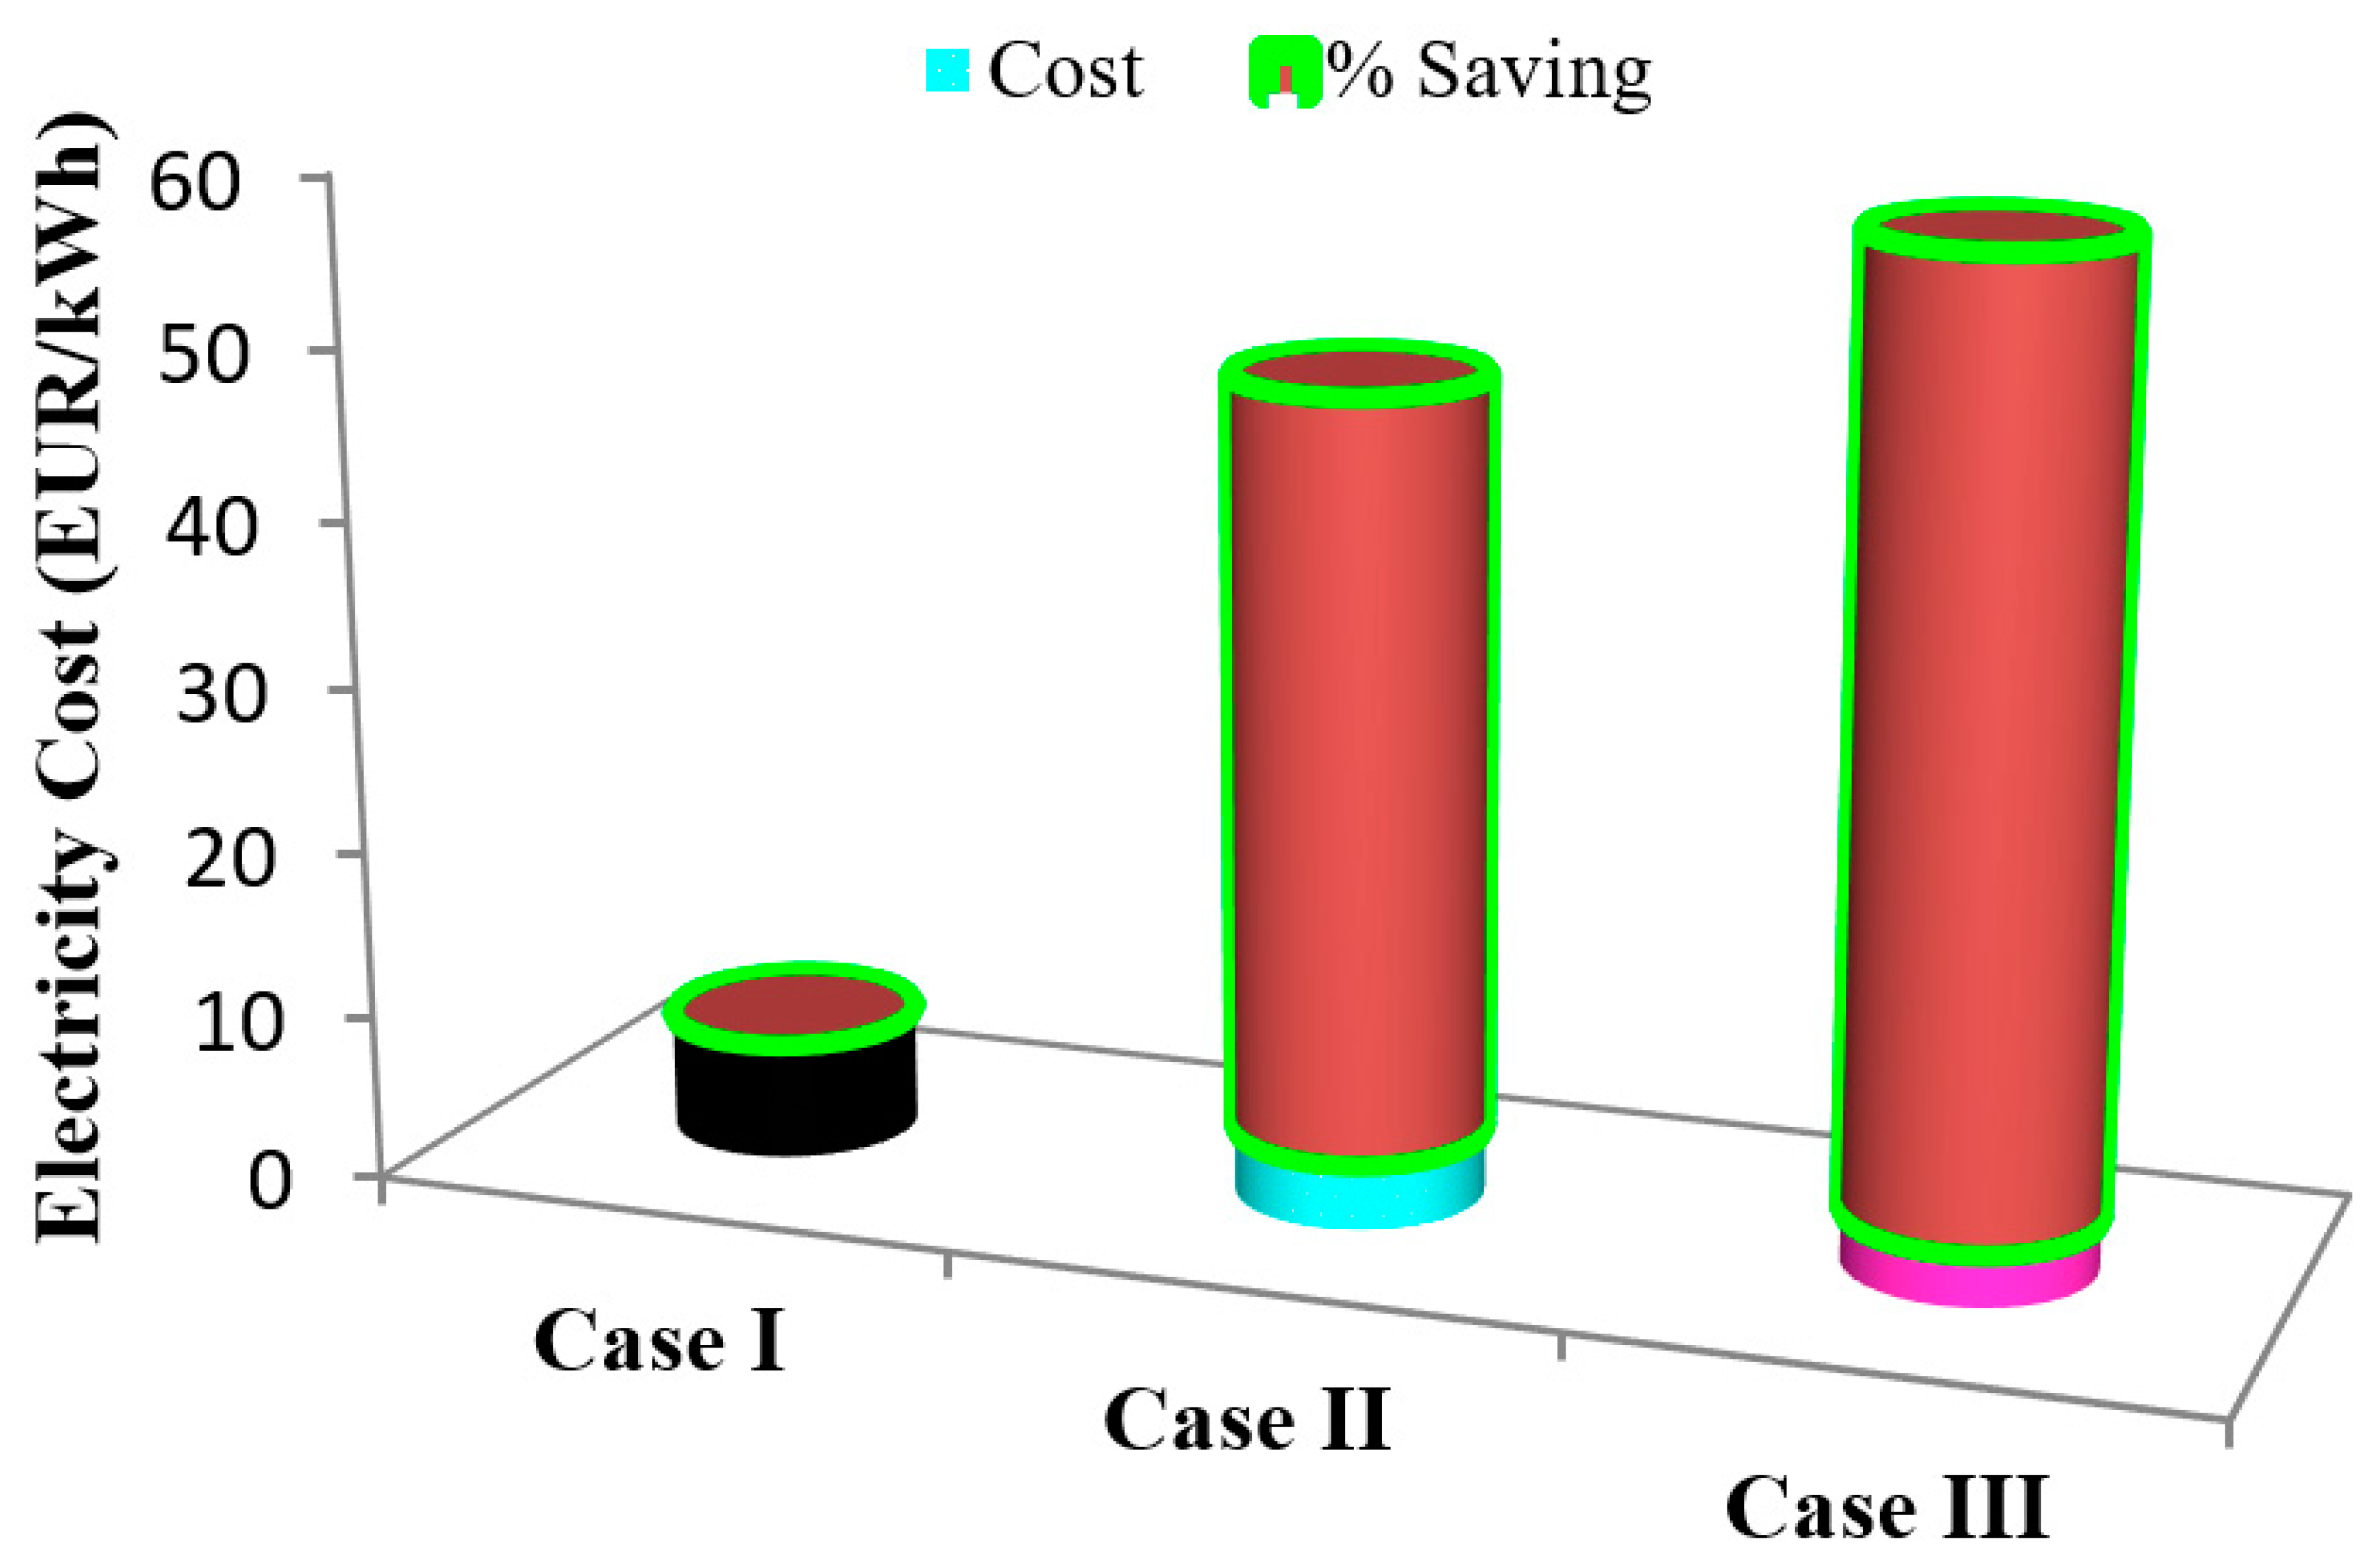
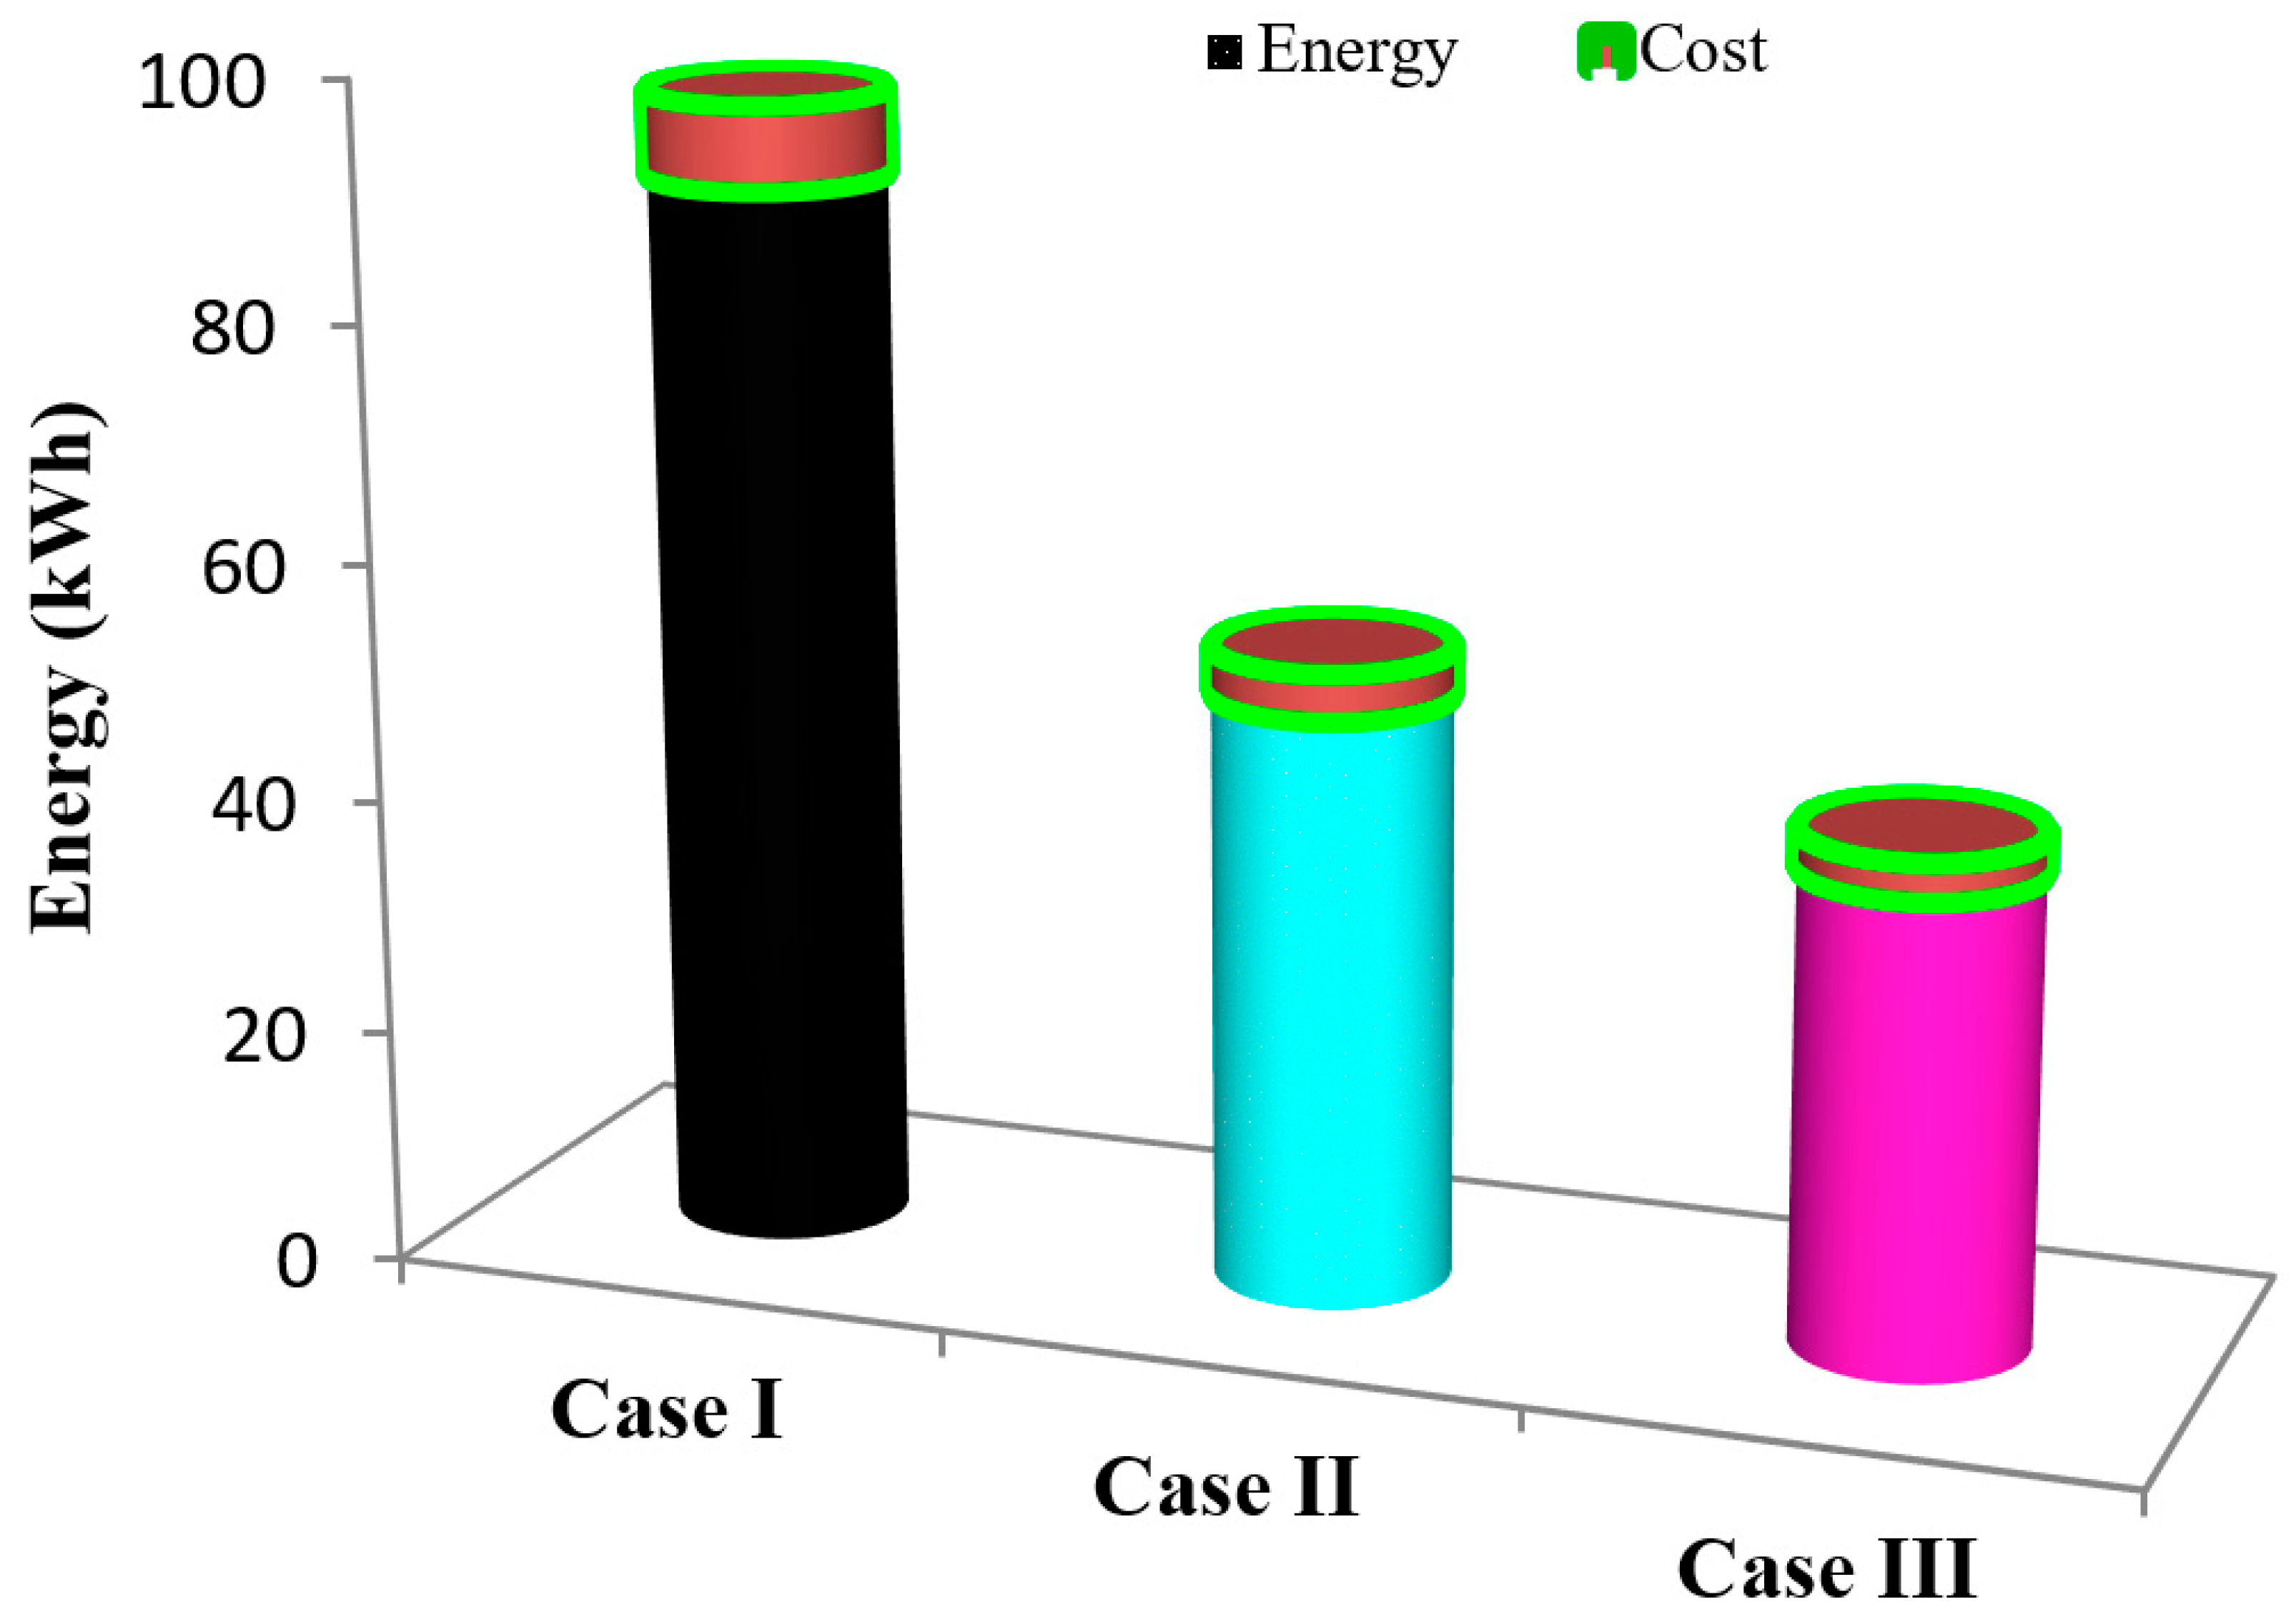
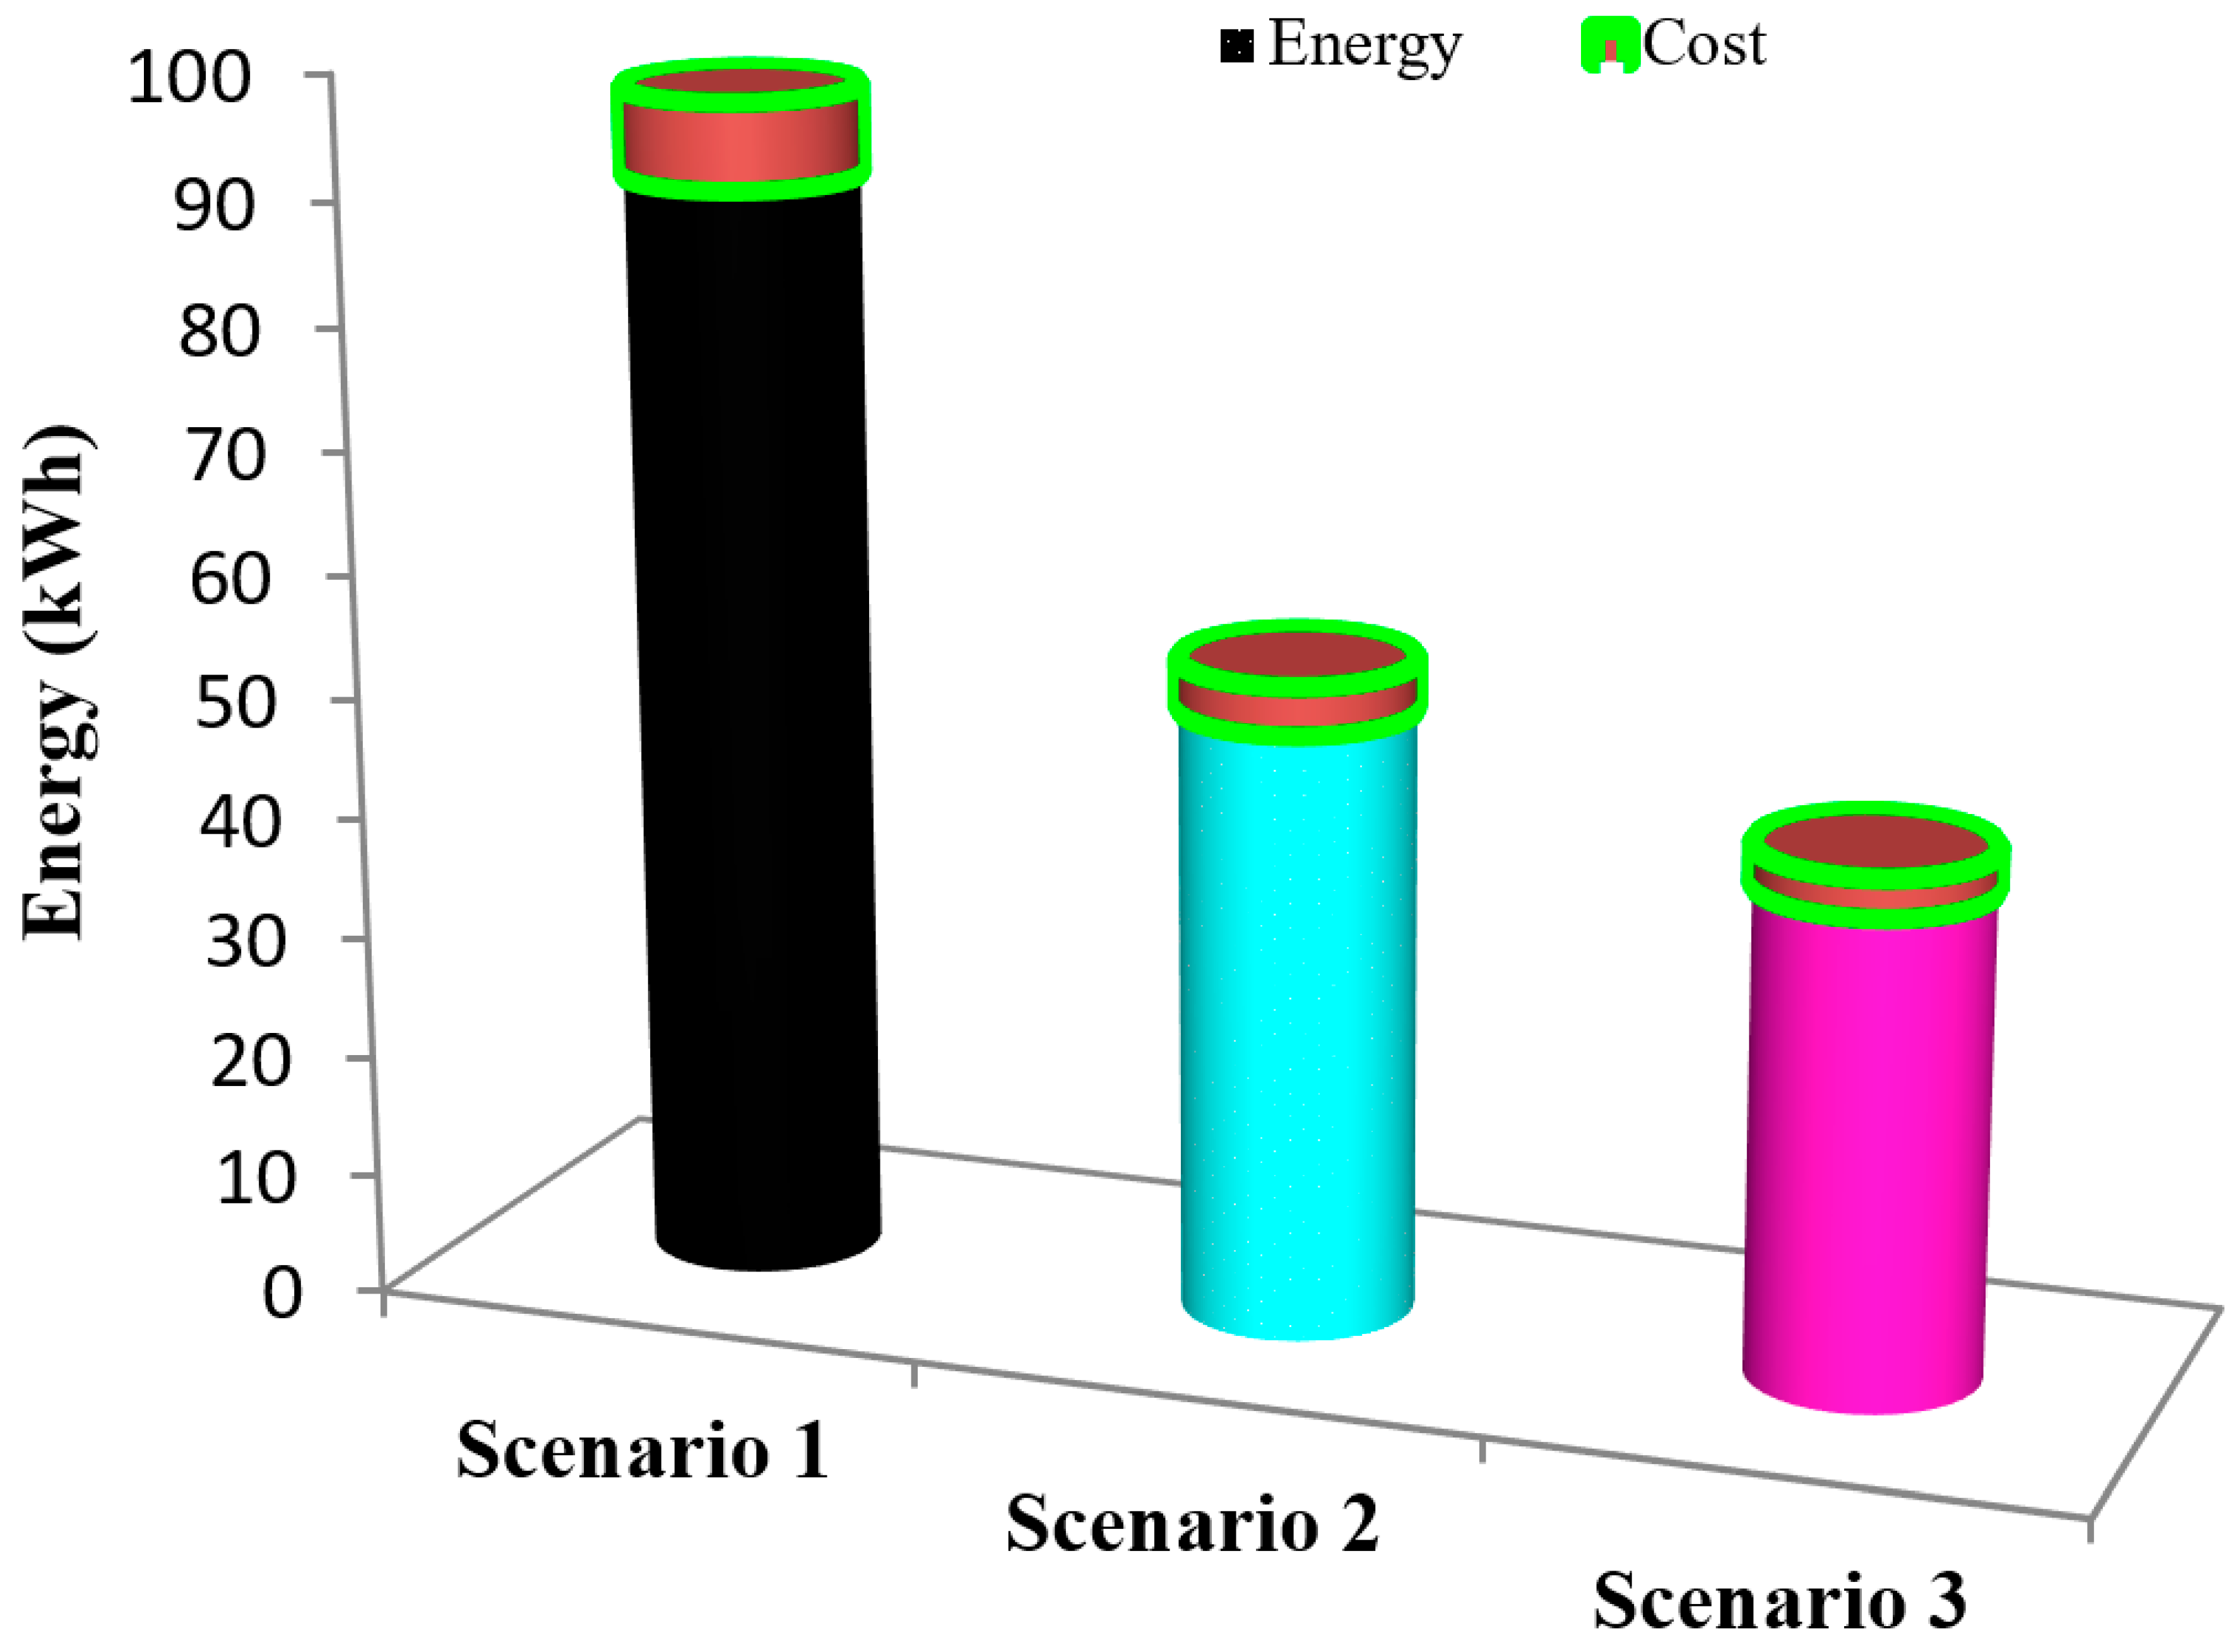
| 22: | Evaluate hourly and daily average energy and cost. |
| 23: | Evaluate percentage of saving (energy and cost) |
| 24: | Evaluate self-satisfied power demand. |
| 25: | Repeat step 4. |
| 26: | Until iteration (i ≥ N). |
| 27: | Stop simulation. |


 ,
, 


