Article

The Use of Time-Frequency Moments as Inputs of LSTM Network for ECG Signal Classification

by
Grzegorz Kłosowski
1,*,
Tomasz Rymarczyk
2,3,
Dariusz Wójcik
3,
Stanisław Skowron
1,
Tomasz Cieplak
1 and
Przemysław Adamkiewicz
2,3
1
Department of Organization of Enterprise, Faculty of Management, Lublin University of Technology, ul. Nadbystrzycka 38 D, 20-618 Lublin, Poland
2
University of Economics and Innovation in Lublin, ul. Projektowa 4, 20-209 Lublin, Poland
3
Research and Development Center, Netrix S.A., 20-704 Lublin, Poland
*
Author to whom correspondence should be addressed.
Electronics 2020, 9(9), 1452; https://doi.org/10.3390/electronics9091452
Submission received: 24 July 2020 / Revised: 20 August 2020 / Accepted: 31 August 2020 / Published: 6 September 2020
(This article belongs to the Section Bioelectronics)

Abstract

:
This paper refers to the method of using the deep neural long-short-term memory (LSTM) network for the problem of electrocardiogram (ECG) signal classification. ECG signals contain a lot of subtle information analyzed by doctors to determine the type of heart dysfunction. Due to the large number of signal features that are difficult to identify, raw ECG data is usually not suitable for use in machine learning. The article presents how to transform individual ECG time series into spectral images for which two characteristics are determined, which are instantaneous frequency and spectral entropy. Feature extraction consists of converting the ECG signal into a series of spectral images using short-term Fourier transformation. Then the images were converted using Fourier transform again to two signals, which includes instantaneous frequency and spectral entropy. The data set transformed in this way was used to train the LSTM network. During the experiments, the LSTM networks were trained for both raw and spectrally transformed data. Then, the LSTM networks trained in this way were compared with each other. The obtained results prove that the transformation of input signals into images can be an effective method of improving the quality of classifiers based on deep learning.

1. Introduction

One person dies every 37 s in the United States from cardiovascular disease [1]. Around 74% of all deaths in the United States occur as a result of 10 causes. Heart disease (23.5%) is the leading cause of death for both men and women. This is the case in the U.S. and worldwide [1,2].
Over the past few decades, the market for digital health applications has seen a huge increase in requirements. The development of the Internet of Things (IoT) and data analysis provided the necessary elements to implement a sensor network for health purposes. ECG monitoring is one of the most important health care monitoring systems. Modern alarm systems can record and analyze heart health 24 h a day, 7 days a week, and quickly report unusual health conditions to a remote health center, which can potentially save lives [3]. Since the devices recording ECG signals allow the collection of large amounts of data, researchers are working on the development of more effective algorithms based on machine learning methods, which enables automatic diagnosis of the patient’s heart condition. In recent years, there has been a trend of dynamic development of methods using convolution neural networks and deep learning. The above trend applies to many areas of life and the economy [4,5,6,7,8]. It is not surprising then that it has also become an indicator of technological progress in medicine.

1.1. Related Work in Machine Learning

Models based on supervised learning often take the form of artificial neural networks (ANN) [9]. An example is an algorithm for identifying patients with atrial fibrillation during sinus rhythm. The researchers conducted a retrospective analysis of outcome prediction with the use of a convolutional neural network (CNN) designed in the Keras Framework with a Tensorflow (Google, Mountain View, CA, USA) backend and Python [10]. Another example of the use of CNN in the diagnosis of heart disease is research conducted by Nahian Ibn Hasan and Arnab Bhattacharjee [11] who implemented a hybrid approach with the use of Empirical Mode Decomposition and CNN to classify ECG signals. Tahsin M. Rahman et al. [12] used Support Vector Machine (SVM) in the early detection of kidney disease using ECG signals. Min-Gu Kim and Sung Bum Pan [13] implemented one dimension (1-D) ensemble CNN for real-time ECG recognition. Peng Zhao et al. [14] compared CNN with several baseline classification schemes, including SVM, KNN (K-Nearest Neighbor), LR (Logistic Regression), RF (Random Forest), DT (Decision Tree), and GBDT (Gradient Boosting Decision Tree). Wei Zhao et al. [15] developed a deep neural network to classify the heartbeat on the ECG signals following the guideline of the ANSI/AAMI EC57. Iraia Isasi et al. [16] proposed a robust machine learning architecture for a reliable ECG rhythm analysis during cardiopulmonary resuscitation. The following methods were tested: ANN, SVM, KLR (Kernel Logistic Regression), and BDT (Boosting of Decision Trees). A similar comparison was made by Janghel and Pandey [17]. Sara S. Abdeldayem and Thirimachos Bourlai [18] have developed a very interesting concept for analyzing ECG-based signals using spectral correlation and 2-D CNN.
Another example of the use of 2-D CNN to analyze ECG signals are research studies of Yıldırım et al. [19] and Elif Izci et al. [20]. They proved that 2-D CNN, which is an image-based ECG signal classification structure, achieves better performance than 1-D CNN. Indra Hermawan et al. [21] proposed a method for ECG signals quality assessment (SQA) by using a temporal feature and heuristic rule. Mihaela Porumb et al. [22] proposed a CNN + RNN system for hypoglycemic events detection based on ECG. Y.T. Sheen [23] proved that the wavelet-based demodulating function can be successfully used in the 3D spectral analysis for vibration signals. A. Diker et al. [24] achieved 95% accuracy in ECG signal classification thanks to the Wavelet Kernel Extreme Learning Machine algorithm.
H. M. Lynn et al. [25] proposed a deep Recurrent Neural Networks (RNNs) based on a Gated Recurrent Unit (GRU) in a bidirectional manner (BGRU) for human identification from ECG-based biometrics. This is a classification task that aims to identify a subject from a given time-series sequential data. The models were evaluated with two publicly available datasets: ECG-ID Database (ECGID) and MIT-BIH Arrhythmia Database (MITDB). Thanks to the presented concept, 98.6% accuracy was achieved. M. Salem et al. [26] used the long-short-term memory (LSTM) network with feature extraction using spectrograms to classify ECG signals. A total of 97.3% accuracy was obtained.
Very interesting large-scale research has recently been published by H. Zhu et al. in The Lancet Digital Health journal [27]. A CNN model was trained to diagnose 20 ECG arrhythmias, including all of the common rhythm or conduction abnormality types. The performance of the model was compared with 53 physicians working in cardiology departments across a wide range of experience levels from 0 to more than 12 years. It turned out that the CNN model exceeded the performance of physicians clinically qualified in ECG interpretation. Table 1 shows a comparison of selected ECG signal classification methods.

1.2. Related Work in Reference to LSTM

The long-short-term memory (LSTM) networks are specifically designed to find patterns in time [28], such as ECG signals, to generate improved performance. ECG signals are typical sequences. Therefore, the ability to remember characteristic fragments of time series is crucial during the learning process. The fact of having long-term and short-term memory was the main reason that the LSTM network was selected as the basic structure of the predictive system in this study. Jan Werth et al. [29] compared the performance of ECG signals classification in automatic sleep state classification in preterm infants. They tested two types of neural networks—LSTM and gated recurrent unit (GRU). Ö. Yildirim [30] implemented feature extraction based on the Daubechies dB6 wavelet family. Signals decomposed into sub-bands by wavelet transform were transformed into an appropriate form for the LSTM inputs. Thanks to the wavelet sequences layer, LSTM network accuracy reached 99.39%. The basic difference between Yildirim’s research and ours is that the features we extracted (Instantaneous Frequency and Spectral Entropy) are spectral in nature. Ö. Yildirim converted the ECG signal into a wavelet. Another difference refers to the structure of the LSTM network. Ö. Yildirim tested two types of structures. The first LSTM network had two unidirectional LSTM layers, and two dense (fully connected) layers. The second network consisted of two bidirectional LSTM, and two dense (fully connected) layers. In both networks, the input was a single signal, which was converted to a wavelet. In our research, we used a simpler network structure consisting of a single bidirectional LSTM layer and one fully connected layer. However, a single ECG signal has been converted into a double signal consisting of the instantaneous frequency and the spectral entropy.
Y.S. Jeong et al. [36] developed an algorithm for the real-time prediction of blood pressure between the induction of anesthesia and the start of surgery. This is a regression problem. Blood pressure is predicted three minutes in advance. The authors used RNN to capture arbitrary features from sequential vital signs and made predictions based on the features. Aside from the fact that the above studies dealt with a subject slightly different from the ECG, the major difference with the method presented in this paper is that blood pressure prediction is a regression problem when ECG categorization is a classification problem. In a neural network with an RNN architecture, a 27-element vector of raw data was used, while, in the presented model, an LSTM with a single input signal was used, which then, as a result of feature extraction, is converted into two extracted features — Instantaneous Frequency and Spectral Entropy.
Corneliu T. C. Arsene, R. Hankins, and H. Yin [37] applied a CNN regression model and LSTM network capable of rejecting very high levels of noise in the ECG signals. This is a situation that has not been addressed before.
Ramya et al. [38] used QRS complex detection and feature extraction for envisioning ventricular arrhythmia from ECG. Yu-Jhen Chen et al. [31] proposed to use an architecture combining CNN and LSTM to develop a classification of cardiac arrhythmias. Ahmed Mostayed et al. [39] proposed a Bi-directional LSTM classifier to detect pathologies in 12-lead ECG signals. S. Saadatnejad, M. Oveisi, and M. Hashemi [40] designed the LSTM-Based ECG classification algorithm for continuous monitoring on personal wearable devices. Junli Gao et al. [41] introduced an LSTM network with focal loss (FL) to detect arrhythmia on an imbalanced ECG dataset.
They improved the training effect by inhibiting the impact of a large number of easy normal ECG beat data on model training. Cardiac arrhythmia detection from single-lead ECG was the subject of research conducted by Dhwaj Verma and Sonali Agarwal [42]. They used a hybrid system consisting of 1-D convolution and LSTM assisted by oversampling.
Yen-Chun Chang et al. [43] implemented LSTM for atrial fibrillation detection by exploiting the spectral and temporal characteristics of ECG signals with 98.3% accuracy. Yuen, Dong, and Lu [44] developed a novel CNN-LSTM structure for detecting QRS complexes in noisy ECG signals. The last two examples of research concern binary classification.
M. Zihlmann et al. [32] indicated that aggregation of features across time using the convolutional and LSTM network is more effective than average in the ECG classification. To preprocess the data they computed, the one-sided spectrogram of the time-domain input ECG signal applied a logarithmic transform. Average accuracy of 82.3% was achieved.

1.3. Objective and Contribution

The overall goal of the research was to develop a more effective method of ECG signal classification. It was proven that the spectral extraction of features using logarithmic transform and the use of the LSTM neural network gives good results [32]. In the presented model, a single raw ECG signal was transformed into two signals of spectrograms, generated by various time transformations, which increased the effectiveness of prediction.
The main contribution of this article is as follows:
Development of an effective LSTM model for classifying six categories of ECG signals, using two time-frequency (TF) moments extracted from the spectrograms - instantaneous frequency (IF) and spectral entropy (SE).
Comparison of the effectiveness of LSTM network training in the variant with a single raw ECG signal at the input and in the variant with two input features (IF and SE).
With regard to signal noise reduction, noise is stationary while the raw signal is cyclo-stationary [18]. This fact causes the extraction of features based on spectral images of raw ECG signals, which makes it possible to skip the noise reduction stage.

2. Materials and Methods

2.1. Problem Description

In ECG signal classification, the problem is the uncertainty of the prediction. The above problem is important especially because it concerns human health and life. Hence, there is a need to develop classification methods that reduce the level of prediction uncertainty to an absolute minimum.
The next part of the article presents two models of LSTM networks, whose task was to classify six types of heart dysfunction based on ECG signals. The first model uses LSTM with a single input (raw ECG signal). The second model uses LSTM with two features, extracted from the raw ECG signal using Fourier transform and spectrograms.
The following classes can be distinguished in the ECG data sets used: natural ECG signal at 60 bpm (N), atrial fibrillation (A), bradycardia at 30 bpm, tachycardia at 180 bpm, premature ventricular contraction (PVC), and ventricular tachycardia. The waveforms of individual ECG partial signals are shown in Figure 1.

2.2. Dataset Acquisition

The data used to train the LSTM network were generated using FLUKE “ProSim 4 Vital Sign and ECG Simulator.” Dataset counted 3121 signals. Each signal included 5 s and 5000 measurements (5 kHz). Table 2 presents the numbers of signals belonging to individual classes. Initially, the largest number of signals (1140) referred to Normal ECG, while only 60 measurement signals were assigned to the Brachycardia category.
Taking into account the number of signals belonging to particular categories of ECG dysfunction, the division of data into the training and test sets was established in the proportions 95/5. Thus, the division of the most numerous signal category, which is Normal ECG, into the training and testing set was 1080/60 (1080 + 60 = 1140). Since 36.5% of the signals are normal, a classifier would learn that it can achieve high accuracy by simply classifying all signals as normal. To avoid this error, the dysfunctional data was extended by duplicating the dysfunctional signals in the data set. As a result, the same number of normal and dysfunctional signals was obtained. This type of duplication, commonly known as oversampling, is one form of data augmentation used in deep learning.
As part of oversampling, the training signals of all other categories were multiplied to 1080. The signals for the testing set were duplicated similarly by obtaining 60 signals for each ECG category.

2.3. LSTM Architecture

In the presented research, a deep LSTM network was used to classify ECG signals. An important feature that distinguishes LSTM from other methods is the ability to learn long-term relationships between time steps in time series or given sequences.
Figure 2 presents a diagram of the LSTM network structure. The LSTM layer consists of two states — hidden (initial) and cell state. The output data of the LSTM layer for a given time step t is contained in a hidden state at t [45].
The cell status contains information learned on the basis of previous time steps. At each time stage, the LSTM layer adds or removes information from the cell’s state. Information updates are controlled by means of gates. Individual gates control levels of cell states: f—reset (forget), (i)—input gate controls the level of cell state update, (o)—output gate, g—cell candidate. They add information to the cell state. Weights W, the recurrent weights R, and biases b can be described by Formula (1).
W = [ W i W f W g W o ] ,   R = [ R i R f R g R o ] ,     b = [ b i b f b g b o ]
where i, f, o, and g denote the input, forget and output gates, and cell candidate, respectively. The cell state in a given time step t is descripted by c t = f t c t 1 + i t g t , where ⊙ denotes element-wise multiplication of vectors. The hidden state at time step t can be described as h t = o t σ c ( c t ) where σ c is the state activation function. The Equations (2)–(5) describe the components of the LSTM layer in time step t.
i t = σ g ( W i x t + R i h t 1 + b i )
f t = σ g ( W f x t + R f h t 1 + b f )
g t = σ c ( W g x t + R g h t 1 + b g )
o t = σ g ( W o x t + R o h t 1 + b o )
In the above formulas, σ g means gate activation function. In the LSTM network layers, the sigmoidal activation function was used. It can be expressed by σ ( x ) = ( 1 + e x ) 1 .

2.4. Classification of Raw ECG Signal

The first variant tested was the LSTM network with five layers was used. In the case of neural networks, there are no strict rules for selecting network parameters (e.g., number of layers, number of neurons in layers, transfer functions) for specific types of problems. Accordingly, the network parameters are selected experimentally. This was also the case in this scenario.
Table 3 specifies the optimal parameters of the neural network for classification of a raw ECG signal, containing one double layer LSTM with 200 hidden neurons. The conducted experiments showed that a smaller number of hidden neurons causes a deterioration of network quality while increasing the number of neurons and adding subsequent layers extends the learning process without causing an increase in the quality of the LSTM network.
The first layer in the LSTM model is sequence input. The sequence input layer aims to enter sequential data into the network. The next is the bidirectional layer BiLSTM. The bidirectional LSTM layer learns long-term relationships between signal time steps or sequence data in both directions (forward with feedback). These relationships are important when there is a need for the network to learn from full-time series at each time step. The third layer of the LSTM is a fully connected layer. This layer multiplies the numerical input values by the weight matrix and also adds a vector of biases.
In deep networks, one or more fully connected layers are introduced after convolution and down sampling layers. If the input to a fully connected layer is a sequence as in the case of LSTM, then the fully connected layer works individually at each stage. If the output of the layer placed before the fully connected layer is an array A1 of the size X by Y by Z, then the fully connected layer output is an array A2 of the size X’ (output size) by Y by Z. At the time step t, the appropriate input of A2 is WA t +   b , where A t is the time step t of A and b is the bias. In these studies, Glorot initializer was the initiating algorithm for the weights of this layer [46]. The penultimate layer is the softmax. This type of layer is typical for deep classification neural networks. The softmax layer is always preceded by a fully connected layer. Formula y r ( x ) = e a r ( x ) / j = 1 k e a j ( x ) shows the softmax activation function, where 0 y r 1 , j = 1 k y j = 1 .
The last layer computes the cross entropy loss for classification problems with mutually exclusive classes. To ensure training sets of a sufficiently large number, aggregation of measurement data with similar characteristics was made. The adaptive moment estimation (ADAM) algorithm [47] was used to train the LSTM network. The BiLSTM layer has the following parameters: state activation function—tanh, gate activation function— sigmoid, mini batch size = 150, initial learning rate = 0.01, sequence length = 1000, gradient threshold = 1. The above parameters were determined experimentally. Various variants of the model containing the dropout layer were tested with a probability ranging from 0.1 to 0.5. The tests showed that, in the case studied, adding dropout layers did not increase the network generalization ability. Due to the above, we decided not to use this type of layer in the presented predictive model.

2.5. Spectral Feature Extraction

The second variant of the tested LSTM network was a model powered by two spectral inputs (TF moments) - instantaneous frequency (IF) and spectral entropy (SE). IF and SE values were calculated as a result of feature extraction. Extracting features from the data can help improve the training and testing accuracies of the classifier. To select the features to extract, an approach was used that calculates time-frequency images, such as spectrograms, and used them to train LSTM.
CNN is best suited for classifying multidimensional images. Since LSTM was used in this case, it is important to translate this approach so that it applies to one-dimensional signals. TF moments extract information from spectral images. Any moment can be used as a one-dimensional feature suitable for entering data into LSTM. Figure 3 shows six classes of spectrograms corresponding to each type of ECG signal.
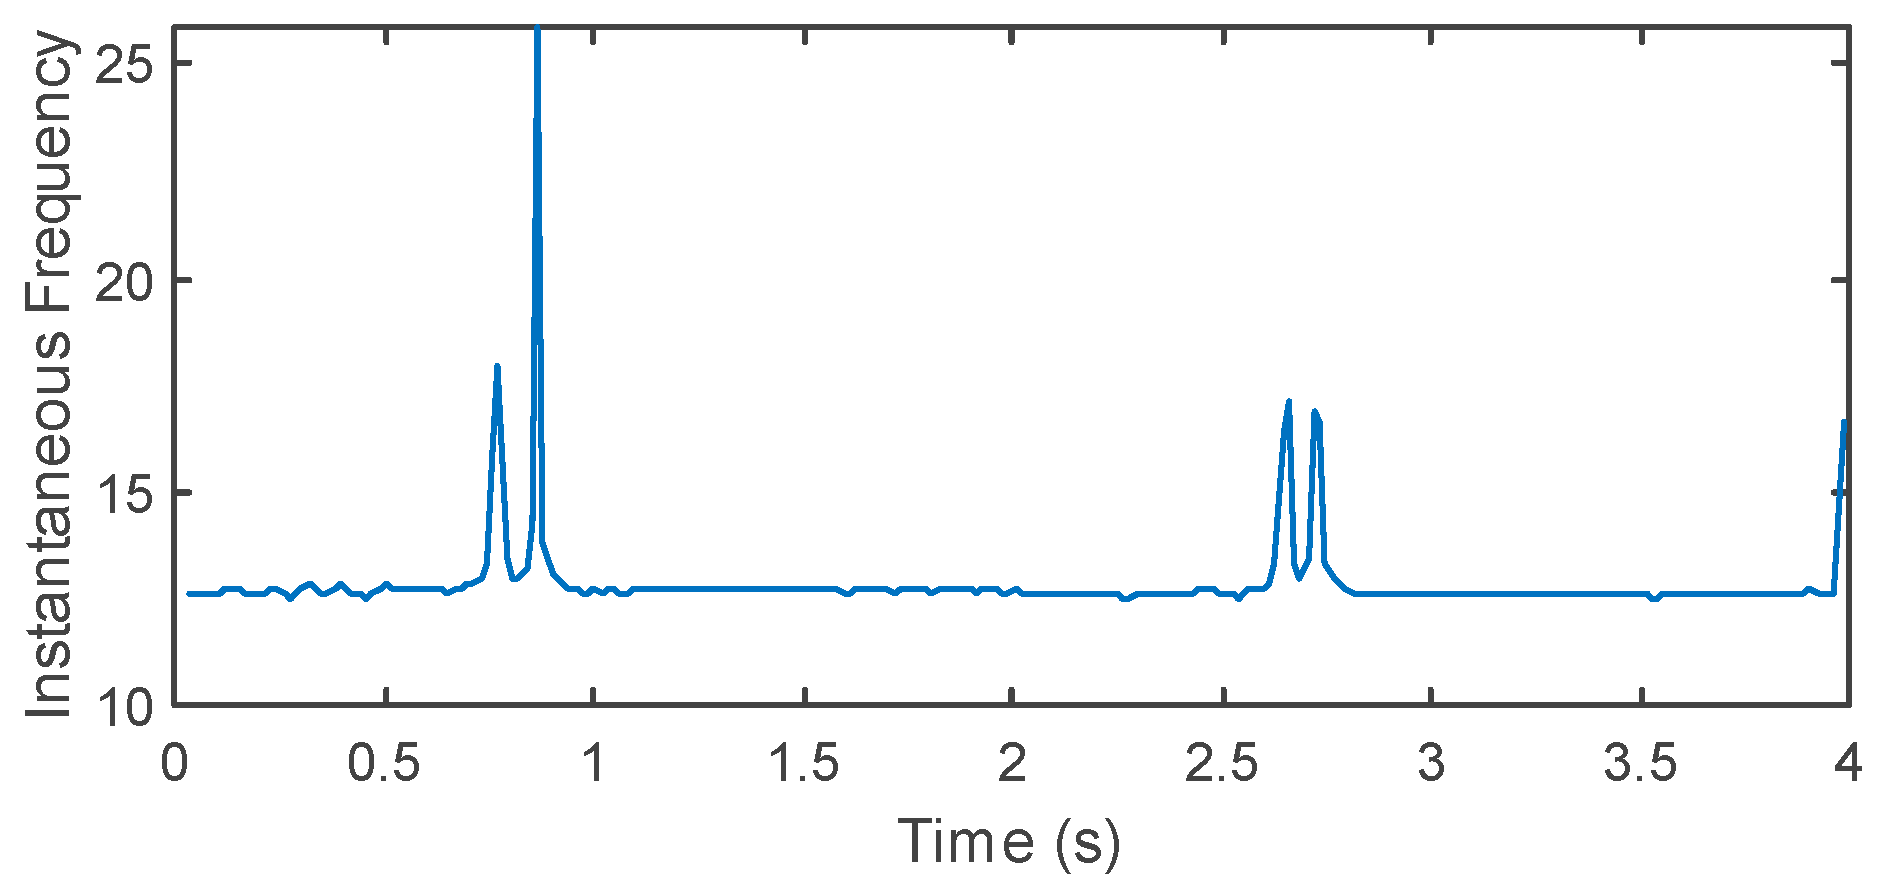
The first chosen TF moment was instantaneous frequency (IF) of a nonstationary signal. IF is a time-varying parameter that relates to the average of the frequencies present in the signal. Function f i n s t ( t ) calculates the spectrogram power spectrum P ( t , f ) of the input, and uses the spectrum as a time-frequency distribution. Function f i n s t ( t ) estimates the instantaneous frequency using Equation (6).
f i n s t ( t ) = 0 f P ( t , f ) d f 0 P ( t , f ) d f
where: P ( t , f ) —contains the power spectrum estimate of each channel of an input signal, t—sample times vector, f—spectrum frequencies [48].
To compute the instantaneous spectral entropy given a time-frequency power spectrogram S ( t , f ) , the probability distribution at time t is Equation (7).
P ( t , m ) = S ( t , m ) f S ( t , f )
The second extracted TF moment was spectral entropy (SE). The SE measures its spectral power distribution of the ECG signal. The SE index is derived from the concept of Shannon entropy or information entropy known from information theory. To calculate SE, the normalized power distribution of the signal in the frequency domain should be treated analogously to the probability distribution and calculate its Shannon entropy [49]. This means that, to calculate SE, Shannon Entropy should be treated as a signal spectral entropy. This property was used to extract features from the raw ECG signal. The equations for SE arise from the formulas for the power spectrum and signal probability distribution P ( m ) . For a signal x ( n ) , the power spectrum is S ( m ) = | X ( m ) | 2 , where X ( m ) is the discrete Fourier transform of x ( n ) and P ( m ) follows as shown in Equation (8).
P ( m ) = t S ( t , m ) f t S ( t , f )
The spectral entropy H can be described with Formula (9).
H = m = 1 N P ( m ) log 2 P ( m )
To compute the instantaneous spectral entropy for power spectrogram S ( t , f ) for a given time-frequency f , the probability distribution at time t is shown below.
P ( t , m ) = S ( t , m ) f S ( t , f )
Lastly, SE at time t can be expressed by Formula (11).
H ( t ) = m = 1 N P ( t , m ) log 2 P ( t , m )
The time-dependent frequency of signals as the first moment of the power spectrograms was estimated. The spectrograms using short-time Fourier transforms over time windows were computed. We applied 129 time windows in this case. The time values correspond to the centers of the time windows.
Figure 4 shows the instantaneous frequency (IF) visualization for each type of ECG signal. The second estimated time-frequency moment of the power spectrogram was spectral entropy (SE). SE measures how flat (or spiky) the signal spectrum is. Function (11) estimates SE based on a power spectrogram. As for IF estimation, 129 time windows were used to create the spectrogram. The time outputs of the function correspond to the center of the time windows.
Figure 5 shows SE visualization for each type of ECG signal. IF and SE have mean values that differ by almost one order or magnitude ( I F ¯ = 12.1 and S E ¯ = 0.689 ). There is some risk that the mean instantaneous frequency ( I F ¯ ) is too high. In such a case, the data will not allow effective training of the LSTM.
When a network needs to match data with a large value range and high mean, such an input can slow down the training process and reduce network convergence. The training set mean and the standard deviation to standardize the training and testing sets were used. Standardization, or z-scoring, is a popular way to improve network performance during training. The means of the instantaneous frequency and spectral entropy after standardization were E [ I F ¯ ] = 0.1343 and E [ S E ¯ ] = 0.0079 . The conducted experiments showed that data standardization increased the accuracy level of the neural network trained in a specific time period by about 30%.
The LSTM after feature extraction had five layers. The LSTM network after extraction of two features has five layers, which is the same as in the previous variant. Table 4 presents the activation numbers and learnable parameters for the layers of LSTM with improved inputs.

3. Results

Below are the results of training and testing two variants of the LSTM network. The first option used single inputs, which were the ECG time series. In the second variant, the single input was replaced by a double input, consisting of two IF and SE spectral features extracted from the raw ECG signal with Fourier transform. The division of the entire dataset into training and testing sets is presented in Table 2.

3.1. LSTM with a Singular Raw ECG Signal Input

Before starting the training process, classifier options were specified. The number of epochs was set to 10 to allow the network to make 10 passes through training data. The minibatch size was set to 150. Because of this, the LSTM network considered 150 training signals simultaneously. The initial training rate was set to 0.01. This value was intended to accelerate the training process. In order for the device to not run out of memory due to taking into account too much data at the same time, the signal was divided into smaller parts. The maximum sequence length was set to 1000. To stabilize the training process by preventing the gradient from being too large, the gradient threshold was set to 1. An adaptive moment estimation solver (ADAM) was used. ADAM works better with recurrent neural networks (RNN), which include LSTM and stochastic gradient descent with momentum (SGDM). The metrics for the LSTM model quality were cross-entropy and accuracy. Accuracy is the percentage of correctly classified observations for all cases (12).
A c c u r a c y = N c N · 100 %
where Nc denotes the number of pixels reconstructed correctly and N denotes the total number of pixels [50]. Cross entropy loss between network predictions and target values is defined as Equation (13).
L o s s = i = 1 M T i l o g ( X i ) / N
where N represents the number of observations, M represents the number of responses, T i represents patterns, and X i represents network outputs. Figure 6 shows the training progress for the LSTM network with a raw input.
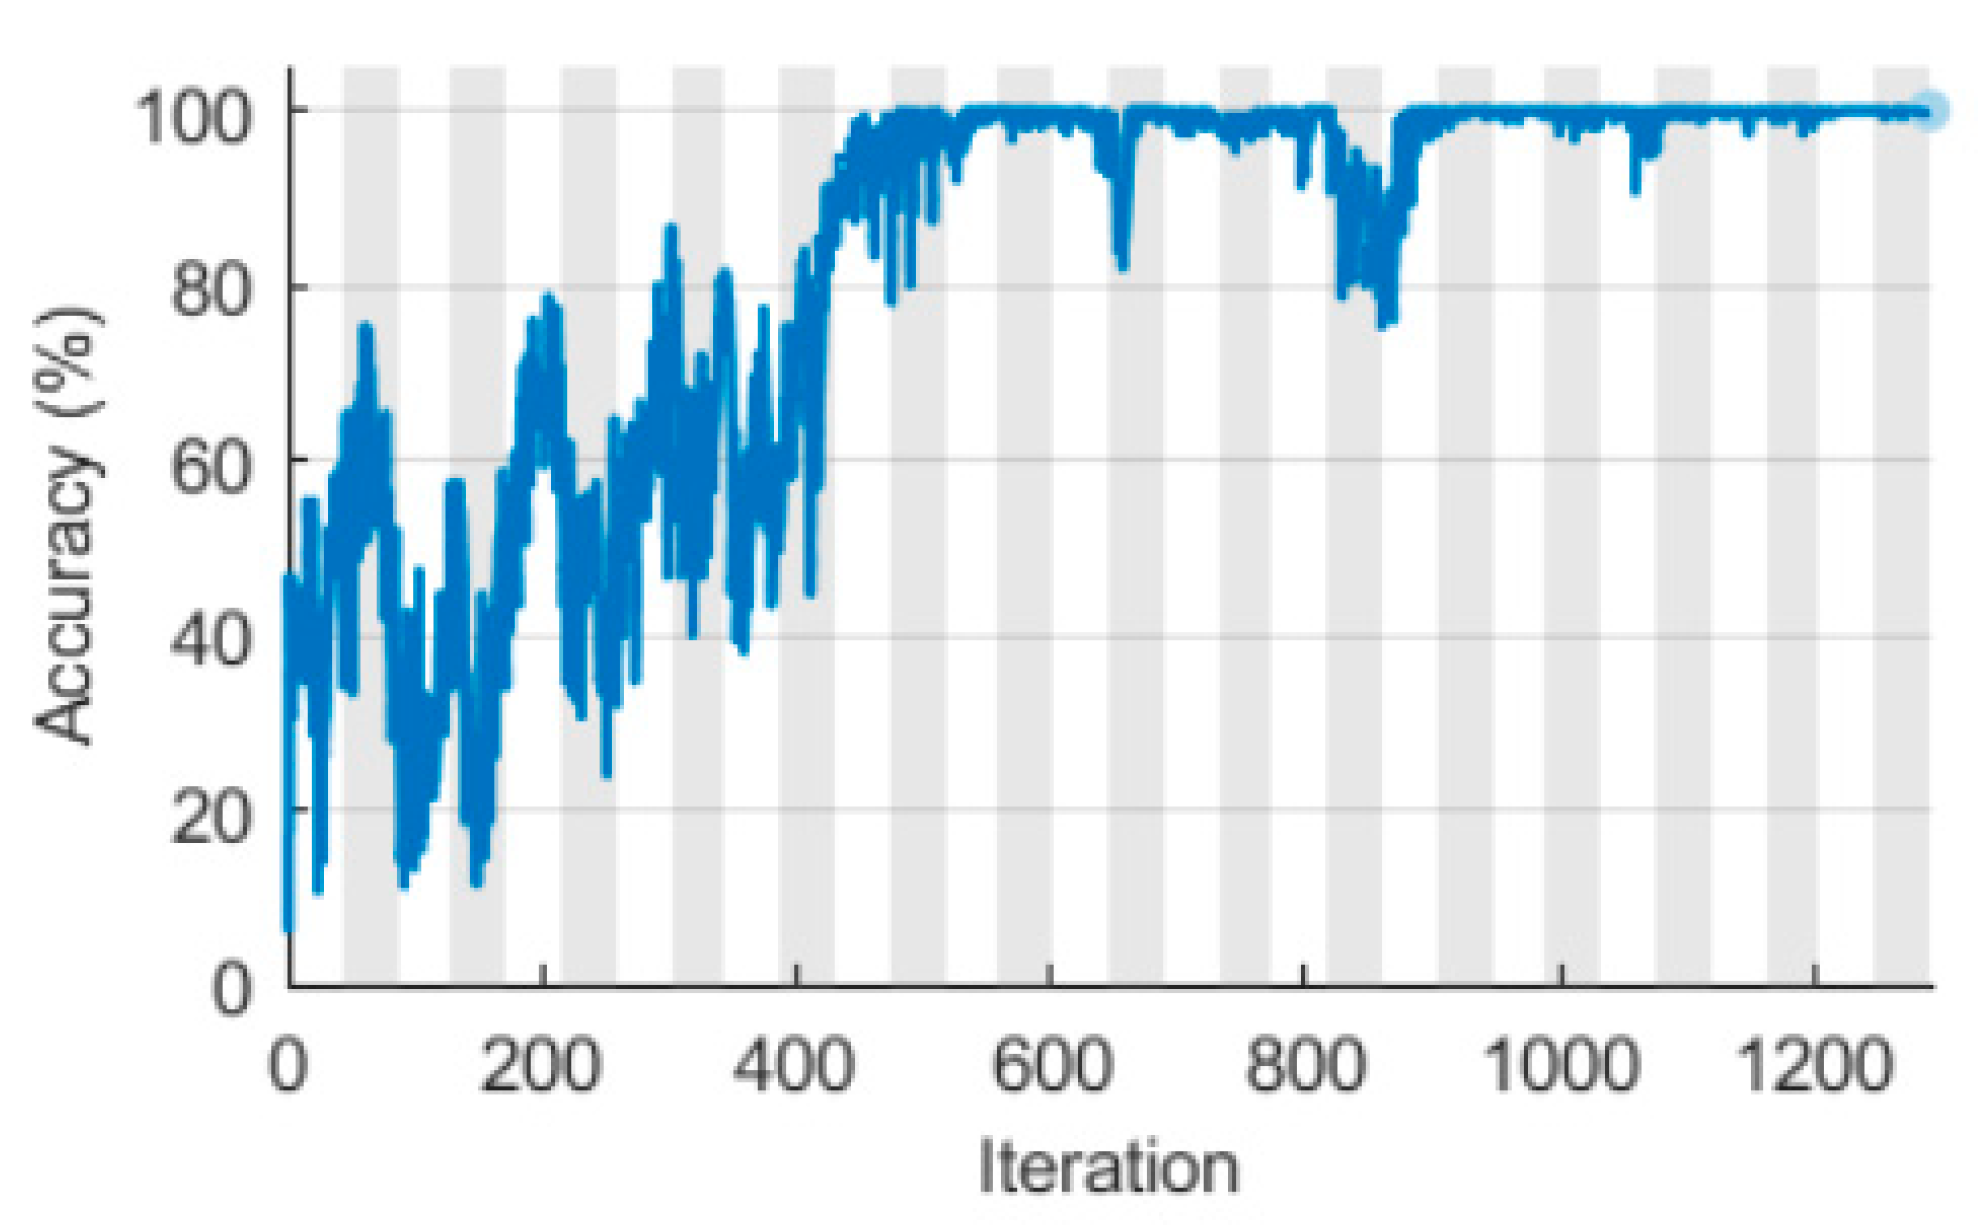
The training-progress plot exemplifies the training accuracy. Actually, it reflects the classification accuracy of each minibatch. For ideal training progress, this value increases to 100%. At the end of the training process, the classifier’s training accuracy oscillates between 50% and 70%. It has taken about 9 min to train. The computation was conducted on a PC with the following configuration: Intel® Core™ i5-8400 CPU 2.80 GHz, 16 GB RAM, GPU NVIDIA GeForce RTX 2070. The GPU was utilized.
Figure 7 shows the LSTM learning process with a single raw ECG signal in the context of the Loss indicator. The graph displays the loss of training, which is the loss of cross-entropy for each mini-batch. When training goes perfectly, the loss should decrease to zero. The shape of this plot confirms all the information that results from Figure 6.
It can be seen that the two training plots (Figure 6 and Figure 7) are not convergent. They oscillate between extreme values without any upward or downward trend. This oscillation means that the training accuracy does not improve and the training loss does not decrease. This happens almost from the beginning of training progress. The plot stabilized after an initial improvement in training accuracy.
Changing training options did not help the network achieve convergence. Decreasing the mini-batch size and reducing the initial learn rate resulted in longer training time, but did not help the LSTM learn better.
Figure 8 shows the confusion matrix for the training set of the LSTM with a raw ECG signal. PVC (Accuracy = 9.8%) and VTach 160 bpm (Accuracy = 3.3%) were the worst classified cardiac dysfunctions.
Figure 9 illustrates the confusion matrix for the testing set of the LSTM with a raw ECG signal.
Similar to the training set, PVC (Accuracy = 6.7%) and VTach 160 bpm (Accuracy = 1.7%) were the worst classified cardiac dysfunctions. The Brachycardia classification reached 100% accuracy. For a single raw ECG signal, the mean LSTM accuracy for the training set was 71.6%. The same metric for the testing set was 70.8%. Certainly, such low accuracy values do not testify to sufficient LSTM quality.

3.2. LSTM with Double Spectral Input Features

Figure 10 shows the raining accuracy for the LSTM network with the double spectral input. This plot is analogous to Figure 7. It is clear that the shape of the plot is different than in the case of Figure 6. Accuracy reaches the maximum value relatively quickly, and the fluctuations are low in amplitude. Some anomalies can be observed around the 650th and 860th iteration, but they are sporadic and do not cause the learning process to be unstable. The training time of the network, in this case, was about 1.5 min.
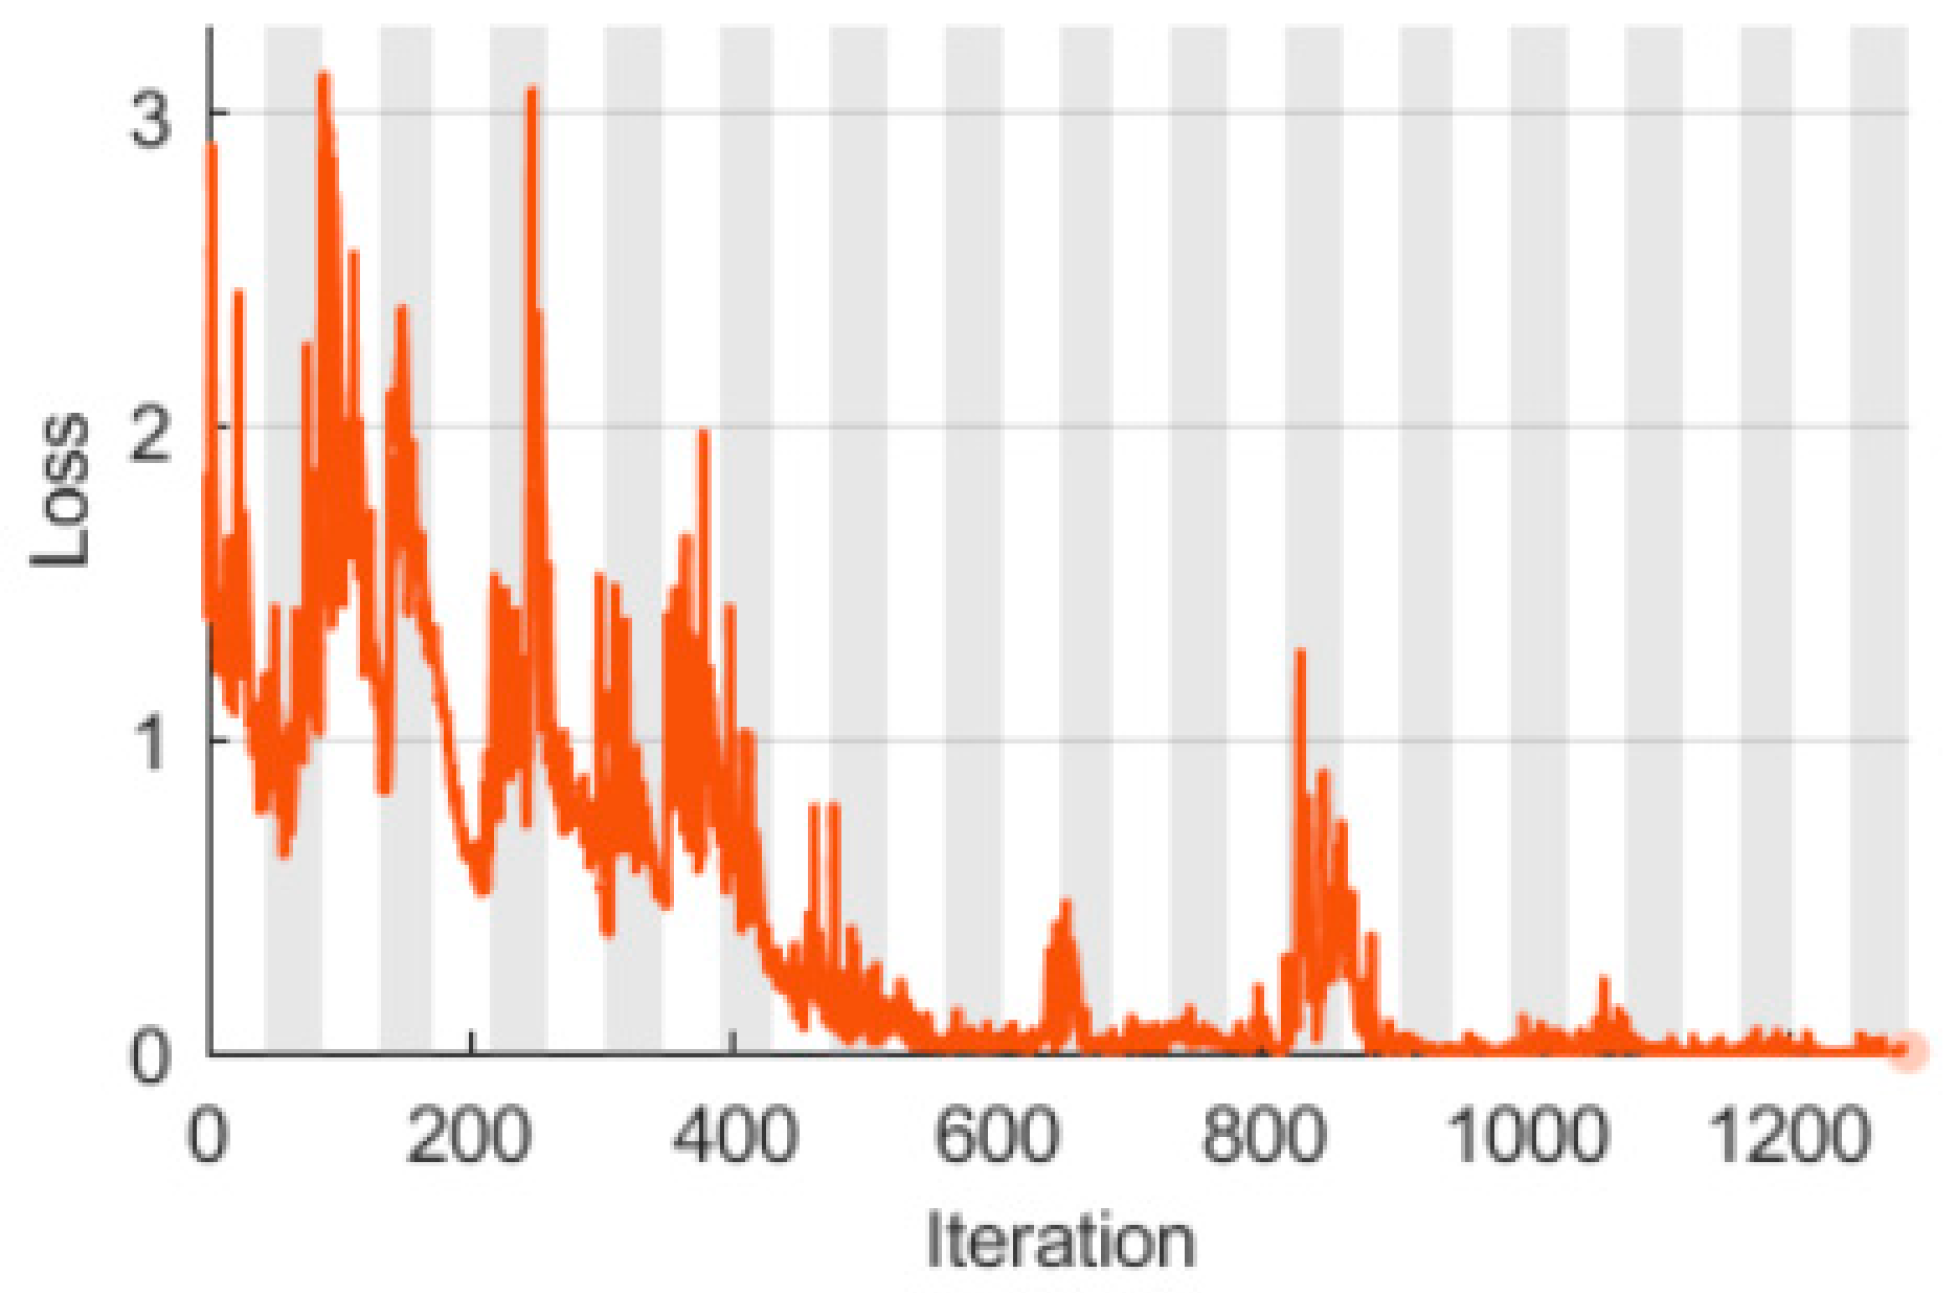
Figure 11 shows the LSTM learning process with the double spectral input in the context of the Loss indicator. The shape of this plot fully confirms the conclusions resulting from the analysis of Figure 6.
Figure 12 presents the confusion matrix for the training set of the LSTM with a double spectral ECG signal. Compared to Figure 8, the confusion matrix indicates decisive progress in the quality of LSTM network training. In principle, Figure 12 confirms what is already apparent from Figure 10 and Figure 11, i.e., high-quality classification. It can be seen that, apart from the Normal ECG class, all other heart dysfunctions are classified correctly.
Figure 13 (see below) is a continuation of the conclusions drawn from previous observations. During this time, all six classifiers achieved 100% prediction accuracy.
In the case of a double, spectrally extracted ECG signal, the mean LSTM accuracy for the training set was 99.98%. The same metric for the testing set was 100%. Clearly, spectral extraction of features from the raw ECG signal has contributed to improving the quality of the classification of heart dysfunction.

3.3. Model Validation in Real Conditions

For the final verification of the generalization capacity of the newly developed LSTM network, additional validation was carried out using real data. In our laboratory, a prototype of a special vest has been developed, which allows you to perform tomographic measurements and reconstructions, as well as ECG measurements [51,52]. Figure 14 shows the arrangement of electrodes seen from the inside of the vest.
The vest is equipped with a set of 102 specially designed textile electrodes. Each of the electrodes consists of three layers. The center of the electrode contains a laser cut sponge. The construction diagram of a single electrode is shown in Figure 15.
A conductive material is wrapped around the sponge. The electrically conductive material comes with a metal pin used in the textile industry that allows the electrode to be connected. This layer forms the upper part of the electrode. The back of the electrode is covered with silicone, which has a dual function. First, it binds all parts of the electrode together and also provides flexibility. Each electrode is connected with a shielded cable with a diameter of Ø 1 mm in which the screen is connected to the ground of the measuring device.
The arrangement of electrodes was developed in such a way as to enable measurement and reconstruction of 3D tomographic images with such techniques as Body Surface Potential Mapping (BSPM), Electrical Impedance Tomography (EIT) [53], and Electrical Capacitance Tomography (ECT) [6,54]. The electrode system also allows you to perform a full 12-channel ECG.
In order to verify the trained LSTM network, real ECG data was collected from two volunteers. Measurements were made using the electronic vest prototype. Volunteer No. 1 was diagnosed with PVC. Volunteer No. 2 was healthy. Figure 16 shows the ECG signal for volunteer No. 1 (PVC).
Figure 17 shows the ECG spectrogram of volunteer No. 1.
Figure 18 shows the first extracted feature of the spectral entropy (SE) for the ECG signal of volunteer No. 1.
Figure 19 shows the first extracted feature-Instantaneous Frequency (IF) for the ECG signal of volunteer No. 1. Comparing the raw ECG signal (Figure 16) with the SE and IF signals (Figure 18 and Figure 19), it can be seen that the transformed signals contain large enhanced changes while the small changes of the raw signal are smoothed. Feature extraction reduced noise associated with measurements made by the vest electrode system and highlighted signal changes key to classification.
Table 5 presents the LSTM network prediction results for both volunteers. In addition to the final results clearly indicating that the ECG signal of volunteer No. 1 was classified as PVC and the volunteer signal No. 2 was categorized as normal ECG, Table 5 also shows the percentage probabilities for individual categories of ECG signals.
Experiments on real data have shown that, for both volunteer No. 1 (PVC) and volunteer No. 2 (Normal ECG), the LSTM network classifies correctly and reliably. In both examined cases, the probabilities of indications are greater than 99%.

4. Discussion

All the experiments presented in this article were conducted in Matlab with the use of a Deep Learning Toolbox and Signal Processing Toolbox. Researchers usually use Python with the Keras Deep Learning library and TensorFlow, which is a comprehensive open-source machine learning platform, for ECG signal classification. Python is the right tool for software development and implementation, but Matlab has many features and functionalities that give it an advantage in the research phase. Matlab provides flexible, two-way integration with both Python and many other programming languages. Thanks to this, different teams can work together and use Matlab algorithms in production software and information systems. Furthermore, Matlab allows you to easily implement and test algorithms, develop the computational codes, quickly debug, use a large database of built-in algorithms, develop applications with graphics user interface, and much more.
The general impression emerging from the literature review on the subject of machine learning methods implemented for the issue of ECG signal classification indicates some limitations. These limitations apply to the direct processing of raw ECG signals. It turns out that the vast majority of classification systems of this type do not achieve prediction accuracy exceeding 90%. ECG signal processing, based on denoise or features extraction, allows for a significant improvement in classification results.
A clear trend can be observed in the pursuit of automation of monitoring and diagnosis of patients’ diseases. The way to implement this type of intention is smart wearables [44]. Separating the decision-making center from the doctor requires a responsible approach. The use of machine learning techniques aims to minimize wrong decisions in health. There is plenty of evidence that machine learning is a practical and effective prediction and classification tool that finds application in many areas of life and the economy [6,55,56,57].
Automatic recognition of heart dysfunctions still requires many improvements. Commercial solutions implemented are very cautious. For example, Apple offers a smartwatch that diagnoses atrial fibrillation based on a single-channel ECG signal. It still has very limited functionality.
For the automation of monitoring and diagnosis of health problems to reach a pragmatic level, two conditions should be met. The first condition is the ability to recognize many types of heart dysfunction instead of only the binary (sick or healthy) classification. The second condition is very high classification accuracy. In principle, accuracy should be 100% because the classifier is to replace a doctor. Until the algorithms provide such high-quality classification, in-depth research into a solution to this problem will be necessary.

5. Conclusions

The research presented in this article confirmed that the extraction of features from the raw ECG signal is an effective method leading to the improvement of the classification quality based on the LSTM network. In particular, the conversion of a single signal into spectrographic images can be accomplished using a Fourier transform. In the present case, two time-frequency (TF) moments extracted from the spectrograms known as instantaneous frequency (IF) and spectral entropy (SE) were used.
For a single raw ECG signal, the mean LSTM accuracy for the testing set was 70.8%. The same metric for the LSTM with a double spectral ECG signal was 100%. This result was obtained by classifying six types of cardiac dysfunctions. In a similar work, Chang et al. [43] developed a binary LSTM classifier in which the task was to detect atrial fibrillation only. Obtained accuracy for the training set was 98% and 85% for the testing set.
Spectral feature extraction results in a reduction of the number of variables in the training set. Thanks to this, the network learns faster. The learning accuracy increases because the input contains more relevant information and less noise. It can be noticed that the Fourier transformation denoises the raw ECG signal.
The number of ECG signals for Brachycardia was the smallest of all six classes and was only 60. Therefore, the test sets for all classes were 60 as well. As seen in Table 2, the numbers of all training sets are 1080, which means significant oversampling for Brachycardia.
The fact of a small number of cases for Brachycardia can be the reason for two bigger fluctuations in the second variant of LSTM (Figure 10 and Figure 11). This does not undermine the results of research and high-quality LSTM network. On the contrary, if more data were used, it is expected to smooth the plot completely.
LSTM works more effectively than CNN due to the transformation of the ECG signal into spectral features. CNNs have been designed to classify images, but these networks have no memory and are, therefore, unsuitable for forecasting time series or signals. LSTM after the transformation of a single input signal into a double spectral signal combines both features, including signal memory and high performance, in image recognition. This makes the quality of the LSTM network trained in this way extremely high.
The presented method has the following advantages compared to other known algorithms for classification of ECG signals.
  • Very high effectiveness—100% accuracy was obtained on the testing set,
  • It is possible to classify up to six categories of signals (five diseases and one for a healthy heart),
  • Combination of the advantages of convolution neural networks for image classification and recursive networks having implemented memory mechanisms,
  • Relatively low level of complexity—a single layer of BiLSTM with 200 hidden units was enough,
  • Increase in the number of input signals from one raw ECG to two spectral inputs (TF moments)—instantaneous frequency (IF) and spectral entropy (SE),
  • Converting raw ECG to two TF moments has reduced the amount of data needed to train the neural network. Thanks to this, the network learns not only more effectively but several times faster.
The presented solutions also have some limitations. It is uncertain how a trained LSTM network would behave if data from other ECG devices were used at the input. In order to reduce the uncertainty of results, more measurement data from different devices, carried out in different conditions on various groups of patients, should be collected.
Future research will be conducted toward the use of ECG signal classification algorithms combined with the use of intelligent clothing. A specially designed sensor system located in the vest will provide ECG data, and the LSTM algorithm will monitor the patient’s condition on an ongoing basis. This kind of concept requires solving a number of problems related to both hardware and software as well as obtaining a noise-free ECG signal. Future research will aim to develop a fully functional wearable Tektronix device for ECG monitoring.

Author Contributions

G.K. developed the numerical methods and techniques presented in this article. T.R. and D.W. have developed system concepts, research methods, and implementation of solutions in industrial tomography. P.A. conducted research, especially in the field of measuring vest concept. T.C. worked on the preparation of numerical models. S.S. conducted a literature review, formal analysis, general review, and editing of the manuscript. All authors have read and agreed to the published version of the manuscript.

Funding

This research received no external funding.

Conflicts of Interest

The authors declare no conflict of interest.

References

  1. Heron, M. Deaths: Leading Causes for 2017. Natl. Vital Stat. Rep. 2019, 68, 1–77. [Google Scholar]
  2. Nicols, H.; Tavella, V.J. What Are the Leading Causes of Death in the US. Available online: www.medicalnewstoday.com/articles/282929 (accessed on 31 August 2020).
  3. Qiu, H.; Qiu, M.; Lu, Z. Selective encryption on ECG data in body sensor network based on supervised machine learning. Inf. Fus. 2020, 55, 59–67. [Google Scholar] [CrossRef]
  4. Kosinski, T.; Obaid, M.; Wozniak, P.W.; Fjeld, M.; Kucharski, J. A fuzzy data-based model for Human-Robot Proxemics. In Proceedings of the 25th IEEE International Symposium on Robot and Human Interactive Communication, RO-MAN 2016, New York, NY, USA, 26–31 August 2016; pp. 335–340. [Google Scholar]
  5. Rymarczyk, T.; Niderla, K.; Kozłowski, E.; Kłosowski, G.; Tchórzewski, P. The concept of the technological process control using a distributed industrial tomography system. Prz. Elektrotechniczny 2018, 94, 166–169. [Google Scholar] [CrossRef] [Green Version]
  6. Romanowski, A. Big Data-Driven Contextual Processing Methods for Electrical Capacitance Tomography. IEEE Trans. Ind. Inform. 2019, 15, 1609–1618. [Google Scholar] [CrossRef]
  7. Romanowski, A.; Łuczak, P.; Grudzień, K. X-ray Imaging Analysis of Silo Flow Parameters Based on Trace Particles Using Targeted Crowdsourcing. Sensors 2019, 19, 3317. [Google Scholar] [CrossRef] [Green Version]
  8. Fraczyk, A.; Kucharski, J. Surface temperature control of a rotating cylinder heated by moving inductors. Appl. Therm. Eng. 2017, 125, 767–779. [Google Scholar] [CrossRef]
  9. Kłosowski, G.; Rymarczyk, T.; Gola, A. Increasing the Reliability of Flood Embankments with Neural Imaging Method. Appl. Sci. 2018, 8, 1457. [Google Scholar] [CrossRef] [Green Version]
  10. Attia, Z.I.; Noseworthy, P.A.; Lopez-Jimenez, F.; Asirvatham, S.J.; Deshmukh, A.J.; Gersh, B.J.; Carter, R.E.; Yao, X.; Rabinstein, A.A.; Erickson, B.J.; et al. An artificial intelligence-enabled ECG algorithm for the identification of patients with atrial fibrillation during sinus rhythm: A retrospective analysis of outcome prediction. Lancet 2019, 394, 861–867. [Google Scholar] [CrossRef]
  11. Hasan, N.I.; Bhattacharjee, A. Deep Learning Approach to Cardiovascular Disease Classification Employing Modified ECG Signal from Empirical Mode Decomposition. Biomed. Signal Process. Control 2019, 52, 128–140. [Google Scholar] [CrossRef]
  12. Rahman, T.M.; Siddiqua, S.; Rabby, S.E.; Hasan, N.; Imam, M.H. Early detection of kidney disease using ECG signals through machine learning based modelling. In Proceedings of the 1st International Conference on Robotics, Electrical and Signal Processing Techniques (ICREST 2019), Dhaka, Bangladesh, 10–12 January 2019; pp. 319–323. [Google Scholar]
  13. Kim, M.G.; Pan, S.B. Deep Learning Based on 1-D Ensemble Networks Using ECG for Real-Time User Recognition. IEEE Trans. Ind. Inform. 2019, 15, 5656–5663. [Google Scholar] [CrossRef]
  14. Zhao, P.; Quan, D.; Yu, W.; Yang, X.; Fu, X. Towards deep learning-based detection scheme with raw ECG signal for wearable telehealth systems. In Proceedings of the Proceedings—International Conference on Computer Communications and Networks (ICCCN), Valencia, Spain, 29 July–1 August 2019. [Google Scholar]
  15. Zhao, W.; Hu, J.; Jia, D.; Wang, H.; Li, Z.; Yan, C.; You, T. Deep Learning Based Patient-Specific Classification of Arrhythmia on ECG signal. In Proceedings of the Annual International Conference of the IEEE Engineering in Medicine and Biology Society (EMBS), Berlin, Germany, 23–27 July 2019; pp. 1500–1503. [Google Scholar]
  16. Isasi, I.; Irusta, U.; Elola, A.; Aramendi, E.; Eftestol, T.; Kramer-Johansen, J.; Wik, L. A Robust Machine Learning Architecture for a Reliable ECG Rhythm Analysis during CPR. In Proceedings of the Annual International Conference of the IEEE Engineering in Medicine and Biology Society (EMBS), Berlin, Germany, 23–27 July 2019; pp. 1903–1907. [Google Scholar]
  17. Janghel, R.R.; Pandey, S. kumar Classification and Detection of Arrhythmia in ECG Signal Using Machine Learning Techniques. In Proceedings of the 2019 16th International Conference on Electrical Engineering/Electronics, Computer, Telecommunications and Information Technology (ECTI-CON), Pattaya, Thailand, 10–13 July 2019; pp. 101–104. [Google Scholar]
  18. Abdeldayem, S.S.; Bourlai, T. A Novel Approach for ECG-based Human Identification using Spectral Correlation and Deep Learning. IEEE Trans. Biom. Behav. Identity Sci. 2019, 2, 1–14. [Google Scholar] [CrossRef]
  19. Yıldırım, Ö.; Pławiak, P.; Tan, R.S.; Acharya, U.R. Arrhythmia detection using deep convolutional neural network with long duration ECG signals. Comput. Biol. Med. 2018, 102, 411–420. [Google Scholar] [CrossRef] [PubMed]
  20. Izci, E.; Ozdemir, M.A.; Degirmenci, M.; Akan, A. Cardiac arrhythmia detection from 2d ecg images by using deep learning technique. In Proceedings of the TIPTEKNO 2019—Tip Teknolojileri Kongresi, Izmir, Turkey, 3–5 October 2019. [Google Scholar]
  21. Hermawan, I.; Anwar Ma’sum, M.A.; Riskyana Dewi Intan, P.; Jatmiko, W.; Wiweko, B.; Boediman, A.; Pradekso, B.K. Temporal feature and heuristics-based Noise Detection over Classical Machine Learning for ECG Signal Quality Assessment. In Proceedings of the 2019 International Workshop on Big Data and Information Security (IWBIS 2019), Nusa Dua, Indonesia, 11 October 2019; pp. 1–8. [Google Scholar]
  22. Porumb, M.; Stranges, S.; Pescapè, A.; Pecchia, L. Precision Medicine and Artificial Intelligence: A Pilot Study on Deep Learning for Hypoglycemic Events Detection based on ECG. Sci. Rep. 2020, 10, 170. [Google Scholar] [CrossRef] [PubMed] [Green Version]
  23. Sheen, Y.T. 3D spectral analysis for vibration signals by wavelet-based demodulation. Mech. Syst. Signal Process. 2006, 20, 843–853. [Google Scholar] [CrossRef]
  24. Diker, A.; Avci, D.; Avci, E.; Gedikpinar, M. A new technique for ECG signal classification genetic algorithm Wavelet Kernel extreme learning machine. Optik 2019, 180, 46–55. [Google Scholar] [CrossRef]
  25. Lynn, H.M.; Pan, S.B.; Kim, P. A Deep Bidirectional GRU Network Model for Biometric Electrocardiogram Classification Based on Recurrent Neural Networks. IEEE Access 2019, 7, 145395–145405. [Google Scholar] [CrossRef]
  26. Salem, M.; Taheri, S.; Yuan, J.S. ECG Arrhythmia Classification Using Transfer Learning from 2- Dimensional Deep CNN Features. In Proceedings of the 2018 IEEE Biomedical Circuits and Systems Conference, BioCAS 2018—Proceedings, Cleveland, OH, USA, 17–19 October 2018. [Google Scholar]
  27. Zhu, H.; Cheng, C.; Yin, H.; Li, X.; Zuo, P.; Ding, J.; Lin, F.; Wang, J.; Zhou, B.; Li, Y.; et al. Automatic multilabel electrocardiogram diagnosis of heart rhythm or conduction abnormalities with deep learning: A cohort study. Lancet Digital Health 2020, 2, e348–e357. [Google Scholar] [CrossRef]
  28. Hochreiter, S.; Schmidhuber, J. Long Short-Term Memory. Neural Comput. 1997, 9, 1735–1780. [Google Scholar] [CrossRef]
  29. Werth, J.; Radha, M.; Andriessen, P.; Aarts, R.M.; Long, X. Deep learning approach for ECG-based automatic sleep state classification in preterm infants. Biomed. Signal Process. Control 2020, 56, 101663. [Google Scholar] [CrossRef]
  30. Yildirim, Ö. A novel wavelet sequences based on deep bidirectional LSTM network model for ECG signal classification. Comput. Biol. Med. 2018, 96, 189–202. [Google Scholar] [CrossRef]
  31. Chen, Y.J.; Liu, C.L.; Tseng, V.S.; Hu, Y.F.; Chen, S.A. Large-scale classification of 12-lead ECG with deep learning. In Proceedings of the 2019 IEEE EMBS International Conference on Biomedical and Health Informatics, BHI 2019—Proceedings, Chicago, IL, USA, 19–22 May 2019. [Google Scholar]
  32. Zihlmann, M.; Perekrestenko, D.; Tschannen, M. Convolutional recurrent neural networks for electrocardiogram classification. In Proceedings of the Computing in Cardiology, Rennes, France, 24–27 September 2017; Volume 44, pp. 1–4. [Google Scholar]
  33. Attia, Z.I.; Kapa, S.; Lopez-Jimenez, F.; McKie, P.M.; Ladewig, D.J.; Satam, G.; Pellikka, P.A.; Enriquez-Sarano, M.; Noseworthy, P.A.; Munger, T.M.; et al. Screening for cardiac contractile dysfunction using an artificial intelligence–enabled electrocardiogram. Nat. Med. 2019, 25, 70–74. [Google Scholar] [CrossRef] [PubMed]
  34. Berger, R.D.; Kasper, E.K.; Baughman, K.L.; Marban, E.; Calkins, H.; Tomaselli, G.F. Beat-to-beat QT interval variability: Novel evidence for repolarization lability in ischemic and nonischemic dilated cardiomyopathy. Circulation 1997, 96, 1557–1565. [Google Scholar] [CrossRef]
  35. Moskalenko, V.; Zolotykh, N.; Osipov, G. Deep learning for ECG segmentation. In Proceedings of the Studies in Computational Intelligence; Springer: Berlin/Heidelberg, Germany, 2020; Volume 856, pp. 246–254. [Google Scholar]
  36. Jeong, Y.-S.; Kang, A.R.; Jung, W.; Lee, S.J.; Lee, S.; Lee, M.; Chung, Y.H.; Koo, B.S.; Kim, S.H. Prediction of Blood Pressure after Induction of Anesthesia Using Deep Learning: A Feasibility Study. Appl. Sci. 2019, 9, 5135. [Google Scholar] [CrossRef] [Green Version]
  37. Arsene, C.T.C.; Hankins, R.; Yin, H. Deep learning models for denoising ECG signals. In Proceedings of the European Signal Processing Conference; European Signal Processing Conference, EUSIPCO, Coruña, Spain, 2–6 September 2019; Volume 2019. [Google Scholar]
  38. Ramya, E.; Prabha, R.; Jayageetha, J.; Keerthana, M.; Swetha, S.; Lakshmi, N. Envisaging Ventricular Arrhythmia from an ECG by Using Machine learning algorithm. In Proceedings of the 2019 5th International Conference on Advanced Computing and Communication Systems (ICACCS 2019), Tamil Nadu, India, 15–16 December 2019; pp. 991–994. [Google Scholar]
  39. Mostayed, A.; Luo, J.; Shu, X.; Wee, W. Classification of 12-Lead ECG Signals with Bi-Directional LSTM Network. Available online: http://arxiv.org/abs/1811.02090 (accessed on 2 February 2020).
  40. Saadatnejad, S.; Oveisi, M.; Hashemi, M. LSTM-Based ECG Classification for Continuous Monitoring on Personal Wearable Devices. IEEE J. Biomed. Heal. Inform. 2019, 24, 515–523. [Google Scholar] [CrossRef] [PubMed] [Green Version]
  41. Gao, J.; Zhang, H.; Lu, P.; Wang, Z. An Effective LSTM Recurrent Network to Detect Arrhythmia on Imbalanced ECG Dataset. J. Healthc. Eng. 2019, 2019, 10. [Google Scholar] [CrossRef] [PubMed] [Green Version]
  42. Verma, D.; Agarwal, S. Cardiac Arrhythmia Detection from Single-lead ECG using CNN and LSTM assisted by Oversampling. In Proceedings of the 2018 International Conference on Advances in Computing, Communications and Informatics (ICACCI 2018), Bangalore, India, 19–22 September 2018; pp. 14–17. [Google Scholar]
  43. Chang, Y.C.; Wu, S.H.; Tseng, L.M.; Chao, H.L.; Ko, C.H. AF Detection by Exploiting the Spectral and Temporal Characteristics of ECG Signals with the LSTM Model. In Proceedings of the Computing in Cardiology, Maastricht, Netherlands, 23–26 September 2018. [Google Scholar]
  44. Yuen, B.; Dong, X.; Lu, T. Inter-Patient CNN-LSTM for QRS Complex Detection in Noisy ECG Signals. IEEE Access 2019, 7, 169359–169370. [Google Scholar] [CrossRef]
  45. Beale, M.H.; Hagan, M.T.; Demuth, H.B. Deep Learning Toolbox User’s Guide; The Mathworks Inc.: Herborn, MA, USA, 2018. [Google Scholar]
  46. Glorot, X.; Yoshua, B. Understanding the difficulty of training deep feedfor-ward neural networks. In Proceedings of the Thirteenth International Conference on artificial intelligence and statistics, Sardinia, Italy, 13 May 2010; pp. 249–256. [Google Scholar]
  47. Kingma, D.P.; Ba, J.L. Adam: A method for stochastic optimization. In Proceedings of the 3rd International Conference on Learning Representations, ICLR 2015—Conference Track Proceedings. International Conference on Learning Representations, San Diego, CA, USA, 7–9 May 2015. [Google Scholar]
  48. Mathworks. Signal Processing Toolbox User’s Guide; Mathworks Inc.: Natick, MA, USA, 2019. [Google Scholar]
  49. Sharma, V.; Parey, A. A Review of Gear Fault Diagnosis Using Various Condition Indicators. Procedia Engineering; Elsevier Ltd.: Amsterdam, The Netherlands, 2016; Volume 144, pp. 253–263. [Google Scholar]
  50. Kłosowski, G.; Rymarczyk, T.; Kania, K.; Świć, A.; Cieplak, T. Maintenance of industrial reactors supported by deep learning driven ultrasound tomography. Eksploat. i Niezawodn. Maint. Reliab. 2020, 22, 138–147. [Google Scholar] [CrossRef]
  51. Korzeniewska, E.; Krawczyk, A.; Mróz, J.; Wyszyńska, E.; Zawiślak, R. Applications of smart textiles in post-stroke rehabilitation. Sensors 2020, 20, 2370. [Google Scholar] [CrossRef] [Green Version]
  52. Korzeniewska, E.; Krawczyk, A. Applications of smart textiles in electromedicine. In Proceedings of the 2019 19th International Symposium on Electromagnetic Fields in Mechatronics, Electrical and Electronic Engineering (ISEF 2019), Nancy, France, 29–31 August 2019; Institute of Electrical and Electronics Engineers Inc.: Nancy, France, 2019; pp. 1–2. [Google Scholar]
  53. Rymarczyk, T.; Kłosowski, G. Innovative methods of neural reconstruction for tomographic images in maintenance of tank industrial reactors. Eksploat. i Niezawodn. Maint. Reliab. 2019, 21, 261–267. [Google Scholar] [CrossRef]
  54. Romanowski, A. Contextual Processing of Electrical Capacitance Tomography Measurement Data for Temporal Modeling of Pneumatic Conveying Process. In Proceedings of the 2018 Federated Conference on Computer Science and Information Systems (FedCSIS), Poznań, Poland, 9–12 September 2018; pp. 283–286. [Google Scholar]
  55. Wajman, R.; Fiderek, P.; Fidos, H.; Jaworski, T.; Nowakowski, J.; Sankowski, D.; Banasiak, R. Metrological evaluation of a 3D electrical capacitance tomography measurement system for two-phase flow fraction determination. Meas. Sci. Technol. 2013, 24, 065302. [Google Scholar] [CrossRef]
  56. Kozłowski, E.; Mazurkiewicz, D.; Kowalska, B.; Kowalski, D. Binary Linear Programming as a Decision-Making Aid for Water Intake Operators; Springer: Cham, Switzerland, 2018; pp. 199–208. [Google Scholar]
  57. Vališ, D.; Mazurkiewicz, D. Application of selected Levy processes for degradation modelling of long range mine belt using real-time data. Arch. Civ. Mech. Eng. 2018, 18, 1430–1440. [Google Scholar] [CrossRef]
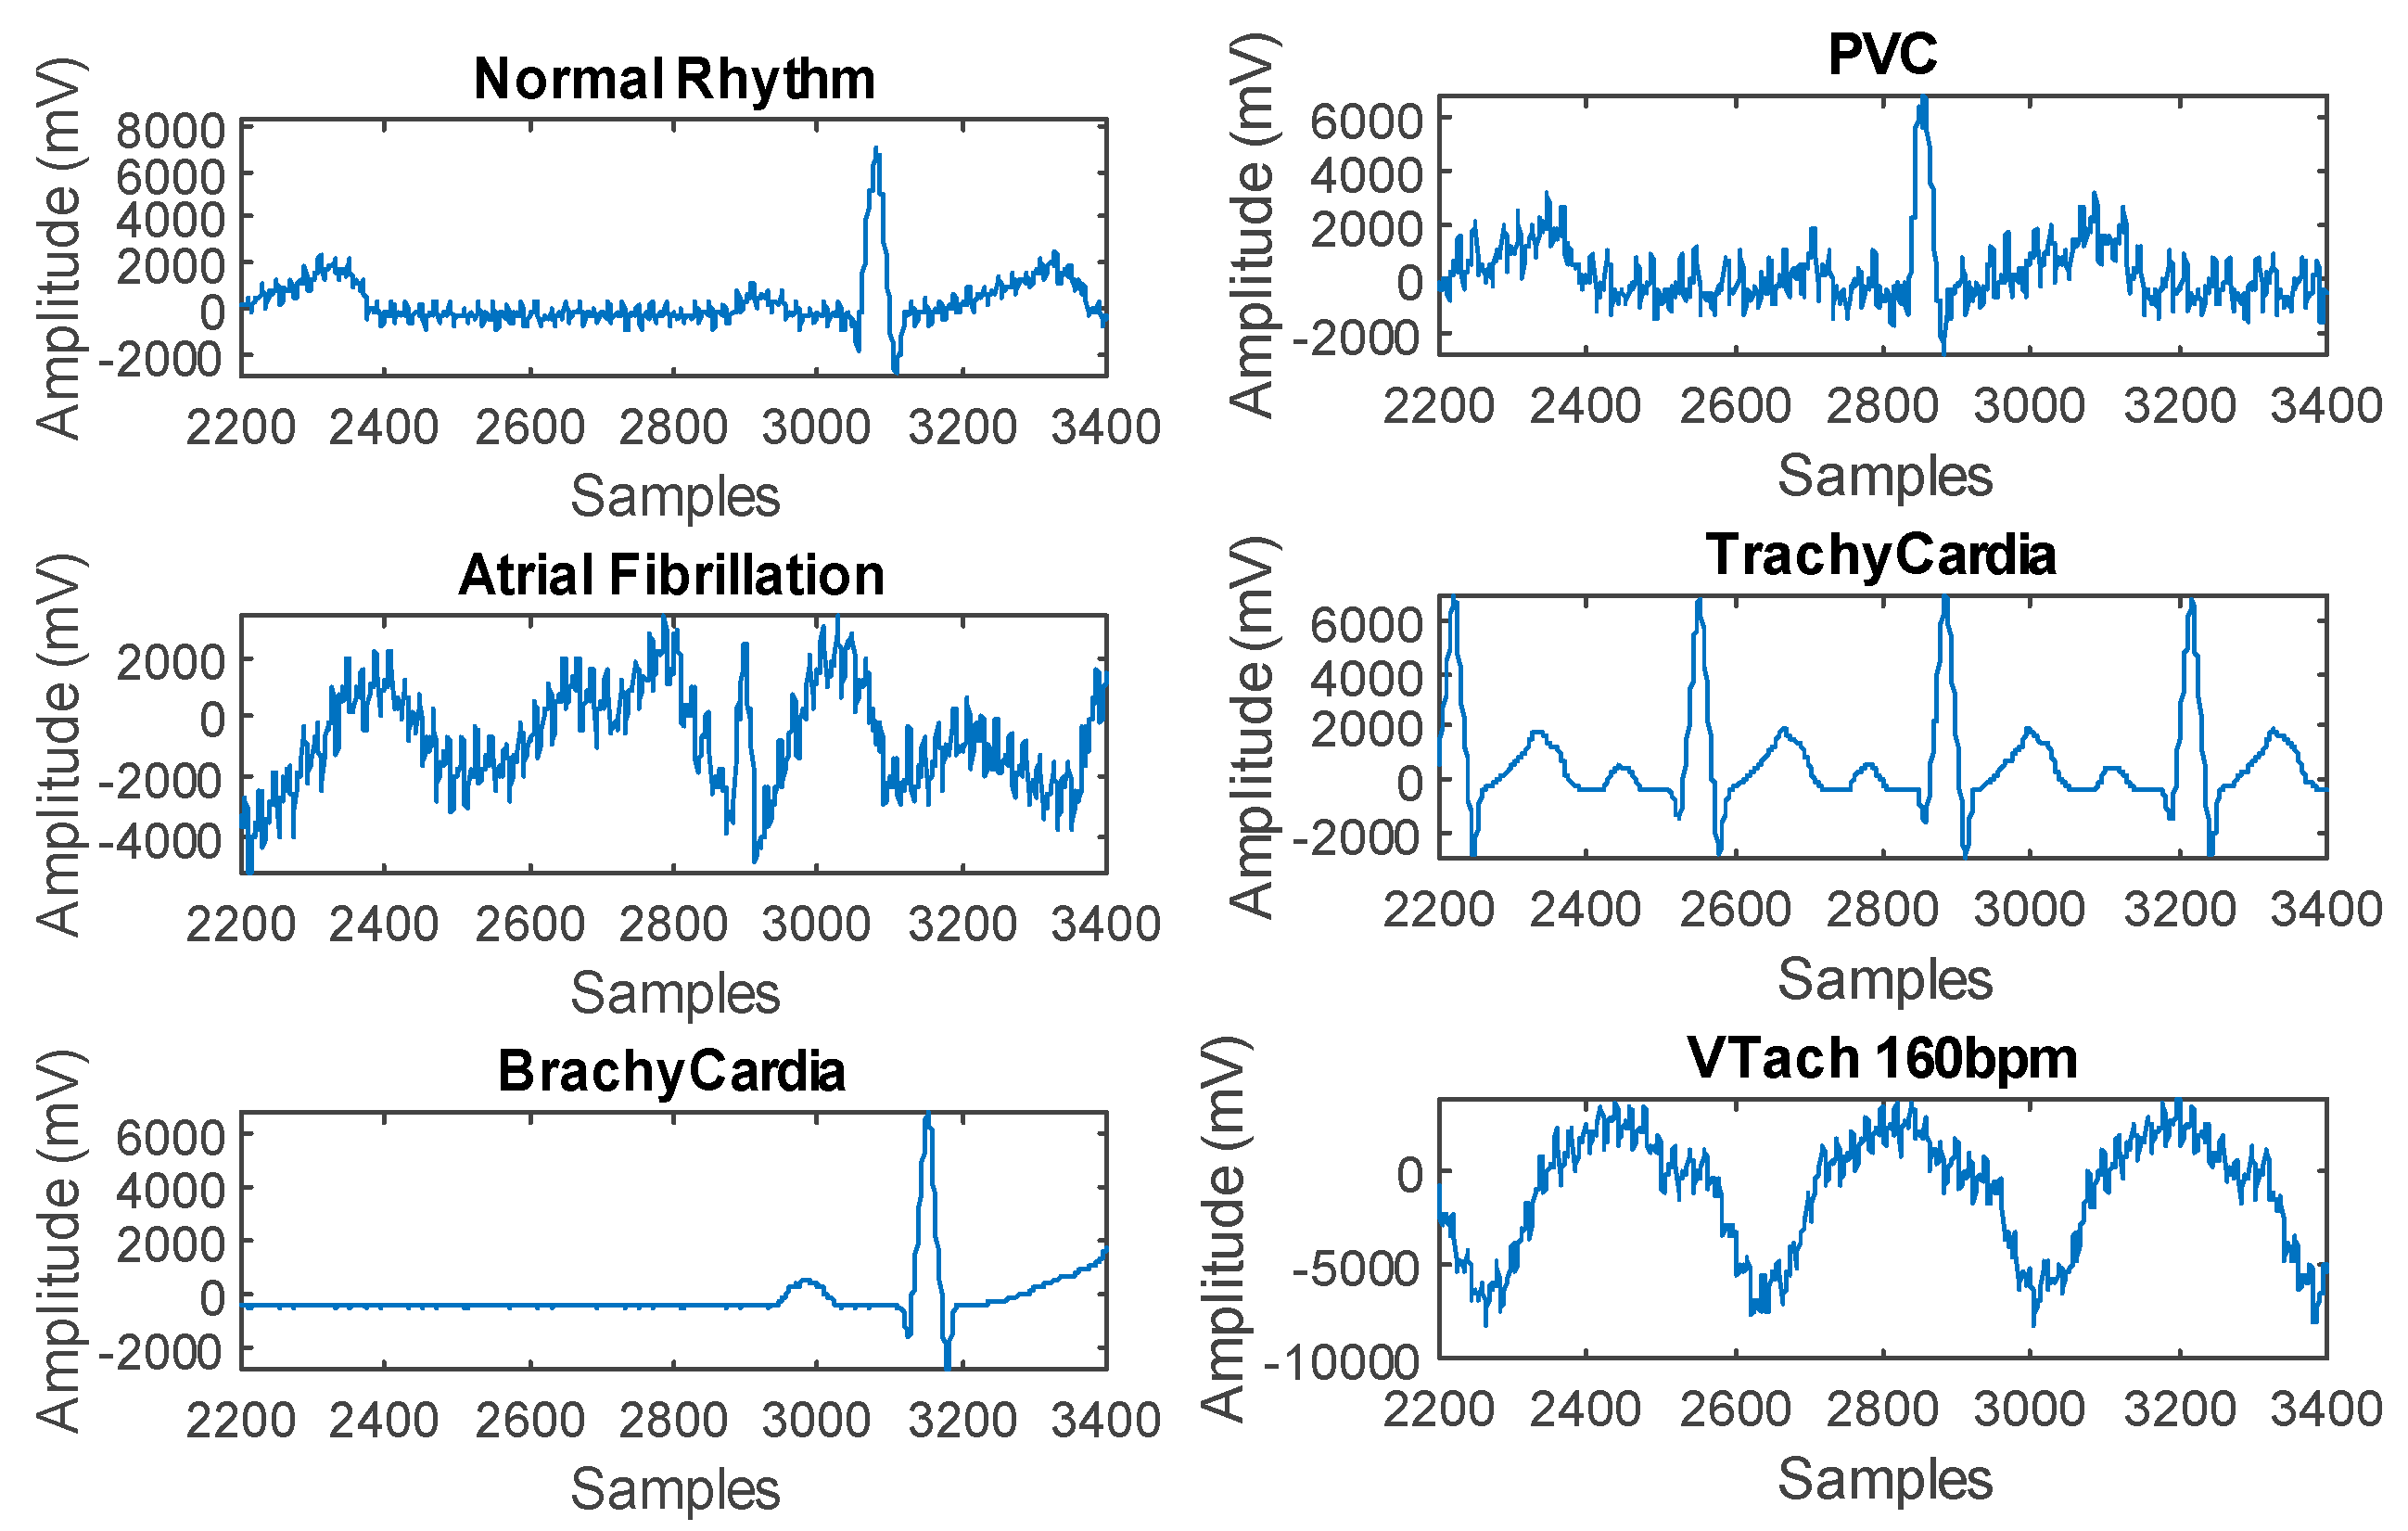
Figure 1. Examples of ECG signal waveforms.
Electronics 09 01452 g001
Figure 2. LSTM network structure.
Electronics 09 01452 g002
Figure 3. ECG signal spectrograms.
Electronics 09 01452 g003
Figure 4. Instantaneous frequency (IF) visualization for each type of ECG signal.
Electronics 09 01452 g004
Figure 5. Spectral entropy (SE) visualization for each type of ECG signal.
Electronics 09 01452 g005
Figure 6. Training accuracy for LSTM with a raw input.
Electronics 09 01452 g006
Figure 7. Training loss for LSTM with a raw input.
Electronics 09 01452 g007
Figure 8. Confusion matrix for the training set of the LSTM with a raw ECG signal.
Electronics 09 01452 g008
Figure 9. Confusion matrix for the testing set of the LSTM with a raw ECG signal.
Electronics 09 01452 g009
Figure 10. Training accuracy for LSTM with spectral inputs.
Electronics 09 01452 g010
Figure 11. Testing accuracy for LSTM with spectral inputs.
Electronics 09 01452 g011
Figure 12. Confusion matrix for the training set of the LSTM with a double spectral ECG signal.
Electronics 09 01452 g012
Figure 13. Confusion matrix for the testing set of the LSTM with a double spectral ECG signal.
Electronics 09 01452 g013
Figure 14. The external appearance of the measuring vest. Nap elements and thin shielded cables are visible, which are hidden in sewn channels.
Electronics 09 01452 g014
Figure 15. Model of a textile measuring electrode.
Electronics 09 01452 g015
Figure 16. ECG signal waveform of volunteer No. 1.
Electronics 09 01452 g016
Figure 17. ECG signal spectrogram of volunteer No. 1.
Electronics 09 01452 g017
Figure 18. Spectral entropy (SE) for ECG signal of volunteer No. 1.
Electronics 09 01452 g018
Figure 19. Instantaneous frequency (IF) for ECG signal of volunteer No. 1.
Electronics 09 01452 g019
Table 1. Comparison of electrocardiogram (ECG) signal classification methods.
AuthorsFeature Extraction MethodsClassification ModelsMaximum Accuracy Obtained (%)
Chen et al., 2019 [31]No feature extraction - raw dataConvolutional Neural Network + Long Short-Term Memory (LSTM)81.0
Zihlmann, Perekrestenko, and Tschannen, 2017 [32]Logarithmic TransformLong Short Term Memory82.3
Attia et al., 2019 [33]No feature extraction - raw dataConvolutional Neural Network83.3
P. Zhao et al., 2019 [14]Wavelet transforms using a db3 wavelet filterConvolutional Neural Network87.8
Diker et al., 2019 [24]Morphological and statistical featuresExtreme Learning Machine95
Qiu, Qiu and Lu, 2020 [3]Auto-Regressive model coefficients, Shannon Entropy values, and Multi- Fractal Wavelet Leader EstimationSupport Vector Machine96.3
Isasi et al., 2019 [16]Stationary Wavelet TransformArtificial Neural Network, Support Vector Machine, Kernel Logistic Regression, Boosting of Decision Trees96.7
Salem, Taheri, and Yuan, 2018 [26]Fourier Transform SpectrogramsLong Short Term Memory97.2
Rahman et al., 2019 [12]QT interval and the RR interval extracted using Berger’s algorithm [34]Support Vector Machine97.6
W. Zhao et al., 2019 [15]Wavelet Transform and Independent Component AnalysisConvolutional Neural Network98.6
Yildirim Özal, 2018 [30]Daubechies dB6 wavelet member of the wavelet familyLong Short Term Memory99.4
Hasan and Bhattacharjee, 2019 [11]Empirical Mode Decomposition and higher order Intrinsic Mode FunctionsConvolutional Neural Network99.7
Moskalenko, Zolotykh, and Osipov, 2020 [35]Cubic SplineUNet-like full-convolutional neural network99.9
Kim and Pan, 2019 [13]Multi-Layer Perceptron (MLP) layerConvolutional Neural Network, 1-D Ensemble Network100
Abdeldayem and Bourlai, 2019 [18]Cyclic Autocorrelation, Spectral CorrelationConvolutional Neural Network100
Proposed MethodInstantaneous Frequency and Spectral EntropyLong Short Term Memory100
Table 2. Layers of LSTM for raw ECG signals processing.
Cardiac DysfunctionsThe Original Number of SignalsThe Number of Signals After Leveling
TrainingTesting
AFib600108060
Brachycardia60108060
Normal ECG1140108060
Premature ventricular contraction (PVC)600108060
Trachycardia121108060
VTach 160 bpm600108060
Table 3. Layers of LSTM for raw ECG signals processing.
#Layer DescriptionActivationsLearnable Parameters (Weights and Biases)
1Sequence input with 1 dimension1-
2BiLSTM with 200 hidden units400Input weights: 1600 × 1; Recurrent Weights: 1600 × 200; Bias: 1600 × 1
3Fully connected layer6Weights: 6 × 400; Bias: 6 × 1
4Softmax6-
5Classification output (cross entropy)--
Table 4. Layers of LSTM after feature extraction.
#Layer DescriptionActivationsLearnable Parameters (Weights and Biases)
1Sequence input with two dimensions2-
2BiLSTM with 200 hidden units400Input weights: 1600 × 2, Recurrent Weights: 1600 × 200, Bias: 1600 × 1
3Fully connected layer6Weights: 6 × 400, Bias: 6 × 1
4Softmax6-
5Classification output (crossentropy)--
Table 5. The results of the LSTM network classification.
ECG Signal CategoriesProbability (%)
Volunteer No. 1Volunteer No. 2
AFib 3.52 · 10 8 3.24 · 10 3
Brachycardia 2.19 · 10 12 1.80 · 10 5
Normal ECG 7.45 · 10 3 99.15
PVC 99.9 0.0083
Trachycardia 1.55 · 10 9 3.52 · 10 4
VTach 160 bpm 1.65 · 10 6 1.62 · 10 2