End-To-End Deep Learning Framework for Coronavirus (COVID-19) Detection and Monitoring

 ,
, 
 ,
,
Abstract
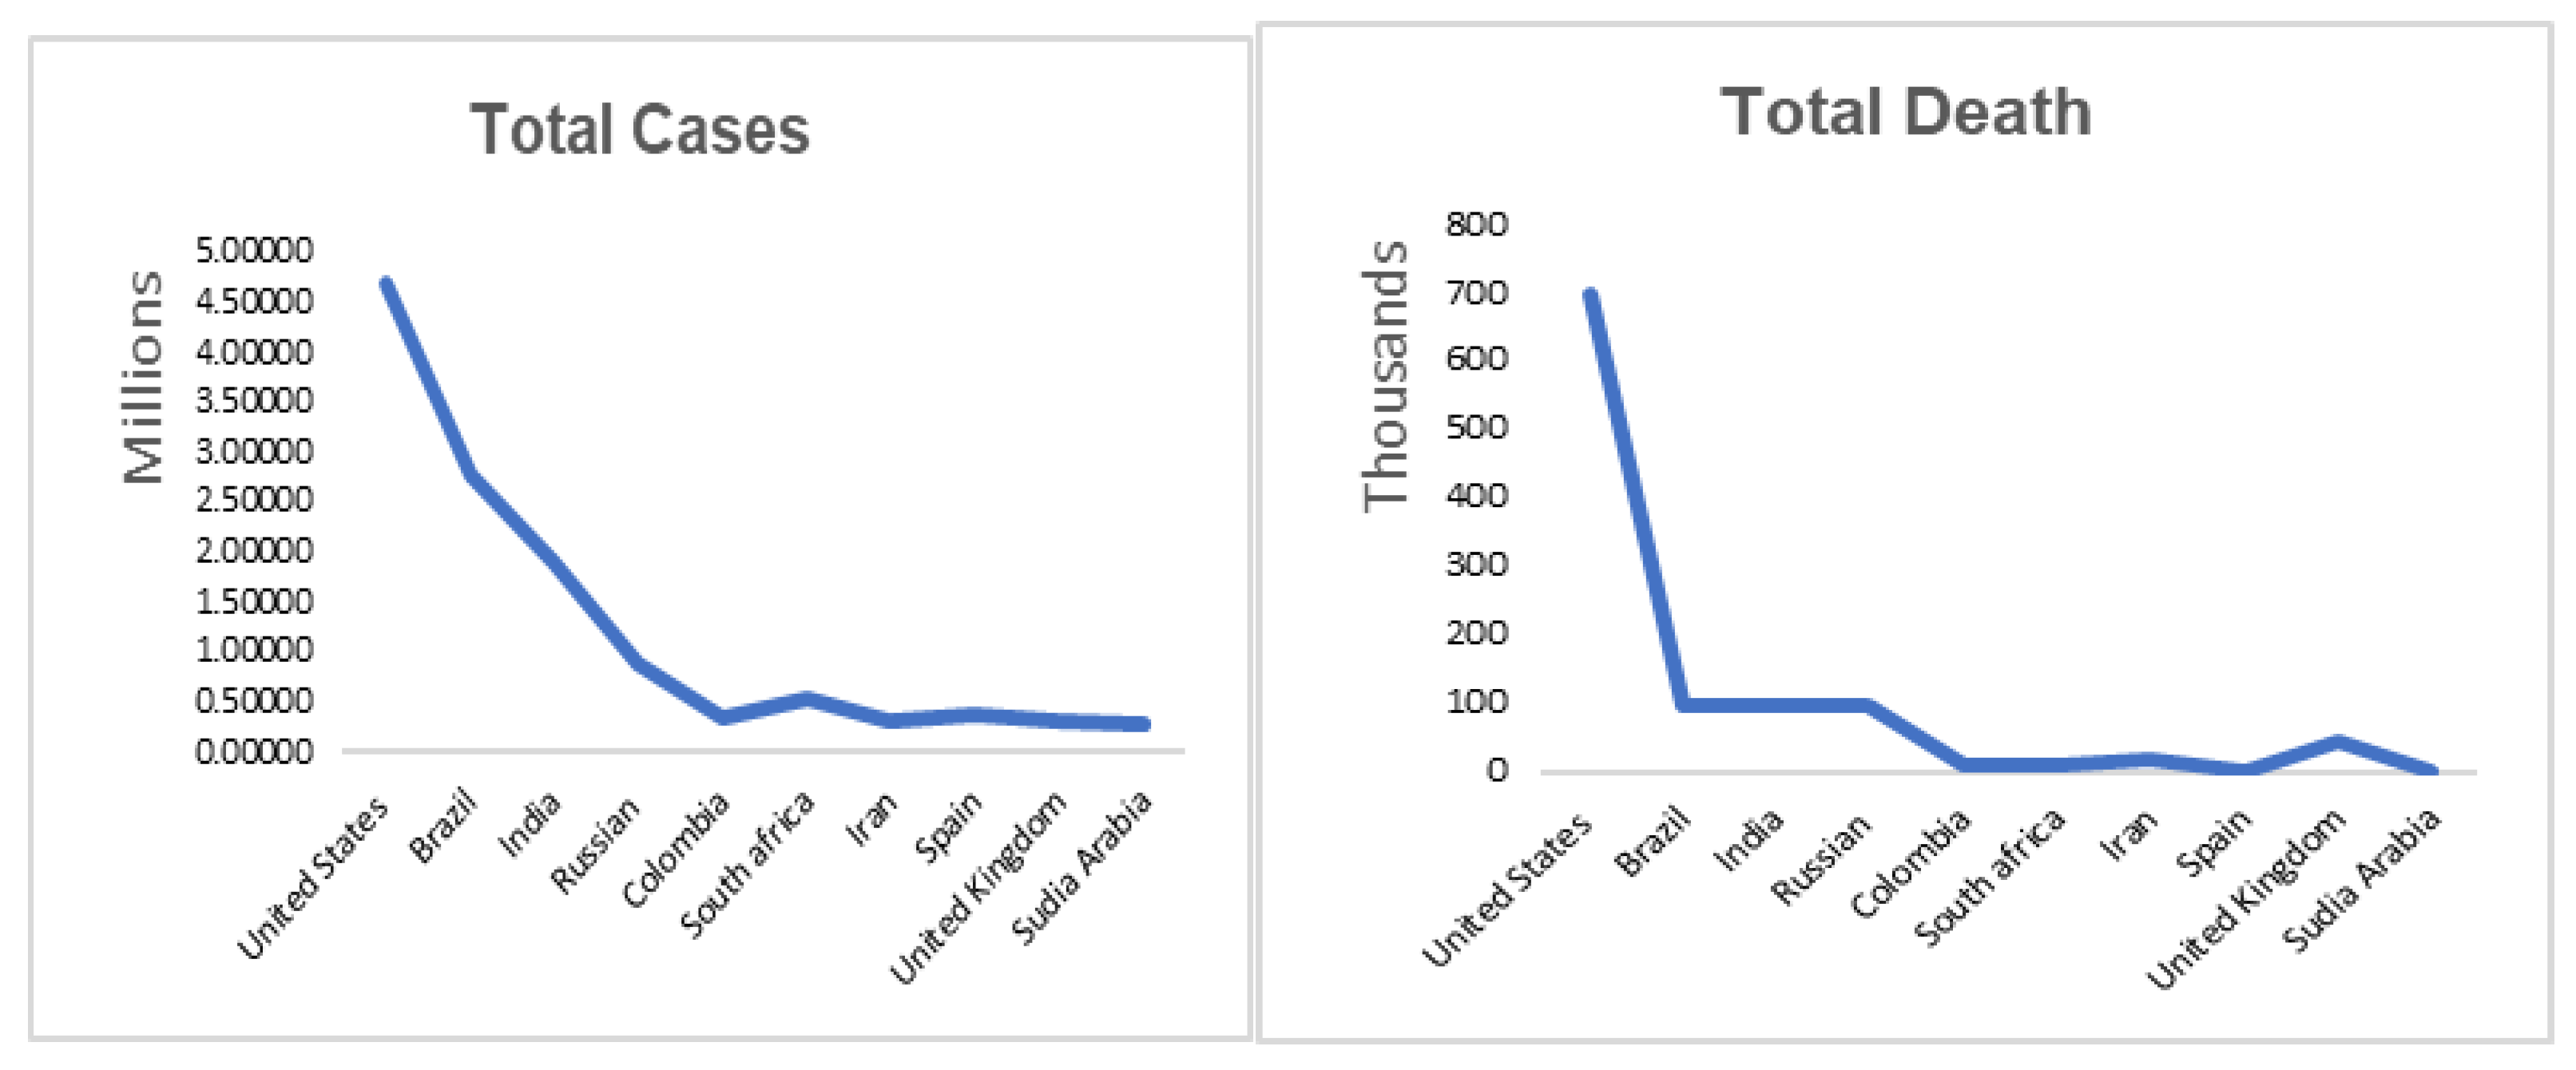
1. Introduction
- (a)
- This is the first work that provides an end-to-end (E2E) deep-learning-assisted communication framework for COVID-19 disease management.
- (b)
- It provides a monitoring system that could limit the spread of infection through the continuous monitoring for all suspected and infected patients.
- (c)
- The proposed scheme is the first attempt in the COVID-19 domain that integrates both fog and cloud computing paradigms to solve the problems related to power consumption, transmission issues, data analysis, etc.
- (d)
- Unlike existing works, the present work focuses on building complete data from patients’ data, to help clinicians in diagnosis.
- (e)
- The proposed classification model could detect and classify COVID-19 patients based on the chest X-ray images with promising results.
2. Related Work
2.1. COVID-19 Pandemic
2.2. Healthcare Monitoring Systems
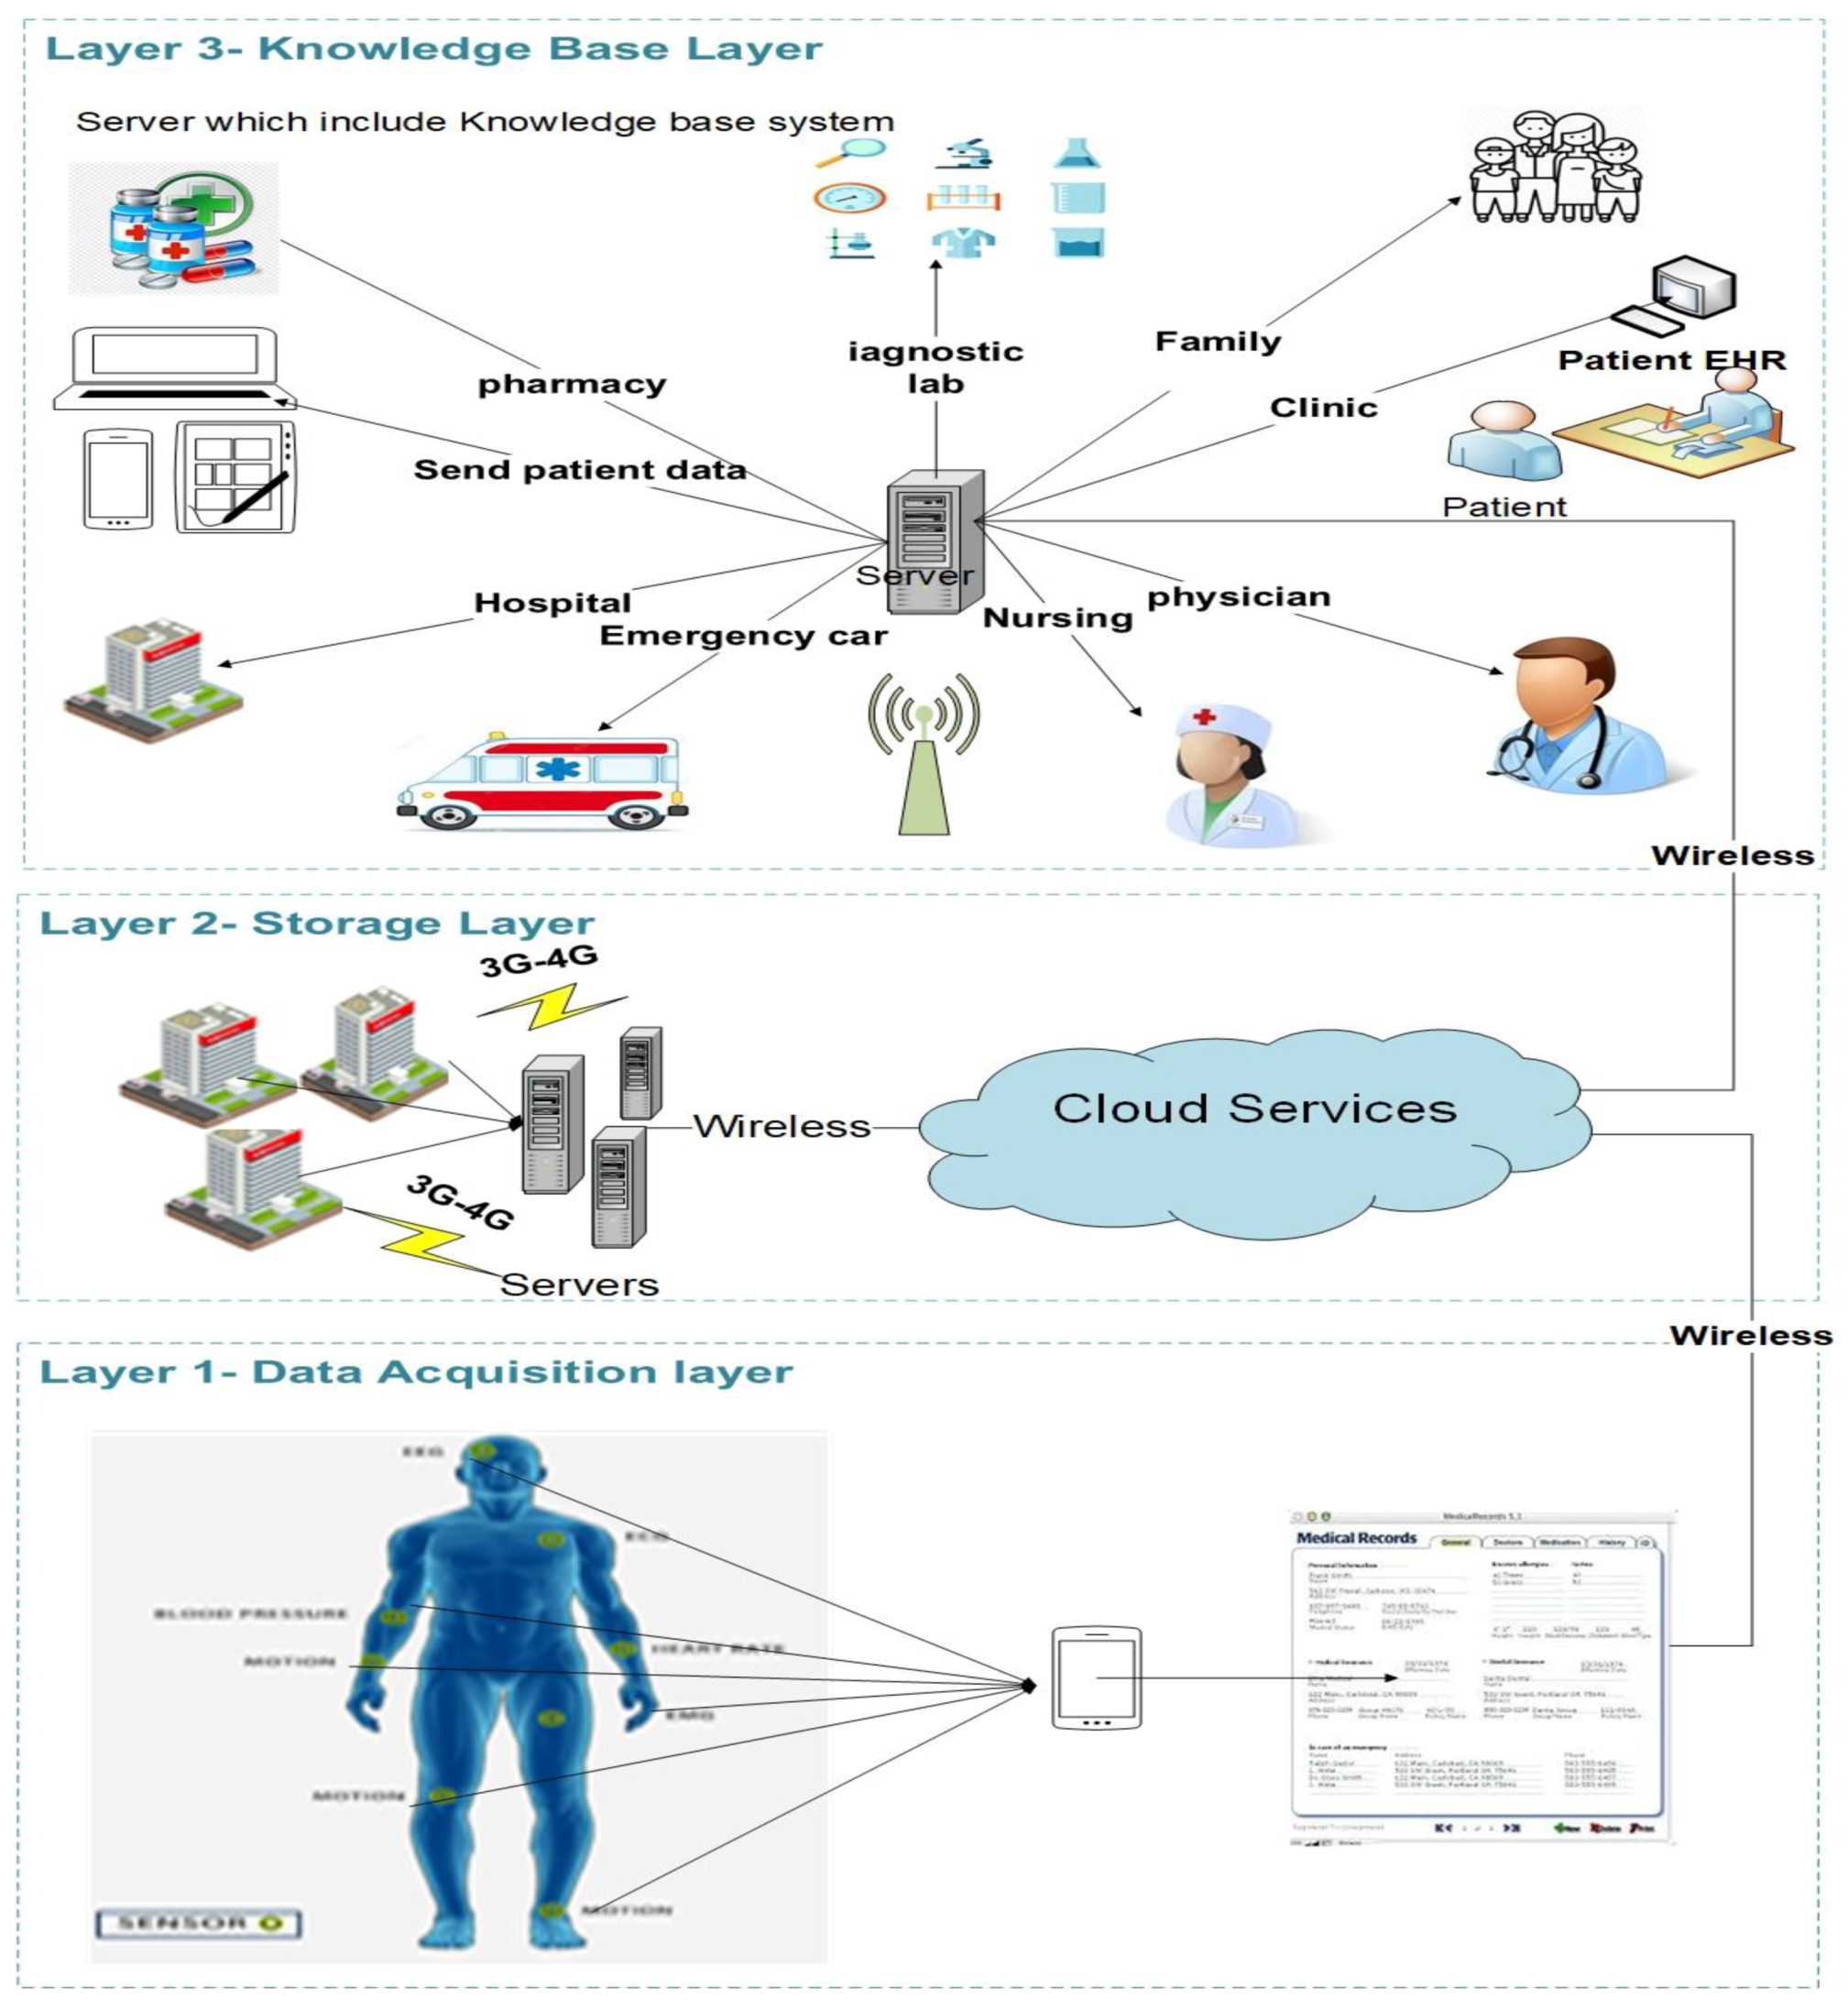
3. The General Architecture of RPMS
3.1. Data-Acquisition Layer
3.2. Storage Layer
3.2.1. Cloud Computing
3.2.2. Fog Computing
- Data processed and analyzed locally instead of sending them to the cloud; this led to the consumption of less bandwidth and decreased the overall costs [53].
- Processing data locally decreased the time-latency during transmission, which helps to avoid problems especially for time-sensitive applications (e.g., real-time monitoring, self-driving car, etc.).
- Providing better privacy to users, as patient’s data can be analyzed locally instead of sending them to the cloud.
- Deploying fog servers in RPMS decreased the required bandwidth for transmission, providing real-time data to doctors, without the need for an internet connection [54].
- Saves on power consumption while continuously transmitting to cloud servers [55].
3.3. Backend Layer
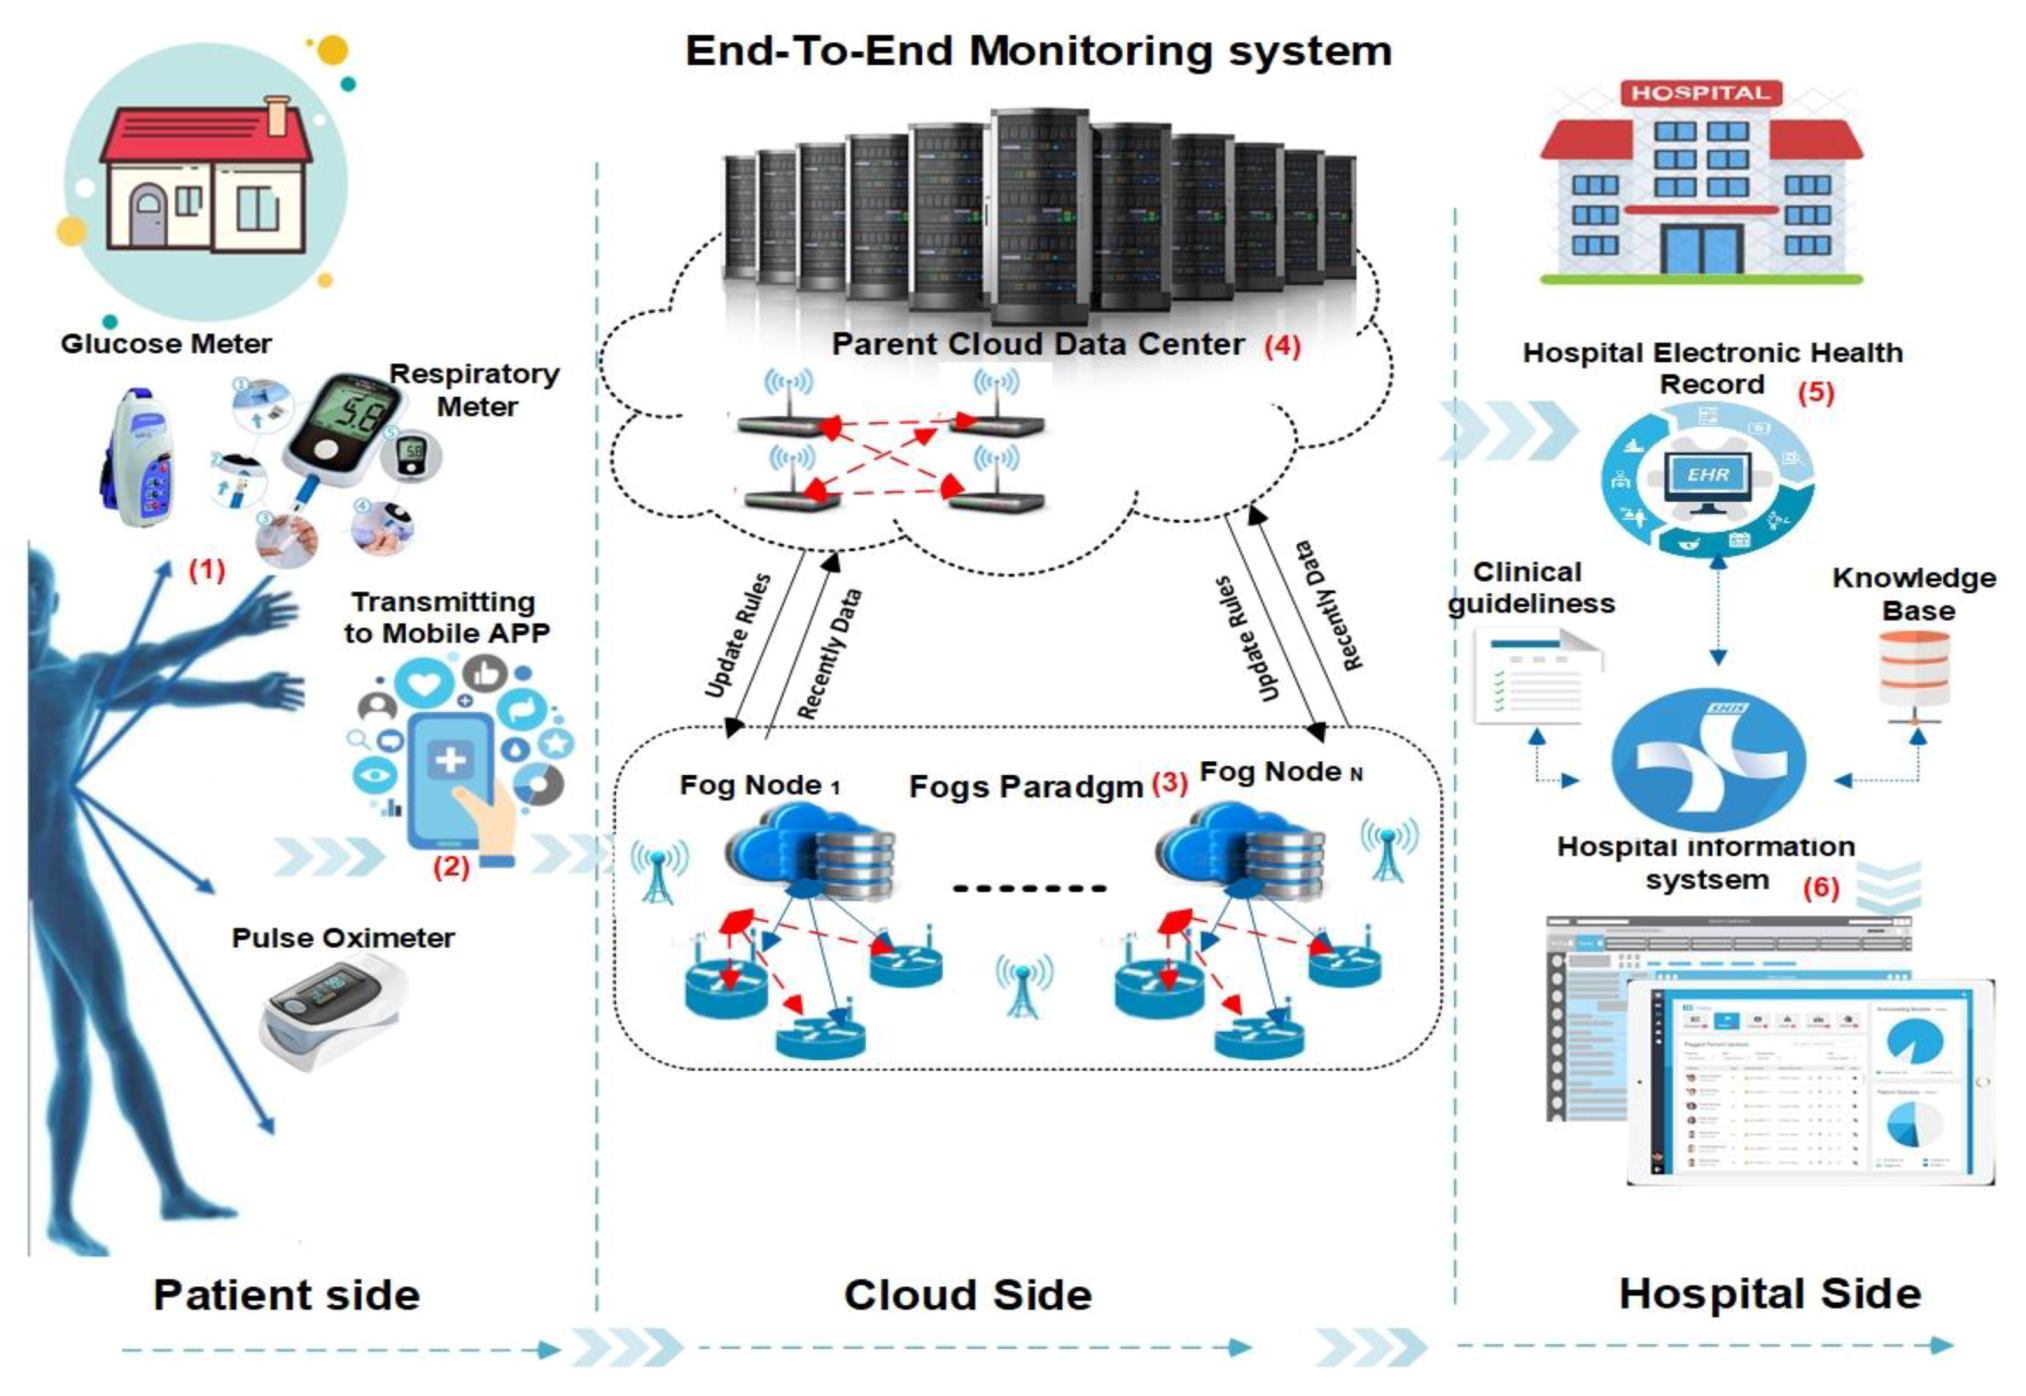
4. The Proposed Framework
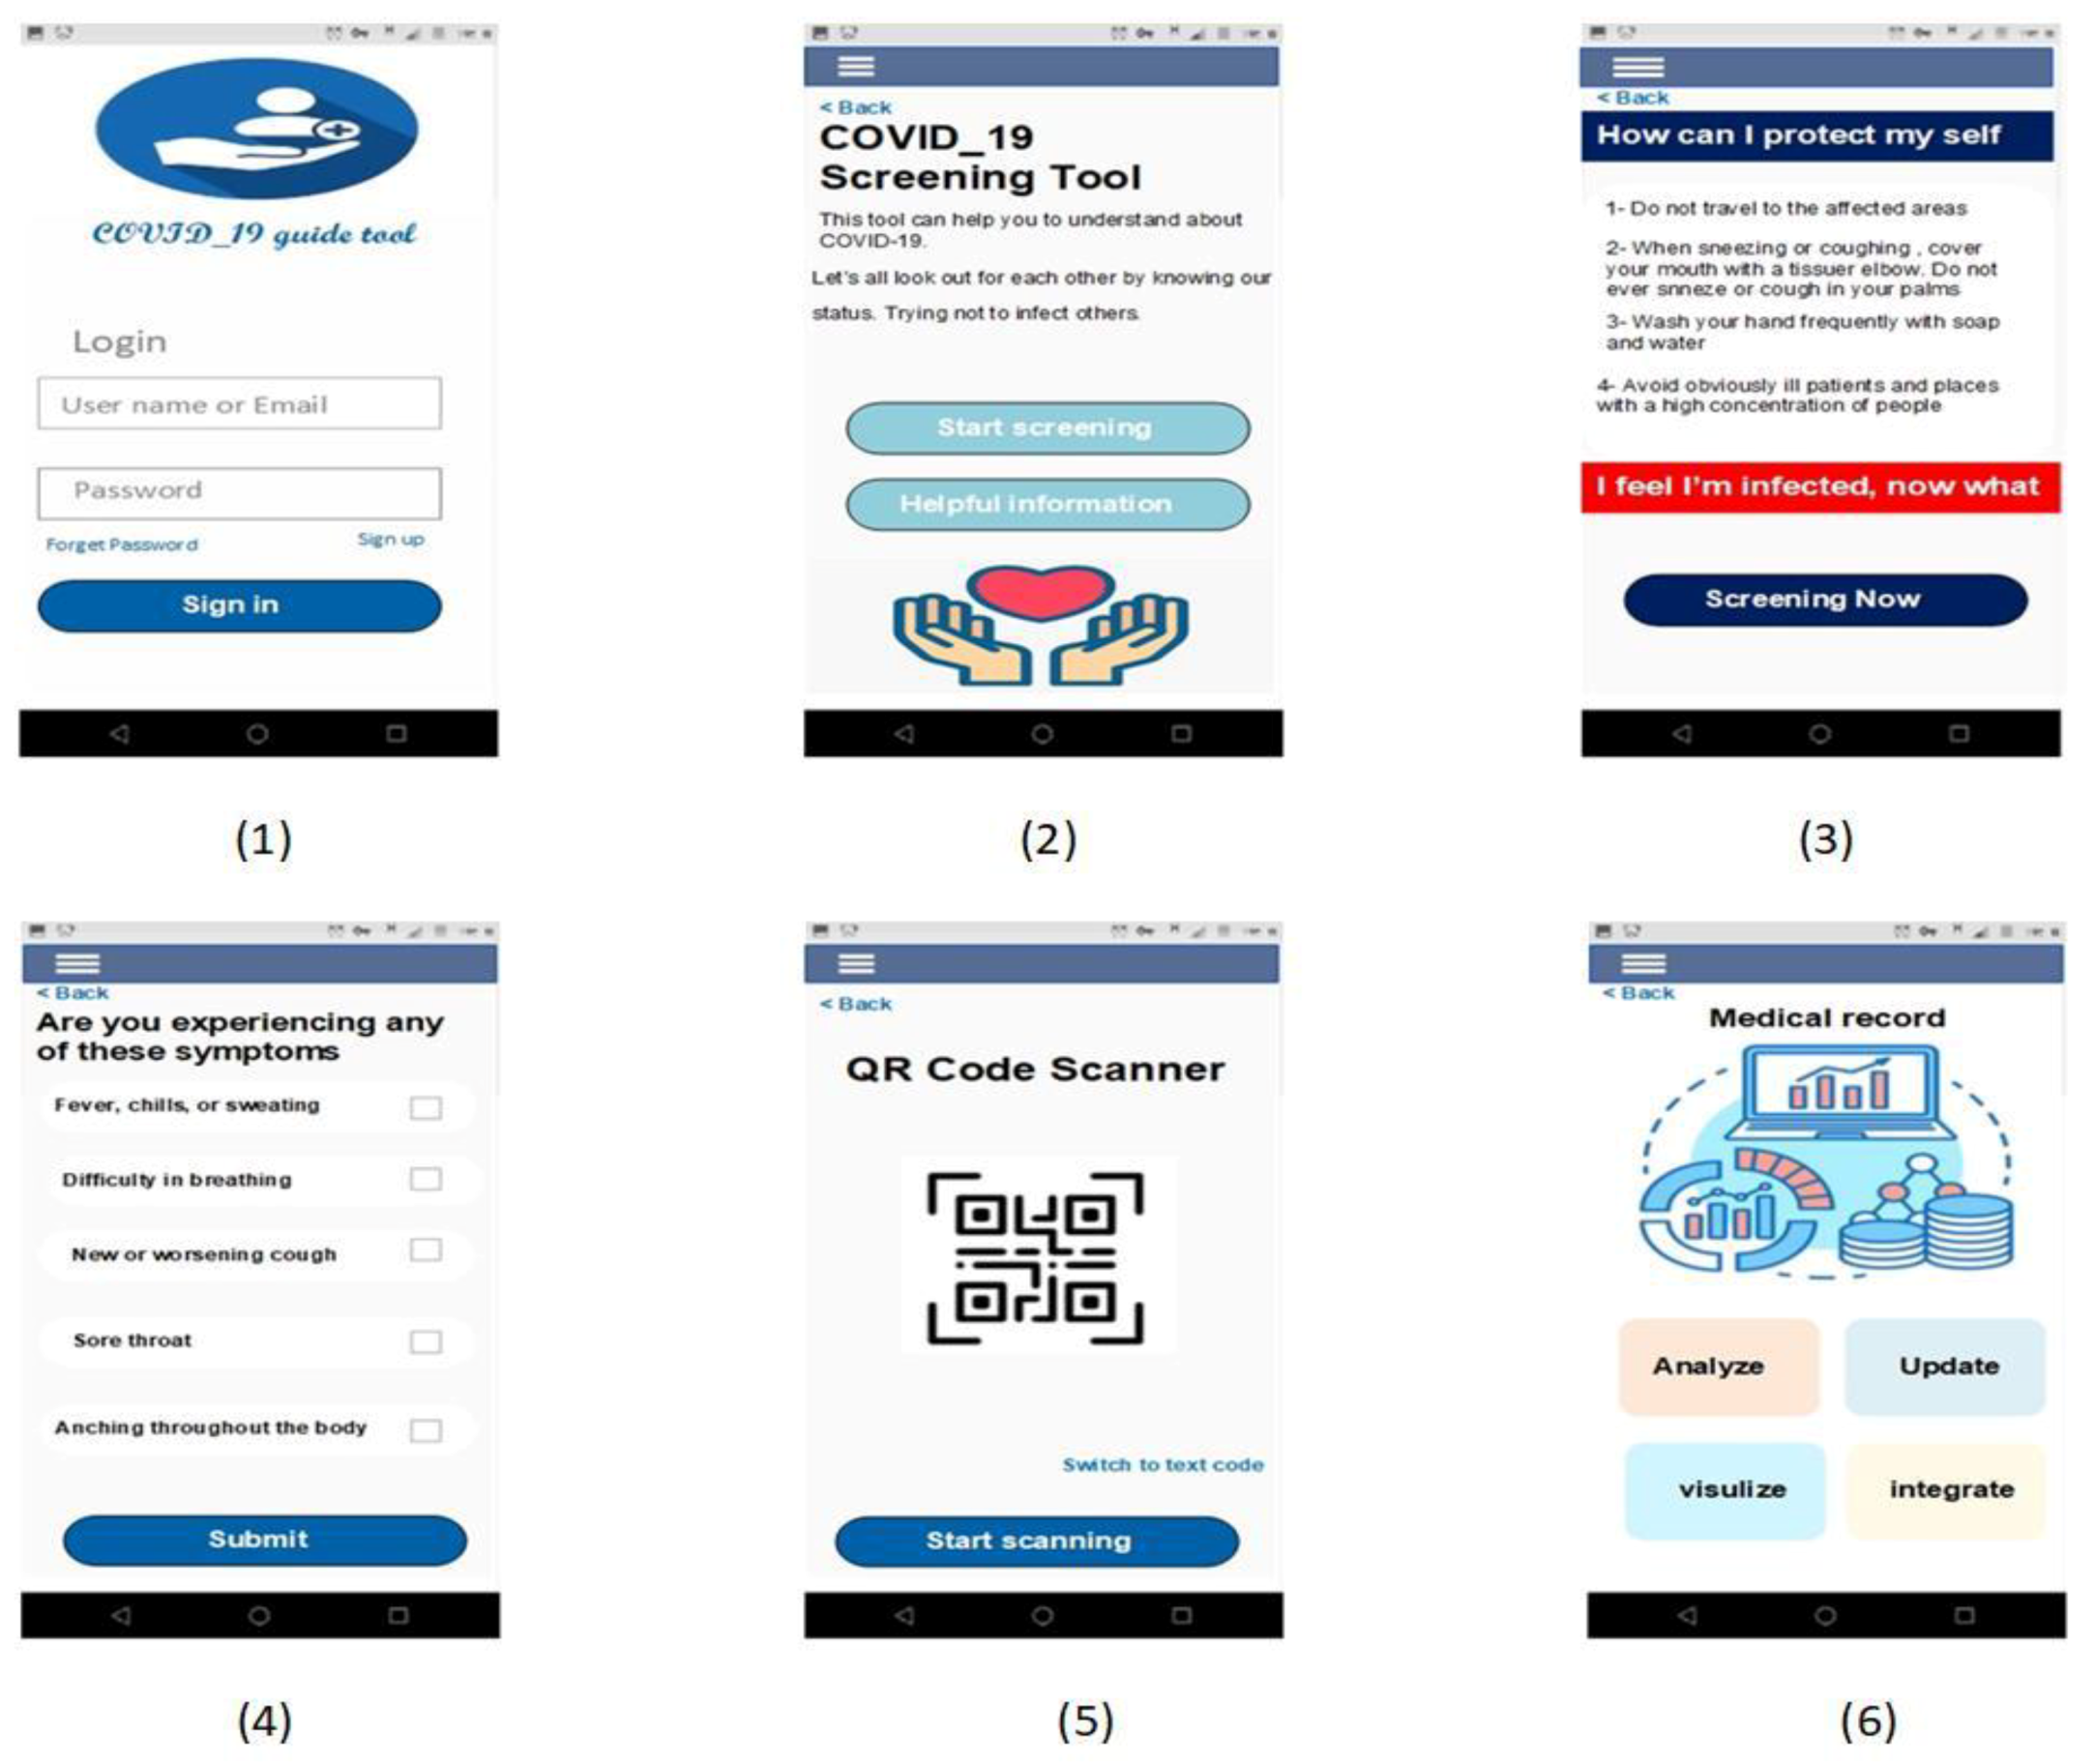
4.1. Patient Side
Frontend App
4.2. Cloud Side
4.2.1. Fog Architecture
4.2.2. Backend Cloud Database
4.3. Hospital Side
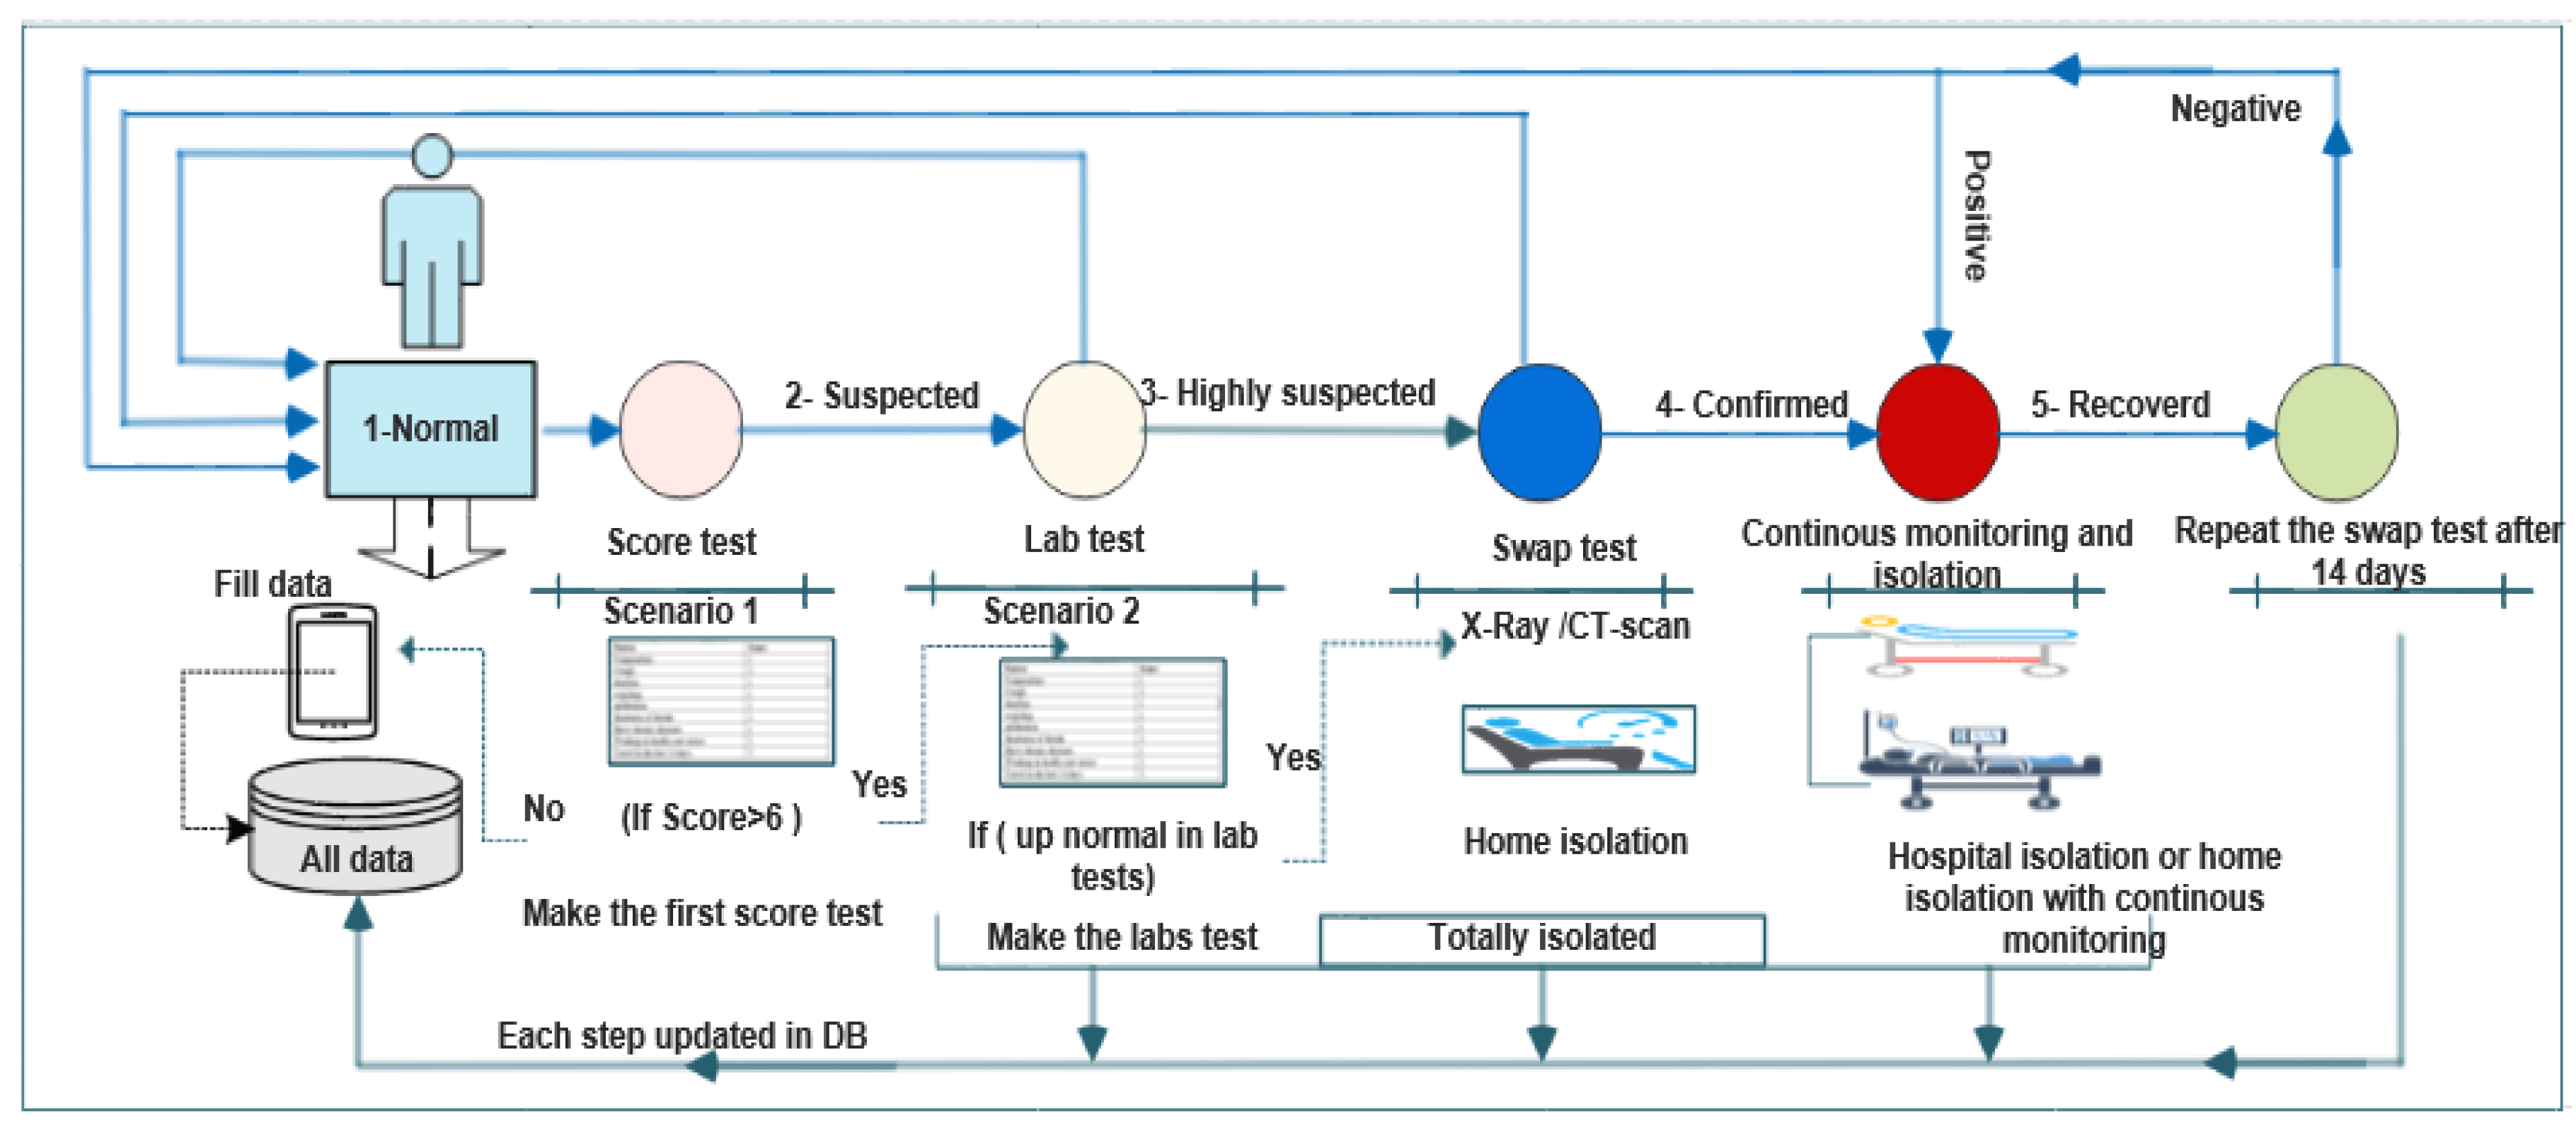
5. Dataset Description
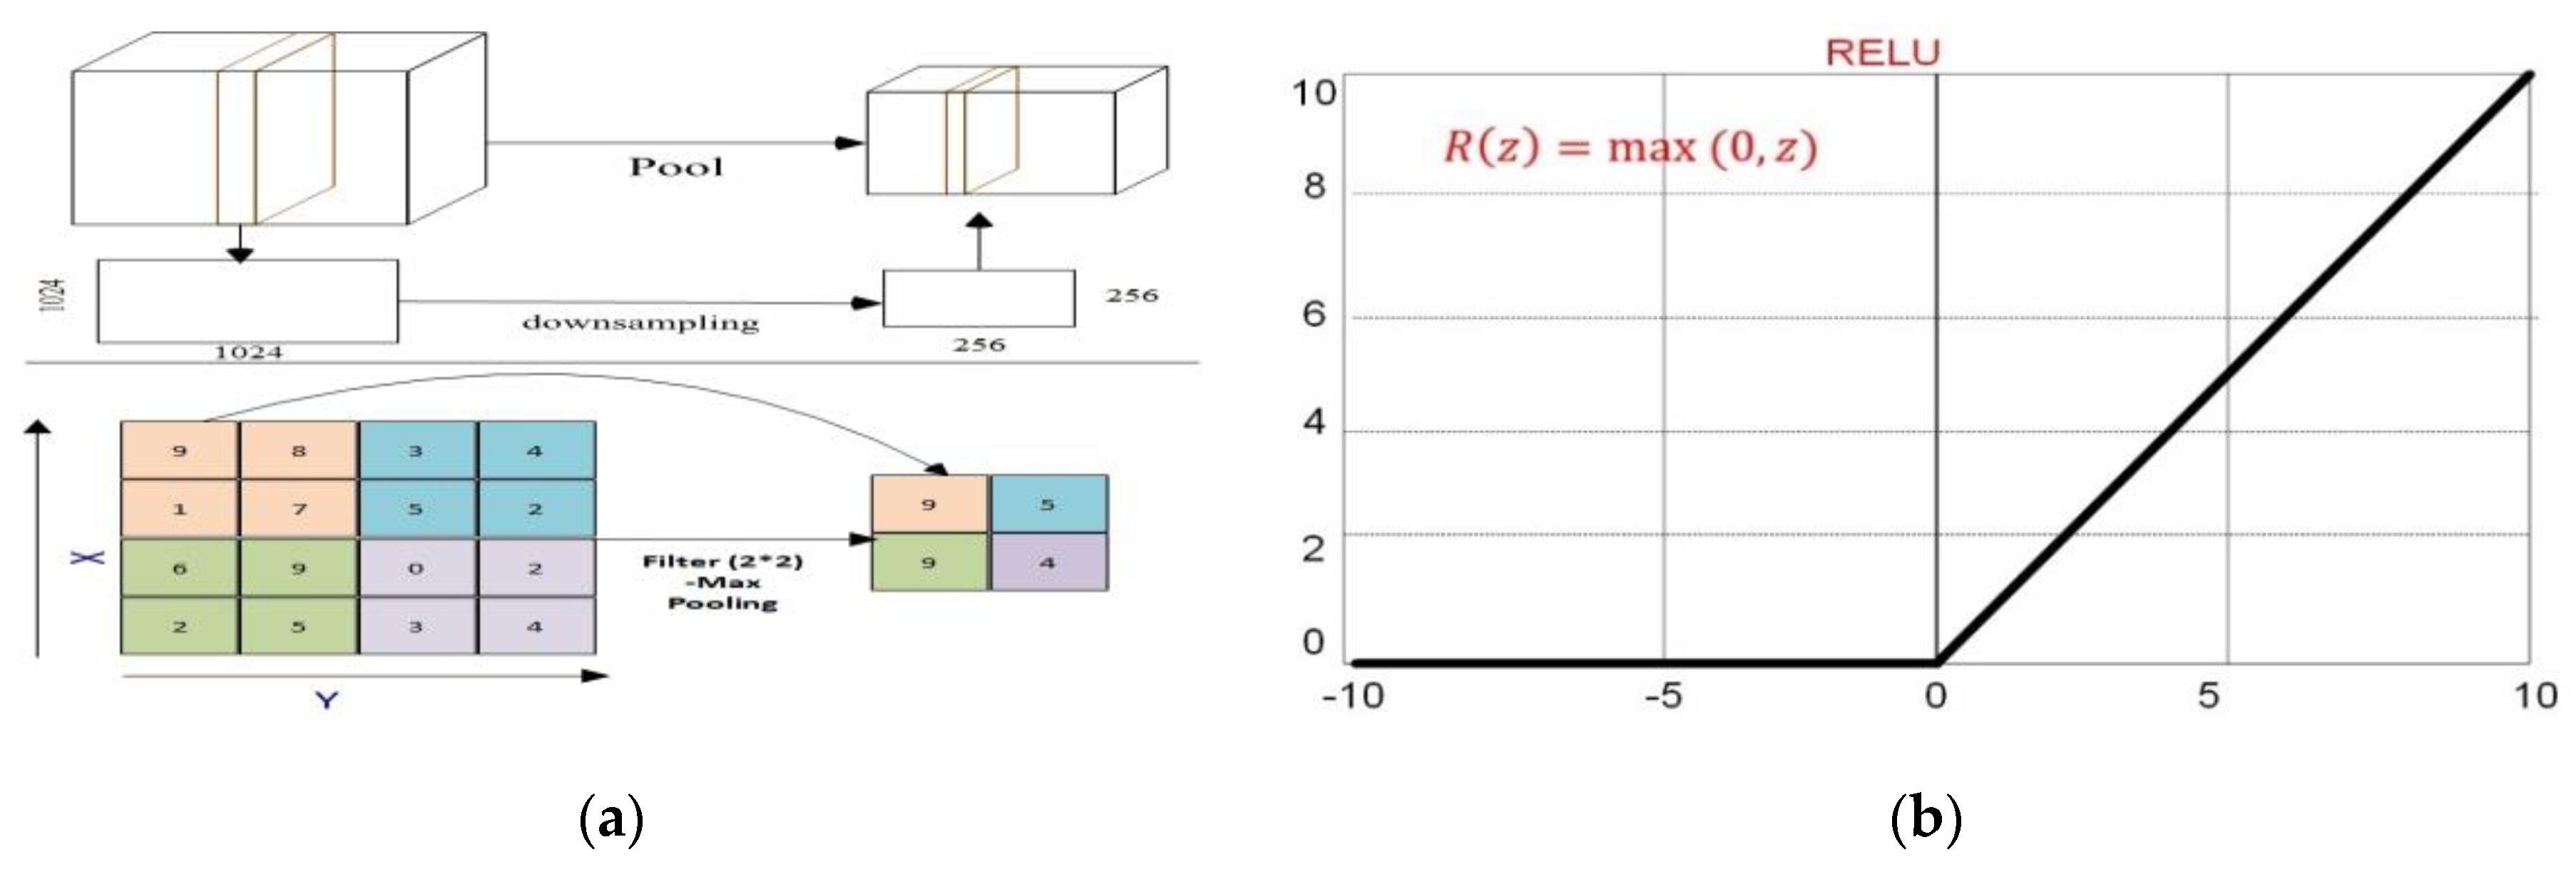
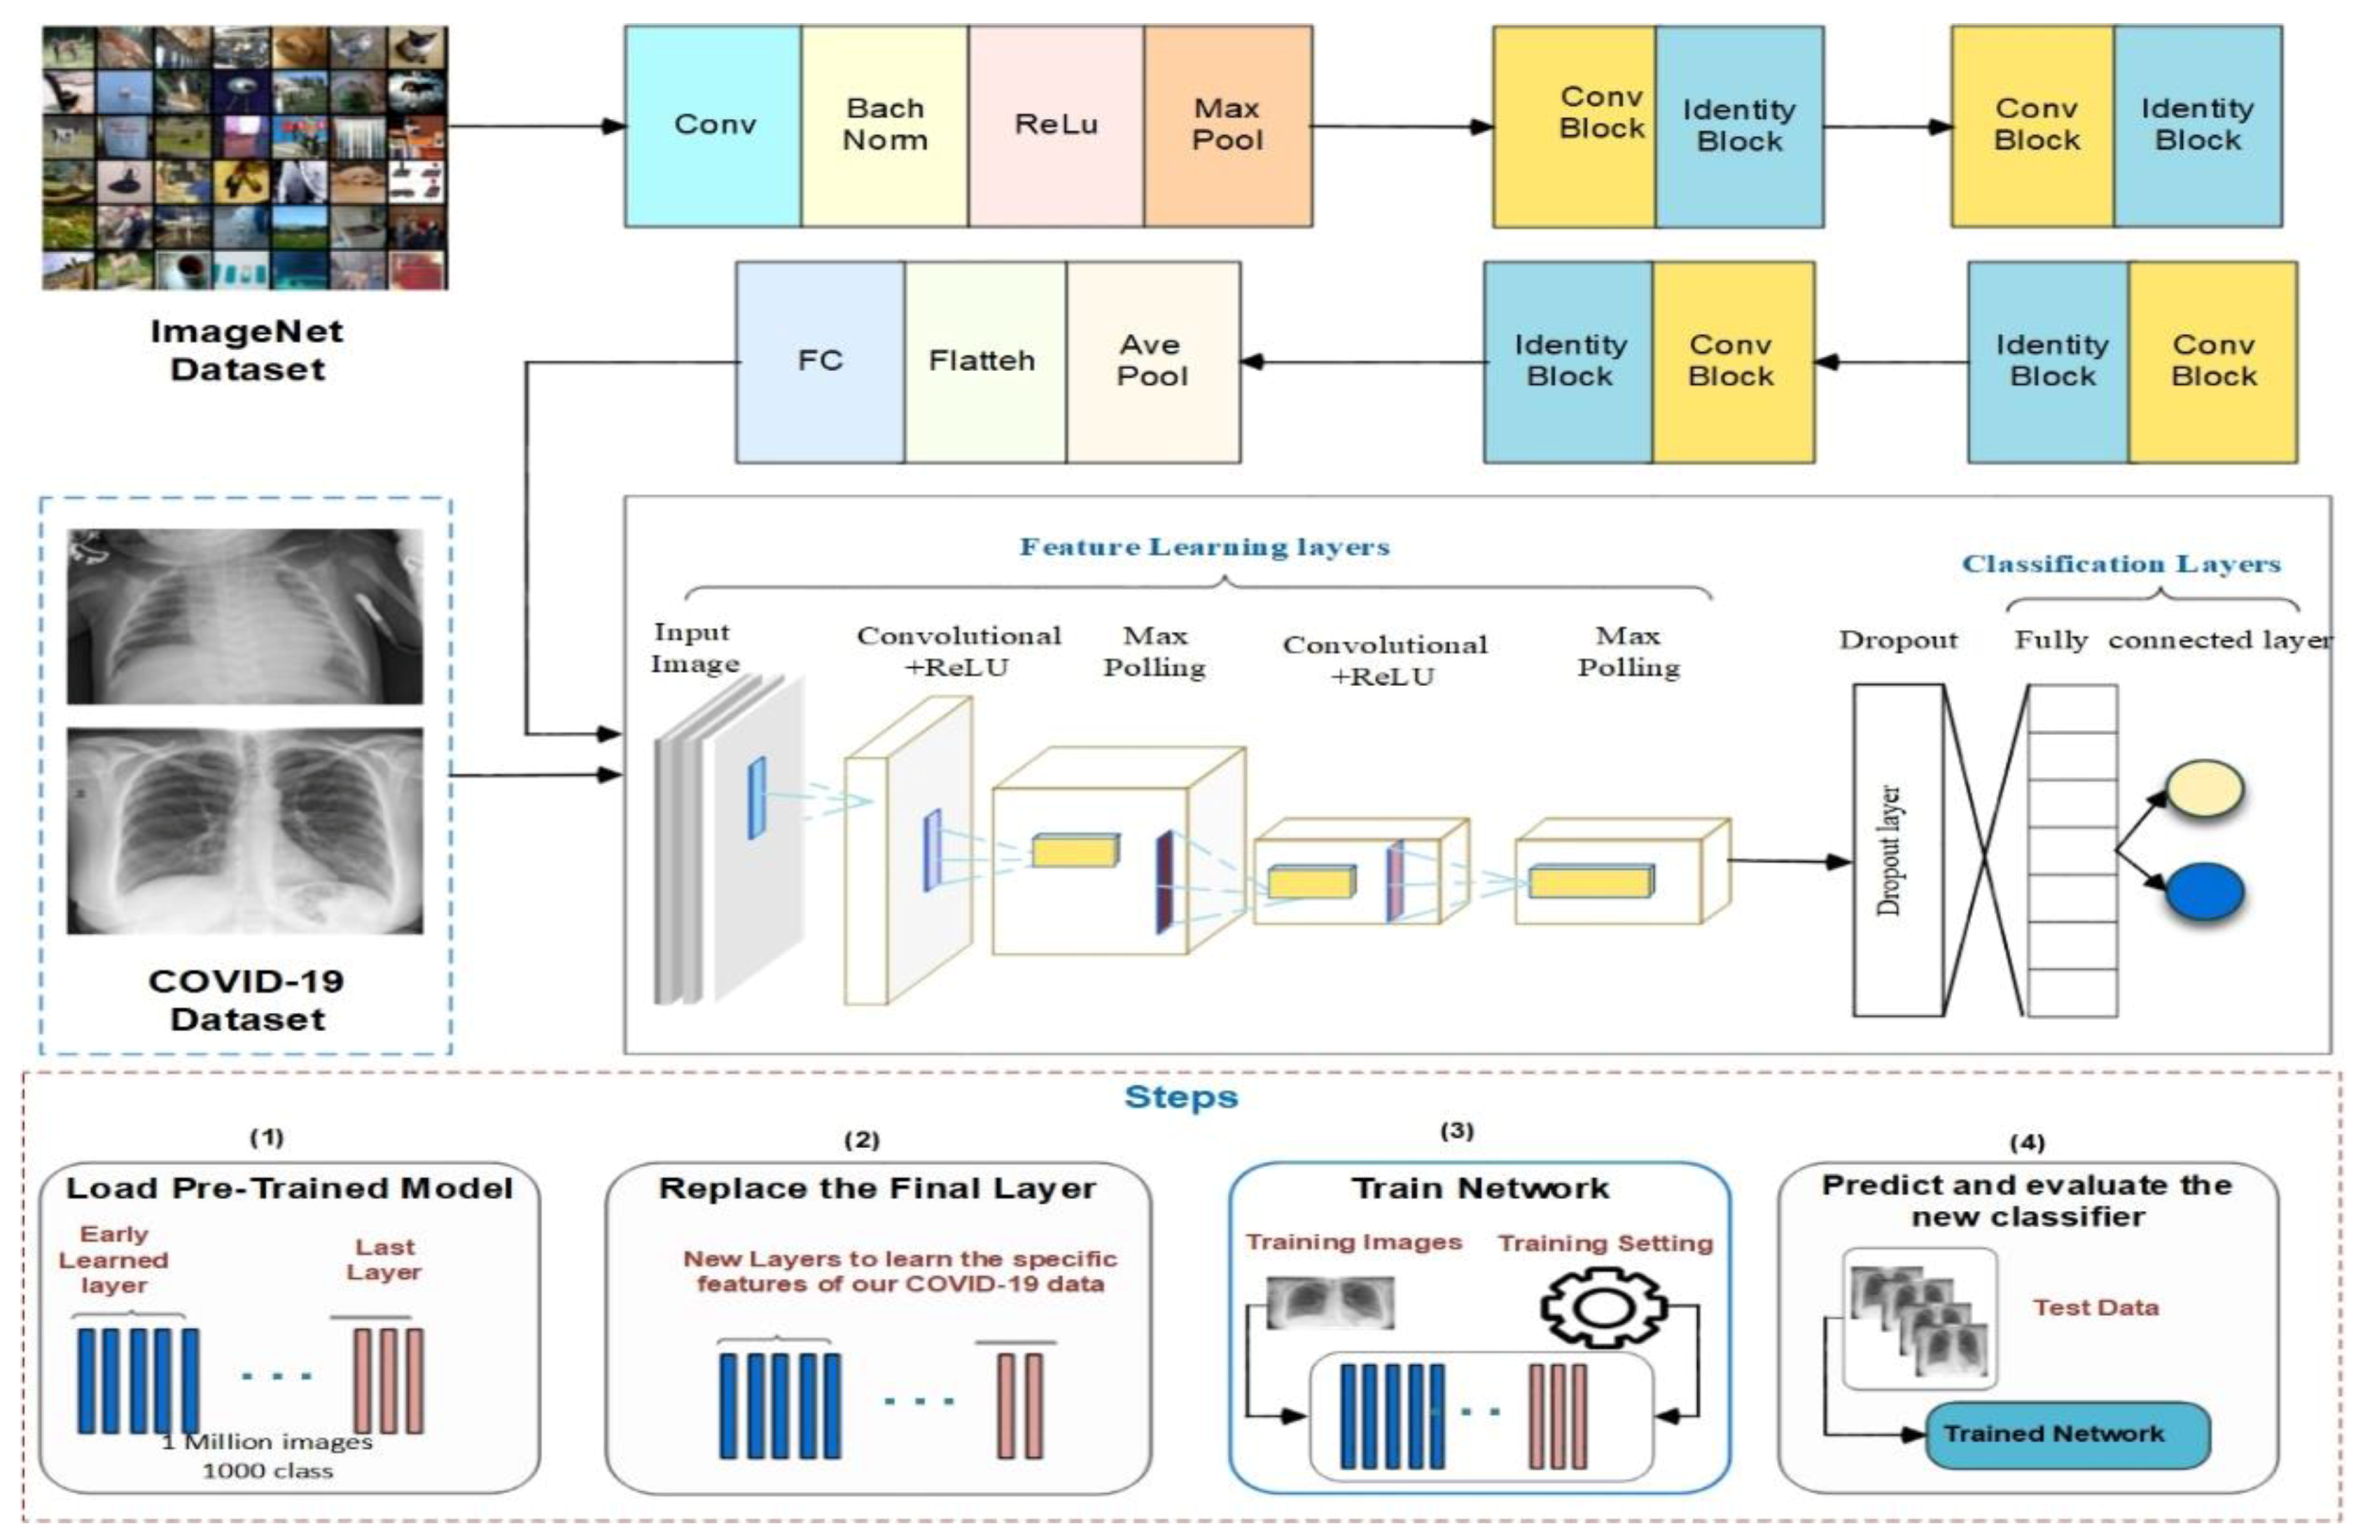
6. Classification Model
7. Results
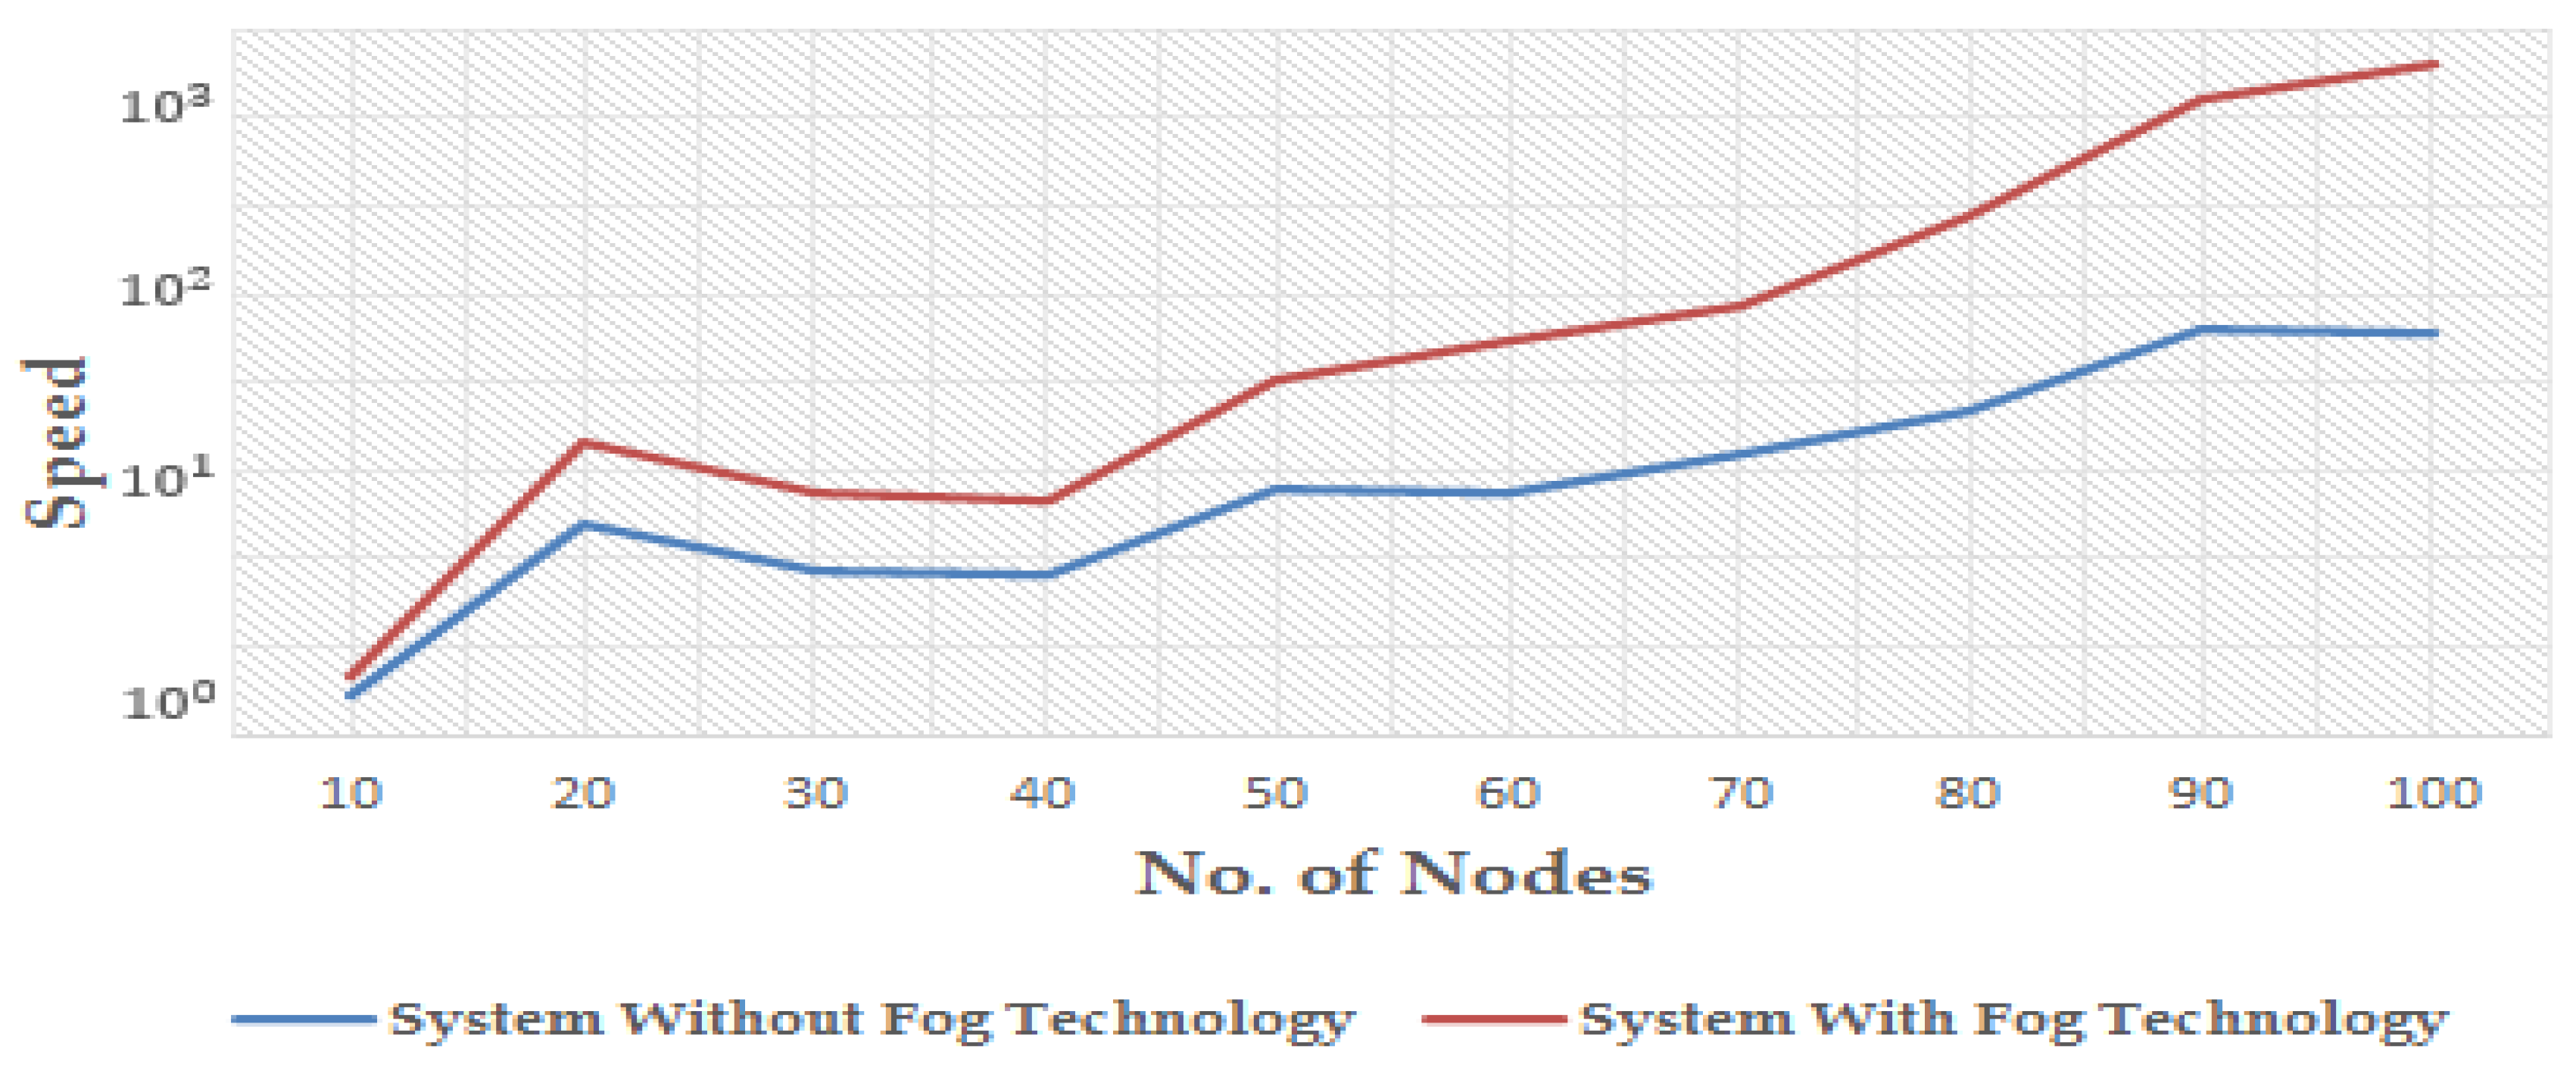
7.1. Experiment Setup
7.2. Evaluation Metrics
7.3. Discussion
8. Limitations and Future Scope
9. Conclusions
Author Contributions
Funding
Conflicts of Interest
Appendix A. Summarization of the Most Important Monitoring System

| # | Diseases | DM | WBAN | Cloud | Hospital Integration | CDSS |
|---|---|---|---|---|---|---|
| [90] | Chronic diseases | ✓ | ✗ | ✗ | ✓ | ✓ |
| [91] | Cardiovascular | ✓ | ✗ | ✗ | ✗ | ✗ |
| [92] | Heart diseases | ✗ | ✗ | ✓ | ✗ | ✗ |
| [93] | Pain assessment | ✗ | ✓ | ✗ | ✗ | ✗ |
| [94] | Monitor elders | ✓ | ✓ | ✗ | ✗ | ✓ |
| [42] | Heart diseases | ✗ | ✓ | ✓ | ✗ | ✗ |
| [95] | Heart diseases | ✗ | ✓ | ✓ | ✗ | ✗ |
| [96] | Hypertension, hypotension | ✗ | ✗ | ✗ | ✗ | ✗ |
| [97] | Knees rehabilitation | ✗ | ✓ | ✓ | ✗ | ✗ |
| [98] | Chronic diseases | ✗ | ✓ | ✓ | ✓ | ✓ |
| [98] | Hypertension | ✓ | ✓ | ✓ | ✗ | ✓ |
| [50] | Tracking daily activities | ✗ | ✓ | ✓ | ✗ | ✗ |
| [99] | Diabetes | ✗ | ✓ | ✗ | ✗ | ✗ |
| [100] | Context aware monitoring | ✗ | ✓ | ✓ | ✗ | ✗ |
| [101] | Diabetes and diet monitoring | ✗ | ✗ | ✗ | ✗ | ✓ |
| [102] | Heart diseases | ✗ | ✗ | ✗ | ✗ | ✓ |
| [58] | Diabetes | ✗ | ✗ | ✗ | ✓ | ✓ |
| [103] | Diabetes | ✓ | ✗ | ✓ | ✓ | ✓ |
| [104] | Mental disorder | ✓ | ✗ | ✗ | ✗ | ✓ |
| [105] | Chronic diseases | ✓ | ✗ | ✗ | ✗ | ✓ |
| [106] | Lung cancer | ✗ | ✗ | ✗ | ✗ | ✓ |
| [107] | Monitor patients with depression | ✓ | ✓ | ✓ | ✓ | ✓ |
| [36] | Cardiovascular diseases | ✓ | ✓ | ✗ | ✓ | ✓ |
| [108] | Heart failure | ✓ | ✓ | ✓ | ✗ | ✓ |
| [109] | Parkinson | ✓ | ✓ | ✗ | ✗ | ✓ |
| [110] | Congestive heart failure | ✓ | ✓ | ✓ | ✓ | ✗ |
| [111] | Hypertension, hypotension | ✓ | ✓ | ✓ | ✗ | ✓ |
| [112] | Diabetes | ✓ | ✓ | ✗ | ✗ | ✗ |
| [113] | Heart diseases | ✓ | ✓ | ✗ | ✗ | ✗ |
| [114] | Heart diseases | ✓ | ✓ | ✓ | ✗ | ✗ |
| [115] | Elderly | ✓ | ✓ | ✓ | ✗ | ✓ |
| [116] | Diabetes | ✓ | ✓ | ✗ | ✗ | ✗ |
| [117] | Parkinson’s disease | ✓ | ✓ | ✗ | ✗ | ✓ |
| [118] | Chronic diseases | ✓ | ✗ | ✗ | ✓ | ✓ |
| [58] | Diabetes | ✗ | ✗ | ✗ | ✓ | ✓ |
Appendix B
| Term | Abbreviation |
|---|---|
| PMS | patient-monitoring systems |
| EHR | electronic health record |
| IoT | Internet of Things |
| COPD | chronic obstructive pulmonary diseases |
| WBAN | wireless body area network |
| ECG | electrocardiogram |
| EMG | electromyogram |
| CC | cloud computing |
| KB | knowledge base |
| DL | deep learning |
| ReLU | rectified linear unit |
| ResNet-50 | residual neural network |
| HIS | hospital information system |
References
- Chowdhury, M.Z.; Jang, Y.M.; Hasan, M.K.; Shahjalal, M. Real-Time Healthcare Data Transmission for Remote Patient Monitoring in Patch-Based Hybrid OCC/BLE Networks. Sensors 2019, 19, 1208. [Google Scholar]
- Kalid, N.; Zaidan, A.A.; Zaidan, B.B.; Salman, O.H.; Hashim, M.; Muzammil, H. Based Real Time Remote Health Monitoring Systems: A Review on Patients Prioritization and Related “Big Data” Using Body Sensors information and Communication Technology. J. Med. Syst. 2017, 42, 30. [Google Scholar] [CrossRef] [PubMed]
- Elhayatmy, G.; Dey, N.; Ashour, A.S. Internet of Things Based Wireless Body Area Network in Healthcare. Stud. Big Data 2018, 30, 3–20. [Google Scholar]
- Manirabona, A.; Fourati, L.C. A 4-tiers architecture for mobile WBAN based health remote monitoring system. Wirel. Netw. 2017, 24, 2179–2190. [Google Scholar] [CrossRef]
- East, M.; Surveillance, G. Home Care for Patients with COVID-19 Presenting with Mild Symptoms and Management of Their Contacts; World Health Organization: Geneva, Switzerland, 2020; pp. 17–20. [Google Scholar]
- World Health Organization. Operational considerations for case management of COVID-19 in health facility and community. Interim guidance. Pediatr. Med. Rodz. 2020, 16, 27–32. [Google Scholar] [CrossRef]
- ICU Shortage. Available online: https://www.theguardian.com/society/2018/mar/07/patients-turned-away-intensive-care-lack-beds-shortage-hospitals (accessed on 19 November 2018).
- Yoon, J.; Alaa, A.; Hu, S.; Schaar, M. ForecastICU: A Prognostic Decision Support System for Timely Prediction of Intensive Care Unit Admission. In Proceedings of the 33rd International Conference Machine Learning, New York, NY, USA, 19–24 June 2016; pp. 1680–1689. [Google Scholar]
- Arentz, M.; Yim, E.; Klaff, L.; Lokhandwala, S.; Riedo, F.X.; Chong, M.; Lee, M. Characteristics and Outcomes of 21 Critically Ill Patients With COVID-19 in Washington State. JAMA 2020, 323, 1612. [Google Scholar] [CrossRef]
- Pathak, Y.; Shukla, P.; Tiwari, A.; Stalin, S.; Singh, S.; Shukla, P.K.; Shukla, P.K. Deep Transfer Learning Based Classification Model for COVID-19 Disease. IRBM 2020, 1, 1–6. [Google Scholar] [CrossRef]
- Alom, Z.; Rahman, M.M.S.; Nasrin, M.S.; Taha, T.M.; Asari, V.K. COVID MTNet: COVID-19 Detection with Multi-Task Deep Learning Approaches. Available online: https://arxiv.org/abs/2004.03747 (accessed on 22 July 2020).
- Versteeg, H.; Pedersen, S.S.; Mastenbroek, M.H.; Redekop, W.K.; Schwab, J.O.; Mabo, P.; Meine, M. Patient perspective on remote monitoring of cardiovascular implantable electronic devices: Rationale and design of the REMOTE-CIED study. Neth. Hear. J. 2014, 22, 423–428. [Google Scholar] [CrossRef]
- El-Sappagh, S.H.; El-Masri, S. A distributed clinical decision support system architecture. J. King Saud Univ. Comput. Inf. Sci. 2014, 26, 69–78. [Google Scholar] [CrossRef]
- Falsey, A.R.; Walsh, E.E. Novel coronavirus and severe acute respiratory syndrome. Lancet 2003, 361, 1312–1313. [Google Scholar] [CrossRef]
- Ahmad, Z.; Singh, K.; Akhtar, J.; Shakya, P. Middle East Respiratory Syndrome-Coronavirus (MERS-CoV) in India. Int. J. Pharm. Sci. Res. 2017, 8, 4496–4512. [Google Scholar]
- Drosten, C.; Günther, S.; Preiser, W.; Van Der Werf, S.; Brodt, H.-R.; Becker, S.; Rabenau, H.; Panning, M.; Kolesnikova, L.; Fouchier, R.; et al. Identification of a Novel Coronavirus in Patients with Severe Acute Respiratory Syndrome. N. Engl. J. Med. 2003, 348, 1967–1976. [Google Scholar] [CrossRef] [PubMed]
- Zaki, A.M.; Van Boheemen, S.; Bestebroer, T.M.; Osterhaus, A.D.M.E.; Fouchier, R.A. Isolation of a Novel Coronavirus from a Man with Pneumonia in Saudi Arabia. N. Engl. J. Med. 2012, 367, 1814–1820. [Google Scholar] [CrossRef] [PubMed]
- Dong, Y.; Mo, X.; Hu, Y.; Qi, X.; Jiang, F.; Jiang, Z.; Tong, S. Epidemiology of COVID-19 among Children in China. Pediatrics 2020, 145, e20200702. [Google Scholar] [CrossRef]
- Wu, C.; Chen, X.; Cai, Y.; Xia, J.; Zhou, X.; Xu, S.; Huang, H.; Zhang, L.; Zhou, X.; Du, C.; et al. Risk Factors Associated with Acute Respiratory Distress Syndrome and Death in Patients with Coronavirus Disease 2019 Pneumonia in Wuhan, China. JAMA Intern. Med. 2020, 180, 934–943. [Google Scholar] [CrossRef]
- To, K.K.-W.; Tsang, O.T.-Y.; Leung, W.-S.; Tam, A.R.; Wu, T.-C.; Lung, D.C.; Yip, C.C.-Y.; Cai, J.-P.; Chan, J.M.-C.; Chik, T.S.-H.; et al. Temporal profiles of viral load in posterior oropharyngeal saliva samples and serum antibody responses during infection by SARS-CoV-2: An observational cohort study. Lancet Infect. Dis. 2020, 20, 565–574. [Google Scholar] [CrossRef]
- Jeong, H.W.; Heo, J.Y.; Kim, H.-W.; Choi, Y.K.; Song, M.-S.; Bin Seo, Y.; Lee, J. Persistent Environmental Contamination and Prolonged Viral Shedding in MERS Patients During MERS-CoV Outbreak in South Korea. Open Forum Infect. Dis. 2015, 2, 755–760. [Google Scholar] [CrossRef]
- Livingston, E.; Bucher, K. Coronavirus Disease 2019 (COVID-19) in Italy. JAMA 2020, 323, 1335. [Google Scholar] [CrossRef]
- Huang, C.; Wang, Y.; Li, X.; Ren, L.; Zhao, J.; Hu, Y.; Zhang, L.; Fan, G.; Xu, J.; Gu, X.; et al. Clinical features of patients infected with 2019 novel coronavirus in Wuhan, China. Lancet 2020, 395, 497–506. [Google Scholar] [CrossRef]
- Petropoulos, F.; Makridakis, S. Forecasting the novel coronavirus COVID-19. PLoS ONE 2020, 15. [Google Scholar] [CrossRef]
- Allaoui, A.E.; Melliani, S.; Chadli, L.S. A Mathematical Modeling and Epidemic Prediction of COVID-19. Coronavirus Res. Repos. 2020. [Google Scholar] [CrossRef]
- Jia, L. Prediction and Analysis of Coronavirus Disease 2019. Available online: https://arxiv.org/abs/2003.05447 (accessed on 22 July 2020).
- Lee, W.-M. Python® Machine Learning; Wiley: Hoboken, NJ, USA, 2019; pp. 269–284. [Google Scholar] [CrossRef]
- Ozturk, T.; Talo, M.; Yildirim, E.A.; Baloglu, U.B.; Yildirim, O.; Acharya, U.R. Automated detection of COVID-19 cases using deep neural networks with X-ray images. Comput. Boil. Med. 2020, 121, 103792. [Google Scholar] [CrossRef] [PubMed]
- Hemdan, E.E.-D.; Shouman, M.A.; Karar, M.E. COVIDX-Net: A Framework of Deep Learning Classifiers to Diagnose COVID-19 in X-Ray Images. Available online: https://arxiv.org/abs/2003.11055 (accessed on 22 July 2020).
- Singh, D.; Kumar, V.; Vaishali; Kaur, M. Classification of COVID-19 patients from chest CT images using multi-objective differential evolution–based convolutional neural networks. Eur. J. Clin. Microbiol. Infectious Dis. 2020, 39, 1379–1389. [Google Scholar] [CrossRef] [PubMed]
- Barstugan, M.; Ozkaya, U.; Ozturk, S. Coronavirus (COVID-19) Classification using CT Images by Machine Learning Methods. 2020, pp. 1–10. Available online: https://arxiv.org/abs/2003.09424 (accessed on 10 July 2020).
- Mahmoud, N.; El-Sappagh, S.; Abdelrazek, S.; El-Bakry, H.M. A Real-time Framework for Patient Monitoring Systems based on a Wireless Body Area Network. Int. J. Comput. Appl. 2020, 176, 12–21. [Google Scholar] [CrossRef]
- El-Rashidy, N.; El-Sappagh, S.; AbuHmed, T.; Abdelrazek, S.M.; El-Bakry, H.M.; Mahmoud, N. Intensive Care Unit Mortality Prediction: An Improved Patient-Specific Stacking Ensemble Model. IEEE Access 2020, 8, 133541–133564. [Google Scholar] [CrossRef]
- El-Sappagh, S.; Ali, F.; El-Masri, S.; Kim, K.; Ali, A.; Kwak, K.-S. Mobile Health Technologies for Diabetes Mellitus: Current State and Future Challenges. IEEE Access 2018, 7, 21917–21947. [Google Scholar] [CrossRef]
- Sruthi, K.; Kripesh, E.V.; Menon, K.A.U. A survey of remote patient monitoring systems for the measurement of multiple physiological parameters. Health Technol. 2016, 7, 153–159. [Google Scholar] [CrossRef]
- Boursalie, O.; Samavi, R.; Doyle, T.E. M4CVD: Mobile Machine Learning Model for Monitoring Cardiovascular Disease. Procedia Comput. Sci. 2015, 63, 384–391. [Google Scholar] [CrossRef]
- Fong, E.-M.; Chung, W.-Y. Mobile Cloud-Computing-Based Healthcare Service by Noncontact ECG Monitoring. Sensors 2013, 13, 16451–16473. [Google Scholar] [CrossRef]
- Pandey, S.; Voorsluys, W.; Niu, S.; Khandoker, A.H.; Buyya, R. An autonomic cloud environment for hosting ECG data analysis services. Futur. Gener. Comput. Syst. 2012, 28, 147–154. [Google Scholar] [CrossRef]
- Sahoo, P.K.; Thakkar, H.K.; Lee, M.-Y. A Cardiac Early Warning System with Multi Channel SCG and ECG Monitoring for Mobile Health. Sensors 2017, 17, 711. [Google Scholar] [CrossRef] [PubMed]
- Yuce, M.R. Implementation of wireless body area networks for healthcare systems. Sens. Actuators A Phys. 2010, 162, 116–129. [Google Scholar] [CrossRef]
- Gelogo, Y.E.; Hwang, H.J.; Kim, H.-K. Internet of Things (IoT) Framework for u-healthcare System. Int. J. Smart Home 2015, 9, 323–330. [Google Scholar] [CrossRef]
- Li, C.; Hu, X.; Zhang, L. The IoT-based heart disease monitoring system for pervasive healthcare service. Procedia Comput. Sci. 2017, 112, 2328–2334. [Google Scholar] [CrossRef]
- Wang, X.; DeSalvo, N.; Zhao, X.; Feng, T.; Loveland, K.; Gnawali, O.; Shi, L. Eye Contact Reminder System for People with Autism. In Proceedings of the 6th International Conference on Mobile Computing, Applications and Services, Austin, TX, USA, 6–7 November 2014. [Google Scholar]
- Moshnyaga, V.; Koyanagi, M.; Hirayama, F.; Takahama, A.; Hashimoto, K. A medication adherence monitoring system for people with dementia. In Proceedings of the 2016 IEEE International Conference on Systems, Man, and Cybernetics (SMC), Budapest, Hungary, 9–12 October 2016; pp. 194–199. [Google Scholar]
- Silva, V.; Rodrigues, M.A.S.; Barreto, R.; De Lucena, J.V.F. UbMed: A ubiquitous system for monitoring medication adherence. In Proceedings of the 2016 IEEE 18th International Conference on e-Health Networking, Applications and Services (Healthcom), Munich, Germany, 14–16 September 2016; pp. 16–19. [Google Scholar]
- Hezarjaribi, N.; Fallahzadeh, R.; Ghasemzadeh, H. A Machine Learning Approach for Medication Adherence Monitoring Using Body-Worn Sensors. In Proceedings of the 2016 Design, Automation & Test in Europe Conference & Exhibition (DATE), Dresden, Germany, 14–18 March 2016; pp. 842–845. [Google Scholar]
- Singh, N.R.; Rothe, P.R.; Rathkanthiwar, A.P. Implementation of safety alert system for elderly people using multi-sensors. In Proceedings of the 2017 International Conference of Electronics, Communication and Aerospace Technology (ICECA), Coimbatore, India, 20–22 April 2017; pp. 282–286. [Google Scholar]
- Hidalgo, J.A.; Cajiao, A.; Hernández, C.M.; López, D.; Quintero, V.M. VISIGNET: A wireless body area network with cloud data storage for the telemonitoring of vital signs. Health Technol. 2015, 5, 115–126. [Google Scholar] [CrossRef]
- Ahnn, J.H.; Potkonjak, M. mHealthMon: Toward Energy-Efficient and Distributed Mobile Health Monitoring Using Parallel Offloading. J. Med. Syst. 2013, 37, 1–5. [Google Scholar] [CrossRef]
- Almashaqbeh, G.; Al-Hayajneh, T.; Vasilakos, A.V.; Mohd, B.J. QoS-Aware Health Monitoring System Using Cloud-Based WBANs. J. Med. Syst. 2014, 38. [Google Scholar] [CrossRef]
- Advantages of Cloud Monitoring of Environmental Conditions. Available online: https://www.sensaphone.com/pdf/Cloud_Tech_Resources-1.pdf (accessed on 1 September 2020).
- Verma, P.; Sood, S.K. Fog Assisted-IoT Enabled Patient Health Monitoring in Smart Homes. IEEE Internet Things J. 2018, 5, 1789–1796. [Google Scholar] [CrossRef]
- Yi, S.; Li, C.; Li, Q. A Survey of Fog Computing. In Proceedings of the 2015 Workshop on Community-Organized Multimodal Mining: Opportunities for Novel Solutions-MMCommons’15, Brisbane, Australia, 26–30 October 2015; pp. 37–42. [Google Scholar]
- Kharel, J.; Reda, H.T.; Shin, S.Y. An Architecture for Smart Health Monitoring System Based on Fog Computing. J. Commun. 2017, 12, 228–233. [Google Scholar] [CrossRef][Green Version]
- Kraemer, F.A.; Braten, A.E.; Tamkittikhun, N.; Palma, D. Fog Computing in Healthcare—A Review and Discussion. IEEE Access 2020, 5, 9206–9222. [Google Scholar] [CrossRef]
- Dastjerdi, A.V.; Buyya, R. Fog Computing: Helping the Internet of Things Realize Its Potential. Computer 2016, 49, 112–116. [Google Scholar] [CrossRef]
- Stojmenovic, I. Fog computing: A cloud to the ground support for smart things and machine-to-machine networks. In Proceedings of the 2014 Australasian Telecommunication Networks and Applications Conference (ATNAC), Melbourne, Australia, 26–28 November 2014; pp. 117–122. [Google Scholar] [CrossRef]
- El Sappagh, S.; Elmogy, M.; Riad, A.E.M. A CBR system for diabetes mellitus diagnosis: Case-base standard data model. Int. J. Med. Eng. Inform. 2015, 7, 191. [Google Scholar] [CrossRef]
- Anooj, P. Clinical decision support system: Risk level prediction of heart disease using weighted fuzzy rules. J. King Saud Univ. Comput. Inf. Sci. 2012, 24, 27–40. [Google Scholar] [CrossRef]
- Velickovski, F.; Ceccaroni, L.; Roca, J.; Burgos, F.; Gáldiz, J.B.; Marina, N.; Ariet, M.I. Clinical Decision Support Systems (CDSS) for preventive management of COPD patients. J. Transl. Med. 2014, 12, S9. [Google Scholar] [CrossRef] [PubMed]
- El-Sappagh, S.; AbuHmed, T.; Islam, S.R.; Kwak, K.-S. Multimodal Multitask Deep Learning Model for Alzheimer’s Disease Progression Detection Based on Time Series Data. Neurocomputing 2020. [Google Scholar] [CrossRef]
- Rashid, T.A.; Abdulla, S.M.; Abdulla, R.M. Decision Support System for Diabetes Mellitus through Machine Learning Techniques. Int. J. Adv. Comput. Sci. Appl. 2016, 7, 170–178. [Google Scholar] [CrossRef]
- World Health Organization. Clinical Mangemnt of COVID-19; World Health Organization: Geneva, Switzerland, 2010; pp. 1–62. [Google Scholar]
- Ai, T.; Yang, Z.; Hou, H.; Zhan, C.; Chen, C.; Lv, W.; Tao, Q.; Sun, Z.; Xia, L. Correlation of Chest CT and RT-PCR Testing for Coronavirus Disease 2019 (COVID-19) in China: A Report of 1014 Cases. Radiology 2020, 296, E32–E40. [Google Scholar] [CrossRef]
- Guastalegname, M.; Vallone, A. Could chloroquine /hydroxychloroquine be harmful in Coronavirus Disease 2019 (COVID-19) treatment? Clin. Infect. Dis. 2020, 71, 2019–2020. [Google Scholar] [CrossRef]
- Yang, X.; Yu, Y.; Xu, J.; Shu, H.; Xia, J.; Liu, H.; Wu, Y.; Zhang, L.; Yu, Z.; Fang, M.; et al. Clinical course and outcomes of critically ill patients with SARS-CoV-2 pneumonia in Wuhan, China: A single-centered, retrospective, observational study. Lancet Respir. Med. 2020, 8, 475–481. [Google Scholar] [CrossRef]
- Available online: https://doi.org/doi:10.1038/d41586-020-00154-w (accessed on 22 July 2020).
- Guan, W.-J.; Ni, Z.-Y.; Hu, Y.; Liang, W.-H.; Ou, C.-Q.; He, J.-X.; Liu, L.; Shan, H.; Lei, C.-L.; Hui, D.S.; et al. Clinical Characteristics of Coronavirus Disease 2019 in China. N. Engl. J. Med. 2020, 382, 1708–1720. [Google Scholar] [CrossRef]
- Wu, Z.; McGoogan, J.M. Characteristics of and Important Lessons from the Coronavirus Disease 2019 (COVID-19) Outbreak in China: Summary of a Report of 72314 Cases from the Chinese Center for Disease Control and Prevention. JAMA J. Am. Med. Assoc. 2020, 323, 1239–1242. [Google Scholar] [CrossRef] [PubMed]
- Bikdeli, B.; Madhavan, M.V.; Jimenez, D.; Chuich, T.; Dreyfus, I.; Driggin, E.; Der Nigoghossian, C.; Ageno, W.; Madjid, M.; Guo, Y.; et al. COVID-19 and Thrombotic or Thromboembolic Disease: Implications for Prevention, Antithrombotic Therapy, and Follow-Up. J. Am. Coll. Cardiol. 2020, 75, 2950–2973. [Google Scholar] [CrossRef] [PubMed]
- Lippi, G.; Favaloro, E.J. D-dimer is Associated with Severity of Coronavirus Disease 2019: A Pooled Analysis. Thromb. Haemost. 2020, 120, 876–878. [Google Scholar] [CrossRef] [PubMed]
- Lauer, S.A.; Grantz, K.H.; Bi, Q.; Jones, F.K.; Zheng, Q.; Meredith, H.R.; Lessler, J. The Incubation Period of Coronavirus Disease 2019 (COVID-19) From Publicly Reported Confirmed Cases: Estimation and Application. Ann. Internal Med. 2020, 172, 577–582. [Google Scholar] [CrossRef]
- Minaee, S.; Kafieh, R.; Sonka, M.; Yazdani, S.; Soufi, G.J. Deep-COVID: Predicting COVID-19 from chest X-ray images using deep transfer learning. Med. Image Anal. 2020, 65, 101794. [Google Scholar] [CrossRef]
- Li, R.; Pei, S.; Chen, B.; Song, Y.; Zhang, T.; Yang, W.; Shaman, J. Substantial undocumented infection facilitates the rapid dissemination of novel coronavirus (SARS-CoV-2). Science 2020, 368, 489–493. [Google Scholar] [CrossRef]
- NS. Ns2 Offical Web Site. Available online: https://ns2tutor.weebly.com/wirelesssimulation.html (accessed on 17 April 2020).
- Openfog Reference Architecture for Fog Computing. Available online: https://www.openfogconsortium.org/ (accessed on 17 April 2020).
- COVID-19 Chest X-ray. Available online: https://github.com/ieee8023/covid-chestxray-dataset (accessed on 17 July 2020).
- Altun, A.; Erdogan, O. A Chest X-Ray Image. Cardiol. Rev. 2003, 11, 301–302. [Google Scholar] [CrossRef]
- Mao, Q.; Jay, M.; Hoffman, J.; Calvert, J.; Barton, C.; Shimabukuro, D.; Shieh, L.; Chettipally, U.; Fletcher, G.; Kerem, Y.; et al. Multicentre validation of a sepsis prediction algorithm using only vital sign data in the emergency department, general ward and ICU. BMJ Open 2018, 8, e017833. [Google Scholar] [CrossRef]
- Khalifa, N.E.M.; Taha, M.H.N.; Hassanien, A.E.; Elghamrawy, S. Detection of Coronavirus (COVID-19) Associated Pneumonia based on Generative Adversarial Networks and a Fine-Tuned Deep Transfer Learning Model using Chest X-ray Dataset. Available online: https://arxiv.org/abs/2004.01184 (accessed on 25 June 2020).
- Tao, S. Deep Neural Network Ensembles. Bioinf. Res. Appl. 2019, 11943 LNCS, 1–12. [Google Scholar] [CrossRef]
- He, K. Deep Residual Learning for Image Recognition. In Proceedings of the 2016 IEEE Conference on Computer Vision and Pattern Recognition (CVPR), Las Vegas, NV, USA, 27–30 June 2016. [Google Scholar]
- Zeng, G.; He, Y.; Yu, Z.; Yang, X.; Yang, R.; Zhang, L. Preparation of novel high copper ions removal membranes by embedding organosilane-functionalized multi-walled carbon nanotube. J. Chem. Technol. Biotechnol. 2015, 91, 2322–2330. [Google Scholar] [CrossRef]
- Wang, L.; Lin, Z.Q.; Wong, A. COVID-Net: A Tailored Deep Convolutional Neural Network Design for Detection of COVID-19 Cases from Chest X-Ray Images. Available online: https://arxiv.org/abs/2003.09871 (accessed on 20 July 2020).
- Kumar, P.; Kumari, S. Detection of coronavirus Disease (COVID-19) based on Deep Features. Int. J. Math. Eng. Manag. Sci. 2020. [Google Scholar] [CrossRef]
- Tong, Z.-D.; Tang, A.; Li, K.-F.; Li, P.; Wang, H.-L.; Yi, J.-P.; Zhang, Y.-L.; Yan, J.-B. Potential Presymptomatic Transmission of SARS-CoV-2, Zhejiang Province, China, 2020. Emerg. Infect. Dis. 2020, 26, 1052–1054. [Google Scholar] [CrossRef] [PubMed]
- Wang, Y.; Liu, Y.; Liu, L.; Wang, X.; Luo, N.; Ling, L. Clinical Outcomes in 55 Patients with Severe Acute Respiratory Syndrome Coronavirus 2 Who Were Asymptomatic at Hospital Admission in Shenzhen, China. J. Infect. Dis. 2020, 221, 1770–1774. [Google Scholar] [CrossRef] [PubMed]
- Chan, J.F.-W.; Yuan, S.; Kok, K.-H.; To, K.K.-W.; Chu, H.; Yang, J.; Xing, F.; Liu, J.; Yip, C.C.-Y.; Poon, R.W.-S.; et al. A familial cluster of pneumonia associated with the 2019 novel coronavirus indicating person-to-person transmission: A study of a family cluster. Lancet 2020, 395, 514–523. [Google Scholar] [CrossRef]
- Anandh, U. SARS CoV-2 infection in children. J. Renal Nutr. Metab. 2020, 6, 12. [Google Scholar] [CrossRef]
- Zhang, Y.-F.; Gou, L.; Zhou, T.-S.; Lin, D.-N.; Zheng, J.; Li, Y.; Li, J.-S. An ontology-based approach to patient follow-up assessment for continuous and personalized chronic disease management. J. Biomed. Inform. 2017, 72, 45–59. [Google Scholar] [CrossRef]
- Waqialla, M.; Alshammari, R.; Razzak, M.I.; Mohammad, W. An ontology for remote monitoring of cardiac implantable electronic devices. In Proceedings of the 2015 International Conference on Computer, Communications, and Control Technology (I4CT), Sarawak, Malaysia, 21–23 April 2015; pp. 520–523. [Google Scholar]
- Yang, Z.; Zhou, Q.; Lei, L.; Zheng, K.; Xiang, W. An IoT-cloud Based Wearable ECG Monitoring System for Smart Healthcare. J. Med. Syst. 2016, 40. [Google Scholar] [CrossRef]
- Yang, G.; Jiang, M.; Ouyang, W.; Ji, G.; Xie, H.; Rahmani, A.M.; Liljeberg, P.; Tenhunen, H. IoT-Based Remote Pain Monitoring System: From Device to Cloud Platform. IEEE J. Biomed. Health Inform. 2018, 22, 1711–1719. [Google Scholar] [CrossRef]
- Lyle, A. Smart Home Project. 2012. Available online: https://www.jamk.fi/globalassets/koulutus--education/tekniikan-ala/smart-home/report-team3.pdf (accessed on 2 September 2020).
- Rotariu, C.; Manta, V. Wireless system for remote monitoring of oxygen saturation and heart rate. In Proceedings of the 2012 Federated Conference Computer Science and Information System FedCSIS 2012, Wrocław, Poland, 9–12 September 2012; pp. 193–196. [Google Scholar]
- Gómez, J.; Oviedo, B.; Zhuma, E. Patient Monitoring System Based on Internet of Things. Procedia Comput. Sci. 2016, 83, 90–97. [Google Scholar] [CrossRef]
- Balasubramanian, V.; Stranieri, A. A scalable cloud Platform for Active healthcare monitoring applications. In Proceedings of the 2014 IEEE Conference on e-Learning, e-Management and e-Services (IC3e), Hawthorn, Australia, 10–12 December 2014; pp. 93–98. [Google Scholar]
- Melillo, P.; Orrico, A.; Scala, P.; Crispino, F.; Pecchia, L. Cloud-Based Smart Health Monitoring System for Automatic Cardiovascular and Fall Risk Assessment in Hypertensive Patients. J. Med. Syst. 2015, 39. [Google Scholar] [CrossRef]
- Chen, B.; Varkey, J.P.; Pompili, D.; Li, J.K.-J.; Marsic, I. Patient vital signs monitoring using Wireless Body Area Networks. In Proceedings of the 2010 IEEE 36th Annual Northeast Bioengineering Conference (NEBEC), New York, NY, USA, 26–28 March 2010; pp. 1–2. [Google Scholar]
- Forkan, A.R.M.; Khalil, I. A clinical decision-making mechanism for context-aware and patient-specific remote monitoring systems using the correlations of multiple vital signs. Comput. Methods Programs Biomed. 2017, 139, 1–16. [Google Scholar] [CrossRef] [PubMed]
- Caballero-Ruiz, E.; Sáez, G.G.; Rigla, M.; Villaplana, M.; Pons, B.; Hernando, M.E. A web-based clinical decision support system for gestational diabetes: Automatic diet prescription and detection of insulin needs. Int. J. Med. Inform. 2017, 102, 35–49. [Google Scholar] [CrossRef] [PubMed]
- Nazari, S.; Fallah, M.; Kazemipoor, H.; Salehipour, A. A fuzzy inference-fuzzy analytic hierarchy process-based clinical decision support system for diagnosis of heart diseases. Expert Syst. Appl. 2018, 95, 261–271. [Google Scholar] [CrossRef]
- El-Sappagh, S.; Elmogy, M. A Decision Support System for Diabetes Mellitus Management. Diabetes Case Rep. 2016, 1, 1–13. [Google Scholar] [CrossRef]
- Ivascu, T.; Manate, B.; Negru, V. A Multi-agent Architecture for Ontology-Based Diagnosis of Mental Disorders. In Proceedings of the 2015 17th International Symposium on Symbolic and Numeric Algorithms for Scientific Computing (SYNASC), Timisoara, Romania, 21–24 September 2015; pp. 423–430. [Google Scholar]
- Zhanwei, D.; Yongjian, Y. Semi-automatic remote medicine monitoring system of mobile users. China Commun. 2015, 12, 1–9. [Google Scholar] [CrossRef]
- Sesen, M. Evaluating OWL 2 Reasoners in the Context of Clinical Decision Support in Lung Cancer Treatment Selection. OWL Reason 2013. Available online: http://ceur-ws.org/Vol-1015/paper_10.pdf (accessed on 22 July 2020).
- Help4Mood Project. Available online: http://www.help4mood.info/site/default.aspx (accessed on 22 July 2018).
- Suh, M.-K.; Chen, C.-A.; Woodbridge, J.; Tu, M.; Kim, J.I.; Nahapetian, A.; Evangelista, L.S.; Sarrafzadeh, M. A Remote Patient Monitoring System for Congestive Heart Failure. J. Med. Syst. 2011, 35, 1165–1179. [Google Scholar] [CrossRef]
- (HELP) Home-Based Empowered Living for Parkinsons Diseas Patients Project. Available online: http://www.aal-europe.eu/projects/help/ (accessed on 19 July 2018).
- HEALTH@HOME Project. Available online: http://www.aal-europe.eu/projects/healthhome/ (accessed on 22 July 2018).
- Hassan, M.K.; El Desouky, A.I.; Elghamrawy, S.M.; Sarhan, A. Intelligent hybrid remote patient-monitoring model with cloud-based framework for knowledge discovery. Comput. Electr. Eng. 2018, 70, 1034–1048. [Google Scholar] [CrossRef]
- Zulj, S.; Seketa, G.; Dzaja, D.; Sklebar, F.; Drobnjak, S.; Celic, L.; Magjarevic, R. Supporting Diabetic Patients with a Remote Patient Monitoring Systems. World Congr. Med. Phys. Biomed. Eng. 2017, 60, 577–580. [Google Scholar]
- Dhulipala, V.R.S.; Kanagachidambaresan, G.R. Cardiac Care Assistance using Self Configured Sensor Network—A Remote Patient Monitoring System. J. Inst. Eng. Ser. B 2014, 95, 101–106. [Google Scholar] [CrossRef]
- Rani, N.S.; Vimala, K.; Kalaivani, V. A Remote Healthcare Monitoring System for Faster Identification of Cardiac Abnormalities from Compressed ECG Using Advanced Data Mining Approach. Lect. Notes Electr. Eng. 2013, 222, 227–236. [Google Scholar]
- Zanjal, S.V.; Talmale, G.R. Medicine Reminder and Monitoring System for Secure Health Using IOT. Procedia Comput. Sci. 2016, 78, 471–476. [Google Scholar] [CrossRef]
- Vivekanandan, S.; Devanand, M. Remote monitoring for diabetes disorder: Pilot study using InDiaTel prototype. Eur. Res. Telemed. 2015, 4, 63–69. [Google Scholar] [CrossRef]
- Delrobaei, M.; Memar, S.; Pieterman, M.; Stratton, T.W.; McIsaac, K.; Jog, M. Towards remote monitoring of Parkinson’s disease tremor using wearable motion capture systems. J. Neurol. Sci. 2018, 384, 38–45. [Google Scholar] [CrossRef] [PubMed]
- Colantonio, S.; de Pietro, G.; Esposito, M.; Machì, A.; Martinelli, M.; Salvetti, O. Decision Support for the Remote Management of Chronic Patients. In MobiHealth 2011: Wireless Mobile Communication and Healthcare; Springer: Berlin/Heidelberg, Germany, 2011; pp. 38–45. [Google Scholar]


| Factor | Cloud Computing | Fog Computing |
|---|---|---|
| Goal | Enhance the execution process data that should be transferred to the cloud for handling and storage | Give a powerful storage, realistic and efficient management |
| Latency | High | Low |
| Mobility | Limited | Supported |
| Geo-distribution | Centralized | Distributed |
| Bandwidth cost | High | Low |
| Storage capability | Strong | Weak |
| Energy consumption | High | Low |
| Location awareness | Partially supported | Fully supported |
| No. of servers | Few | Large |
| Real-time interaction | Supported | Supported |
| Security | Undefined | Defined |
| Location of service | With the internet | At the edge of the local network |
| Run time | Real time | Rea time |
| Transmission | Device-to-device | Device-to-cloud |
| Response time | Low | High |
| Scalability | High | High |
| Multitasking | Yes | Yes |
| Factor | Score |
|---|---|
| Temperature | 1 |
| Cough | 2 |
| Diarrhea | 1 |
| Vomiting | 1 |
| Infiltration | 1 |
| Shortness of breath | 2 |
| Have chronic diseases | 1 |
| Working in health care sector | 3 |
| Travel in the last 14 days | 3 |
| Plasma Test | Normal Range |
|---|---|
| White Blood Cells (WBC) | (4–11) |
| Lymphocytopenia | (3–9) |
| Lactate Dehydrogenase (LDH) | (140–280) |
| C-Reactive Protein (CRP) | <3 mg/L |
| Erythrocyte Sedimentation Rate (ESR) | (0–20) mm/h |
| Ferritin Level Blood Test | (12–150) ng/mL |
| Parameter | Value |
|---|---|
| No. of Nodes | 10, 20, 30, 40, 50, 60, 70, 80, 90, 100 |
| Simulation Time | 300 s |
| Channel Type | Wireless Channel |
| Routing Protocol | AODV |
| MAC Protocol | IEEE 802.11p |
| Traffic Source | CBR |
| Energy Model | Battery |
| Epoch Number | Time | Training ACC | Validation ACC | Loss | Validation Loss |
|---|---|---|---|---|---|
| 1 | 812s | 0.5487 | 0.4432 | 2.032 | 6.734 |
| 2 | 930s | 0.6319 | 0.5523 | 0.6310 | 3.007 |
| 3 | 864s | 0.7728 | 0.6312 | 0.5062 | 2.987 |
| 4 | 1064s | 0.8572 | 0.8113 | 03564 | 1.5642 |
| 5 | 952s | 0.8734 | 0.8215 | 0.2987 | 0.9832 |
| 6 | 10,242 | 0.9398 | 0.8512 | 0.1721 | 0.6743 |
| 7 | 920s | 0.9615 | 0.9123 | 0.1172 | 0.3298 |
| 8 | 991s | 0.9659 | 0.8912 | 0.1043 | 0.3353 |
| 9 | 1109s | 0.9721 | 0.9131 | 0.0817 | 0.2169 |
| 10 | 1013s | 0.9770 | 0.9331 | 0.0679 | 0.1899 |
| 11 | 1366s | 0.9417 | 0.8832 | 0.1681 | 0.2966 |
| 12 | 968s | 0.9683 | 0.8912 | 0.0915 | 0.1187 |
| 13 | 851s | 0.9671 | 0.9002 | 0.1072 | 0.1100 |
| 14 | 878s | 0.9584 | 0.8643 | 0.1121 | 0.1965 |
| 15 | 967s | 0.9528 | 0.9012 | 0.1153 | 0.2187 |
| 16 | 1353s | 0.9820 | 0.9112 | 0.0508 | 0.1652 |
| 17 | 936s | 0.9830 | 0.9198 | 0.0477 | 0.1312 |
| 18 | 1583s | 0.9919 | 0.9236 | 0.0230 | 0.1120 |
| 19 | 920s | 0.9919 | 0.9261 | 0.0271 | 0.051 |
| 20 | 1153s | 0.9963 | 0.9314 | 0.1430 | 0.0321 |
| 21 | 1923s | 0.9969 | 0.9352 | 0.0143 | 0.0222 |
| 22 | 3421s | 0.9994 | 0.9433 | 0.032 | 0.0421 |
| 23 | 1276s | 0.9957 | 0.9526 | 0.0137 | 0.0221 |
| 24 | 1397s | 0.9969 | 0.9666 | 0.077 | 0.0135 |
| 25 | 1285s | 1.000 | 0.9798 | 0.0017 | 0.0120 |
| Metric | Percentage |
|---|---|
| Accuracy | 0.9795 |
| Recall | 0.9759 |
| Precision | 0.9740 |
| Specificity | 0.9885 |
| F1-Score | 0.9729 |
| AUC | 0.9754 |
| Reference Number | Technique | Sample Size | Accuracy |
|---|---|---|---|
| [84] | COVID-Net | 5551 [53(+), 5526(−)] | 92.4% |
| [85] | ResNet-50 | 50 [25(+), 25(−)] | 95.38% |
| [28] | ResNet-50 | 100 [50(+), 50(−)] | 98.53% |
| [73] | SqueezeNet | 2496 [496(+), 2000(−)] | 97.4% |
| Proposed model | ResNet-50 | 622 [122(+), 500(−)] | 97.78 |
© 2020 by the authors. Licensee MDPI, Basel, Switzerland. This article is an open access article distributed under the terms and conditions of the Creative Commons Attribution (CC BY) license (http://creativecommons.org/licenses/by/4.0/).
Share and Cite
El-Rashidy, N.; El-Sappagh, S.; Islam, S.M.R.; El-Bakry, H.M.; Abdelrazek, S. End-To-End Deep Learning Framework for Coronavirus (COVID-19) Detection and Monitoring. Electronics 2020, 9, 1439. https://doi.org/10.3390/electronics9091439
El-Rashidy N, El-Sappagh S, Islam SMR, El-Bakry HM, Abdelrazek S. End-To-End Deep Learning Framework for Coronavirus (COVID-19) Detection and Monitoring. Electronics. 2020; 9(9):1439. https://doi.org/10.3390/electronics9091439
Chicago/Turabian StyleEl-Rashidy, Nora, Shaker El-Sappagh, S. M. Riazul Islam, Hazem M. El-Bakry, and Samir Abdelrazek. 2020. "End-To-End Deep Learning Framework for Coronavirus (COVID-19) Detection and Monitoring" Electronics 9, no. 9: 1439. https://doi.org/10.3390/electronics9091439
APA StyleEl-Rashidy, N., El-Sappagh, S., Islam, S. M. R., El-Bakry, H. M., & Abdelrazek, S. (2020). End-To-End Deep Learning Framework for Coronavirus (COVID-19) Detection and Monitoring. Electronics, 9(9), 1439. https://doi.org/10.3390/electronics9091439