Article

Gaze-Based Vehicle Driving Evaluation of System with an Actual Vehicle at an Intersection with a Traffic Light

Faculty of Engineering, University of Miyazaki, 1-1, Gakuen Kibanadai-nishi, Miyazaki-shi 889-2192, Japan
*
Author to whom correspondence should be addressed.
Electronics 2020, 9(9), 1408; https://doi.org/10.3390/electronics9091408
Submission received: 30 July 2020 / Revised: 27 August 2020 / Accepted: 28 August 2020 / Published: 1 September 2020
(This article belongs to the Special Issue Applications of Bioinspired Neural Network)

Abstract

:
Due to the population aging in Japan, more elderly people are retaining their driver’s licenses and the increase in the number of car accidents by elderly drivers is a social problem. To address this problem, an objective data-based method to evaluate whether elderly drivers can continue driving is needed. In this paper, we propose a car driving evaluation system based on gaze as calculated by eye and head angles. We used an eye tracking device (TalkEye Lite) made by the Takei Scientific Instruments Cooperation. For our image processing technique, we propose a gaze fixation condition using deep learning (YOLOv2-tiny). By using an eye tracking device and the proposed gaze fixation condition, we built a system where drivers could be evaluated during actual car operation. We describe our system in this paper. In order to evaluate our proposed method, we conducted experiments from November 2017 to November 2018 where elderly people were evaluated by our system while driving an actual car. The subjects were 22 general drivers (two were 80–89 years old, four were 70–79 years old, six were 60–69 years old, three were 50–59 years old, five were 40–49 years old and two were 30–39 years old). We compared the subjects’ gaze information with the subjective evaluation by a professional driving instructor. As a result, we confirm that the subjects’ gaze information is related to the subjective evaluation by the instructor.

1. Introduction

Due to the population aging in Japan, more elderly people are retaining their driver’s licenses [1]. However, elderly people may have characteristics such as a decrease in dynamic visual acuity, difficulty processing multiple pieces of information at the same time and the inability to make instantaneous decisions, resulting in delays in the steering wheel and brake operations. Cessation of driving simply due to advanced age may hinder independence in life, increase the risk of illnesses such as depression and shorten the life expectancy [2,3,4]. Accordingly, a method to evaluate whether elderly drivers can continue safely driving is needed. However, establishing criteria for judging the driving ability of elderly people is difficult [5]. When driving a car, 90% of relevant information is generally visual [6]. In addition, Owsley et al. [7] modeled the relationship between eye health, effective field of view and car accidents involving elderly drivers, finding that it was the effective field of view that was most related to these car accidents. Therefore, the effective field of view range is greatly involved in a person’s ability to drive a motor vehicle.
In this paper, we propose a car driving evaluation system using both the gaze information obtained from an eye tracking device (TalkEye Lite [8]) and the positional information of a traffic light obtained using image processing technology. The sampling frequency of the video and gaze information used in this paper is 30 Hz, but image processing takes time so we downsampled the frequency of the video and gaze information to 10 Hz when the evaluation was performed. In order to estimate the score near the traffic light, multiple regression analysis (MRA) was performed using the gaze information obtained from our proposed method as inputs and the subjective evaluation by a professional driving instructor as the target output. This paper shows the automatically driving evaluation method to have the most similarity to a professional driving instructor’s evaluation during actual car driving.

2. Previous Studies about Gaze Estimation Method for Driving the Car

With the increase in car driving accidents, studies of detection of fatigue during driving using speech recognition [9] and detection of sleepiness using a percentage of eyelid closure (PERCLOS) [10] and driver’s head location and eye status [11] have been conducted. Although fatigue and sleepiness can be detected using these methods, they are insufficient as a method for determining driving ability because the driver’s aptitude judgment is needed. Paper [12] showed the car driving evaluation in a driving simulator to apply for car automated driving. However, paper [12] does not have the research of car driving evaluation that includes gaze information using an actual car driving.
The driving aptitude of the elderly driver is judged by measuring driving skill, presence or absence of visual field abnormality and cognitive ability. Usually, driving aptitude is judged by each measurement (driving skill, visual field abnormality, cognitive ability). However, to determine the driver’s driving suitability by measuring the visual information and reaction speed using a gaze tracking device is researched using a driving simulator and an actual vehicle.
Regarding visual field abnormalities during driving, studies focusing on the number of fixations [13], average fixation time, average eye movement distance and focusing on the narrowing of the gaze range and peripheral visual field [14,15,16] have been conducted. Although distraction can be detected using these methods, they are insufficient as a method for determining the cause of distraction. In addition, these studies were carried out using driving simulators, which is less ecologically valid and generalizable than evaluating on-road driving in an actual vehicle. Moreover, in reference [13,14,15], it was not possible to know whether the driver was aware of the information on the road (e.g., pedestrians, traffic lights, road signs). Our proposed method can finally determine what specifically the driver is looking at using the image from the view camera. Therefore, our system can calculate the visual attention for the traffic light while driving, which is a useful method to prevent car accidents.

3. Results

We used a GPS device and an eye tracking device to obtain eye information in a specific area. In this chapter, we introduce the eye tracking and GPS devices. The eye tracking device is the same as in reference [16].

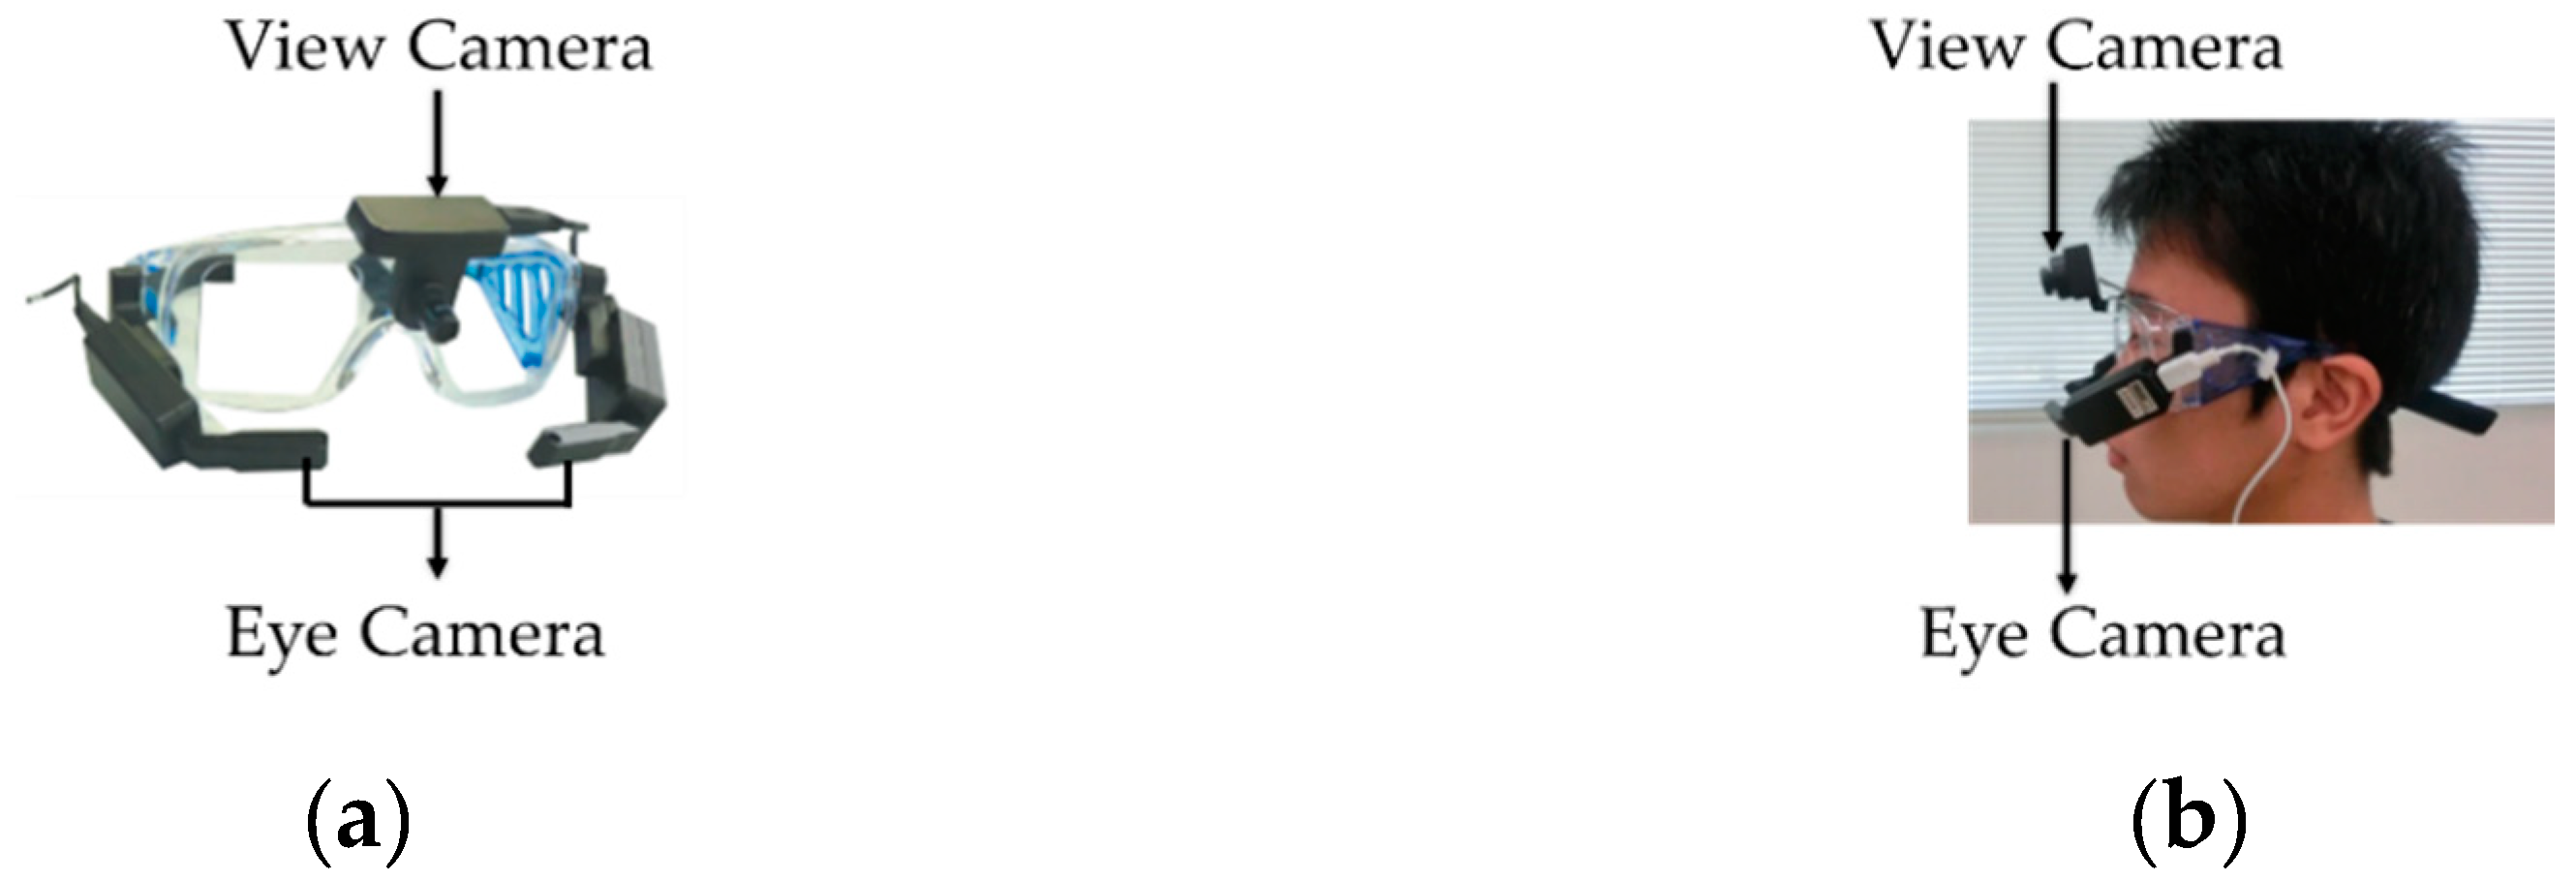
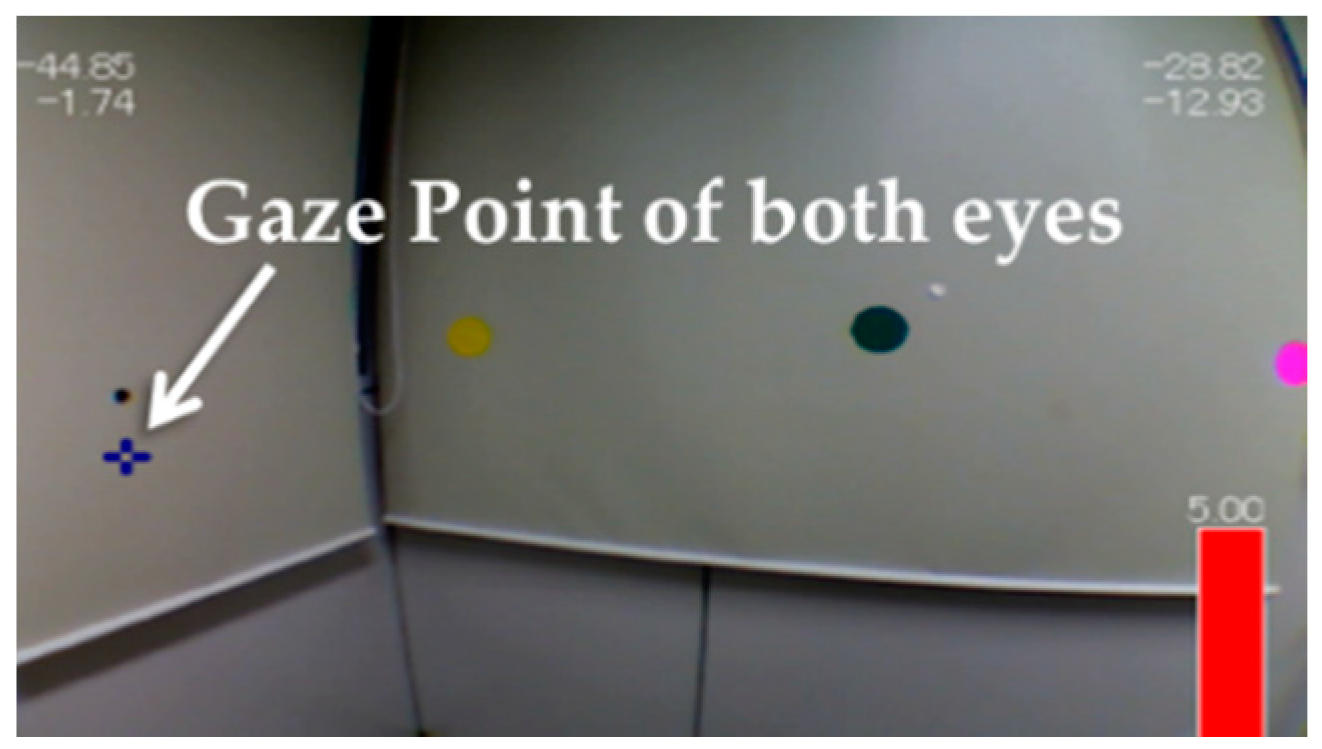
3.1. Measurement System Using TalkEye Lite

TalkEye Lite [8] is a wearable eye movement measurement system that connects directly to the processing computer and uses a USB camera for eye detection and visual field recording. Through its USB camera, TalkEye Lite can track the pupil of the subject; therefore, using the TalkEye Lite software allows us to see what the subject is looking at. The overlay display on the visual field image includes not only the left and right viewpoints but also the center axis of the gaze of both eyes. Figure 1a is a picture of the TalkEye Lite goggle with arrows indicating its view camera and its eyeball camera and Figure 1b is a picture of a person wearing the TalkEye Lite goggle.
The blue cross points in Figure 2 indicate the gaze of both eyes. The eye motion analysis program can analyze visual videos recorded by the TalkEye Lite, enabling us to determine at which target the subject was looking. It is possible to calculate the angle of convergence using the angle data of both eyes. The angle is expressed in degrees in values ranging from −180 degrees to +180 degrees.

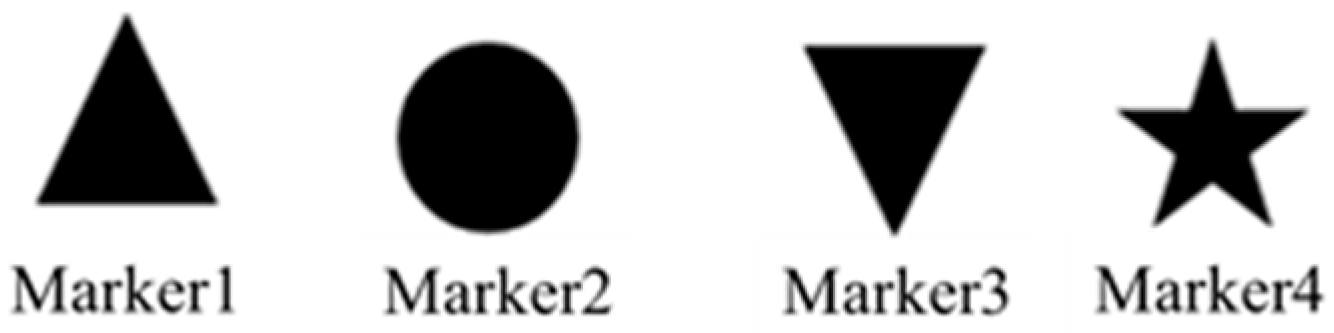
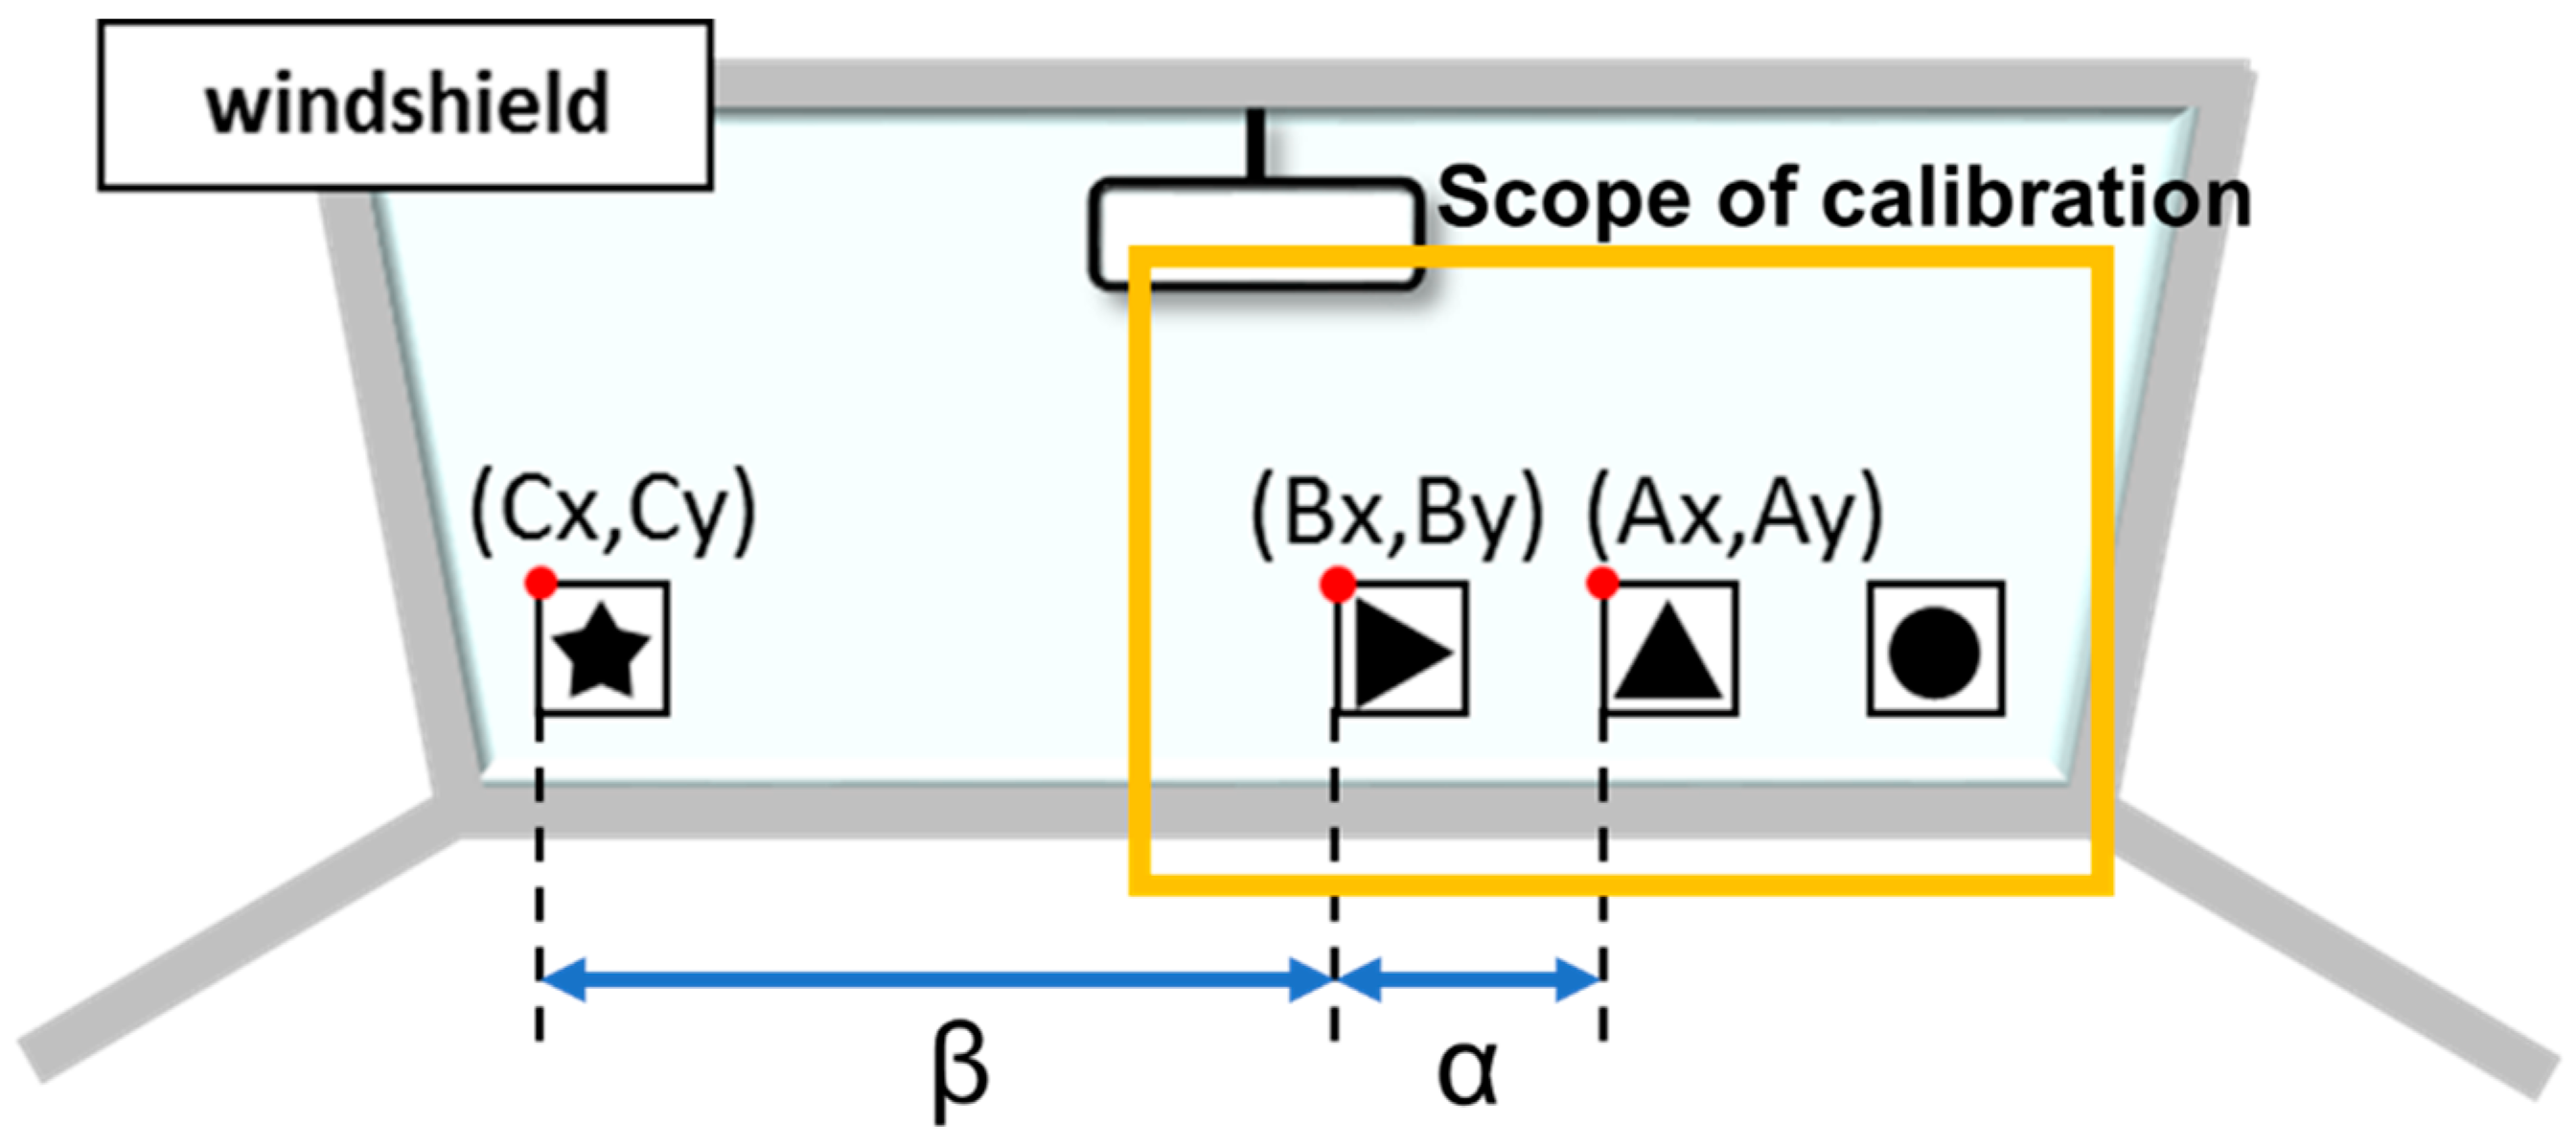
3.2. The Head Angle Estimation Method Using Template Matching

The head angle estimation method [16] is used in this paper. We used the viewing camera of the TalkEye Lite to obtain the head movement information. Although the head angle estimation method using the RGB-D sensor needs to set a sensor, the head angle estimation method using the proposed template matching uses a field of view camera attached to the TalkEye Lite. Therefore, our proposed method has the merit that it can be easily used in various environments. Since the estimation of the line of sight and the head angle is performed during actual car driving, it is necessary to use a method that can estimate the line of sight given the restricted physical space available for equipment and measurement; template matching accomplishes this. We installed four templates as shown in Figure 3 (Marker1, an upward triangle; Marker2, a circle; Marker3, a downward triangle; and Marker4, a star) on the front glass of the car.
This system required calibration prior to data collection onset. We defined the forward-facing position of the head as angle 0 degrees. We placed the markers (Marker1, Marker2, Marker3 and Marker4) on the dashboard of the car as shown in Figure 4, with one of the three markers directly in front of the driver (0 degrees). We asked the driver to face forward for five seconds in order to record the reference position for each of the three markers. These reference positions were used for template matching. The driver’s head angle was calculated after determining the head movement amount “a” using the difference between the current marker’s position and the reference position. Marker4 was excluded from calibration because Marker4 did not appear on the screen when facing the front. Therefore, the reference position of the star marker was calculated using the ratio of α and β as shown in Figure 4. The coordinates of Cx were obtained by transforming Equation (1), as in Equation (2), to Equation (3).
Bx = β A x + α C x α + β
( α + β ) Bx = β A x + α C x
α C x = α Bx β Bx + β A x
C x = 1 α { β ( A x Bx ) α Bx } .

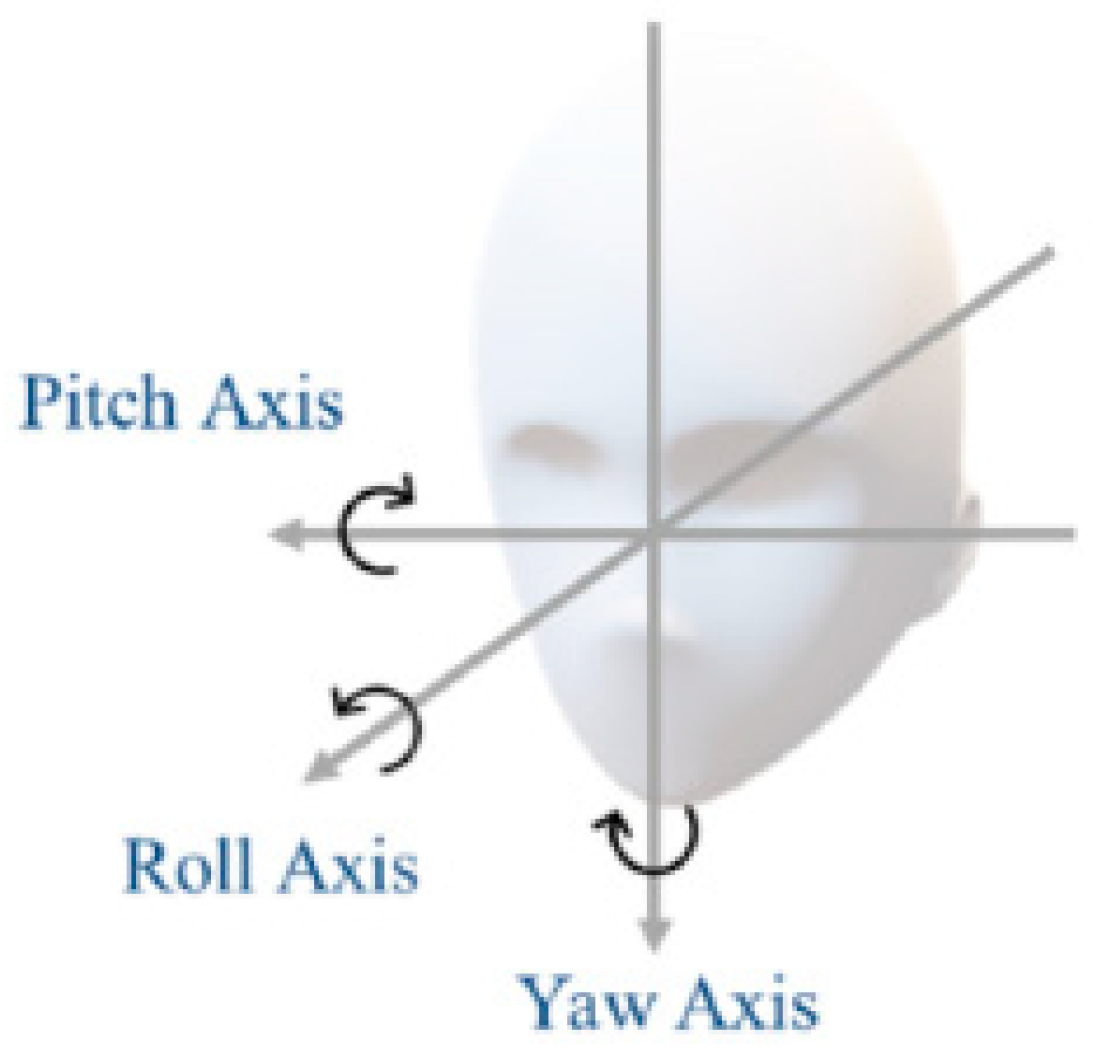
3.2.1. Estimating Inclination of Head

As for the inclination of the head, there are three axis directions: the yaw axis, the pitch axis and the roll axis (Figure 5). The yaw angle and the pitch angle are necessary for gaze estimation. The yaw angle and the pitch angle of the head were calculated using differences in the recorded marker coordinates. If the yaw axis and the pitch axis changed while the roll axis of the head was inclined, the head orientation angle could not be estimated correctly. An example is shown in Figure 6. When the head roll axis (θ in Figure 6) was tilted and if the b degree moved to the right, the marker position moved a pixel. Therefore, when the roll axis rotated, we first needed to determine the roll angle. After calculating the roll angle, the coordinate transformation was performed. The deviation of the estimated angle due to the movement of the roll angle is shown in Figure 5. The deviation of the yaw axis can be calculated by a acos θ and the deviation of the pitch axis by asin θ . By considering these deviations, we obtained coordinates converted to a zero roll angle, solving the problem caused by the inclination of the head.

3.2.2. Calculation of the Roll Angle

The formula for calculating the roll angle is shown in Equation (5). Letting the coordinates of the two found markers be ( x 1 , y 1 ) and ( x 2 , y 2 ), the roll angle could be calculated by Equation (5). However, it was a condition of x 2 > x 1 .
θ = tan 1 ( y 2 y 1 x 2 x 1 )
θ : Roll angle; ( x 1 , y 1 ) and ( x 2 , y 2 ): the coordinates of the two markers found.

3.2.3. Calculation of Yaw Angle and Pitch Angle

The yaw angle and the pitch angle were calculated by obtaining the movement amount of a pixel of the marker from (x’, y’) obtained by the rotation conversion in Equations (6) and (7). x, y indicates the coordinates of the marker before the coordinate transformation and x’, y’ indicates the coordinates after transformation. Equations (8) and (9) show equations for calculating the yaw angle and pitch angle. For example, if the coordinate of the marker moved a pixel horizontally, the head inclined at an angle shown in Equation (8) with respect to the yaw angle.
x = x cos θ y sin θ
y = x sin θ + ycos θ
Y a w   f a c e   a n g l e = a C a m e r a   r e s o l u t i o n C a m e r a   v i e w i n g   a n g l e   ( deg )
P i t c h   f a c e   a n g l e = b C a m e r a   r e s o l u t i o n C a m e r a   v i e w i n g   a n g l e   ( deg )
where a is the horizontal movement amount of the marker (pixel) and b is the vertical movement amount of the marker (pixel).
The recognition accuracy of the template matching was 90.2% and the average error of the head angle estimation was 4.1 degrees.

3.3. GPS Information

In this paper, we used high-precision Global Positioning System (GPS) information to extract the information within a specific area of the driving course, which contained a traffic light. The video extracted by GPS was about 30 seconds. Figure 7a shows the plot map from the GPS information with the red rectangle representing the traffic area, the white point representing the car and the white line representing the driving trajectory. Figure 7b is a still image of the intersection with the traffic light. In our driving experiment, car drivers almost did not change the head position due to back and forward movement. Moreover, the change of the yaw angle and the pitch angle of the head orientation by the change of the head position did not occur in the driver’s seat. Therefore, our proposal method did not use the back and forward movement of the head position.

4. Proposed Method

Humans constantly move and stop their eyes in order to recognize the shapes and colors of objects in their environments. In the eye movement field, the gaze fixation is defined as the maintaining of the visual gaze on a single location or the gaze movement between two saccades. A saccade is a rapid eye movement performed by humans to obtain information. Humans require a fixed latency of 150 to 250 milliseconds at the start of a saccade [17] so the gaze must remain at least 150 milliseconds between gaze and saccade. In order to detect gaze fixation using saccade information, the sampling frequency should be over 14 Hz [18]. However, the sampling frequency of the data recorded by the TalkEye Lite is 10 Hz, which is not high enough to use saccades to identify the gaze fixation condition. In this paper, we propose the identification of the gaze fixation condition using not saccades but position relationship between the gaze point and the traffic light point as described in Figure 8. The conditions labeled 4.1 to 4.4 in Figure 8 are further described below.

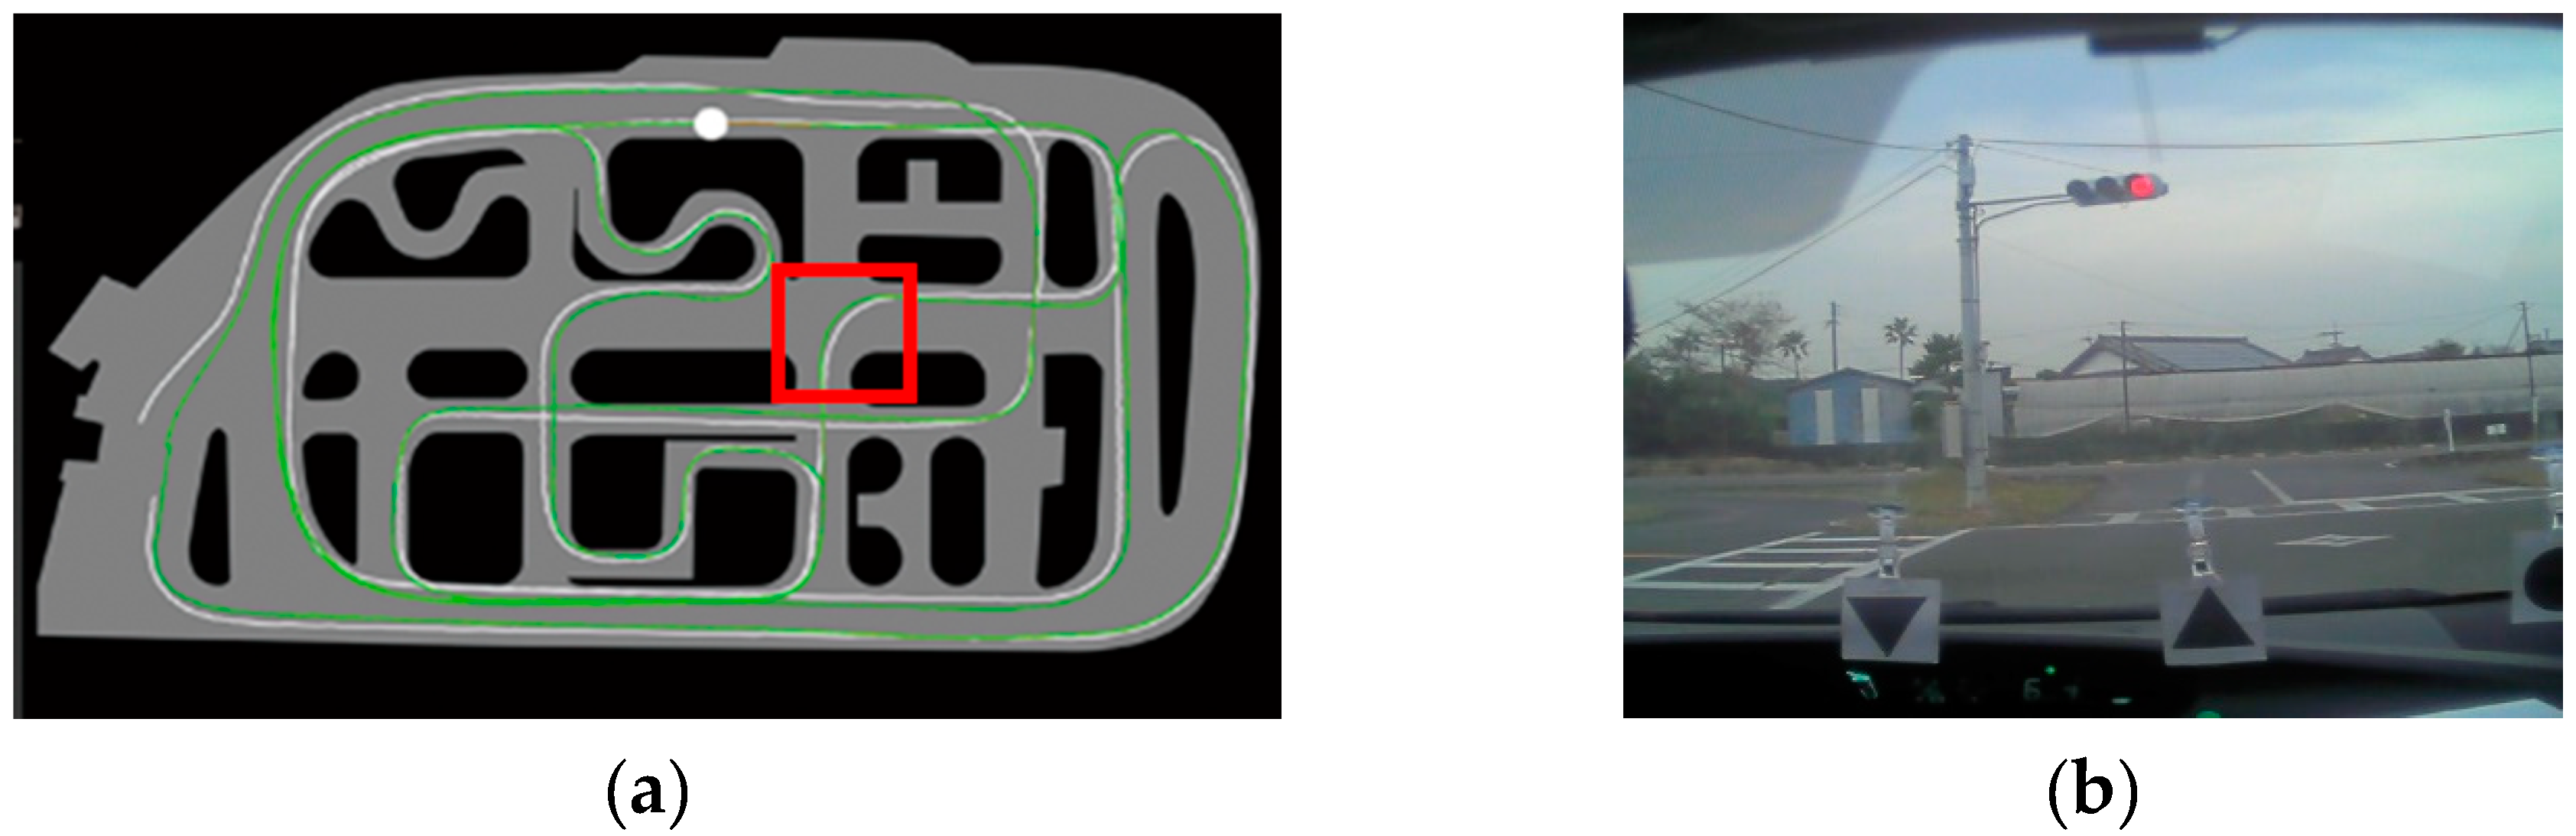
4.1. The Traffic Light in the Video is Recognized by Image Processing

In order to recognize the traffic signal in the videos, we focused on the recognition rate due to environmental changes (clear, cloudy, rain) and compared six image processing methods. Table 1 shows the comparison results. Regarding the recognition method using color features, it was confirmed that the traffic light could not be recognized due to the taillight of the preceding vehicle, surrounding signboards, strong sunlight, etc. [19,20,21,22]. We confirmed the recognition rates and environmental responses of YOLOv2 and YOLOv2-tiny [23]. The 11,034 traffic light images such as in Figure 7b were learned by YOLOv2 and YOLOv2-tiny models in the learning environment (Table 2). To confirm the accuracy of YOLOv2-tiny, we used three daytime videos. In this paper, the recognition rate refers to the ratio of the recognized traffic light frames among the reflected traffic light in the video. For YOLOv2-tiny, the recognition rate was over 93.0%. It was almost 100% for the 22 subjects’ videos used in this paper. The processing time was 0.07 seconds/frame in the execution environment (Table 2).
As indicated in Table 1, YOLOv2-tiny had the highest recognition rate and the best environmental response.

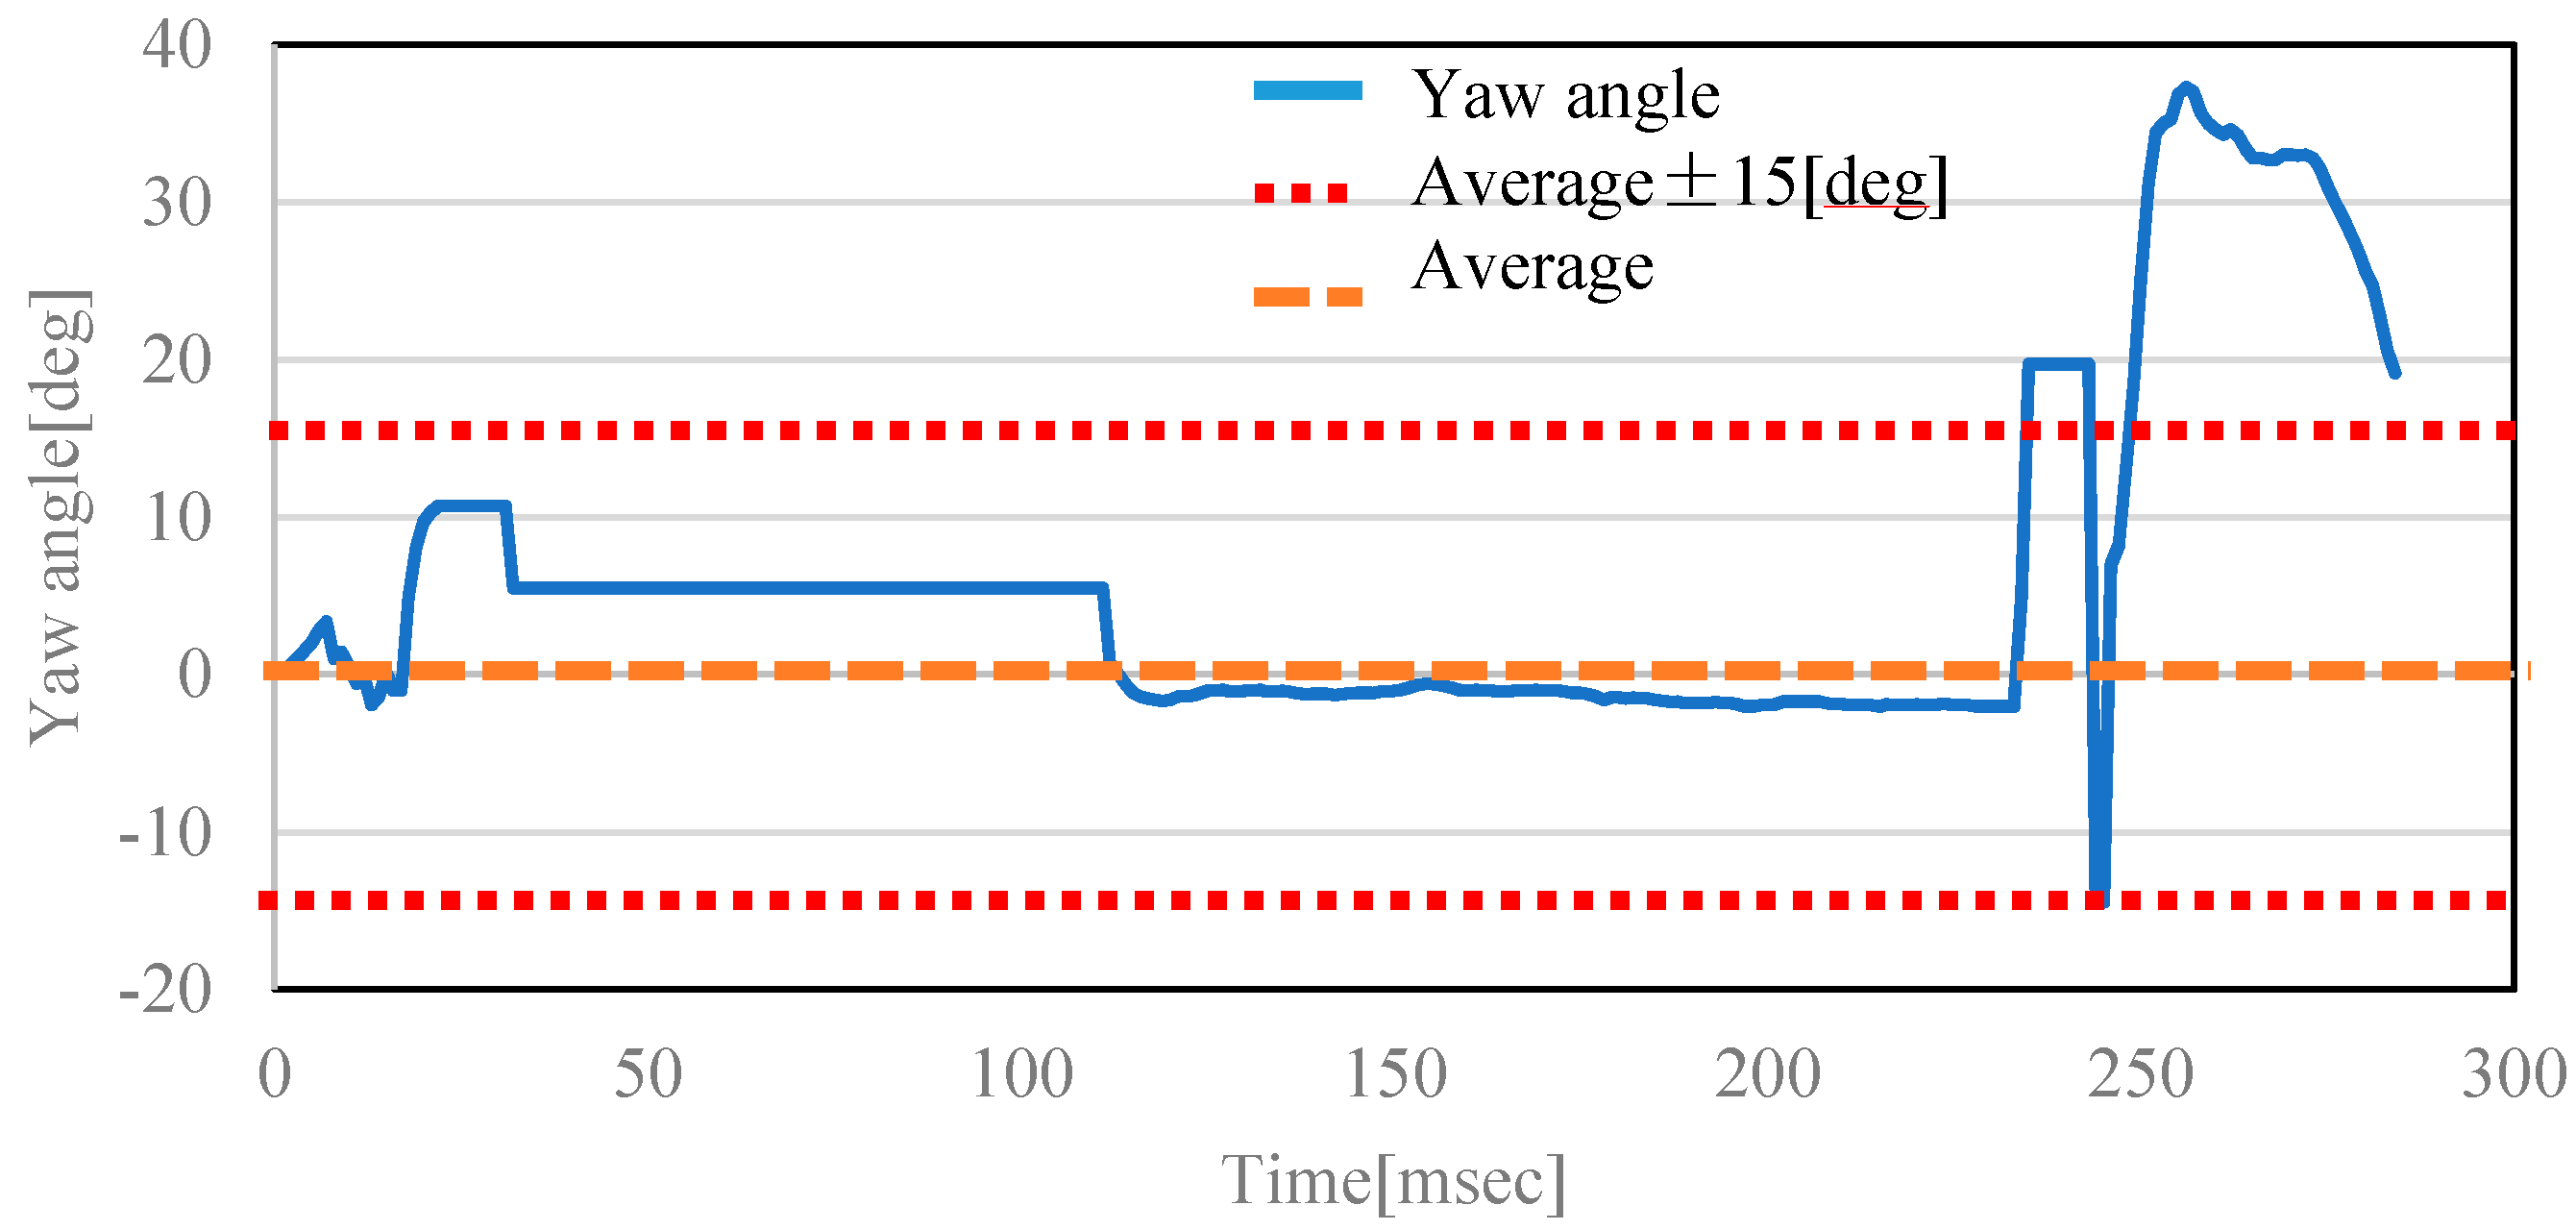
4.2. The Driver Faces the Front

In this condition, the face angle estimation method [16] explained in Chapter 3.2 was used. We defined the front as the area within ±15 degrees of the average yaw angle at the intersection based on reference [24]. In addition, right and left confirmation states were outside of this range. This condition was based on the driver’s face angle from reference [16] technology and the knowledge of the driver’s driving behavior evaluation based on ease of oversight of pedestrians considering the effective human visual field and visual characteristics and head posture [24]. Figure 9 shows the yaw angle of an example driver’s face while at the intersection. When the driver faced to the right, the yaw angle had a positive value over +15 degrees. Figure 9 shows that this driver did not face left but right when turning to the right.

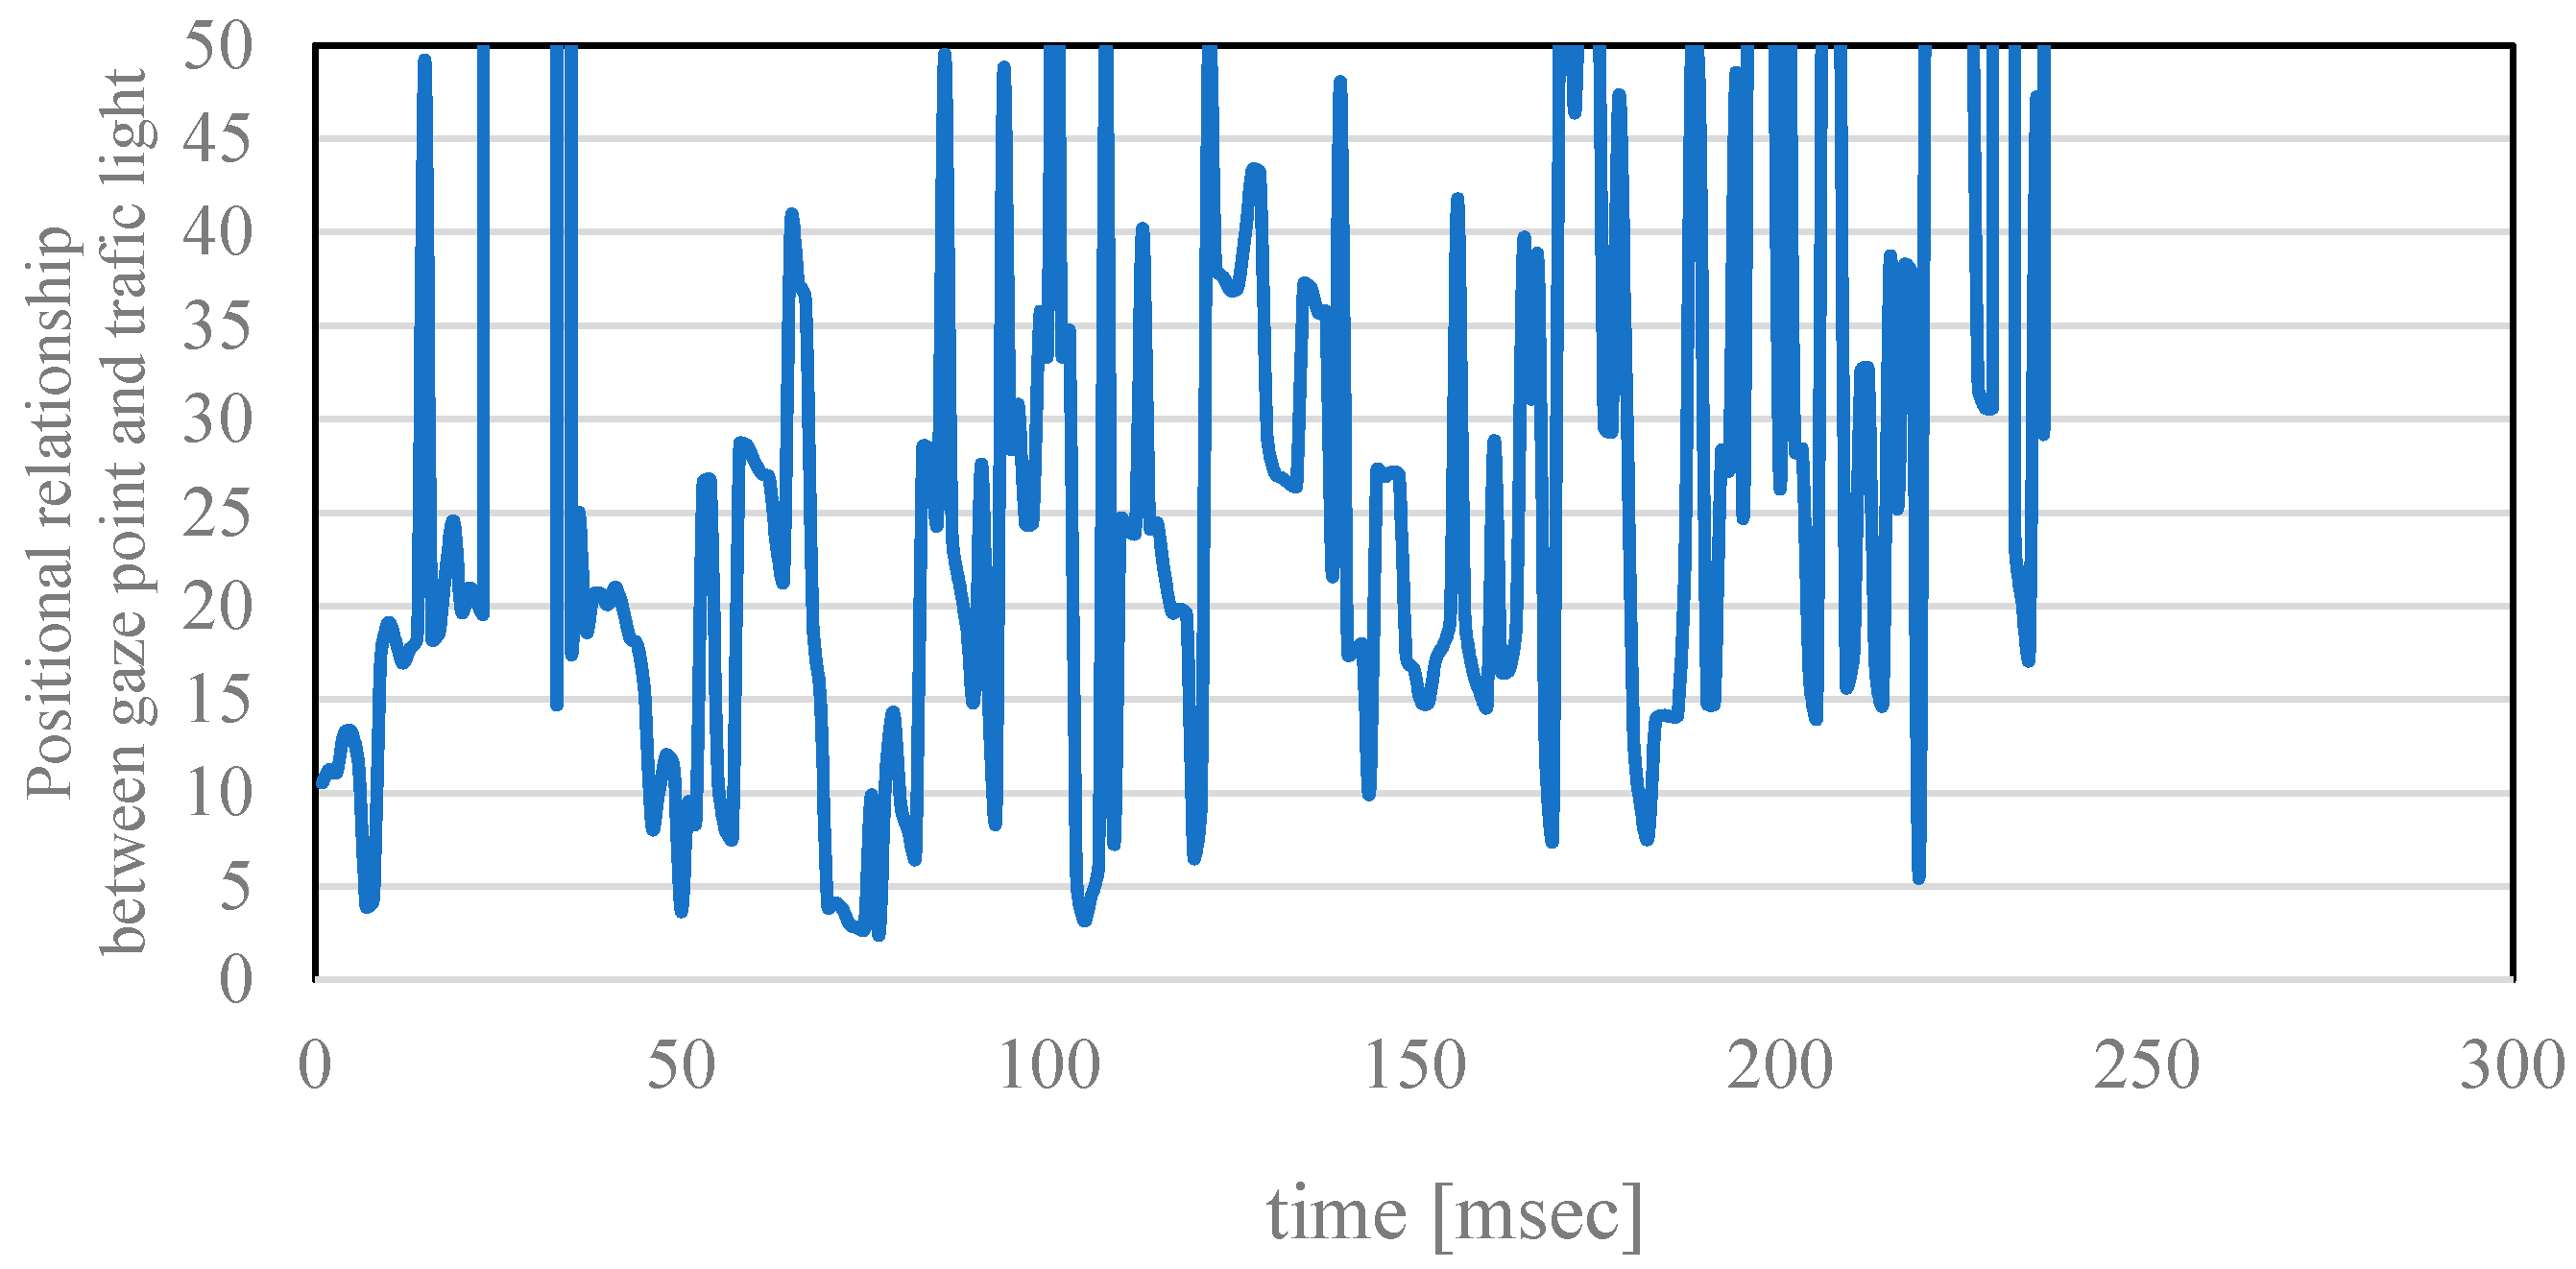
4.3. The Traffic Light Exists Within the Visual Effective Field

First, we obtained the traffic light center coordinates ( x t , y t ) by detecting the traffic light (4.1). Second, the pixel distance between the traffic light center coordinates ( x t , y t ) and the gaze coordinates ( x g , y g ) obtained from the eye tracking device was calculated by Equation (10).
pixel   distance = ( x t x g ) 2 + ( y t y g ) 2 .
The system could calculate the numerical value that could be used to determine whether the traffic light was within the effective field of view; the amount of change in the angle per one pixel in the video was 0.07/pixel in the specific driving school. Figure 10 shows the positional relationship between the gaze point and the traffic light at the intersection. Figure 10 shows that this driver looked near a traffic light or looked around. The effective field narrows with aging [25] so we changed the threshold of the effective field of view from 10 to 25 every 5 relates to d fixation time decreasing.

4.4. The Conditions from 4.1 to 4.3 are Satisfied for 300 Milliseconds or More

This condition is based on visual information processing and can be described in terms of a two-level model [26,27,28,29]. At the first level, objects are dynamically localized in the 3D environment that is ‘ambient’. These objects, or rather ‘blobs’, are identified at the second level. Fixation duration was from 150 to 250 milliseconds in the first level and increased to 500 milliseconds in the second level. Additionally, according to previous research [30,31], the number and duration of eye fixations can be important metrics for a visual recognition range when facing a dangerous traffic situation.
Our proposed method recorded the total eye fixation time (seconds), the number of eye fixations, the minimum distance and the average distance during the gaze fixation. Using this gaze information and the driver’s age, we examined whether gaze evaluation at intersections was possible. Hereafter, the notation for variable naming will be according to this example: “the number of eye fixations 20” is the number of eye fixations when an effective field is 20 degrees.

5. Experimental Methods and Results

In this chapter, we investigate whether our proposed method was able to evaluate gaze information near traffic. The subjects were 22 general drivers (two were 80–89 years old, four were 70–79 years old, six were 60–69 years old, three were 50–59 years old, five were 40–49 years old and only one test drive without training and they drove for six to fifteen minutes in the driving school course. Table 3 and Table 4 show the subjects’ gaze information from our proposed method. We investigated the relationship between the gaze information and the three-level subjective evaluation (0/0.5/1) by the driving school instructors. The evaluation area was limited to the traffic signal area. Subjective evaluation was performed by the following items: focusing on the signal confirmation, left and right safety confirmation, over the stop line, oncoming lane confirmation, right side and right rear confirmation. Regarding evaluation, 0 was bad, 0.5 was intermediate and 1 was good.
Here, we explain S.D.A.P. (Smart Driving Assessment Program) [32], which is one of the driving skill evaluation systems developed by OFA SUPPORT INC for driving schools. S.D.A.P. operates the steering wheel, accelerator, brake, etc. to evaluate driving technique. The score obtained from the S.D.A.P. (S.D.A.P. score) is deducted from 0. In this paper, the S.D.A.P. score is used as reference data. Table 3 shows the subjective evaluation (0/0.5/1) as the relationship of the S.D.A.P. score. Multiple regression analysis (MRA) tools used the four gaze information (the total eye fixation time seconds, the number of eye fixations, the minimum distance and the average distance) and driver’s age as inputs and the subjective evaluation (0/0.5/1) as the target output. We used an alpha value of 0.05 to evaluate the statistical significance of predictors. The proposed method automatically obtained Almost the same evaluation as the driving instructor from this methodology.

5.1. Result Using Various Variables as Inputs

As shown in Table 5, when MRA was performed using age, number of fixations 20, minimum distance 15, average distance 15, minimum distance 20, average distance 20 and average distance 25 as inputs and the subjective evaluation (0/0.5/1) as the target output, the p-value of each coefficient was less than our alpha of 0.05. The number following the variable name in Table 5 represents the threshold of the effective field of view. As shown in Figure 11, the coefficient of determination was 0.7382 so these seven variables were related to the subjective evaluation by the instructor. Additionally, the recognition rate was 100% for the instructor’s evaluation of a score of 0.5 (threshold: maximum of 0, minimum of 1). However, the sample size was low at 22 subjects so this result is unreliable. Therefore, we ran a second MRA model with fewer variables.

5.2. Result Using Subjects’ Age and the Number of Fixations as Inputs

As shown in Table 6, when MRA was performed using only age and number of fixations 20 as inputs and the subjective evaluation (0/0.5/1) as the target output, the p-value of each coefficient was less than 0.05. As shown in Figure 12, the coefficient of determination was 0.5517 so these two variables were related to the subjective evaluation by the instructor. Additionally, the recognition rate was 86.4% for the instructor’s evaluation of a score of 0.5 (threshold: maximum of 0, minimum of 1).

5.3. Discussion

In this section, we will discuss the results and compare our previous work [8] with our updated proposed method.
From the results of MRA model 1 (Section 4.1), the recognition rate of the subjective evaluation level of 0.5 was 100%. While there were seven input variables used for MRA model 1, the sample size used in this paper was underpowered at 22 subjects. Therefore, we consider that this evaluation does not have high reliability and we must increase the number of subjects in order to evaluate MRA model 1.
From the results of MRA model 2 (Section 4.2), the recognition rate of the subjective evaluation level of 0.5 was 86.4%. The subject with the lowest rating among subjective evaluation of 0.5 was considered valid because we verified that the subject’s driving skill was low as indicated by the driving ability evaluation system (S.D.A.P. [32]).
Sakurai et al. [16] proposed a method wherein the driver’s gaze range was estimated while driving the entire test course. Our proposed method used GPS information to extract only the gaze data near the intersection on the test course and performed the evaluation within this specific area. Therefore, our proposed method could not evaluate the subjects’ gaze over the entire course.

6. Conclusions

In this paper, we proposed to apply the experimental method of our previous study [16]. The proposed method used GPS information to extract the video and eye information at an intersection with a traffic light. In addition, we extended the functions of our car driving ability evaluation system using image processing and eye information. We mainly carried out three things:
(1)
We defined the condition for eye fixation, one of the eye movements, using the coordinates of the traffic light in the video obtained by the image processing and the coordinates of the gaze obtained from the eye tracking device.
(2)
We constructed the system to extract the gaze information about eye fixation.
(3)
We investigated the ability of gaze information and drivers’ ages to predict the three-level subjective evaluation given by the professional driving instructor.
The coefficient of determination was more than 0.5, indicating a relationship between the gaze information obtained by our proposed system and the subjective evaluation by the driving instructor. We consider that this result about the gaze information for the traffic light will help prevent car accidents. Our driving evaluation system was performed automatically and helps to review elderly drivers’ driving ability. It is worth, for accurate evaluation, to be able to evaluate in a free and normal environment without instructors. The final objective of this paper was to construct a car driving evaluation system that could determine whether elderly drivers are safe to continue driving.
As our future issues, we should confirm the result adding other object (stop sign, a pop-up doll and so on). And we consider using the NIRS (Near-infrared spectroscopy) as the other objective data to improve our proposed method accuracy.

Author Contributions

T.S. from University of Miyazaki developed the system, performed the experiments and wrote the manuscript; H.T. from University of Miyazaki managed the research project and revised the manuscript; K.S. from University of Miyazaki managed the research project and revised the manuscript; L.T. from University of Miyazaki revised the manuscript. All authors have read and agreed to the published version of the manuscript.

Funding

This research was funded by OFA SPPORT INC.

Conflicts of Interest

The authors declare no conflict of interest.

References

  1. Cabinet Office in Japan. Preventing Traffic Accidents Involving the Elderly. The Current Situation Surrounding the Elderly. Available online: https://www8.cao.go.jp/koutu/taisaku/h29kou_haku/zenbun/genkyo/feature/feature_01.html (accessed on 16 March 2020). (In Japanese).
  2. Negative Effects of Operation Suspension. Available online: https://www.ncgg.go.jp/cgss/department/cre/gold/about/page2.html (accessed on 16 March 2020). (In Japanese).
  3. Shimada, H.; Makizako, H.; Tsutsumimoto, K.; Hotta, R.; Nakakubo, S.; Doi, T. Driving and Incidence of Functional Limitation in Older People: A Prospective Population-Based Study. Gerontology 2016, 62, 636–643. [Google Scholar] [CrossRef] [PubMed]
  4. Shimada, H.; Makizako, H.; Doi, T.; Lee, S. Lifestyle activities and the risk of dementia in older Japanese adults. Geriatr. Gerontol. Int. 2018, 18, 1491–1496. [Google Scholar] [CrossRef] [PubMed]
  5. Schultheis, M.T.; Deluca, J.; Chute, D.L. Handbook for the Assessment of Driving Capacity; Academic Press: San Diego, CA, USA, 2009. [Google Scholar]
  6. Hartman, E. Driver vision requirements. Soc. Automot. Eng. 1970, 629–630. [Google Scholar] [CrossRef]
  7. Owsley, C.; Ball, K.; Sloane, M.E.; Roenker, D.L.; Bruni, J.R. Visual/cognitive correlates of vehicle accidents in older drivers. Psychol. Aging 1991, 6, 403–415. [Google Scholar] [CrossRef] [PubMed]
  8. Takei Scientific Instruments Cooperation. Available online: https://www.takei-si.co.jp/en/productinfo/detail/65.html (accessed on 16 March 2020).
  9. Krajewski, J.; Trutschel, U.; Golz, M.; Sommer, D.; Edwards, D. Estimating fatigue from predetermined speech samples transmitted by operator communication systems. In Proceedings of the 5th International Driving Symposium on Human Factors in Driver Assessment, Training and Vehicle Design, Big Sky, MT, USA, 22–25 June 2009. [Google Scholar] [CrossRef]
  10. Daza, I.G.; Hernandez, N.; Bergasa, L.M.; Parra, I.; Yebes, J.J.; Gavilan, M.; Quintero, R.; Llorca, D.F.; Sotelo, M.A. Drowsiness monitoring based on driver and driving data fusion. In Proceedings of the 14th International IEEE Conference on Intelligent Transportation Systems (ITSC), Washington, DC, USA, 5–7 October 2011; pp. 1199–1204. [Google Scholar]
  11. Han, C.C.; Pai, Y.J.; Lee, C.H. A Fast Implementation Framework for Drowsy Driving Detection on Embedded Systems. In Proceedings of the 2019 International Conference on Machine Learning and Cybernetics (ICMLC), Kobe, Japan, 7–10 July 2019; pp. 854–860. [Google Scholar]
  12. Gao, F.; He, B.; He, Y. Detection of Driving Capability Degradation for Human-machine Cooperative Driving. Sensors 2020, 20, 1968. [Google Scholar] [CrossRef] [Green Version]
  13. Kunishige, M.; Fukuda, H.; Iida, T.; Kawabata, N.; Ishizuki, C.; Miyaguchi, H. Spatial navigation ability and gaze switching in older drivers: A driving simulator study. Hong Kong J. Occup. Ther. 2019, 32, 22–31. [Google Scholar] [CrossRef] [Green Version]
  14. Van Leeuwen, P.M.; Happee, R.; de Winter, J.C.F. Changes of driving performance and gaze behavior of novice drivers during a 30-min simulator-based training. Procedia Manuf. 2015, 3, 3325–3332. [Google Scholar] [CrossRef] [Green Version]
  15. Reimer, B. Impact of Cognitive Task Complexity on Drivers’ Visual Tunneling. Transp. Res. Rec. J. Transp. Res. Board 2009, 2138, 13–19. [Google Scholar] [CrossRef]
  16. Sakurai, K.; Tamura, H. A Study on Gaze Range Calculation Method during an Actual Car Driving Using Eyeball Angle and Head Angle Information. Sensors 2019, 19, 4774. [Google Scholar] [CrossRef] [PubMed] [Green Version]
  17. Koga, K. The Eye Movement Research Handbook; Japan Institute for Science of Labor: Tokyo, Japan, 1998. (In Japanese) [Google Scholar]
  18. Ohsuga, T.; Tanaka, M.; Niiyama, Y.; Inoue, H. Experimental Study on Eye Fixation Time in Opinion Test with Food Pictures. Trans. Soc. Instrum. Control. Eng. 2013, 49, 880–886. [Google Scholar] [CrossRef]
  19. Matsuo, H.; Kimura, K. Traffic Lights Recognition Using Learning and Detecting Shape and Color, IPSJ SIG Technical Report. Ipsj Sig Notes Cvim 2014, 2014, 1–7. (In Japanese) [Google Scholar]
  20. Research on Traffic Light Recognition Method for Tsukuba Challenge. Available online: http://www.ail.cs.gunma-u.ac.jp/ailwiki/index.php (accessed on 16 March 2020). (In Japanese).
  21. Omachi, M.; Omachi, S. Fast Detection of Traffic Light with Color and Edge Information; The Institute of Image Electronics Engineers of Japan: Tokyo, Japan, 2009; Volume 38, pp. 673–679. (In Japanese) [Google Scholar]
  22. Moizumi, H.; Sugaya, Y.; Omachi, M.; Omachi, S. Traffic Light Detection Considering Color Saturation Using In-Vehicle Stereo Camera. J. Inf. Process. 2016, 24, 349–357. [Google Scholar] [CrossRef]
  23. Redmon, J.; Farhadi, A. YOLO9000: Better, Faster, Stronger. In Proceedings of the 2017 IEEE Conference on Computer Vision and Pattern Recognition (CVPR), Honolulu, HI, USA, 21–26 July 2017; pp. 6517–6525. [Google Scholar]
  24. Yamasaki, A.; Raksincharoensak, P.; Shino, M. Extraction of Driver’s Gaze Region by Face Direction Estimation Using On-board Cameras. In Transactions of the Society of Automotive Engineers of Japan; Society of Automotive Engineers of Japan: Tokyo, Japan, 2017; Volume 48, pp. 1113–1119. (In Japanese) [Google Scholar]
  25. Salvi, S.M.; Akhtar, S.; Currie, Z. Ageing changes in the eye. Postgrad. Med. J. 2006, 82, 581–587. [Google Scholar] [CrossRef] [PubMed]
  26. Hoffman, J.E. Stages of processing in Visual Search and Attention. In Stratification in Cognition and Consciousness; Challis, B.H., Velichkovsky, B.M., Eds.; John Benjamins: Amsterdam, The Netherlands; Philadelphia, PA, USA, 1999; pp. 43–71. [Google Scholar]
  27. Trevarthen, C. Two visual systems in primates. Psychologische Forschung 1969, 31, 321–337. [Google Scholar]
  28. Velichkovsky, B.M. Visual Cognition and its Spatial-Temporal Context. In Cognitive Research in Psychology; Klix, F., Hoffmann, J., van der Meer, E., Eds.; North Holland: Amsterdam, The Netherlands, 1982; pp. 30–48. [Google Scholar]
  29. Pomplun, M. Analysis and Models of Eye Movements in Comparative Visual Search; Cuvillier: Göttingen, Germany, 1998. [Google Scholar]
  30. Velichkovsky, B.M.; Rothert, A.; Miniotas, D.; Dornhoefer, S.M.; Joos, M.; Pannasch, S. Visual Fixations as a Rapid Indicator of Hazard Perception. In Operator Functional State and Impaired Performance in Complex Work Environments Amsterdam/Washington; Hockey, G.H.R., Gaillard, A.W.K., Burov, O., Eds.; IOS Press: Amsterdam, The Netherlands, 2003; pp. 313–321. [Google Scholar]
  31. Sun, Q.; Xia, J.C.; He, J.; Foster, J.K.; Falkmer, T.; Lee, H. Towards unpacking older drivers’ visual-motor coordination: A gaze-based integrated driving assessment. Accid. Anal. Prev. 2018, 113, 85–96. [Google Scholar] [CrossRef] [PubMed]
  32. OFA Support. S.D.A.P. Available online: http://minamikyusyu-car.main.jp/sdap/ (accessed on 17 March 2020). (In Japanese).
Figure 1. The TalkEye Lite measurement system: (a) the TalkEye Lite goggle; (b) a person wearing the TalkEye Lite goggle.
Electronics 09 01408 g001
Figure 2. The TalkEye Lite operation image.
Electronics 09 01408 g002
Figure 3. Types of markers.
Electronics 09 01408 g003
Figure 4. Between range to be calibrated, marker distance ratio and the coordinate positions of the marker. α, β means the ratio between the markers.
Electronics 09 01408 g004
Figure 5. Head direction axes used for template matching.
Electronics 09 01408 g005
Figure 6. The flow of head angle estimation using template matching.
Electronics 09 01408 g006
Figure 7. Experimental environment: (a) the plot map from the GPS information; (b) an image of the intersection with a light.
Electronics 09 01408 g007
Figure 8. The flow of our proposed method.
Electronics 09 01408 g008
Figure 9. The yaw angle of a driver’s face at the intersection.
Electronics 09 01408 g009
Figure 10. The positional relationship between the gaze point and the traffic light point.
Electronics 09 01408 g010
Figure 11. Results of MRA model 1.
Electronics 09 01408 g011
Figure 12. Results of MRA model 2.
Electronics 09 01408 g012
Table 1. Comparative results for various image processing methods.
MethodRecognition Rate
Haar-like feature + Adaboost [19]80.0%
RGB →HSV +
Extraction of specific color +
Noise removal [20]
84.0%
RGB → Normalized RGB + Extraction of candidate region +
Extraction of edge +
Apply to the circle equation [21]
86.6%
Histogram + Kalman filter [22]86.0%
YOLOv2 [23]87.4%
YOLOv2-tiny [23]93.0%
Table 2. PC environment for recognizing the traffic light.
Learning Environment Execution Environment
Memory16 GBMemory8 GB
CPUCore i7 8700 (3.2 GHz)CPUCore i7 8700 (3.2 GHz)
GPUGeforce RTX 2080(VRAM:8 GB)OpenCV3.4.0
CUDA10
Table 3. The subjects’ gaze information from our proposed method.
SubjectAgeWeatherTime ZoneSubjective EvaluationS.D.A.P. Score [32]Number of Fixations 10Total of Fixation Time 10Minimum Distance 10Average Distance 10Number of Fixations 15Total of Fixation Time 15
A82Rain2 p.m.0.5−766107.80.825.081212.6
B66Rain3 p.m.0−1650412.516.19122.5
C77Fine4 p.m.0.5−91041.64.147.50103.8
D30Fine4 p.m.1−49101.85.207.96227.5
E79Cloudy2 p.m.1−390186.80.365.372610.8
F40Fine4 p.m.0.5−235103.31.607.31105.8
G38Fine4 p.m.1−60540.83.886.8561.1
H77Fine3 p.m.0.5−7170040.6
I53Cloudy3 p.m.1−440102.61.556.30225.7
J67Cloudy3 p.m.0.5−195103.24.496.93106.2
K59Fine4 p.m.0.5−355102.72.114.39122.7
L57Fine1 p.m.0.5−1931212.50.886.19815
M44Fine1 p.m.0.5−73881.32.487.96125.1
N84Cloudy1 p.m.0−95740.62.555.85122.1
O67Cloudy2 p.m.0.5−450129.41.446.761014.5
P49Cloudy11 a.m.0.5−217163.93.107.19145.6
Q69Cloudy11 a.m.0.5−131261.73.435.37144.4
R74Fine10 a.m.0.5−785166.11.725.7687.5
S40Fine2 p.m.0.5−733102.80.875.77206.3
T67Cloudy1 p.m.0.5−82264.83.757.0645
U67Cloudy1 p.m.0.5−64541.71.996.9021.5
V46Cloudy4 p.m.0.5−3600020.4
Table 4. The subjects’ gaze information from our proposed method.
SubjectMinimum Distance 15Average Distance 15Number of Fixations 20Total of Fixation Time 20Minimum Distance 20Average Distance 20Number of Fixations 25Total of Fixation Time 25Minimum Distance 25Average Distance 25
A0.827.671015.10.708.35615.60.829.57
B2.519.3145.12.1511.372062.5114.99
C4.1410.23125.83.5511.02126.84.1413.29
D5.2011.172915.34.4612.481816.55.2015.20
E0.367.352813.80.318.003415.20.369.72
F1.228.17139.81.058.71148.71.2211.10
G3.888.0382.53.3311.78102.93.8814.59
H12.4114.2231.89.0114.7182.99.0116.81
I1.558.851710.31.5511.984015.51.5514.50
J4.499.901010.64.4912.621613.54.4914.67
K2.114.3983.82.116.47206.90.6014.00
L0.887.09315.61.177.46415.80.887.65
M2.4810.9257.92.4812.96108.42.4813.39
N2.559.4263.12.9411.55103.82.5513.50
O1.448.481716.91.248.4912181.4410.48
P3.108.8287.23.1010.74147.73.1011.51
Q3.439.0297.52.9410.34169.23.4313.26
R1.726.80147.51.477.4612100.079.53
S0.879.0646.10.7410.10149.50.8712.06
T3.757.6186.13.2210.78209.63.7513.56
U1.997.92135.81.7112.82126.51.9916.14
V9.9411.9091.211.6315.9042.19.9418.42
Table 5. Results of MRA model 1.
Coefficientp-Value
Intercept1.4440.003
Age−0.0070.008
Number of fixations 200.0270.000
Minimum distance 150.1610.012
Average distance 15−0.1330.020
Minimum distance 20−0.1200.041
Average distance 200.1220.041
Table 6. Results of MRA model 2.
Coefficientp-Value
Intercept1.4440.003
Age−0.0070.008
Number of fixations 200.0270.000

