Review

High Pressure Processing of Ion Implanted GaN

1
Institute of High Pressure Physics Polish Academy of Sciences, Sokolowska 29/37, 01-142 Warsaw, Poland
2
Institute of Physics, Polish Academy of Sciences, Aleja Lotnikow 32/46, 02668 Warsaw, Poland
3
Institute of Physics, Maria Curie-Sklodowska University in Lublin, pl. M. Curie-Sklodowskiej 1, 20-031 Lublin, Poland
4
Center for Integrated Research of Future Electronics, Institute of Materials and Systems for Sustainability, Nagoya University, C3-1 Furo-cho, Chikusa-ku, Nagoya 464-8603, Japan
5
ATI, ULVAC, Inc., Chigasaki, Kanagawa 253-8543, Japan
*
Author to whom correspondence should be addressed.
Electronics 2020, 9(9), 1380; https://doi.org/10.3390/electronics9091380
Submission received: 27 July 2020 / Revised: 17 August 2020 / Accepted: 19 August 2020 / Published: 26 August 2020
(This article belongs to the Special Issue Micro- and Nanotechnology of Wide Bandgap Semiconductors)

Abstract

:
It is well known that ion implantation is one of the basic tools for semiconductor device fabrication. The implantation process itself damages, however, the crystallographic lattice of the semiconductor. Such damage can be removed by proper post-implantation annealing of the implanted material. Annealing also allows electrical activation of the dopant and creates areas of different electrical types in a semiconductor. However, such thermal treatment is particularly challenging in the case of gallium nitride since it decomposes at relatively low temperature (~800 °C) at atmospheric pressure. In order to remove the implantation damage in a GaN crystal structure, as well as activate the implanted dopants at ultra-high pressure, annealing process is proposed. It will be described in detail in this paper. P-type GaN implanted with magnesium will be briefly discussed. A possibility to analyze diffusion of any dopant in GaN will be proposed and demonstrated on the example of beryllium.

1. Introduction

Electronic devices prepared by GaN-on-GaN technology are still at the beginning of their road to commercialization. Two different technologies can be applied for preparing GaN-on-GaN vertical devices (e.g., metal–oxide–semiconductor field-effect transistor (MOSFET)). The structure can be grown by epitaxial techniques with some procedures, such as regrowth and/or etching, needed due to the device architecture, or by ion implantation [1,2]. The latter approach seems to be much less demanding and more perspective. The implantation process has been commonly applied in semiconductors for selective area n- and p-type doping. Such approach allows one to reduce the device size and to control the electric field configuration in devices. However, the implantation process destroys the crystal structure of the material. In order to rebuild it, appropriate (for a given compound) temperature treating is required. The temperature required to remove the damage is around 50–70% of the melting temperature of a given compound [3]. Temperature treatment is also important in order to activate the implanted ions [4,5,6]. In case of Mg, the sole process of implantation of ions into GaN does not result in p-type conductivity at room temperature [7]. The reason for this is not only the rather high ionization energy of Mg in GaN. The implantation process results in introducing defects that compensate the implanted dopant. It was assumed that they were nitrogen vacancies. Uedono et al. showed that these defects were coupled gallium and nitrogen vacancies [8]. It was also presented that annealing at temperature higher than 1100 °C allows one to decrease the defect density. It should be stressed that GaN loses its thermal stability close to 800 °C at atmospheric pressure [9]. Therefore, annealing it at higher temperature results in surface decomposition. It is possible to apply an AlN capping layer in order to protect the surface. However, it was suggested that during annealing vacancy-type defects agglomerate near the interface between the AlN cap and GaN [8]. Therefore, the best approach is to avoid using a capping layer. One of the possible solutions is to anneal implanted GaN at much higher temperature but, then, also at high nitrogen pressure. Such technology is called the ultra-high-pressure annealing (UHPA). UHPA is strictly derived from the well-known high nitrogen pressure solution (HNPS) growth technology of GaN [10]. First GaN monocrystals of the highest structural quality were obtained by the HNPS method [11]. They were grown from a solution of atomic nitrogen in liquid gallium (Ga) at temperature of the order of 1500 °C and nitrogen (N2) pressure of 1 GPa. If Ga is removed from such a system, it is possible to anneal any material in the temperature and pressure conditions described above. This is the foundation of the UHPA technology. Today, it serves to anneal implanted GaN (see, e.g., [12,13,14,15,16]) as well as different kinds of glasses and foams (see, e.g., [17,18,19,20,21]).
In this paper, the basis of applying the UHPA technology only for GaN is described. At the beginning, the thermodynamics of this process is briefly explained. Next, the UHPA configuration is presented and analyzed. P-type GaN implanted with magnesium (Mg) is discussed based on recent results obtained in cooperation with Nagoya University in Japan. Then, application of the UHPA technology for analyzing the diffusion mechanism of beryllium (Be) in GaN is demonstrated. It is treated as a case study since the presented approach allows one to examine the diffusion of any element in GaN. A summary is given at the end of this paper.

2. Thermodynamic Basics

In 1984, Karpinski et al. [9] determined the pressure–temperature (p–T) equilibrium curve for the GaN-Ga-N2 system. This curve is presented in Figure 1a. The p–T area where GaN exists is clearly seen. Figure 1b shows the Gibbs free energy (G) as a function of temperature for GaN and its constituent, N2 [11]. With increasing temperature, the G curves decrease. It happens faster in the case of N2. Thus, at atmospheric pressure at around 800 °C, the G curves for GaN and N2 intersect and GaN loses its thermodynamic stability. Increasing the N2 pressure shifts the Gibbs free energy of nitrogen into higher ranges, according to the equation:
G = U + pV-TS
where U represents the internal energy, V-volume, and S-entropy.
Then, the stability region of GaN is extended. Thus, high nitrogen pressure (in fact nitrogen activity) stabilizes the existence of GaN at higher temperature. It should be, however, remembered that GaN is a binary compound and at very high temperature Ga vapor pressure is also required to secure GaN against decomposition.

3. Ultra-High-Pressure Annealing Process

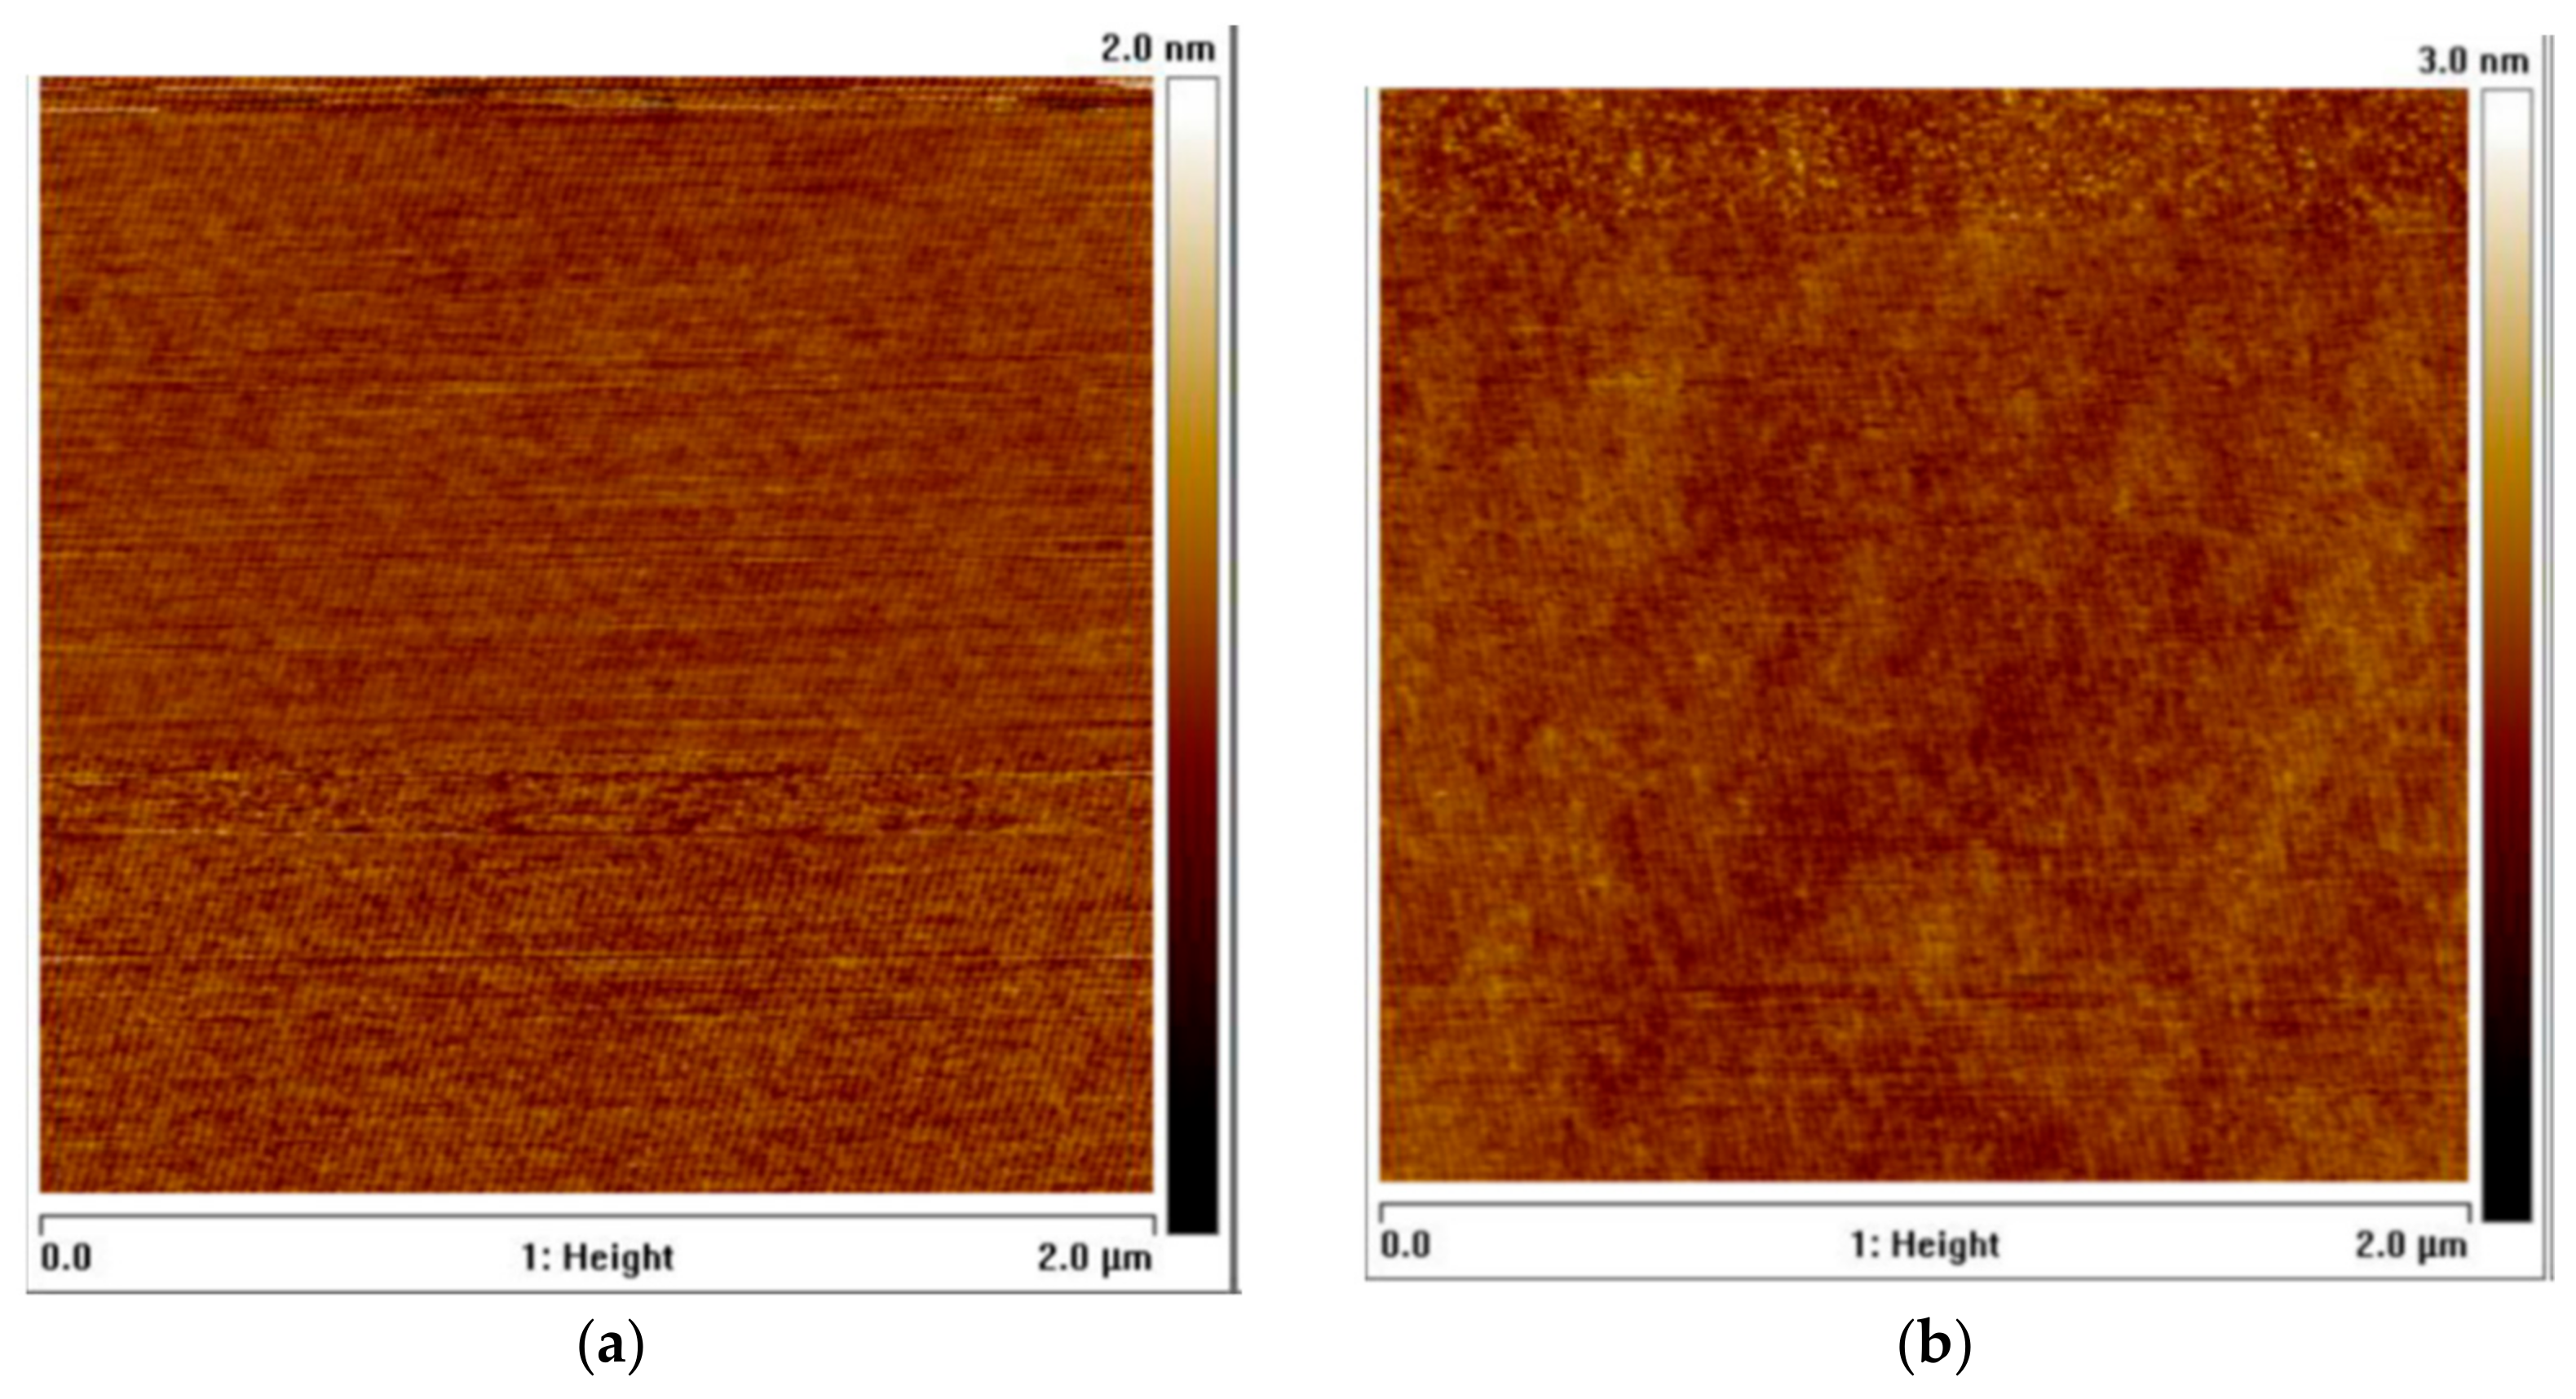
During the UHPA process, a GaN sample is placed in a crucible. The crucible is then positioned in a resistive furnace and in a high-pressure reactor. In such a configuration, annealing of GaN at nitrogen rich conditions can be performed. If no changes are introduced, the compound will only have contact with the N2 gas phase. However, as already mentioned, Ga vapor might be needed for protecting GaN against decomposition during annealing at relatively high temperature. The presence of Ga vapor can be provided in two ways: (1) the GaN sample is covered by GaN powder; (2) the GaN sample is placed close to a Ga droplet. The first solution bases on the assumption that the GaN powder decomposes faster than the GaN sample and, therefore, Ga vapor is above the annealed sample. The second way is more elegant and bases on the assumption that the Ga droplet evaporates and, therefore, Ga vapor is close to the surface of the annealed sample. In this paper, examination of the three described configurations: only in N2, with GaN powder, and with a Ga droplet, will be presented. They are shown in Figure 2. For each UHPA process, two GaN samples of high structural quality were prepared: one with the (0001) surface and the second one with the (000-1) surface prepared to an epi-ready state. Figure 3 shows atomic force microscopy (AFM) images of the mentioned surfaces. In both cases, values of the root mean square (RMS) were lower than 0.1 nm. GaN samples grown by halide vapor phase epitaxy (HVPE-GaN) were used (for details see [22]). This material is characterized by high structural quality with threading dislocation density of the order of 5 × 104 cm−2, flat crystallographic planes (bowing radius higher than 20 m) as well as high purity (donor and acceptor concentration lower than 1017 cm−3).
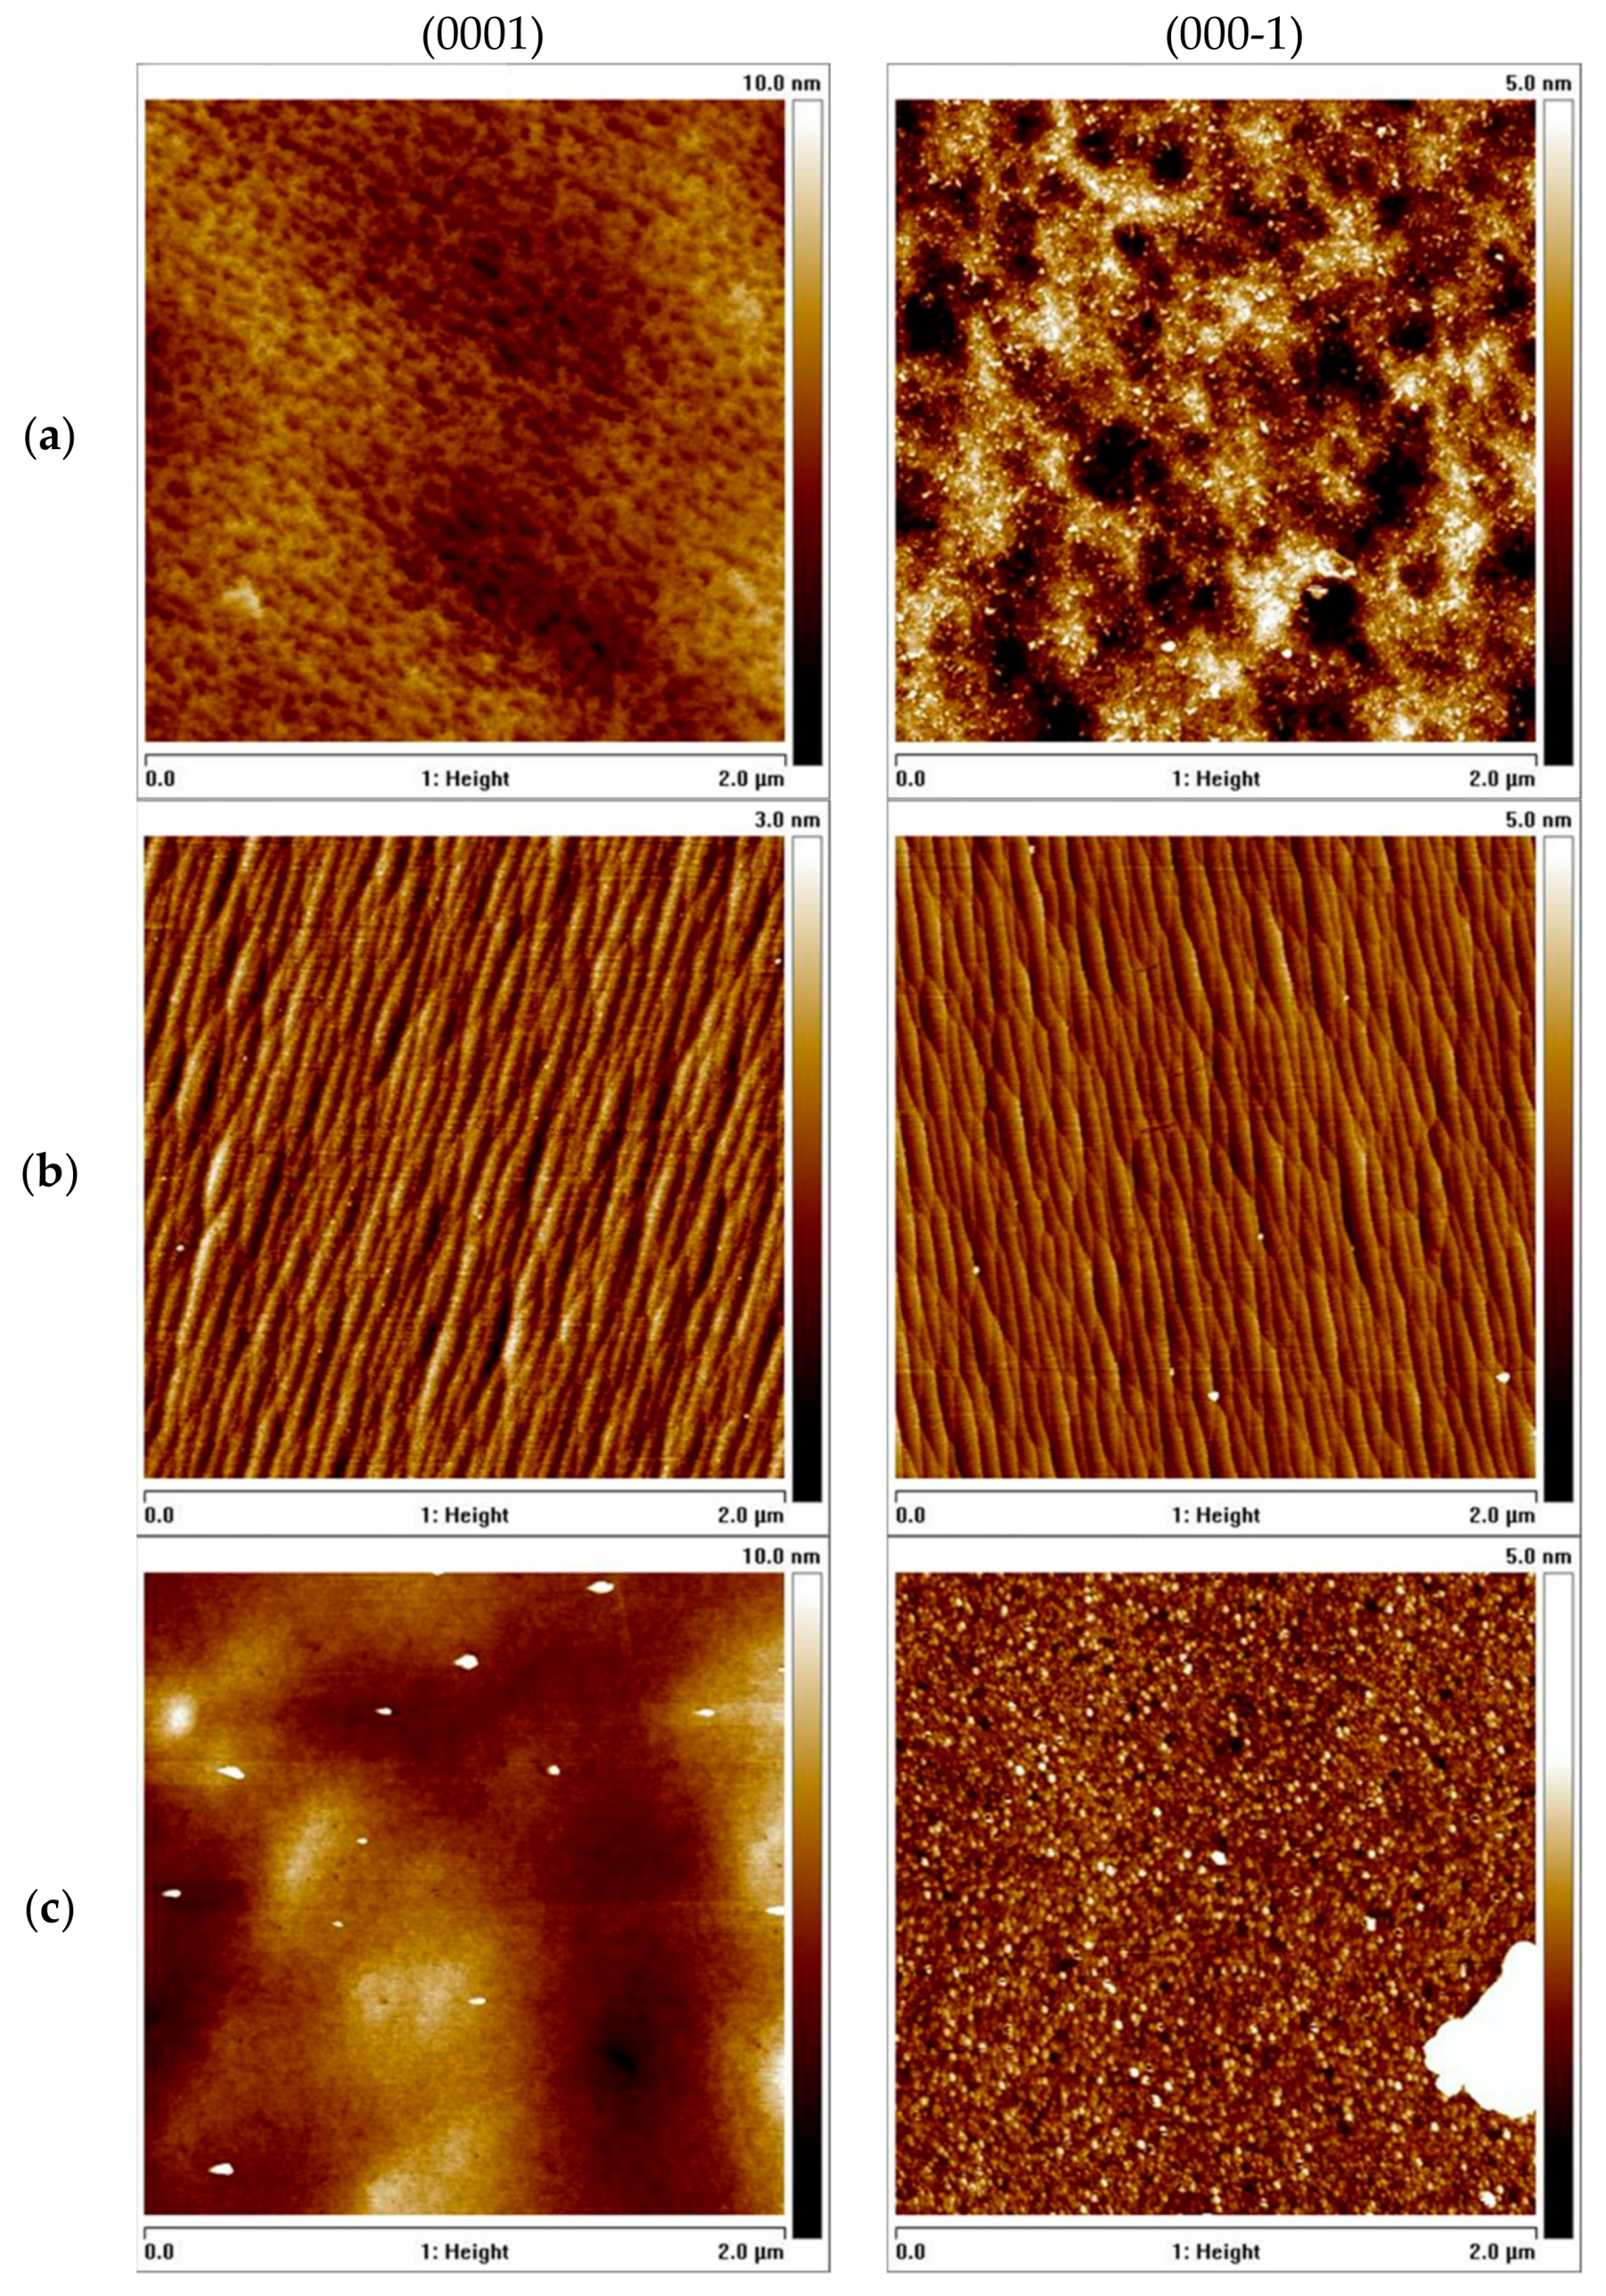
Figure 4 demonstrates AFM images of the samples’ surfaces after annealing at 1400 °C under N2 pressure of 0.7 GPa for 15 min. A lower value of RMS (of the order of 0.5 nm) was noted for samples covered with GaN powder. Multiple atomic steps were clearly visible. The samples annealed at nitrogen rich conditions and placed close to the gallium droplet (configurations A and C in Figure 2, respectively) demonstrated higher RMS close to 1 nm. In the case of samples annealed in configuration A, Ga droplets and pinholes were detected. The samples annealed in configuration C showed areas without steps but with small beads. These results showed that only annealing in configuration B did not lead to GaN surface decomposition. Thus, this configuration was chosen for annealing implanted GaN.

4. P-Type GaN by Mg Implantation

As mentioned, the implantation process has been commonly applied for controlling the selective area doping of both n- and p-type regions, which allow one to reduce the device size and control the electric field configuration in devices. In the case of GaN, high n-type carrier concentration has already been demonstrated by using a relatively large ion dosage [4,23]. Obtaining highly conductive p-type after ion implantation still remains a challenge. Recently, a very effective activation by UHPA of Mg-implanted p-type GaN has been announced [24]. Investigating Mg diffusion during the UHPA process also started [25,26,27].
Magnesium was implanted into n-type GaN deposited by metalorganic vapor phase epitaxy (MOVPE). The 2-µm-thick MOVPE layer was grown on an HVPE-GaN substrate. The ion implantation process was performed at room temperature. A 300-nm-deep box-shaped profile with Mg concentration of 1019 cm−3 was obtained. The UHPA process was performed at 1400 °C for 5 min under N2 pressure of 1 GPa. The sample was covered by polycrystalline GaN powder. Figure 5a shows Mg profiles after implantation and after annealing. The diffusion of Mg into the sample (up to 1 µm) was observed. The average Mg concentration in a 1-µm-thick layer was of the order of 1018 cm−3. AC Hall measurements, described in detail in [24], demonstrated that the layer is p-type GaN with hole concentration of 1017 cm−3 and mobility 25 cm2 V−1 s−1 at room temperature (see Figure 5b). A comparison of electrical results between the p-type GaN resulting from implantation followed by UHPA and an MOVPE-GaN layer doped with Mg [28] showed that the same results can be obtained by both methods.
No doubt, achieving efficient p-type conductivity in Mg-implanted GaN depends on post-implantation annealing conditions. Up to now, p-type GaN with 70% activated Mg atoms was obtained only by UHPA at 1400 °C [24]. Conventional annealing at atmospheric pressure and 1300 °C (with an AlN cup sputtered on GaN surface) allowed us to obtain activation of Mg atoms at the level of 25% [2]. Additionally, atomic-resolution transmission electron microscopy analysis showed that interstitial-type extended defects and inversion domains with Mg segregation formed during the conventional annealing [29]. These defects are not observed in the samples treated by UHPA [26,27].

5. Diffusion Mechanism of Beryllium in GaN—Case Study

As can be remarked, the UHPA leads to diffusion of implanted dopants in GaN. It seems that such experiments allow one to analyze the diffusion phenomenon in GaN and determine the diffusion coefficients of any dopant. In what follows, we will analyze the diffusion of Be in GaN. Unintentionally doped HVPE-GaN layers deposited on ammonothermal GaN substrates [30] were used as samples for ion implantation. Implantation of Be ions was performed with a dose of 2.9 × 1015 cm−2 at energy of 200 keV, without the use of a through film and at room temperature. UHPA was applied as post-implantation annealing. It was performed at nitrogen pressure of 1 GPa, temperature varying in the range 1200–1400 °C and for two different times: 15 and 30 min.
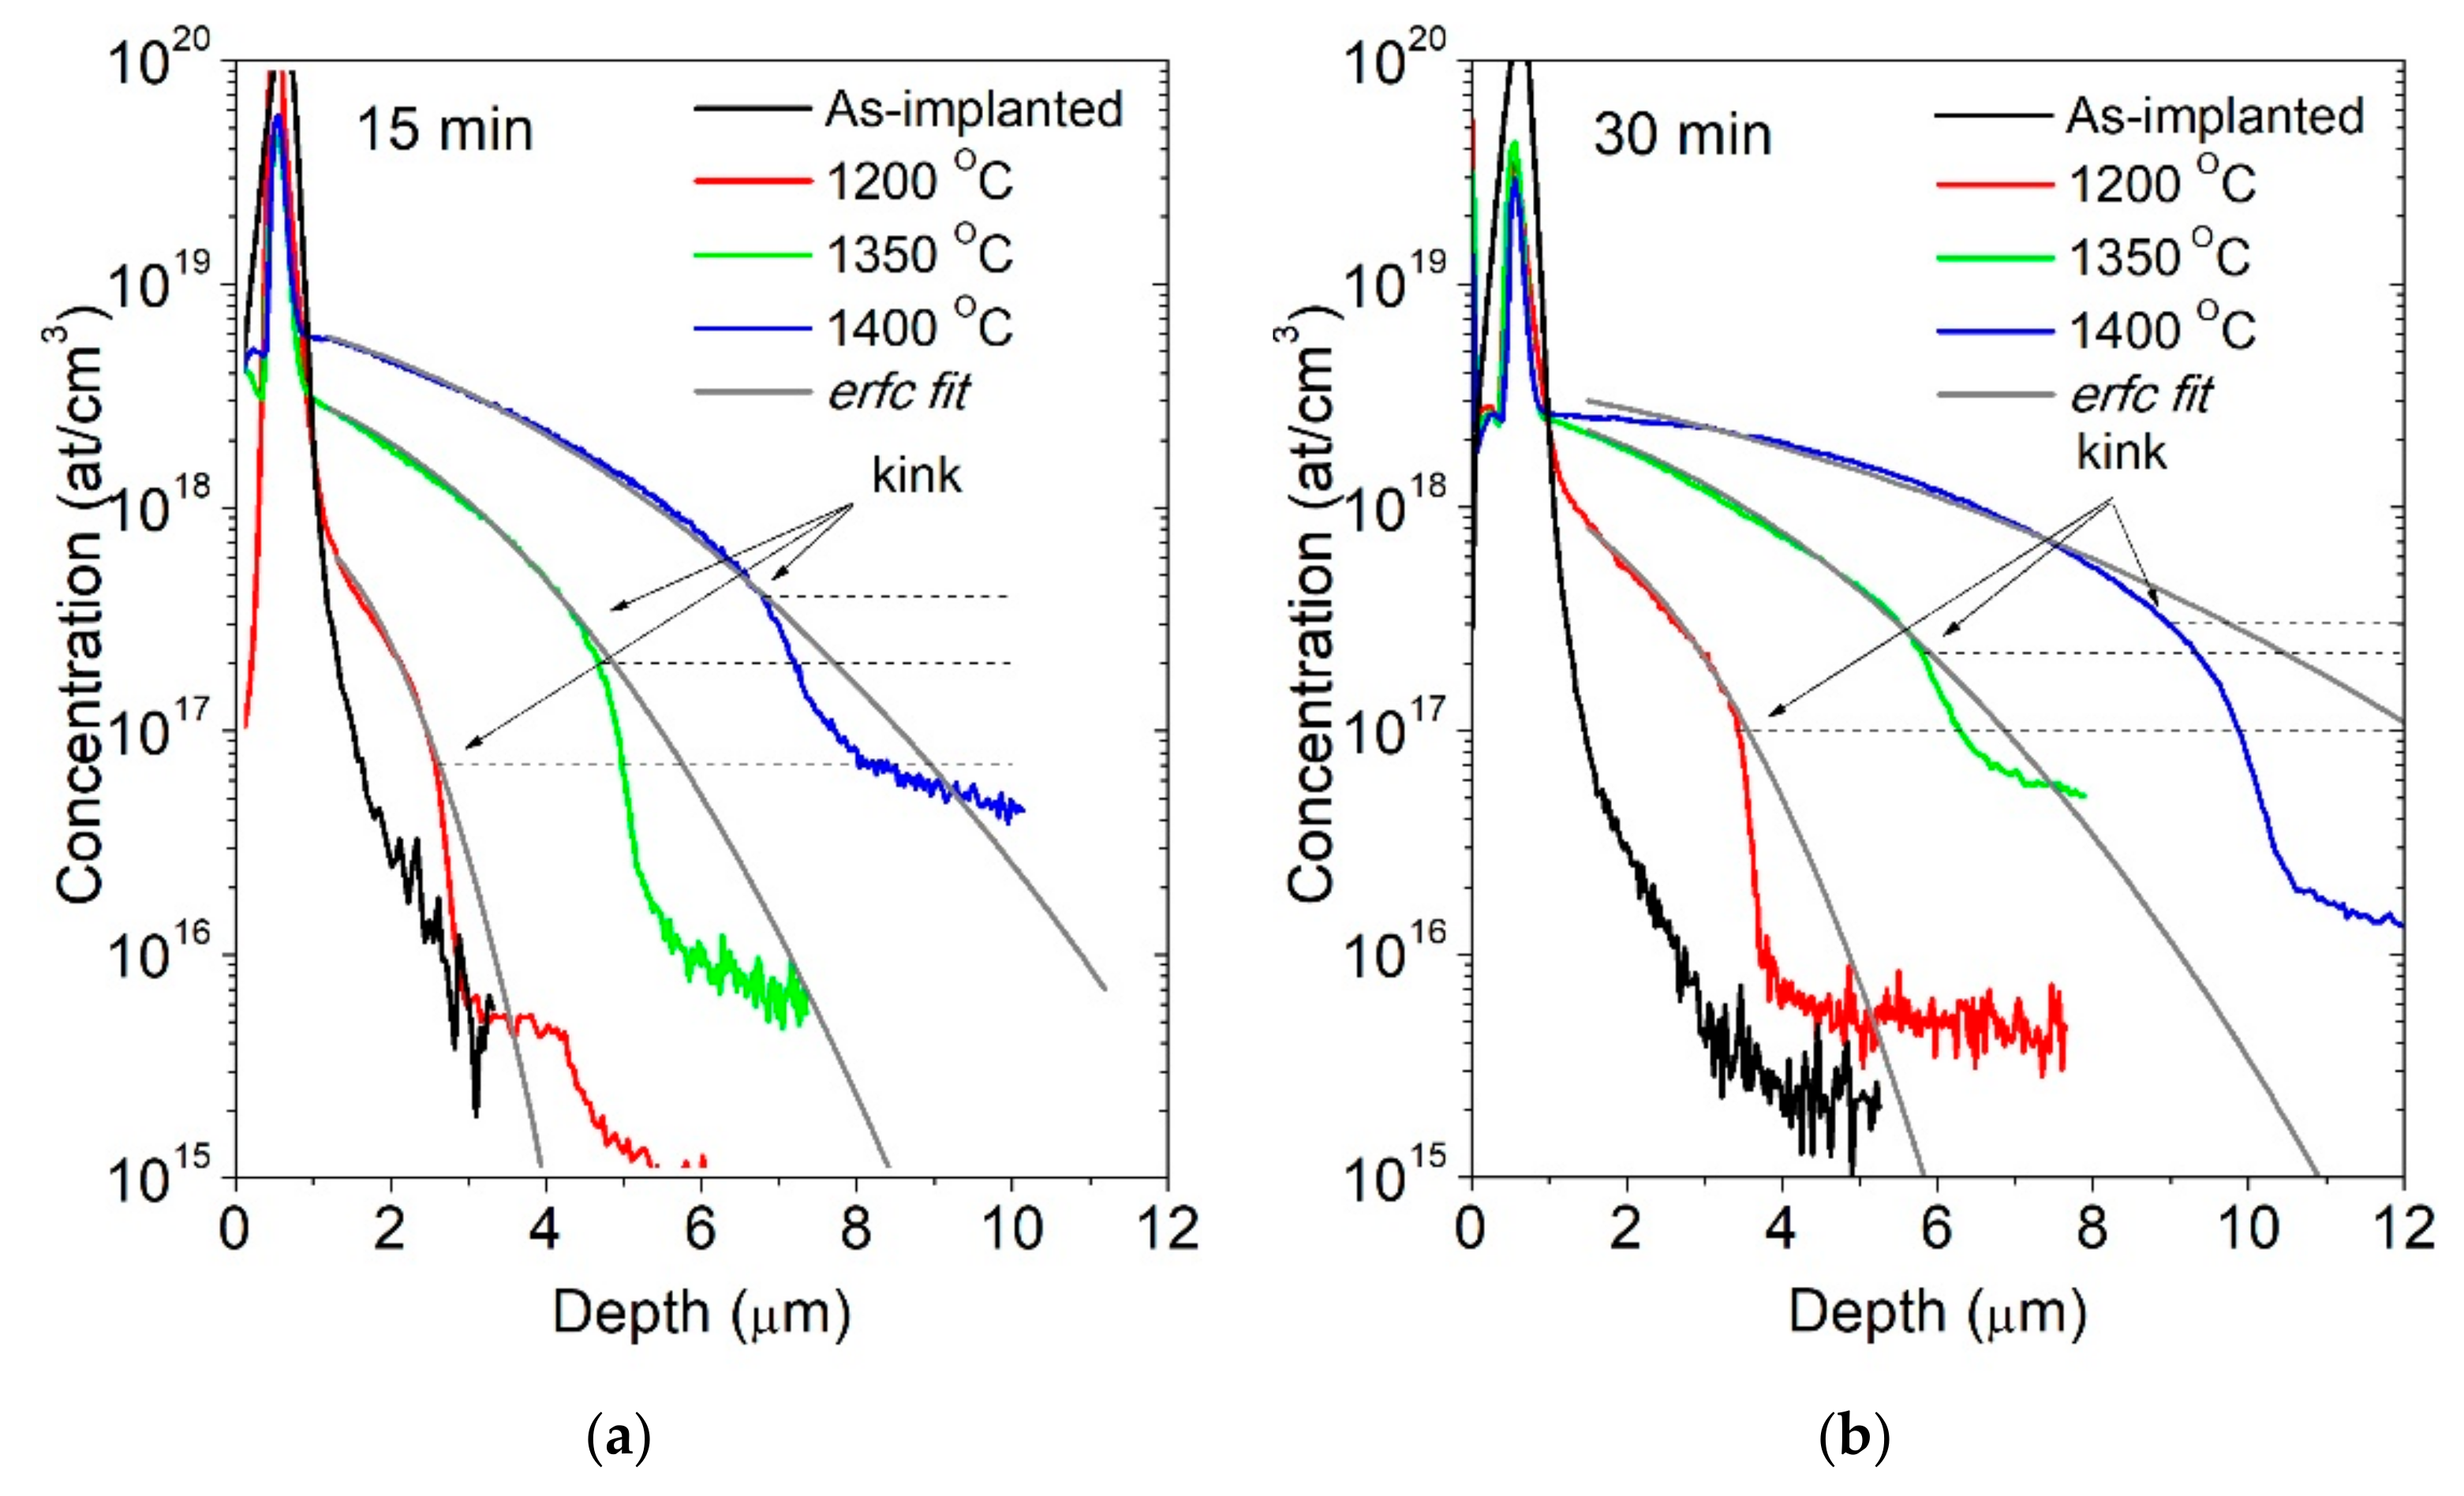
Secondary ion mass spectrometry (SIMS) measurements allowed us to examine the depth profiles of Be. Results for samples as-implanted and annealed for 15 and 30 min are presented in Figure 6. Only Be profiles are shown. No significant changes were observed in the case of other elements. Concentrations of oxygen and silicon in HVPE-GaN used for implantation were lower than 1017 cm−3. It should be noted that all other elements apart from Be, especially atmospheric impurities like hydrogen and carbon, were below the SIMS background level. The data presented in Figure 6 indicate that: (1) the detection limit of Be is 1015 cm−3; (2) annealing at 1200 °C and 1400 °C changes the Be profile; Be reaches the depth of 8 µm at 1400 °C; (3) diffusion profiles exhibit a characteristic kink (marked in Figure 6); (4) in the sample annealed at 1400 °C, the Be reservoir remains at the depth of the maximum concentration of the as-implanted sample; it indicates that the top of the layer, around 1 µm from the surface, can be regarded as an infinite source of Be dopant for all annealing conditions.
If an infinite source of a species is used, the diffusion profiles (concentration C of the examined species) are described by a complementary error function (erfc):
C x , t = C S e r f c x 4 D t
where CS is the maximum concentration of the diffused species, corresponding to the surface concentration in the case of infinite source experiment; D is the diffusion coefficient; t is annealing time; x is the depth from the source of the species. Fitting curves were determined based on the erfc function. They are also presented in Figure 6. CS and D were used as fitting parameters. Magnitudes of the diffusion coefficients obtained from the fitting of Equation (1) changed significantly from 4 × 10⁻¹² cm2 s−1 to 6 × 10⁻¹¹ cm2 s−1 for 1200 °C and 1400 °C, respectively. However, it is clearly seen that the erfc relation is well fitted only to the upper parts of the SIMS profiles (above the characteristic kink). Therefore, the diffusion coefficients calculated in such a way are valid for high Be concentration. A drop (kink) in the Be depth profile appears at a certain Be concentration. This concentration increases when the annealing temperature rises. Such a deviation from the erfc fitting in the profile indicates a change in the diffusion coefficient. For a system, in which D of a species is concertation-dependent, the method described by Matano [31] is applied. According to this approach the standard Fick’s law equation is transformed into:
C t = x D C x
where t and x are time and depth variables, respectively.
A following variable: η = x/t1/2, can be applied if the boundary conditions are known. This results in a dependence of concentration only on η instead of x and t. Then, the equation can be integrated with respect to η between C = 0 and C = Cl, where Cl is a specific value of concentration. Since the analyzed experimental profile is plotted for a specific diffusion time, t can be treated as constant when η is replaced by x and t. For C equal to 0, dC/dx is also equal 0. Therefore, the final equation for the diffusion coefficient is the following:
D C 1 = 1 2 t d x d C C 1 0 C 1 x d C
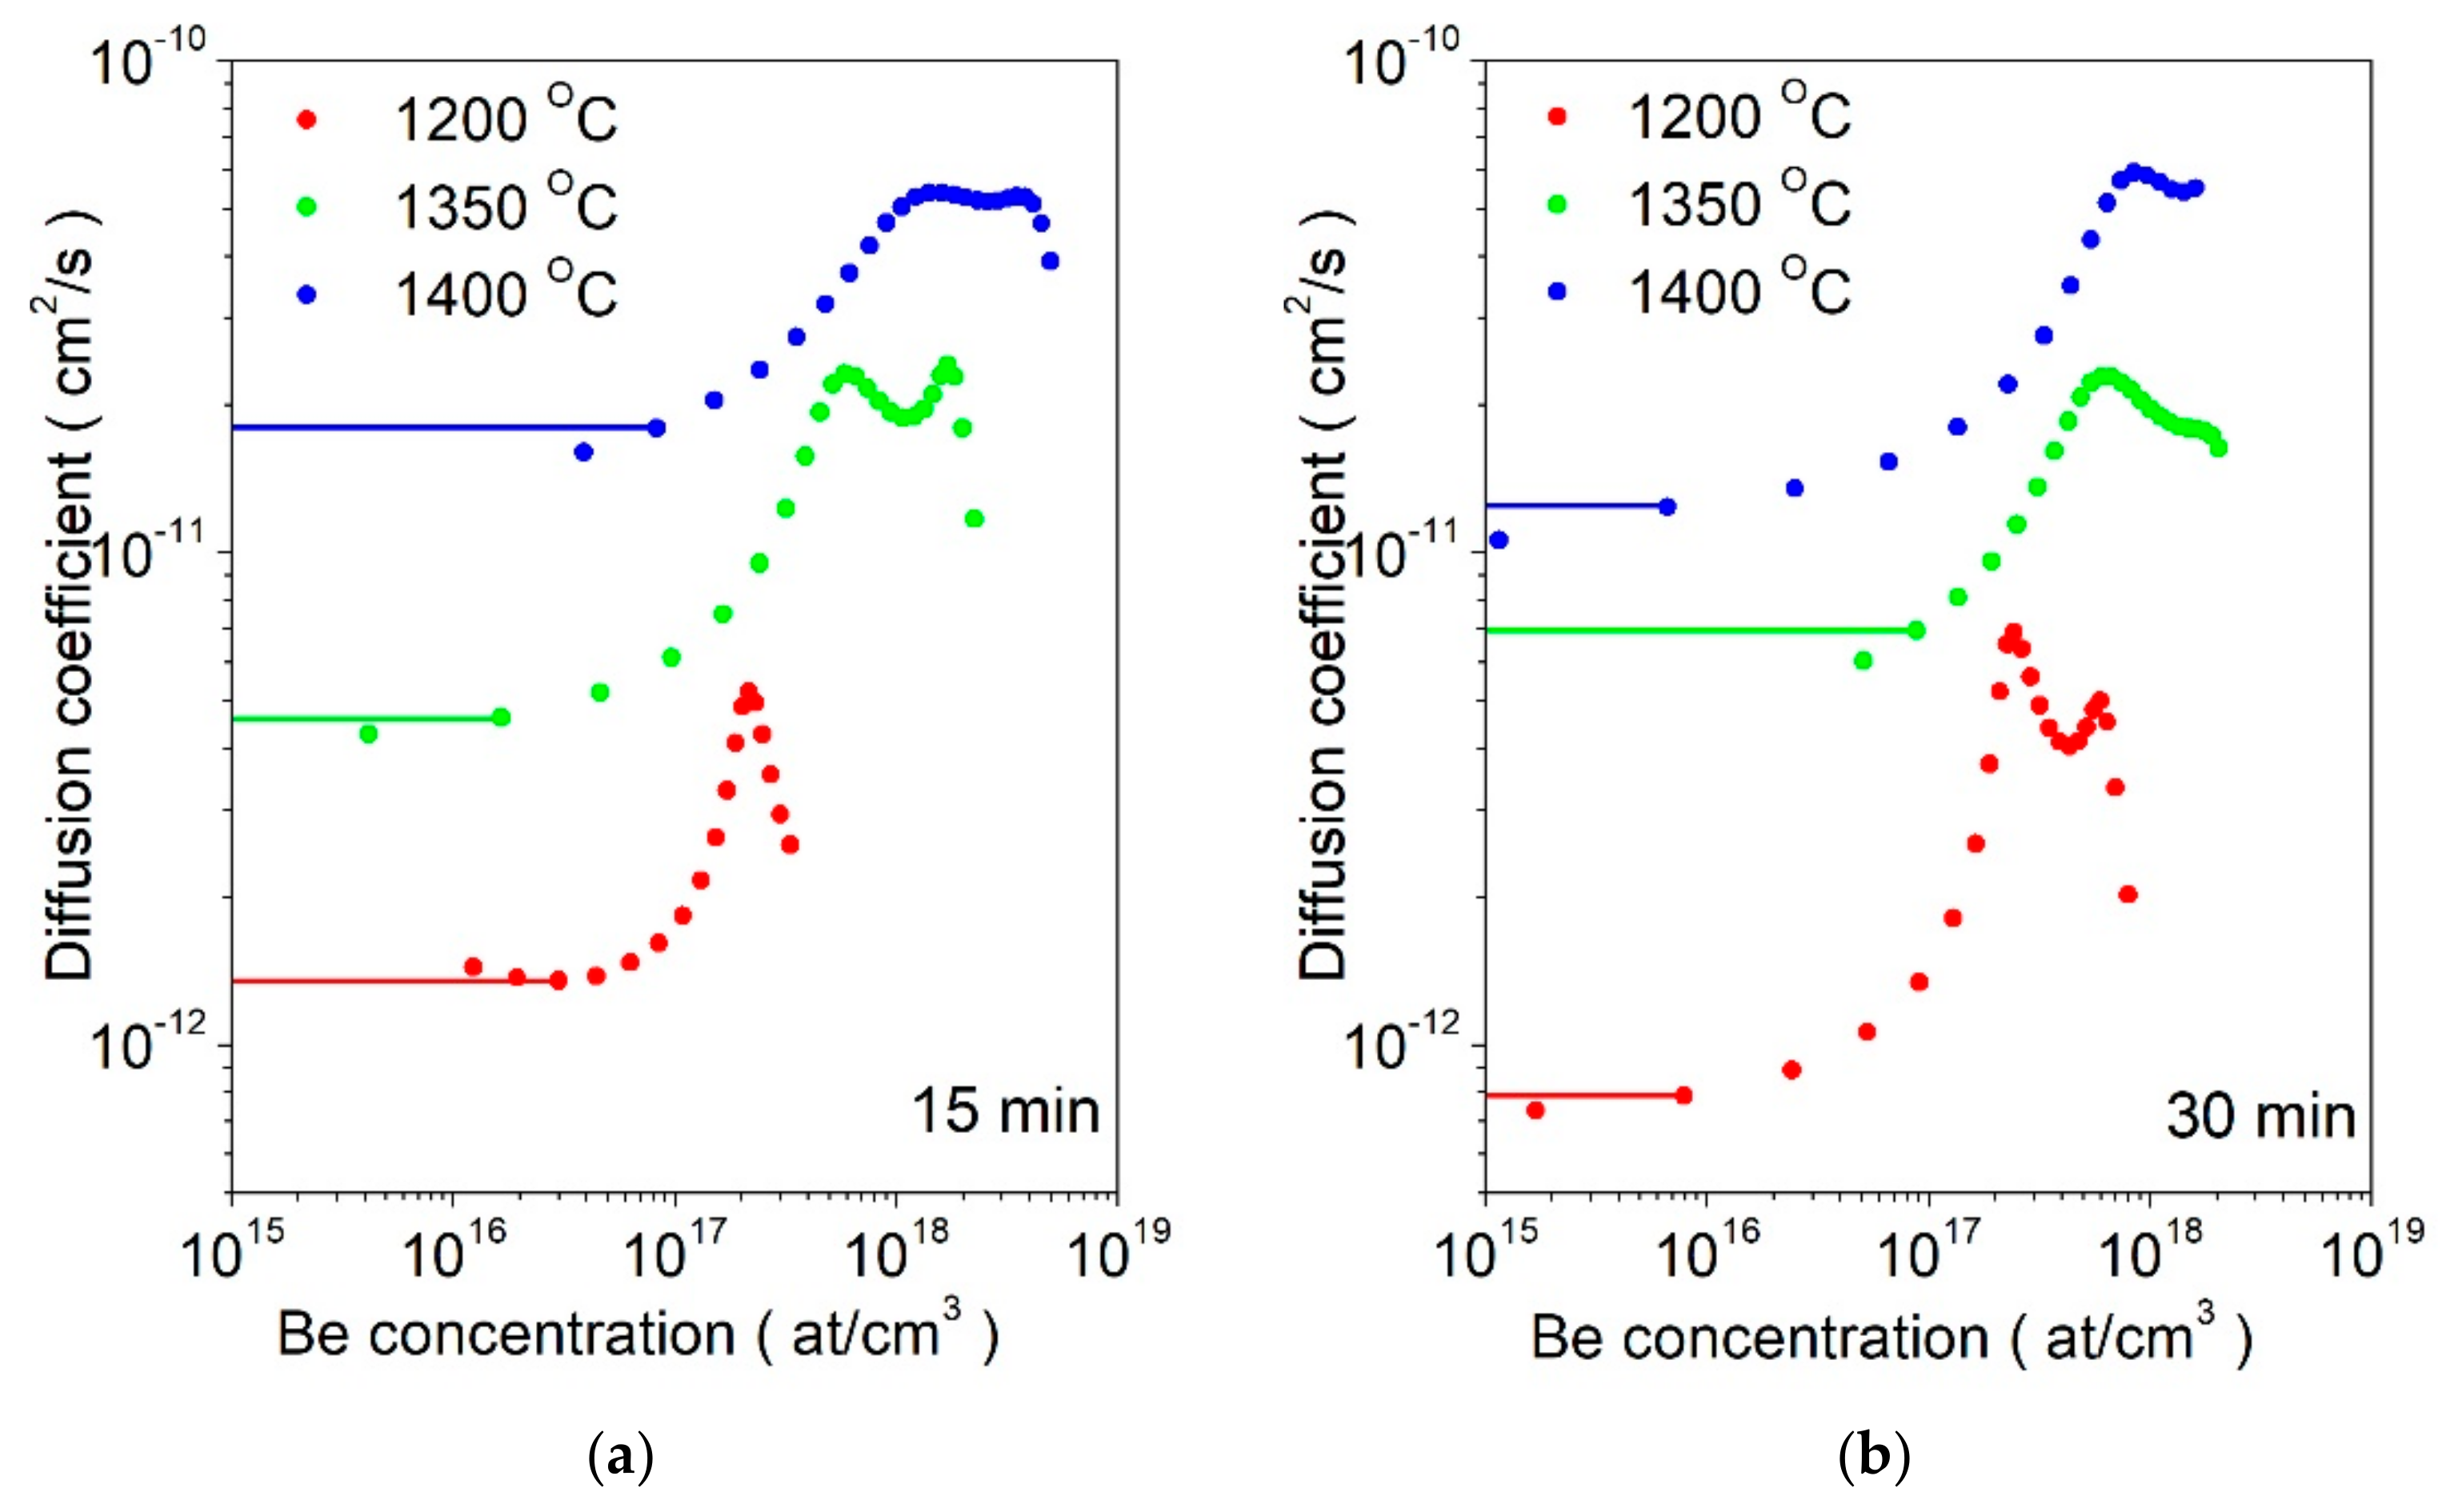
This way, the diffusion coefficient for concentration C1 can be derived from a dopant depth profile by transforming the plot from a C(x) to x(C) function and then integrating. Beryllium depth profiles transformed using Equation (4) are presented in Figure 7a,b for 15-min and 30-min annealing processes, respectively. The Matano method (also known as Boltzmann–Matano method [32]) allowed us to determine the diffusion coefficients for lower concentrations of Be, where there is a divergence between the erfc fit and the SIMS data. Values of the diffusion coefficients are indicated by lines in Figure 7.
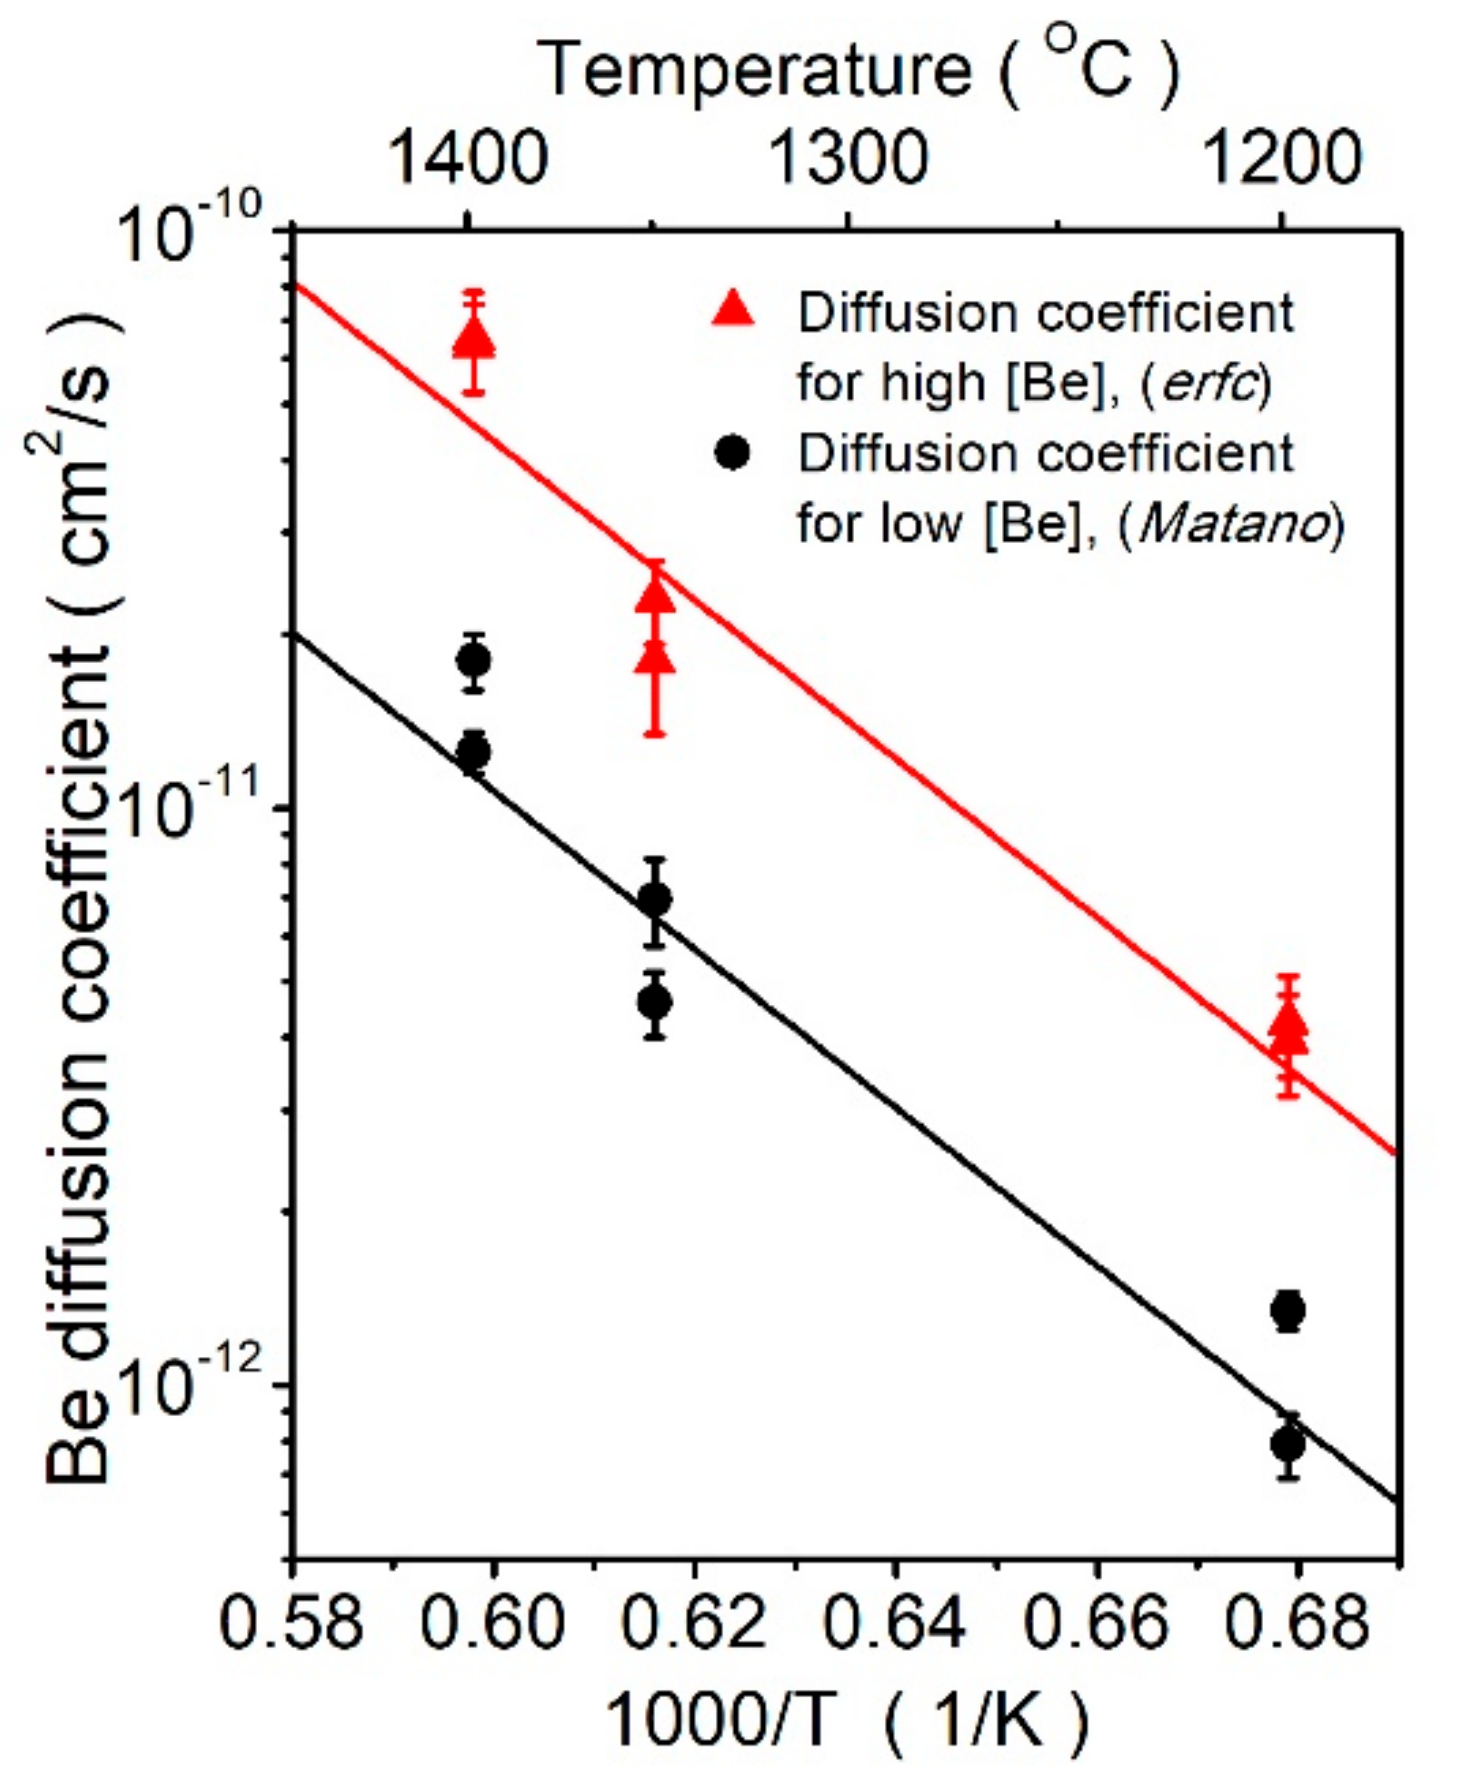
The diffusion coefficients calculated from Equation (2), based on the erfc fit and the ones derived from the Matano analysis for both annealing durations, are presented as a function of 1000/T in Figure 8. A classical Arrhenius equation was used to fit the dependence of the diffusion coefficients on inverse temperature:
D = D 0 e x p E A k T
Results of such fitting, prepared for data from the erfc and Matano analysis, are also presented in Figure 8.
The temperature-independent pre-exponent factor D0, as well as the activation energy for both Be diffusion mechanisms, was determined from Equation (2) using the erfc fitting and the Matano analysis. The results are presented in Table 1.
All the results presented in the above suggest two mechanisms, fast and slow, of Be diffusion in GaN. The first process is most probably a pure interstitial mechanism through octahedral lattice sites (for details, see [33]). The slower one is an interstitial–substitutional diffusion mechanism involving Ga vacancies and tetrahedral lattice sites. The ratio of atoms involved in both mechanisms depends on the concentration of Ga vacancies. Such a result shows that controlling the Ga vacancy concentration can influence the rate of diffusion of the Be dopant in GaN.

6. Summary

The UHPA technology and its application for GaN was presented. Different configurations of the annealing process were studied in order to prevent GaN surface, both (0001) and (000-1), from decomposition. The experiments performed at 1400 °C involved placing GaN samples in N2 rich conditions, close to a Ga droplet, covered by polycrystalline GaN powder. Only the last configurations resulted in surfaces with visible atomic steps. Therefore, UHPA can be successfully applied for GaN samples without the need to place a cap layer. The described annealing technology, preceded with Mg ion implantation, results in p-type GaN with the dopant activation exceeding 70% and electrical properties similar to those of MOVPE-doped GaN. This makes UHPA a very promising technology for fabricating devices with selectively doped areas. The high temperature applied in UHPA allows one to study the diffusion process of different elements in GaN. This was presented in the example of Be. Both the diffusion coefficients, as well as two different mechanisms of diffusion, were determined.

Author Contributions

K.S.—crystal growth experiments, UHPA experiments, characterization, preparing the manuscript; R.J.—SIMS measurements, theoretical analysis; B.L.—UHPA experiments, characterization; P.K.—UHPA experiments; M.I.—review and editing; M.T.—Be implantation; T.K., H.S.—Mg implantation, Hall and SIMS measurements, supervision, review and editing; M.B.—UHPA experiments, supervision, review and editing. All authors have read and agreed to the published version of the manuscript.

Funding

This research was supported by the Polish National Science Center through projects No. 2018/29/B/ST5/00338, as well as by the TEAM TECH program of the Foundation for Polish Science co-financed by the European Union under the European Regional Development Fund (POIR.04.04.00-00-5CEB/17-00). This work was also supported by MEXT “Research and development of next-generation semiconductor to realize energy-saving society” Program Grant Number JPJ005357.

Acknowledgments

The authors are also grateful to Anna Feduniewicz-Zmuda for performing the AFM analysis and helpful discussions. The authors would also like to thank Tetsuo Narita of Toyota Central R&D Labs., Inc. for valuable discussions.

Conflicts of Interest

The authors declare no conflict of interest.

References

  1. Shibata, D.; Kajitani, R.; Ogawa, M.; Tanaka, K.; Tamura, S.; Hatsuda, T.; Ishida, M.; Ueda, T.T. 1.7 kV/1.0 mΩcm2 normally-off vertical GaN transistor on GaN substrate with regrown p-GaN/AlGaN/GaN semipolar gate structure. In Proceedings of the IEEE International Electron Devices Meeting (IEDM16), San Francisco, CA, USA, 3–7 December 2016; p. 248. [Google Scholar]
  2. Takashima, S. Demonstration of vertical GaN planar MOSFET fabricated by all ionimplantation process. In Proceedings of the Invited Lecture during 9th Asia-Pacific Workshop on Widegap Semiconductors (APWS2019), Okinawa, Japan, 10–15 November 2019. [Google Scholar]
  3. Zolper, J.C. Ion implantation in group III-nitride semiconductors: A tool for doping and defect studies. J. Cryst. Growth 1997, 178, 157–167. [Google Scholar] [CrossRef]
  4. Irokawa, Y.; Fujishima, O.; Kachi, T.; Nakano, Y. Electrical activation characteristics of silicon-implanted GaN. J. Appl. Phys. 2005, 97, 083505. [Google Scholar] [CrossRef]
  5. Greenlee, J.D.; Feigelson, B.N.; Anderson, T.J.; Tadjer, M.J.; Hite, J.K.; Mastro, M.A.; Eddy, C.R.J.; Hobart, K.D.; Kub, F.J. Multicycle rapid thermal annealing optimization of Mg-implanted GaN: Evolution of surface, optical, and structural properties. J. Appl. Phys. 2014, 116, 063502. [Google Scholar] [CrossRef]
  6. Oikawa, T.; Saijo, Y.; Kato, S.; Mishima, T.; Nakamura, T. Formation of definite GaN p–n junction by Mg-ion implantation to n−-GaN epitaxial layers grown on a high-quality free-standing GaN substrate. Nucl. Instrum. Methods Phys. Res. Sect. B 2015, 365, 168–170. [Google Scholar] [CrossRef]
  7. Pearton, S.J.; Vartuli, C.B.; Zolper, J.C.; Yuan, C.; Stall, R.A. Ion implantation doping and isolation of GaN. Appl. Phys. Lett. 1995, 67, 1435. [Google Scholar] [CrossRef]
  8. Uedono, A.; Takashima, S.; Edo, M.; Ueno, K.; Matsuyama, H.; Kudo, H.; Naramoto, H.; Ishibashi, S. Vacancy-type defects and their annealing behaviors in Mg-implanted GaN studied by a monoenergetic positron beam. Phys. Status Solidi B 2015, 252, 2794–2801. [Google Scholar] [CrossRef]
  9. Karpiński, J.; Porowski, S. High pressure thermodynamics of GaN. J. Cryst. Growth 1984, 66, 11–20. [Google Scholar] [CrossRef]
  10. Ehrentraut, D.; Bockowski, M. Handbook of Crystal Growth Second Edition: Bulk Crystal Growth: Basic Techniques, and Growth Mechanisms and Dynamics; Rudolph, P., Ed.; Elsevier: Amsterdam, The Netherlands, 2015; pp. 577–619. [Google Scholar]
  11. Grzegory, I.; Bockowski, M.; Porowski, S. Bulk Crystal Growth of Electronic, Optical and Optoelectronic Materials; Capper, P., Ed.; Wiley & Sons: Hoboken, NJ, USA, 2005; p. 173. [Google Scholar]
  12. Ben Sedrine, N.; Rodrigues, J.; Cardoso, J.; Nd Faye, D.; Fialho, M.; Magalhães, S.; Martins, A.F.; Neves, A.J.; Alves, E.; Bockowski, M.; et al. Optical investigations of europium ion implanted in nitride-based diode structures. Surf. Coat. Technol. 2018, 355, 40–44. [Google Scholar] [CrossRef]
  13. Ben Sedrine, N.; Rodrigues, J.C.; Nd Faye, D.; Neves, A.J.; Alves, E.; Bockowski, M.; Hoffmann, V.; Weyers, M.; Lorenz, K.; Correia, M.R.; et al. Eu-Doped AlGaN/GaN Superlattice-Based Diode Structure for Red Lighting: Excitation Mechanisms and Active Sites. ACS Appl. Nano Mater. 2018, 1, 3845–3858. [Google Scholar] [CrossRef]
  14. Singh, A.K.; O’Donnell, K.P.; Edwards, P.R.; Lorenz, K.; Kappers, M.J.; Bockowski, M. Hysteretic photochromic switching of Eu-Mg defects in GaN links the shallow transient and deep ground states of the Mg acceptor. Sci. Rep. 2017, 7, 41982. [Google Scholar] [CrossRef] [Green Version]
  15. Singh, A.K.; O’Donnell, K.P.; Edwards, P.R.; Cameron, D.; Lorenz, K.; Kappers, M.J.; Bockowski, M.; Yamaga, M.; Prakash, R. Luminescence of Eu3+ in GaN (Mg, Eu): Transitions from the 5D1 level. Appl. Phys. Lett. 2017, 111, 241105. [Google Scholar] [CrossRef] [Green Version]
  16. Lorenz, K.; Miranda, S.M.C.; Alves, E.; Roqan, I.S.; O’Donnell, K.P.; Bockowski, M. High pressure annealing of Europium implanted GaN. In Proceedings of the SPIE, San Francisco, CA, USA, 21–26 January 2012; Volume 8262. UNSP 82620C. [Google Scholar]
  17. Smedskjaer, M.M.; Rzoska, S.J.; Bockowski, M.; Mauro, J.C. Mixed alkaline earth effect in the compressibility of aluminosilicate glasses. J. Chem. Phys. 2014, 140, 054511. [Google Scholar] [CrossRef] [PubMed]
  18. Svenson, M.N.; Bechgaard, T.K.; Fuglsang, S.D.; Pedersen, R.H.; Tjell, A.Ø.; Østergaard, M.B.; Youngman, R.E.; Mauro, J.C.; Rzoska, S.J.; Bockowski, M.; et al. Composition-Structure-Property Relations of Compressed Borosilicate Glasses. Phys. Rev. Appl. 2014, 2, 024006. [Google Scholar] [CrossRef]
  19. Smedskjaer, M.M.; Bauchy, M.; Mauro, J.C.; Rzoska, S.J.; Bockowski, M. Unique effects of thermal and pressure histories on glass hardness: Structural and topological origin. J. Chem. Phys. 2015, 143, 164505. [Google Scholar] [CrossRef] [PubMed]
  20. Svenson, M.N.; Guerette, M.; Huang, L.; Lönnroth, N.; Mauro, J.C.; Rzoska, S.J.; Bockowski, M.; Smedskjaer, M.M. Universal behavior of changes in elastic moduli of hot compressed oxide glasses. Chem. Phys. Lett. 2016, 651, 88–91. [Google Scholar] [CrossRef] [Green Version]
  21. Østergaard, M.B.; Petersen, R.R.; König, J.; Bockowski, M.; Yue, Y.J. Foam glass obtained through high-pressure sintering. Am. Ceram. Soc. 2018, 101, 3917–3923. [Google Scholar] [CrossRef]
  22. Bockowski, M.; Iwinska, M.; Amilusik, M.; Fijalkowski, M.; Lucznik, B.; Sochacki, T. Challenges and future perspectives in HVPE-GaN growth on ammonothermal GaN seeds. Semicond. Sci. Technol. 2016, 31, 093002. [Google Scholar] [CrossRef]
  23. Nakano, Y.; Jimbo, T. Co-implantation of Si+N into GaN for n-type doping. J. Appl. Phys. 2002, 92, 3815. [Google Scholar] [CrossRef]
  24. Sakurai, H.; Omori, M.; Yamada, S.; Furukawa, Y.; Suzuki, H.; Narita, T.; Kataoka, K.; Horita, M.; Boćkowski, M.; Suda, J.; et al. Highly effective activation of Mg-implanted p-type GaN by ultra-high-pressure annealing. Appl. Phys. Lett. 2019, 115, 142104. [Google Scholar]
  25. Narita, T.; Sakurai, H.; Bockowski, M.; Kataoka, K.; Suda, J.; Kachi, T. Electric-field-induced simultaneous diffusion of Mg and H in Mg-doped GaN prepared using ultra-high-pressure annealing. Appl. Phys. Express 2019, 12, 111005. [Google Scholar] [CrossRef]
  26. Iwata, K.; Sakurai, H.; Arai, S.; Nakashima, T.; Narita, T.; Kataoka, K.; Bockowski, M.; Nagao, M.; Suda, J.; Kachi, T.; et al. Defect evolution in Mg ions implanted GaN upon high temperature and ultrahigh N2 partial pressure annealing: Transmission electron microscopy analysis. Appl. Phys. 2020, 127, 105106. [Google Scholar] [CrossRef]
  27. Wang, Y.; Huynh, K.; Liao, M.E.; Yu, H.-M.; Bai, T.; Tweedie, J.; Breckenridge, M.H.; Collazo, R.; Sitar, Z.; Bockowski, M.; et al. Strain Recovery and Defect Characterization in Mg-Implanted Homoepitaxial GaN on High-Quality GaN Substrates. Phys. Status Solidi B 2020, 257, 1900705. [Google Scholar] [CrossRef]
  28. Horita, M.; Takashima, S.; Tanaka, R.; Matsuyama, H.; Ueno, K.; Edo, M.; Takanashi, T.; Shimizu, M.; Suda, J. Hall-effect measurements of metalorganic vapor-phase epitaxy-grown p-type homoepitaxial GaN layers with various Mg concentrations. Jpn. J. Appl. Phys. 2017, 56, 031001. [Google Scholar] [CrossRef]
  29. Kumar, A.; Uzuhashi, J.; Ohkubo, T.; Tanaka, R.; Takashima, S.; Edo, M.; Hono, K. Atomic-scale quantitative analysis of implanted Mg in annealed GaN layers on free-standing GaN substrates. J. Appl. Phys. 2019, 126, 235704. [Google Scholar] [CrossRef]
  30. Zajac, M.; Kucharski, R.; Grabianska, K.; Gwardys-Bak, A.; Puchalski, A.; Wasik, D.; Litwin-Staszewska, E.; Piotrzkowski, R.; Domagala, J.Z.; Bockowski, M. Basic ammonothermal growth of Gallium Nitride–State of the art, challenges, perspectives. Prog. Cryst. Growth Charact. Mater. 2018, 64, 63–74. [Google Scholar] [CrossRef]
  31. Matano, C. On the Relation between Diffusion-Coefficients and Concentrations of Solid Metals. Jpn. J. Phys 1932, 8, 109. [Google Scholar]
  32. Mehrer, H. Diffusion in Solids; Springer: Berlin/Heidelberg, Germany, 2017. [Google Scholar]
  33. Jakiela, R.; Sierakowski, K.; Sochacki, T.; Iwinska, M.; Fijalkowski, M.; Barcz, A.; Bockowski, M. Investigation of diffusion mechanism of beryllium in GaN. Physica B Condens. Matter 2020, 594, 412316. [Google Scholar] [CrossRef]
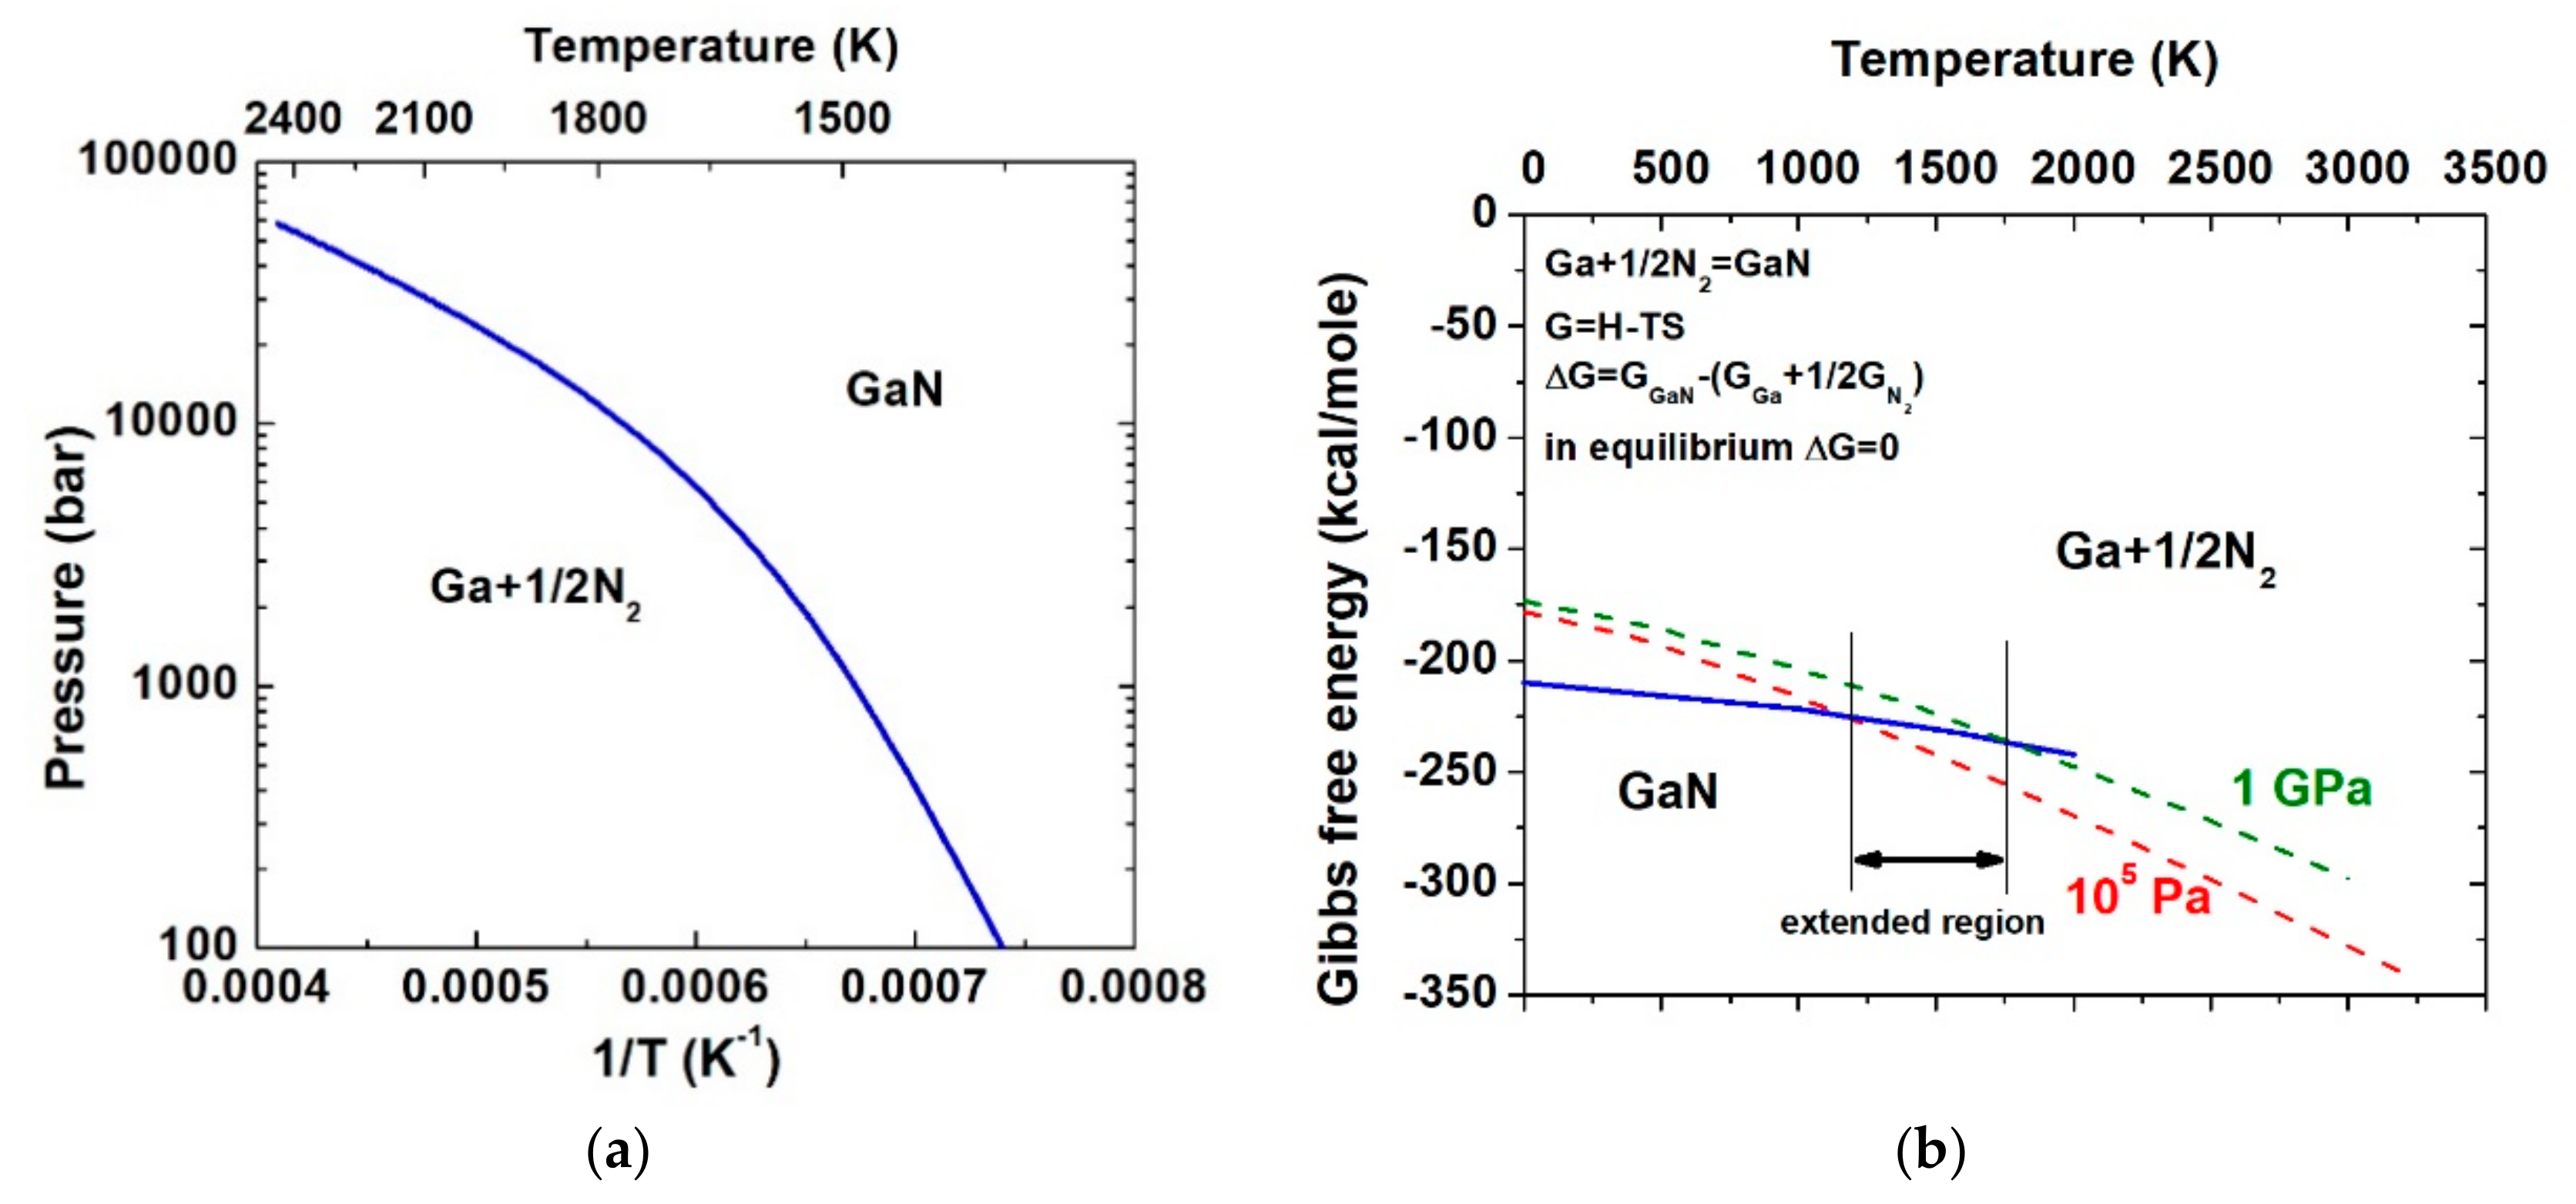
Figure 1. (a) Experimental p–T equilibrium curve for the GaN-Ga-N2 system [9]; (b) Gibbs free energy (G) for GaN and N2; visible temperature shift of GaN stability area if N2 pressure is increased [11].
Electronics 09 01380 g001
Figure 2. Three configurations for annealing HVPE-GaN samples with exposed (0001) and (000-1) surfaces: (a) in N2 rich conditions; samples have direct contact only with N2 (configuration A); (b) covered by polycrystalline GaN powder (configuration B); (c) close to Ga droplet (configuration C); the samples are placed in a crucible (represented by blue box in the figure), resistive heater and high pressure autoclave (reactor).
Electronics 09 01380 g002
Figure 3. AFM images of HVPE-GaN surfaces: (a) (0001); (b) (000-1); RMS = 0.1 nm.
Electronics 09 01380 g003
Figure 4. AFM images of the samples’ surfaces: (0001)—left column and (000-1)—right column, respectively, annealed in three configurations presented in Figure 2; annealing: (a) configuration A—only in N2; (b) configuration B—covered by GaN powder; (c) configuration C—with Ga droplet close to the samples’ surfaces.
Electronics 09 01380 g004
Figure 5. (a) Comparison of Mg profile after implantation and UHPA; (b) temperature-dependent hole concentration for samples processed by Mg ion implantation and UHPA compared to MOVPE-GaN doped with Mg; modified from Sakurai et al. [24] with permission of AIP Publishing.
Electronics 09 01380 g005
Figure 6. Results of SIMS measurements. Be depth profiles for samples as-implanted and annealed in the temperature range 1200 °C–1400 °C for: (a) 15 min; examples of the kink are marked, (b) 30 min; gray curves are error function (erfc) function fitting; black dotted lines indicate the concentration level of the kink in the profile.
Electronics 09 01380 g006
Figure 7. Matano analysis of Be depth profiles according to Equation (3) for samples annealed for: (a) 15 min and (b) 30 min; lines indicate the diffusion coefficients for low concentration of Be; two peaks are visible for high Be concentrations; they may result from the departure from the Matano analysis at the initial Be profile.
Electronics 09 01380 g007
Figure 8. Diffusion coefficients of Be atoms in GaN as a function of inverse temperature; Arrhenius plot from erfc fitting (red filled triangles and line) and Matano analysis (black filled circles and line).
Electronics 09 01380 g008
Table 1. Temperature-independent pre-exponent factor D0 and the activation energy for the Be diffusion.
Pre-Exponent Factor D0 (cm2 s−1)Activation Energy (eV)
Higher Be concentration (erfc fitting)7.8 ± 1 × 10−32.73 ± 0.05
Lower Be concentration (Matano analysis)1.8 ± 1 × 10−32.72 ± 0.05