1. Introduction
The railway infrastructure is under increasing stress due to the evolution of mass transportation seeking an increase in the speed of the connections and higher transport capacity. Such changes require an improvement in the maintenance activities that need to be planned carefully to reduce as much as possible their impacts on the actual use of the infrastructure. Moreover, being able to react quickly to any unexpected event (e.g., natural hazards, accidents, etc.) require the ability to monitor the entire infrastructure in real-time. Both kinds of maintenance activities require the development of an advanced monitoring system able to collect continuous data that can be used to [
1]: (1) Identify unexpected issues; (2) understand the conditions of each component of the infrastructure and plan properly their maintenance.
This paper focuses on the approaches to proactive maintenance developed in the context of the EU funded project MANTIS [
2]. Such approaches have been developed to help in the everyday maintenance activities of a complex infrastructure or industrial system and they have been tested in different domains, including a railway system that is analysed in this paper. In particular, the paper focuses on the approaches to proactive maintenance of switches that are used in conventional and high-speed railway lines that are very critical components of the infrastructure and their failure may have a huge impact on the rail traffic. In such context, reducing the emergency maintenance activities and planning carefully usual activities is of paramount importance to keep the capacity of a line and avoid train delays. This actually is the prime motivation of the current paper. Nevertheless, the results presented here may be further utilized for regulatory or turnout monitoring purposes in future applications.
The preliminary work [
3] briefly introduced the initial results obtained during the development of the system, that includes proposing unique data gathering methods, creating models of a railway switch based on profiling and analysis of its physical behavior, and visualization of collected data. In this paper, some further details are gathered on development and implementation phases, as well as more detailed results are presented. In particular, the architecture for the data collection and the development of the prediction models are analysed in details.
The rest of the paper is organized as follows:
Section 2 briefly presents some related works; in
Section 3 the railway switch case is described;
Section 4 presents the processing of sensed data;
Section 5 gives the overview of the measuring system;
Section 6 sketches the data visualization approach; and
Section 7 draws some conclusions.
2. Related Work
A survey [
4] presents a comprehensive overview of the railway infrastructure maintenance. It focuses on the maintenance planning problem and summarizes the related research publications. Recently, paper [
5] proposed an integrated optimization model for simultaneous consideration of train scheduling problem and maintenance planning problem with uncertain travel time. Another survey in [
6] presents a comprehensive review of the existing fault detection techniques for railway switch and crossing systems.
The handbook [
7] presents the dynamics of railway vehicles as well as entire track system. It also emphasises the importance of ensuring the safe and economical operation of modern railways. In paper [
8] a vehicle-crossing model was developed and was applied to the structural health monitoring of railway crossings. The configurations in the model were adjusted to match the real-life situation. The model was validated by the measurement results from the instrumented crossing and the simulations of a finite element model. The results in [
9] indicate that the crossing degradation was caused by the impact forces related to the motion of the passing trains.
The study in [
10] deals with the issue of allocating an effective maintenance limit for track geometry maintenance to minimise the total annual maintenance cost. They developed a cost model, considering the inspection, preventive maintenance, normal corrective maintenance and emergency corrective maintenance.
The paper of [
11] investigates the needs for analysing the track state and outlines what information is necessary to make good maintenance decisions. The general goal of the maintenance should be the improvement of the railway track performance by ensuring increased availability, reliability, and safety, while decreasing maintenance cost.
The DESTination RAIL project [
12] considered a number of railway infrastructure problems. Some techniques for identifying and analysing critical rail infrastructure were developed. They are based on a decision support tool and reliable data.
Useful strategy for maintenance is a condition-based maintenance (CBM) to act before a failure occurs; i.e., the maintenance is triggered when degradation occurs in the track. For example, the status of the railway track condition is monitored, recorded, and reported so that maintenance activities are performed on time, thus reducing breakdowns [
13]. In addition, paper [
14] proposes a condition assessment approach of tracks, where earlier fault warnings are assured.
Considering the maintenance the railroad switch, Reference [
15] presents the approach where the switch and level crossing detection are performed with vision based contactless image processing techniques. This includes edge detection, image processing filters, morphological feature extraction, Hough transform and SVM classifier.
There are many prognostic techniques and their usage should be adjusted to particular applications. These methods are either data driven, or rule or model based; each of them has advantages and disadvantages. Their combination, i.e., hybrid model, can benefit in usage; more complete information can be gathered, leading to more-accurate recognition of the impending fault state. Therefore, hybrid models are useful for accurately estimating for example the remaining useful life of railway systems [
16]. The importance of environmental stochastic behaviour is presented in [
17], which exposes some realistic working conditions.
The work of [
18] describes a procedure to overcome some realistic disturbances in the railway infrastructure, e.g., contact wire irregularity. The computational approach consists of a pre-processing procedure to eliminate the redundant information of the measures and extraction of the upper envelope of the irregularity. Several papers consider various artificial intelligence techniques that can be applied to improve the performance of the system or maintenance approaches [
19,
20].
The paper [
21] considers the design and operation of the switching concept that would improve the railroad switch performance.
3. Railway Case Description
This section introduces concepts related to the railway infrastructure maintenance and some technical specifics of railway switch maintenance.
3.1. Railway Infrastructure Maintenance
Most modern railways have low levels of capability installed as part of the signalling system. For switches this is in the form of the detection lines which verify if a switch is in the correct end-position. This low capability has serious limitations: First, the periodic maintenance tasks are carried out at intervals designed to mitigate risk with a considerable safety margin involving to send maintenance staff to the asset site on a regular basis, exposing them to the usual safety risks of a running railway. Without a continuous monitoring of the key parameters within an asset, the maintenance staff only have their own senses available to assist them in determining the true condition of the asset. Corrective maintenance is only carried out once the asset has failed, which causes severe disruption to train services if the failure occurs at a busy time.
Proactive maintenance makes it possible to recognize in advance the components that are starting to degrade or the occurrence of malfunctions, allowing planning interventions compatibly with production and giving the time to procure what is necessary.
In the case of complex processes, the monitoring of some critical parts of the railway infrastructure can bring significant benefits. These benefits derive from an increase in the efficiency, a reduction in losses due to stops and a reduction in spare parts costs.
The maintenance operator can also be continually updated regarding the performance of the switch via an intuitive Human–Machine Interface (HMI) that can show by remote faults and prediction alerts suggesting condition based maintenance actions. This will help him improve the operational availability and efficiency of the line. Furthermore, it must be considered that better maintenance produces greater safety.
The continuous monitoring of diagnostic parameters of switches and condition based maintenance approach minimize the number of inspections and revisions, by the use of flexible and reliable detection methods.
3.2. Railway Switch
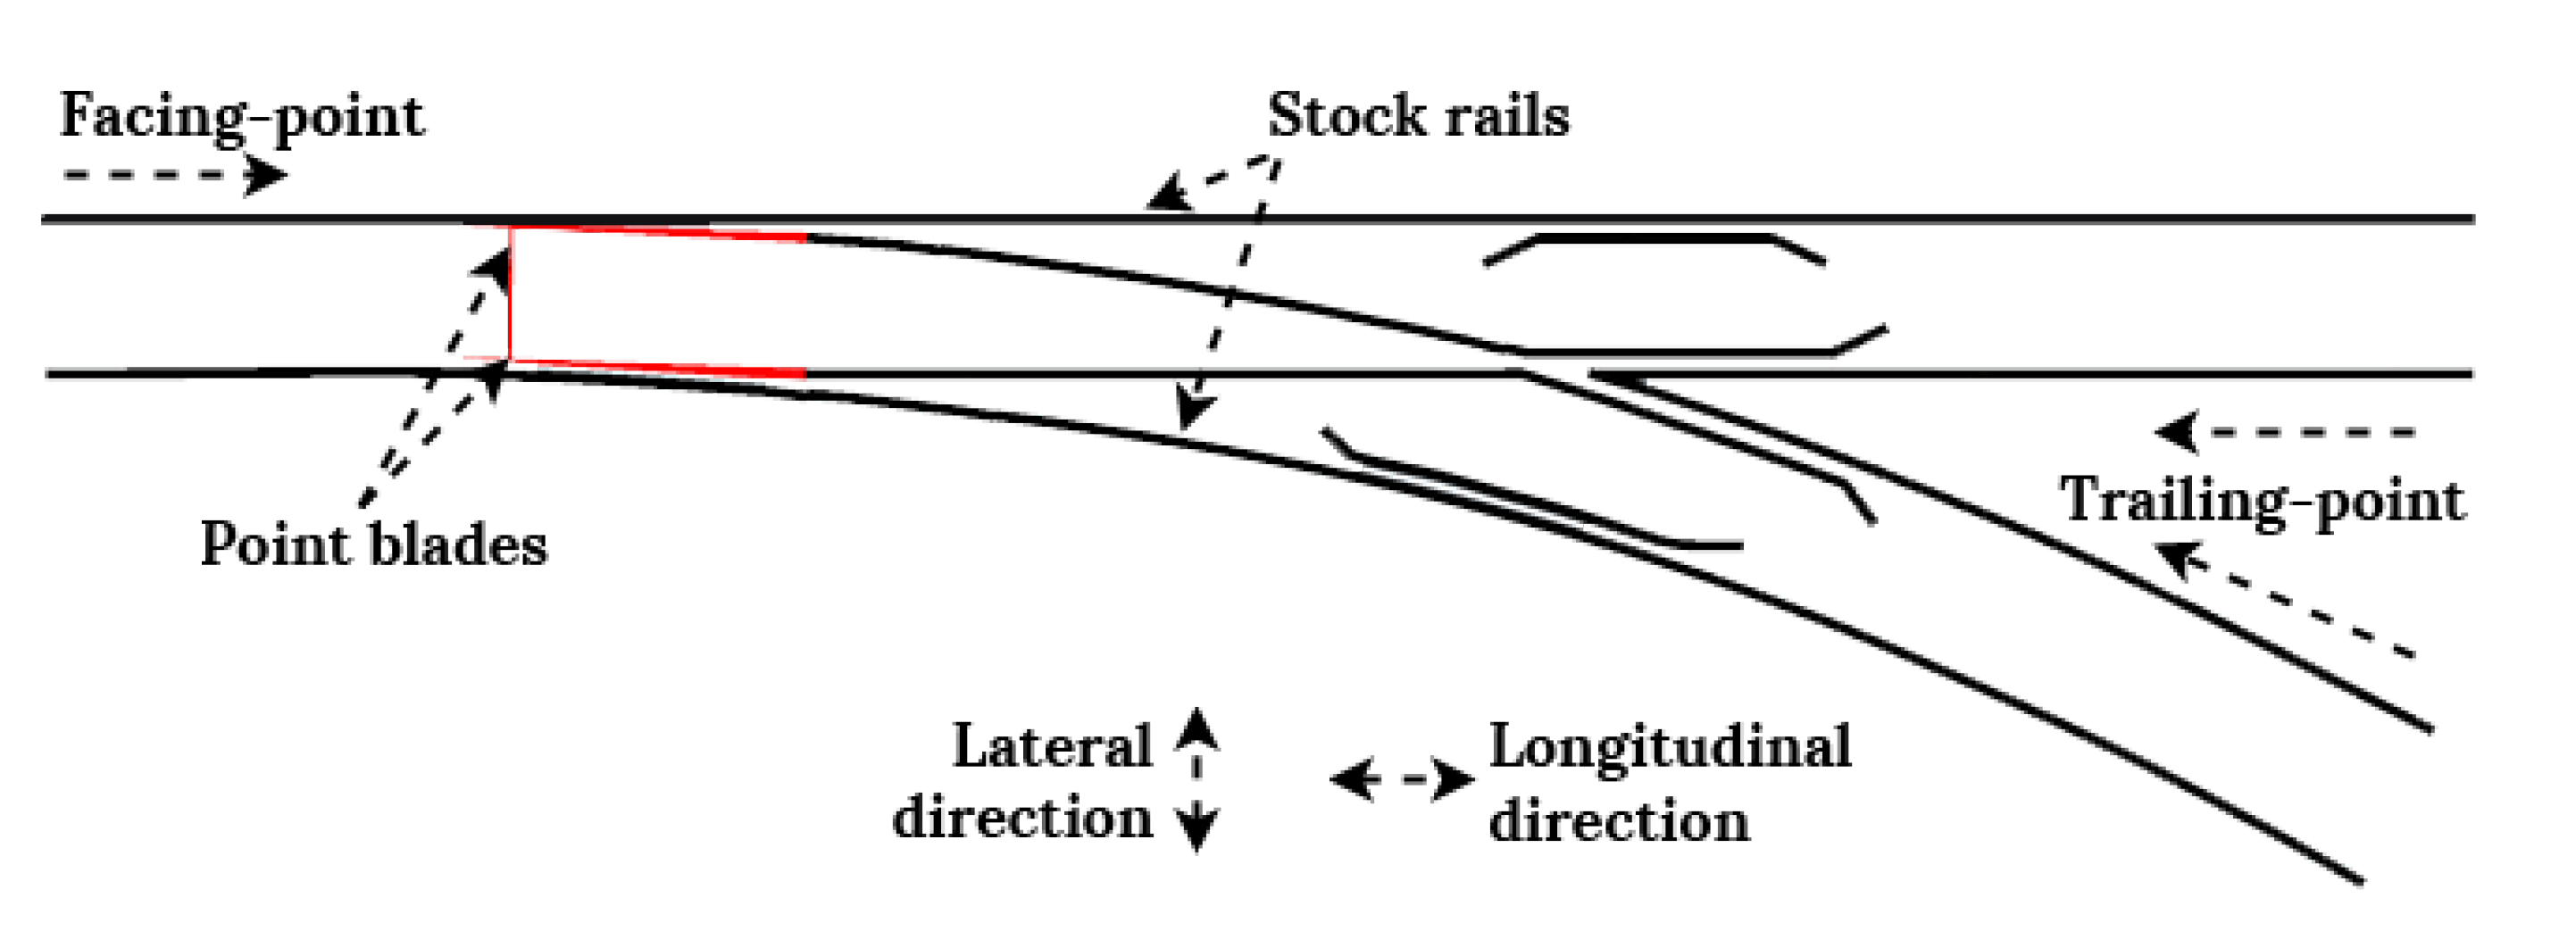
A railway switch is a mechanical device on the railroads that allows railway trains to change tracks from one to another (see
Figure 1). When the train has to move to another set of tracks that are split off of the current set of tracks, the switch is used. The switch can be operated either by the switch-man on the locomotive or another employee in the railroad yard by moving the switch and line the train upon the correct set of tracks. The activation of the railway switch is performed by moving a long arm from side to side and therefore moving the train tracks to the desired position. Still, many railway switch activations are accomplished manually, however, some are already electronic and can be changed by an employee in an elevated office at the railroad yard.
The railway switch system consists of several components. Switch panel ensures the continuity of two or three diverging tracks, at the beginning of the divergence. Point machine (actuator) is a mechanical system which induces the switching movement between the two extreme positions. The locking device locks the switch in one position to prevent movement of the switch rails as traffic passes. Position detection devices detect the position of the switch and they are linked to the signalling system. Driving devices (drive rods, slide chairs and rollers) are mechanical components which assist in the movement of the switch rails. The heater is used in cold countries to prevent the switch from freezing solid.
4. Data Processing
Railway switches have been characterized by two sets of time-series data. This section explores the possibilities for forecasting failures, based on historically available datasets. This information can be categorized into two types:
Control data: data coming from the switch control unit. It includes the commands sent to the switch and some control data collected as a feedback from sensors on the switch. The information collected is coarse grained, with the structure of a log sequence. This data can be analyzed by some existing log file analysis approaches. However, the coarse grain and the lack of a sufficient amount of information from the field (including tagged data describing anomalies) resulted in an analysis that is not able to build a relevant model that can actually be used. The aim of analyzing such data by applying techniques such as support vector machines and other machine learning approaches is to determine a model of the default behaviour of the switch, and to identify anomalies in the behaviour. Among various purposes of diagnosis and prognosis [
22], such data can be used for failure prediction [
23], and other proactive maintenance purposes [
24], including root cause analysis and the calculation of remaining useful life.
Physical data: data coming directly from additional sensors temporarily added to some specific switches, being able to measure some physical parameters at a sample rate of at least 1 kHz. The most interesting parameters that can be considered for the analysis are the current profiles, the duration of the movement, and the environmental conditions.
Our goal is to detect anomalies that may result in a maintenance problem. In particular, we are focused on:
Systematic drifts of the profiles: This can be caused by the accumulation of dust on the moving parts of the switch causing an increasing amount of current leading also to a failure of the switch.
Deviations from the expected behaviour: This can be caused by physical obstacles to the movement of the switch that may cause damage to the device.
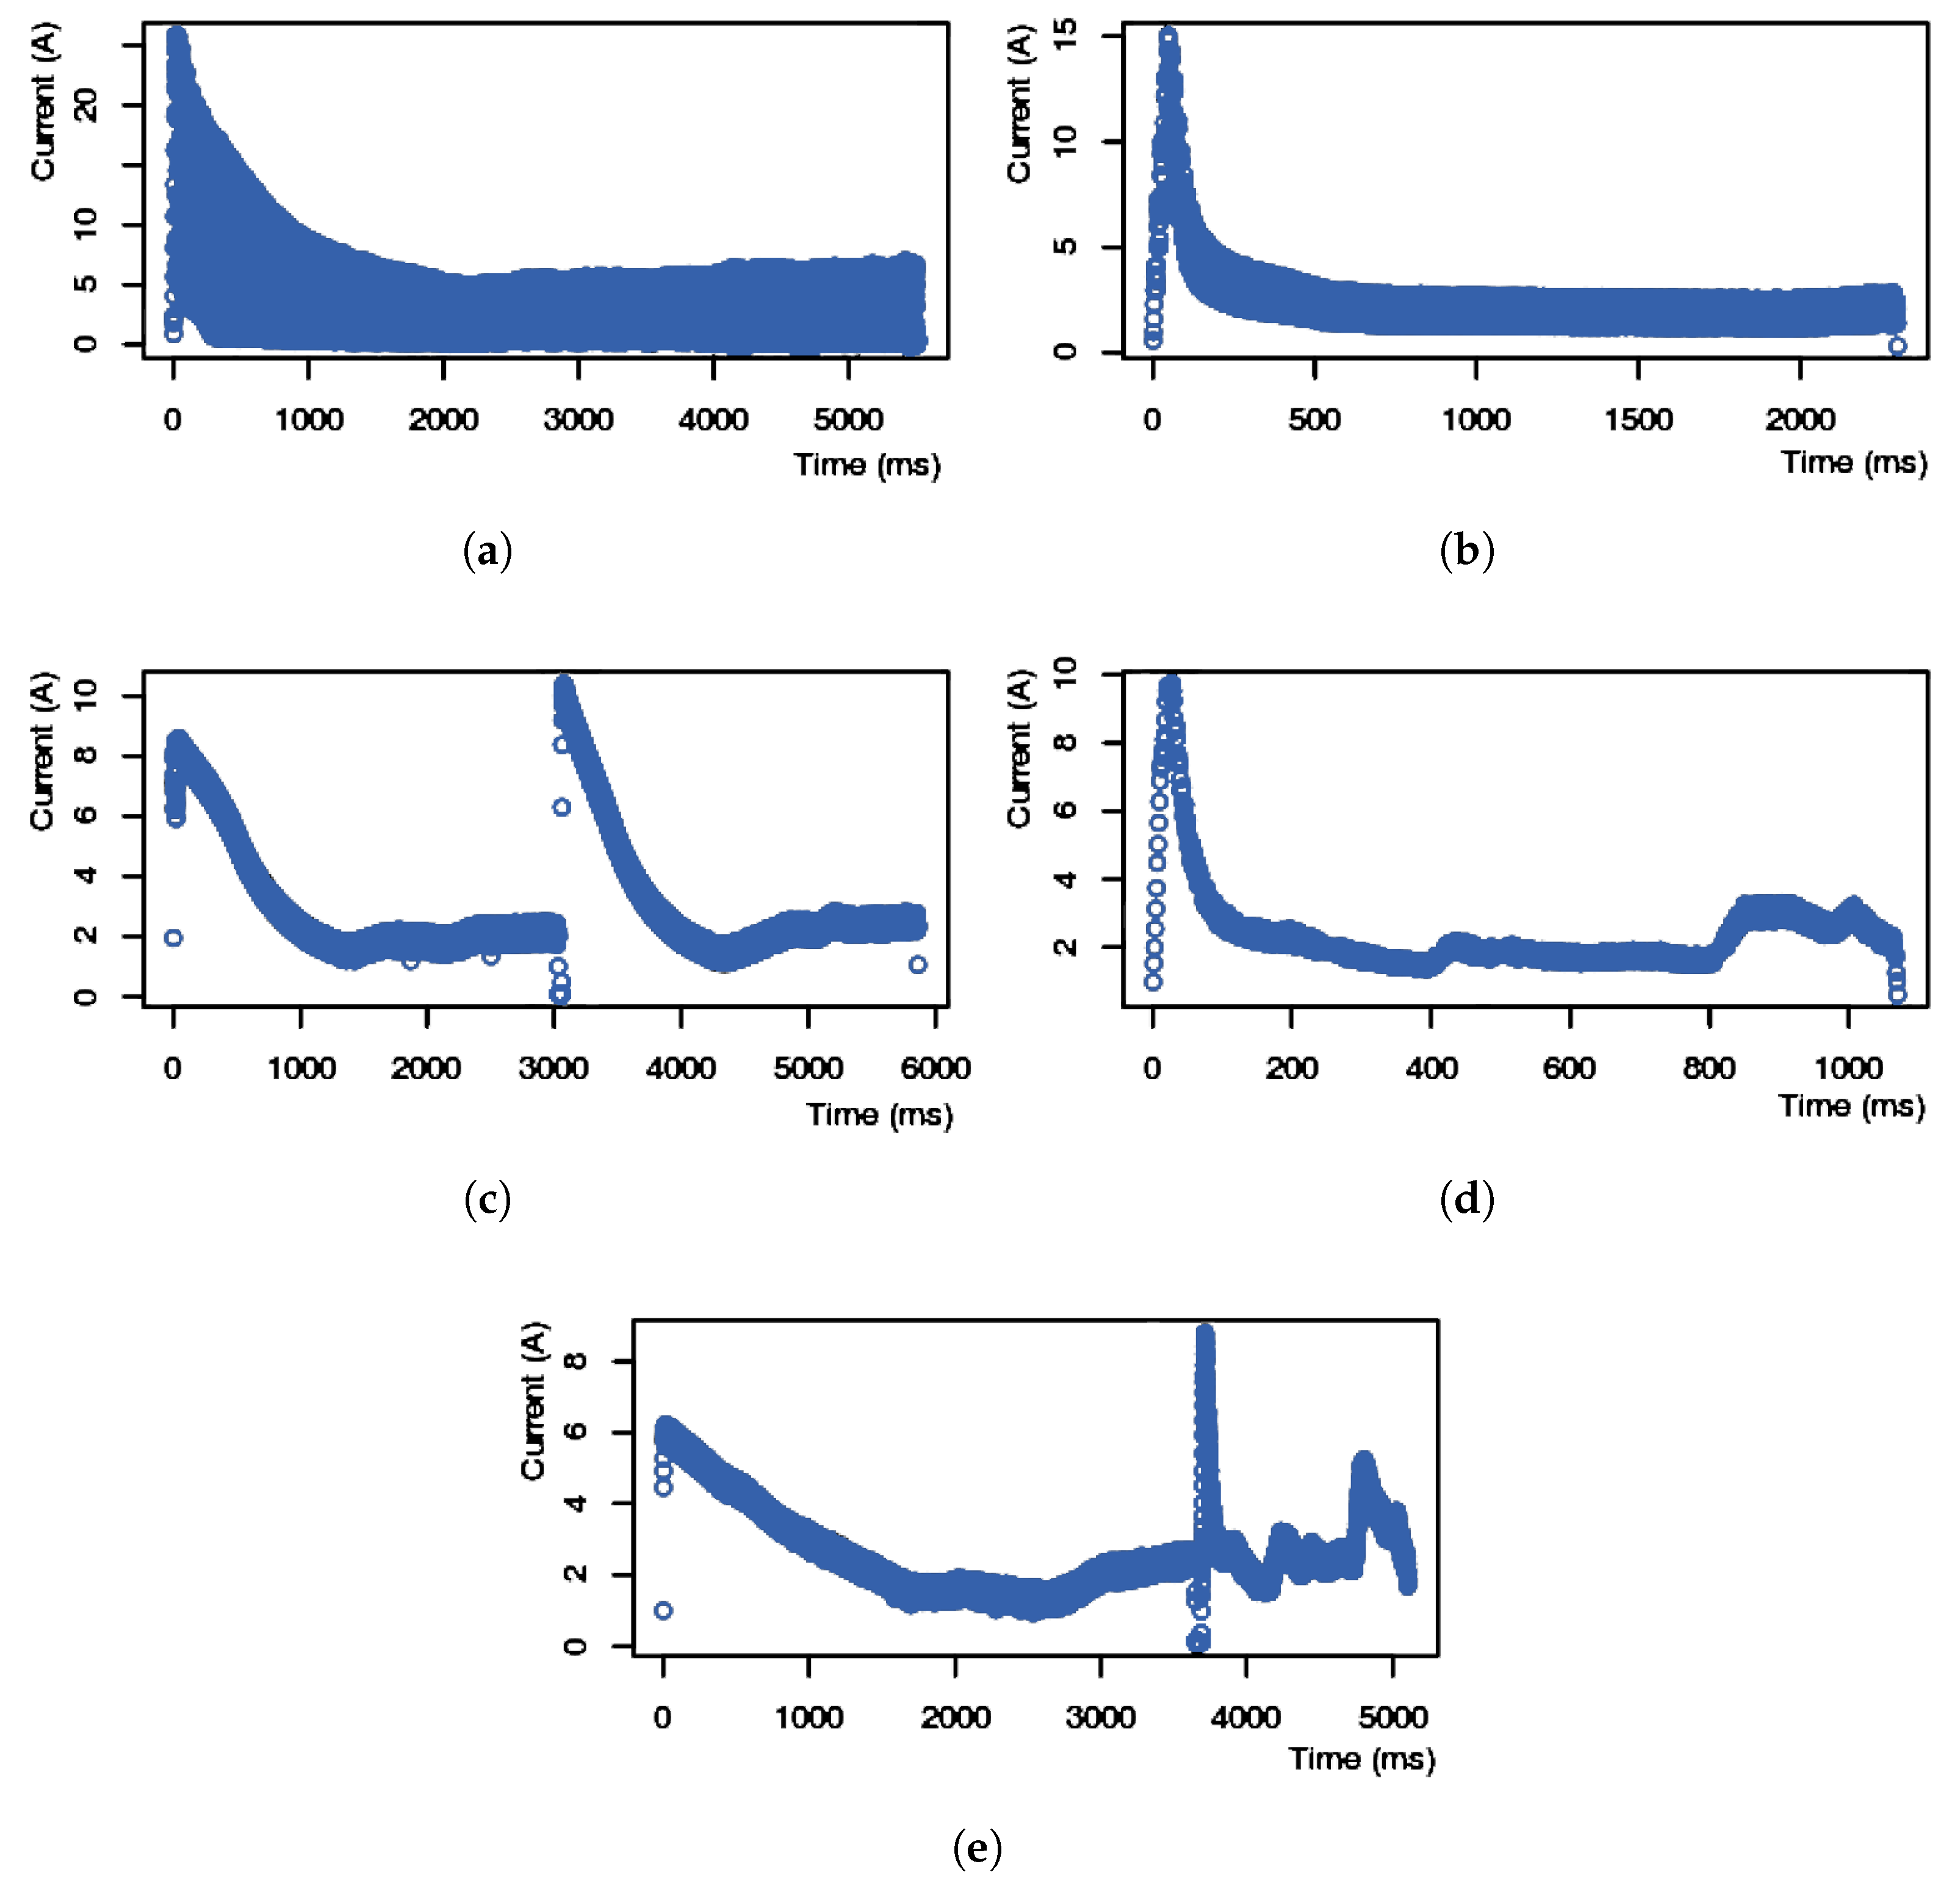
During data exploration, we have identified five profiles of the current (see
Figure 2):
Profile 1: A very noisy profile that makes the identification of the behaviour difficult and may highlight problems in the data collection. In particular, in the correct positioning of the sensor and/or the presence of sources of noise that may alter the collection.
Profile 2: Similar to Profile 1, but with a limited amount of noise.
Profile 3: Expected profile of a double switch.
Profile 4: Expected profile of a switch.
Profile 5: Profile of a switch with an abnormal behaviour.
The profile of the current depends on several physical variables that are linked to the mechanical and electrical components used to build different switches. Therefore, the profiles are linked to the specific model of the switch from which the data are collected. Moreover, environmental factors can also influence the current: Temperature, humidity, and dust.
Due to this large variety of the presented profiles, the main problem is the identification of an approach to define the default correct behaviour. This can be done in various ways:
Using electro-mechanical equations: This approach is able to define the physical model of each switch, and it is able to predict the correct behaviour in many environmental conditions. However, it requires building a model for each kind of switch and tuning the parameters for each installation.
Using a statistical approach: This approach requires the collection of data from a wide set of devices in different operating conditions to define the default behaviours that will be known with some level of uncertainty, but it does not require the manual development of a physical model for each switch, can be derived from the data, and can be adapted to different models just by collecting additional data.
After the investigation of the applicability of these approaches, we decided to explore the statistical one in depth, since in the actual case it requires less human intervention.
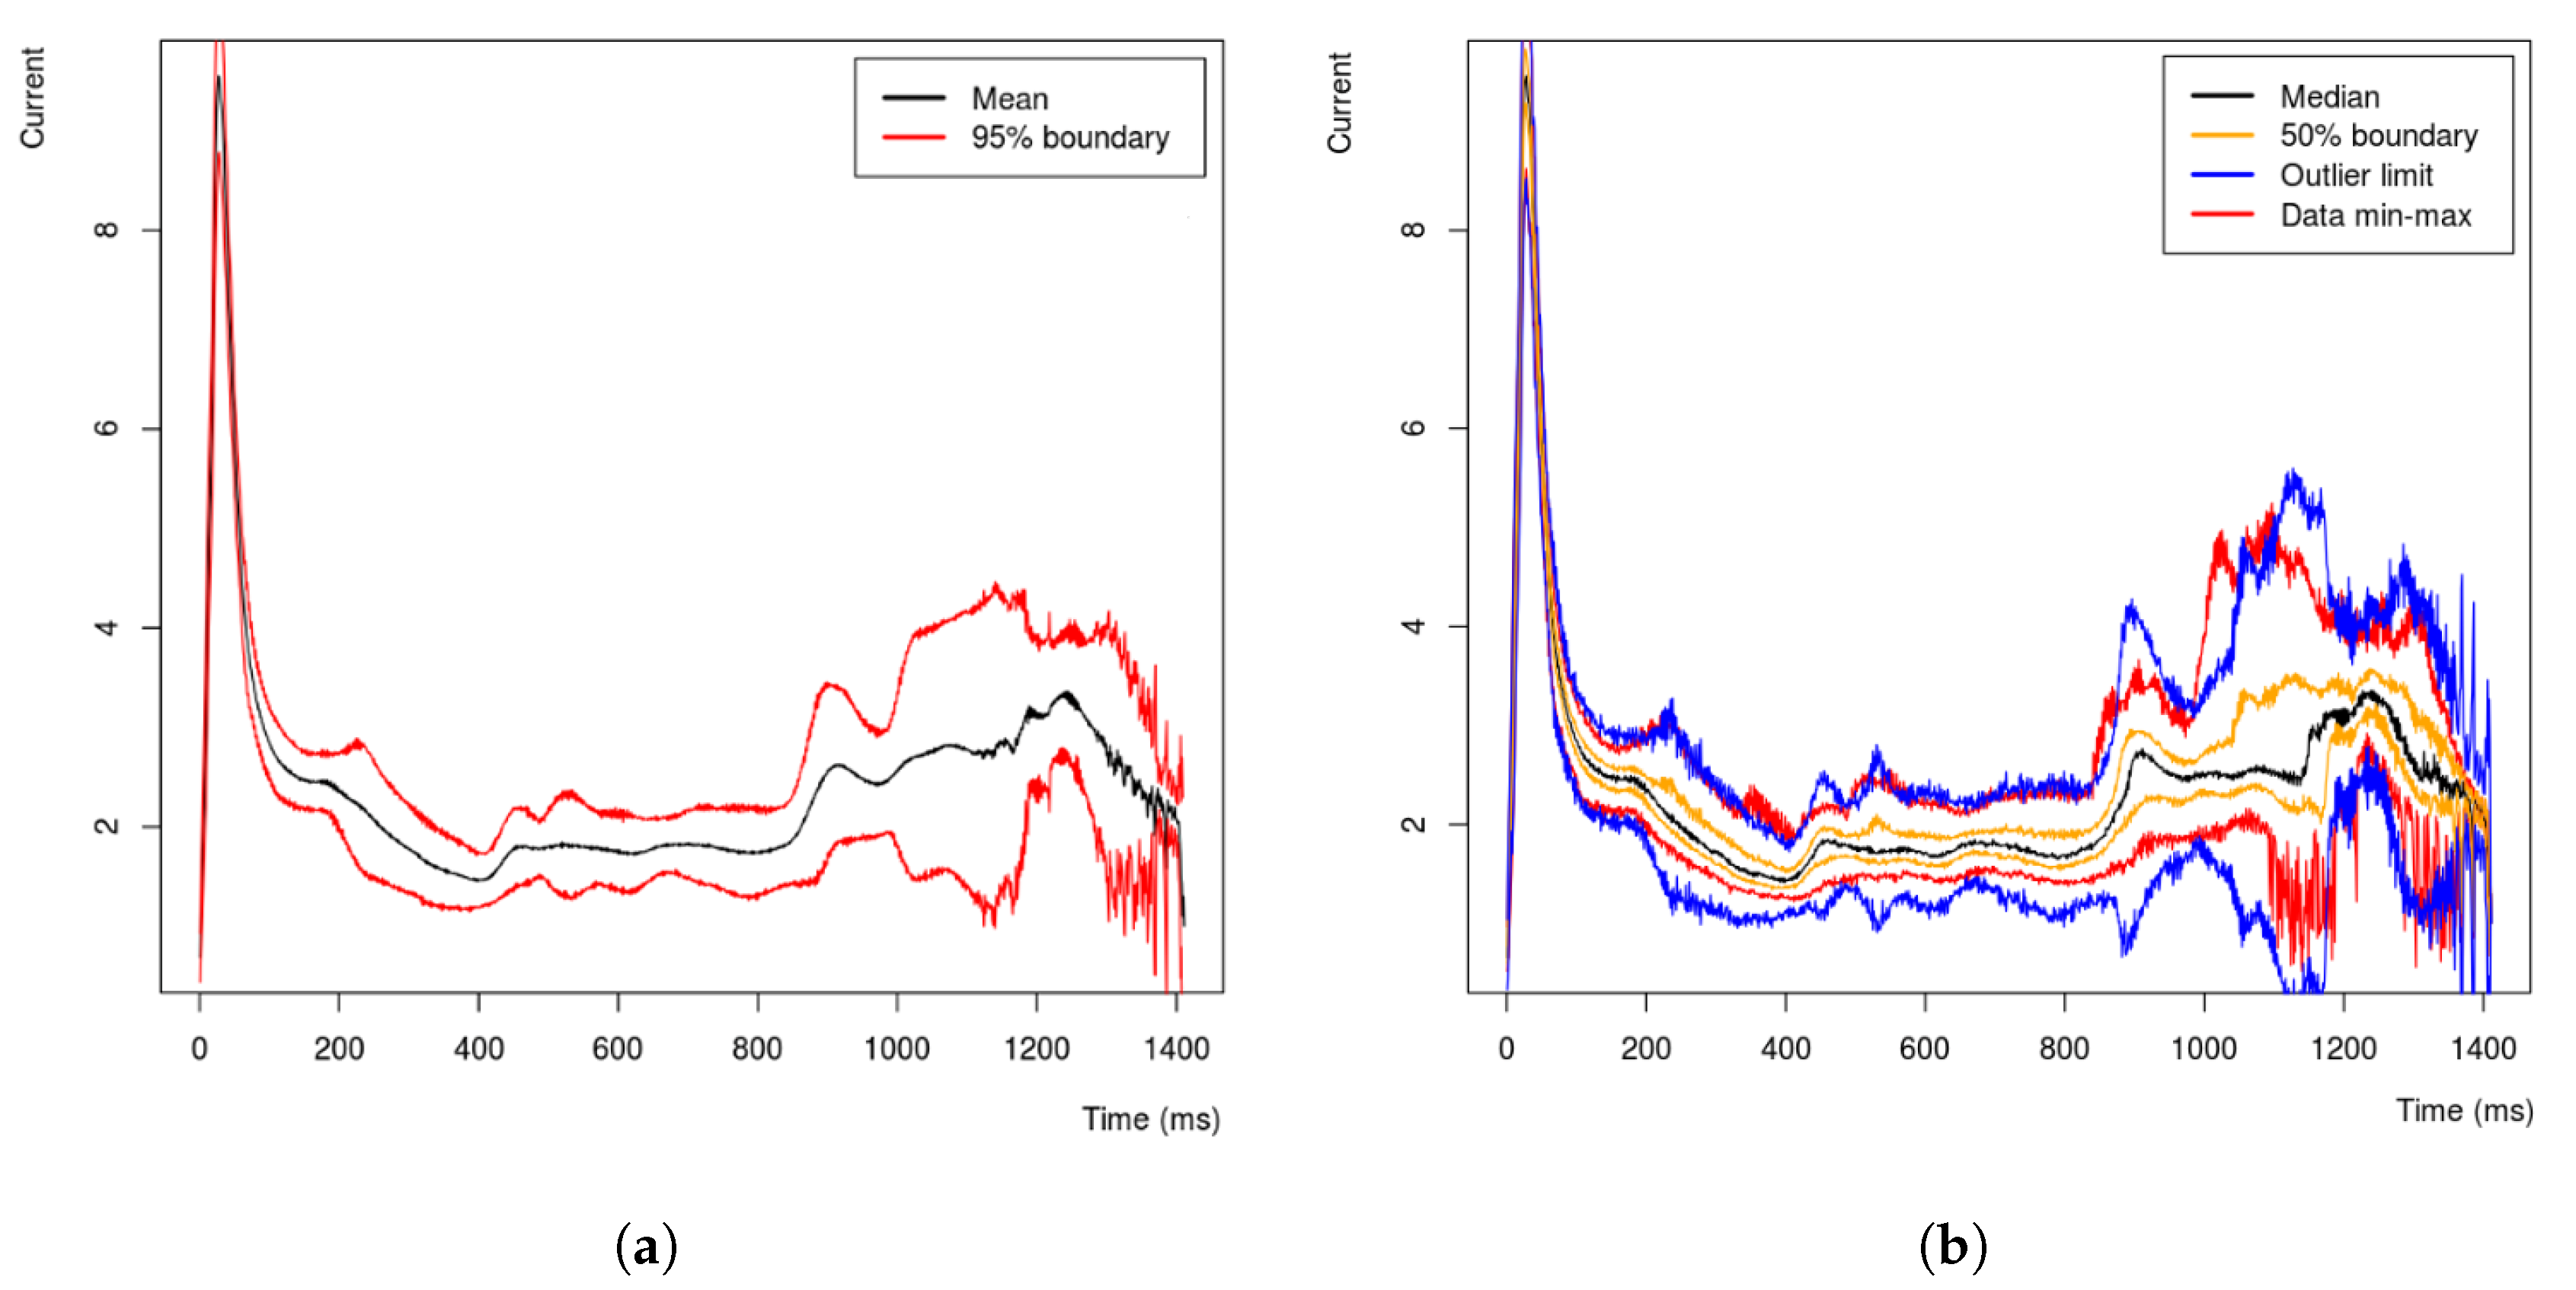
In
Figure 3a, a statistical model defined for a specific switch is presented. At this time, the black line is generated calculating the median of the different time series representing the current profiles of hundreds of movements that we know they happened correctly. The red lines define the interval in which we found 95% of the variability. However, to have a more detailed representation, we show more intervals in
Figure 3b. The different sets of bands can be used to understand the behaviour of a specific movement. The blue band defines a range in which the current is considered acceptable during the movement of the switch. If the current is outside the bands, a warning can be risen. Therefore, the definition of proper bands is of paramount importance for the detection of an abnormal behaviour. Since the distribution of the samples at each time instance is not normal, we have defined the outliers’ bands using the 1st and 3rd quartiles, defined according to the Tukey’s range test for outliers [
25] (see
Figure 3b).
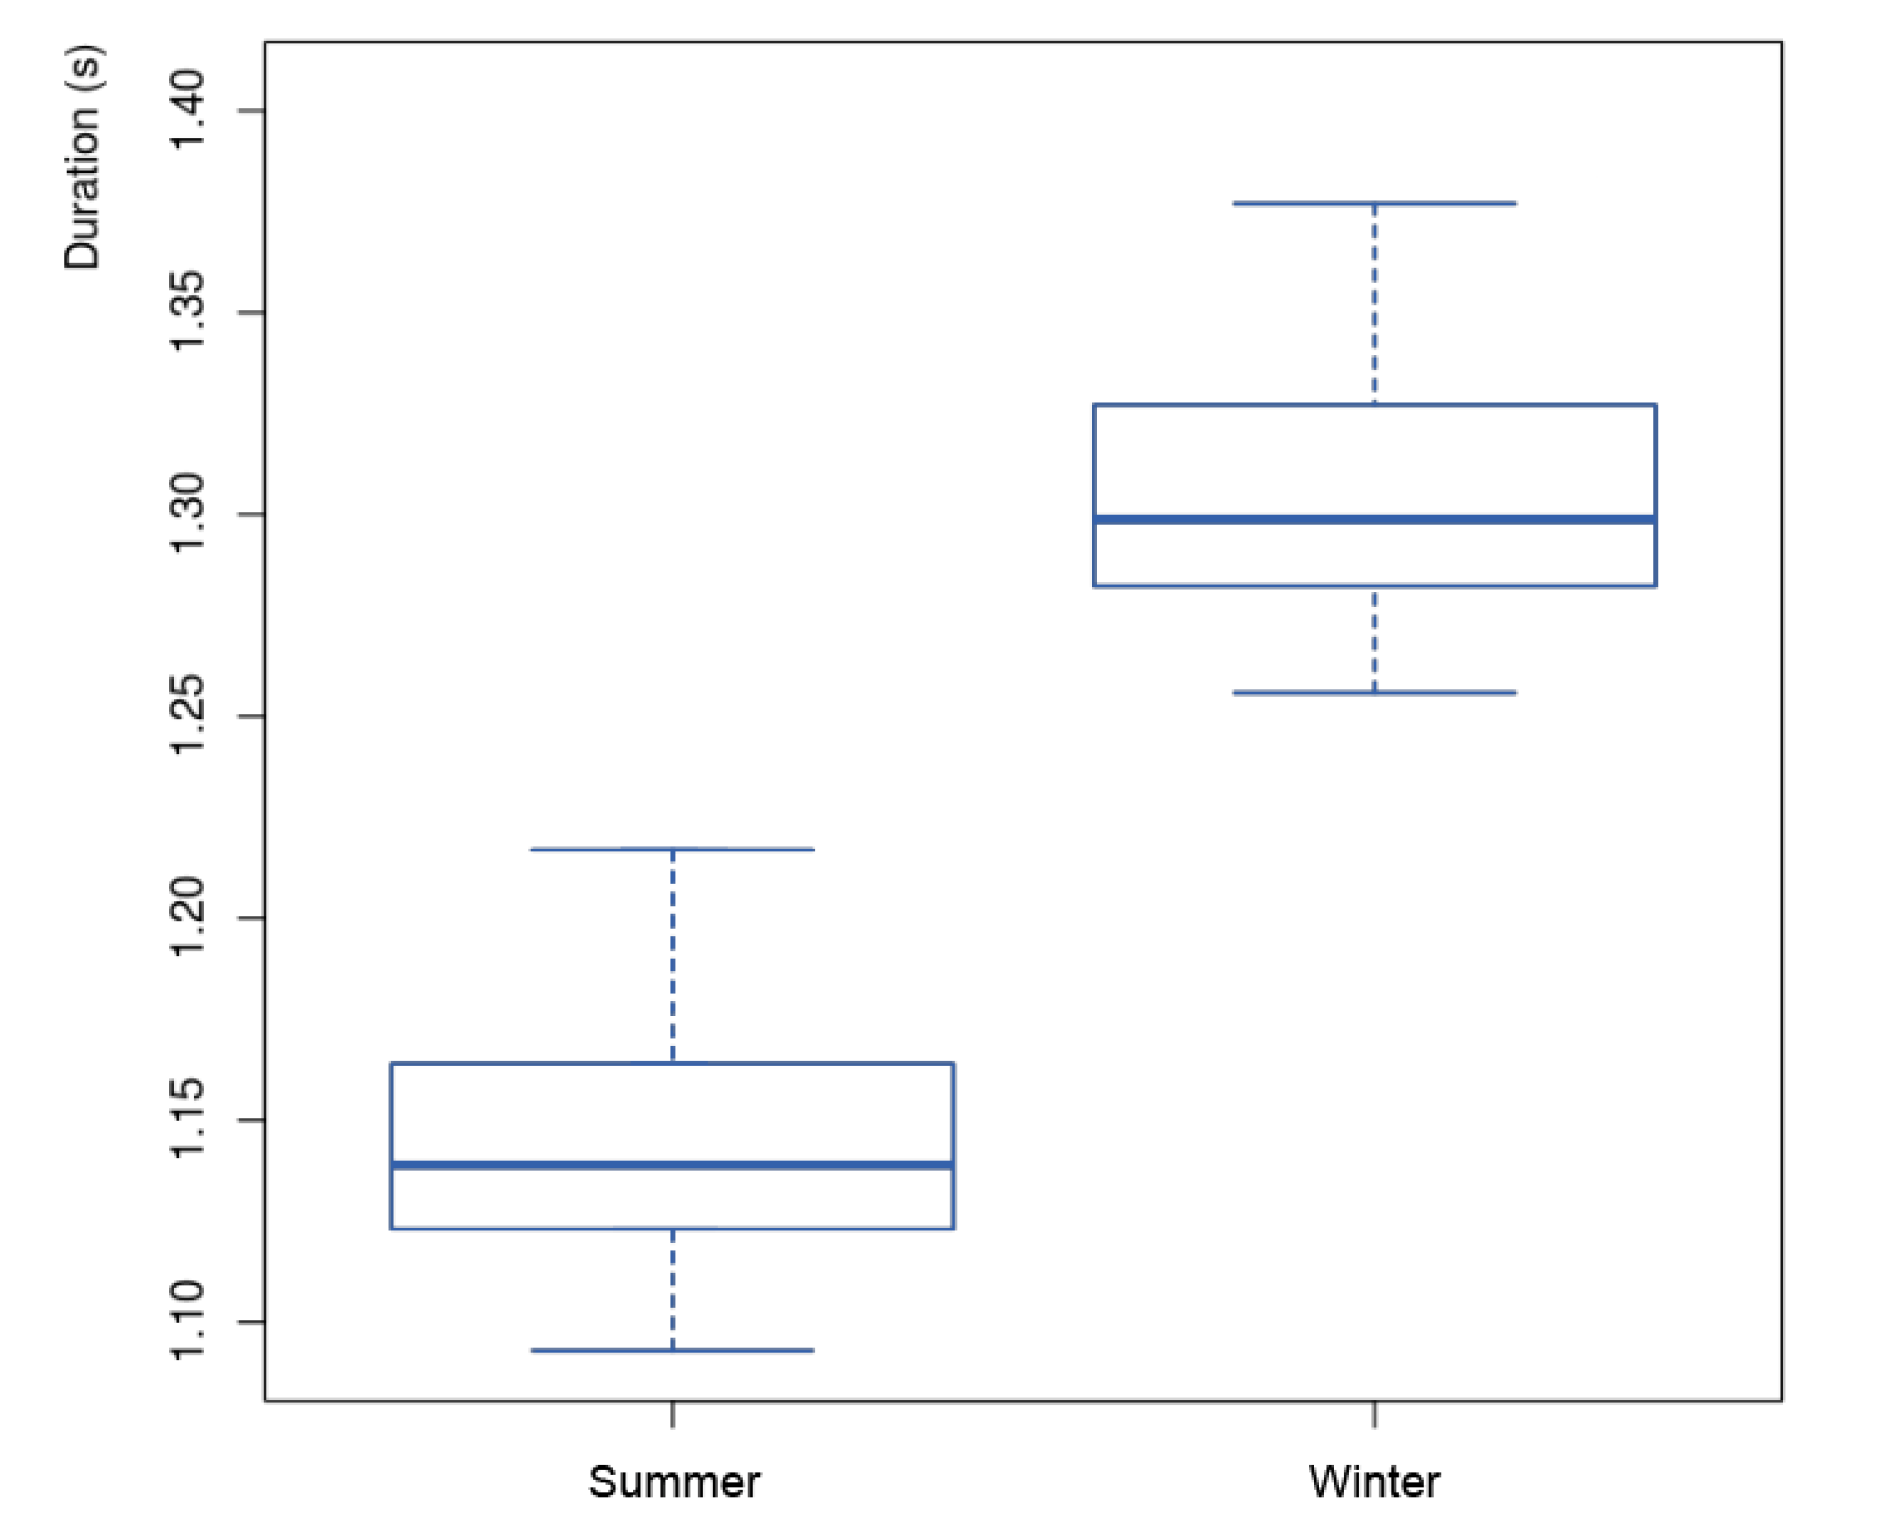
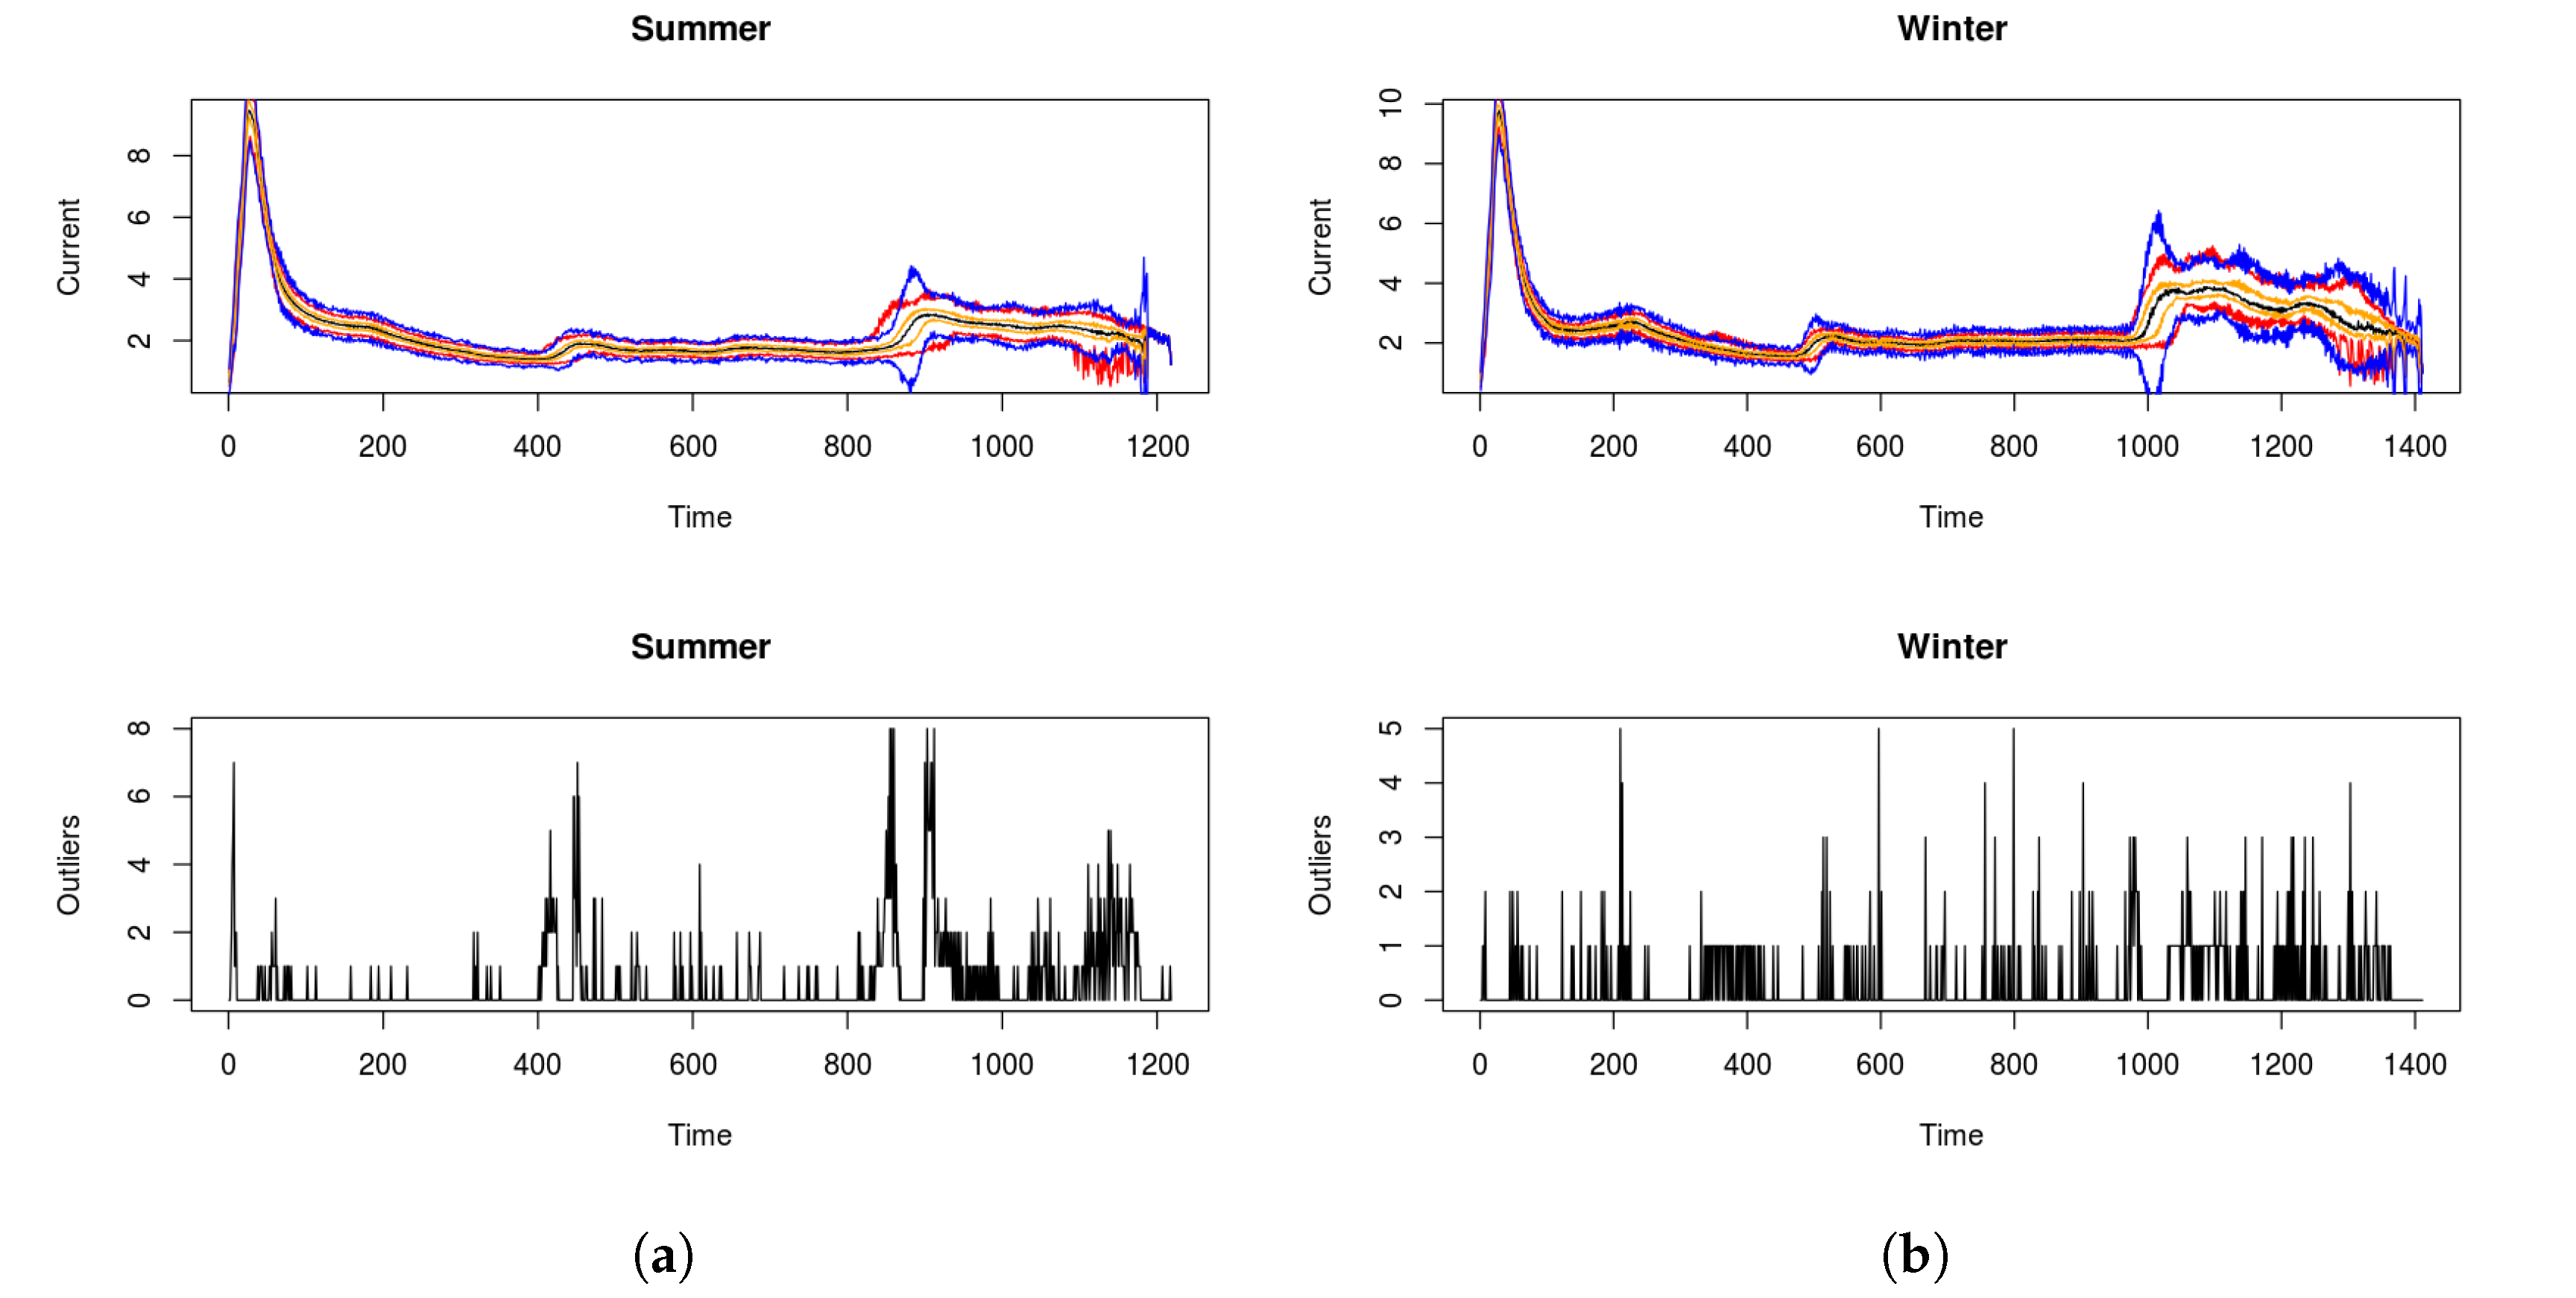
Looking at the diagrams, we have noticed a quite wide range, especially at the end of the movement. After a deeper investigation, we have found that this behaviour is due to the fact that the analysed single set of data was hiding two different data sets. In fact, the behaviour of the switch is different in the summer compared to the winter due to the temperature sensitiveness. In particular, there are several aspects that are connected to the temperature, such as the duration of the movements (
Figure 4) and the current peaks (higher in winter).
For these reasons, it is not sensible to define a statistical model without considering the season (actually the temperature of the environment). To address this problem, we have performed the same analysis, dividing the dataset into two sets based on the time of the year.
To validate the model developed in this way, we have used a bootstrap approach building the model using a random subset of the correct movements in the same season.
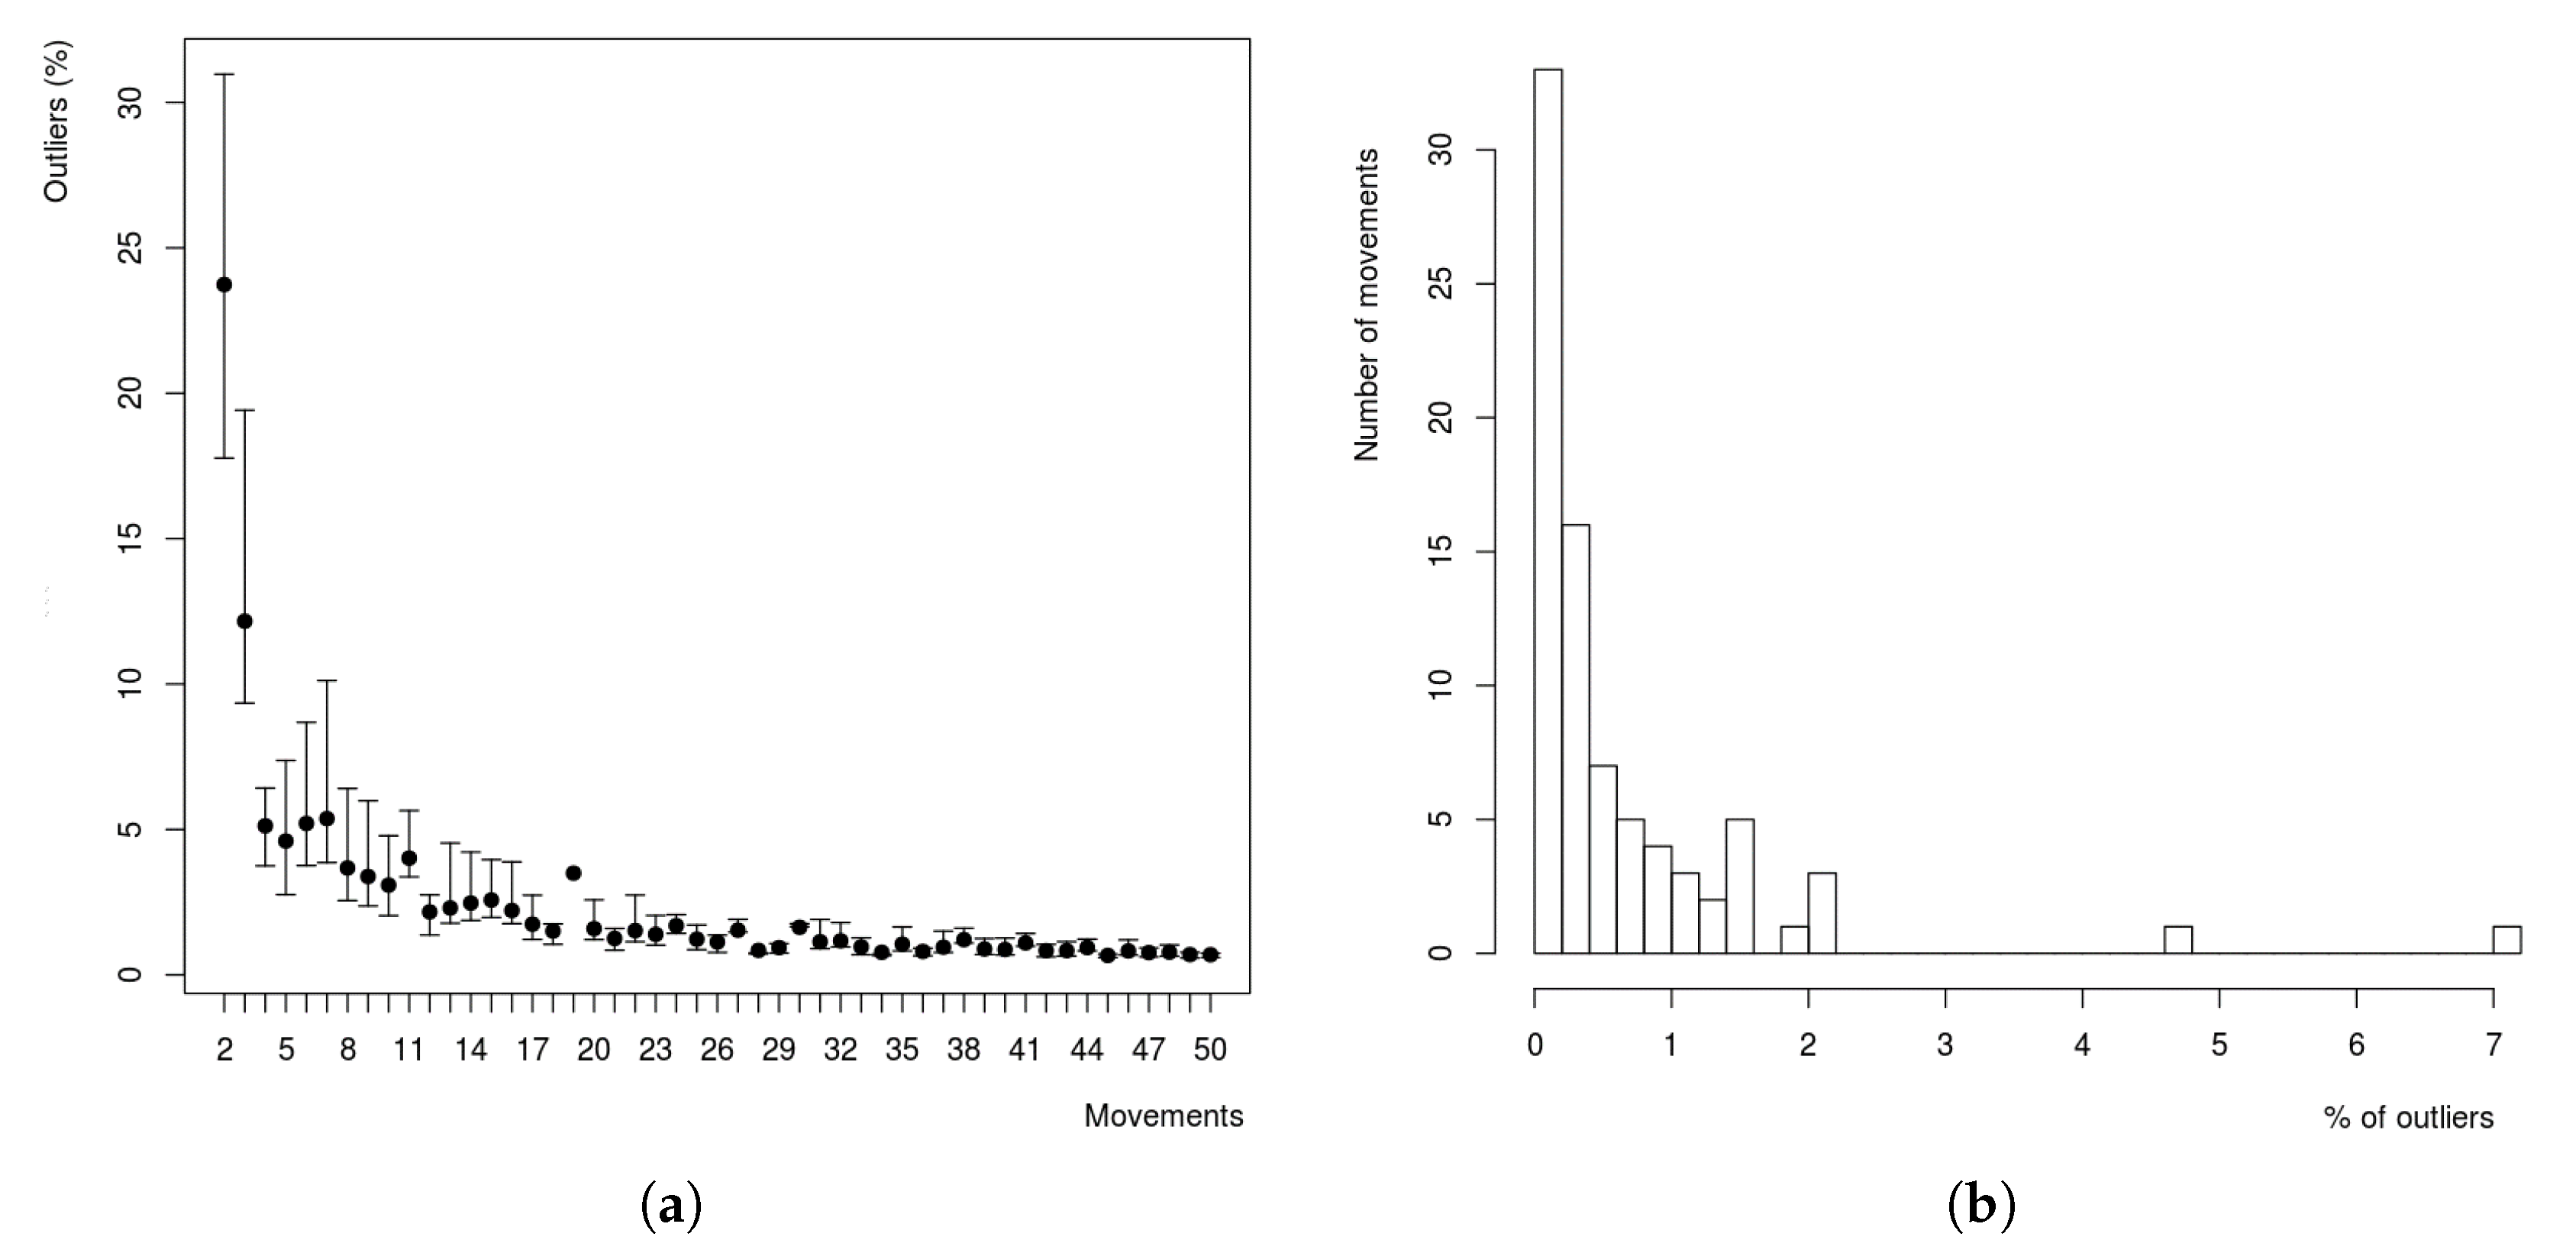
Figure 5a shows the number of outliers when the model is trained with a specific number of random movements. From the diagram, it is clear that the more movements are considered in the model the better it becomes. However, after about 25 movements, the performance is not improving much, and the number of outliers is below 2% of the samples.
To further investigate the distribution of the outliers in the movements, we have analyzed how many outliers are present in each movement. This is useful to find out if such outliers are spread across the movements (therefore, having outliers in any movement is quite usual) or not (therefore, outliers are rare). According to the analysis (
Figure 5b), nearly all movements have a number of outliers that are below 2% of the total samples. This means that having some outliers is very common, but their presence is very limited compared to the total number of samples. This behavior could be used in the detection of abnormal behaviors since we expect a much higher number of samples outside the boundaries.
This analysis is very helpful for defining the statistically correct behaviour of a switch using data coming from the field and tuning a model without any specific knowledge of the internal structure of the switch. In this way, the model can be easily adapted to different switches working in different conditions. However, due to the temperature sensitiveness, the model must be tuned using data in different seasons.
Figure 6 shows the bands identification and the absolute number of outliers (at each time instance) dividing the dataset based on the season. It is clear how the variability of the data in such cases is very limited compared to the case in which we consider all the data together.
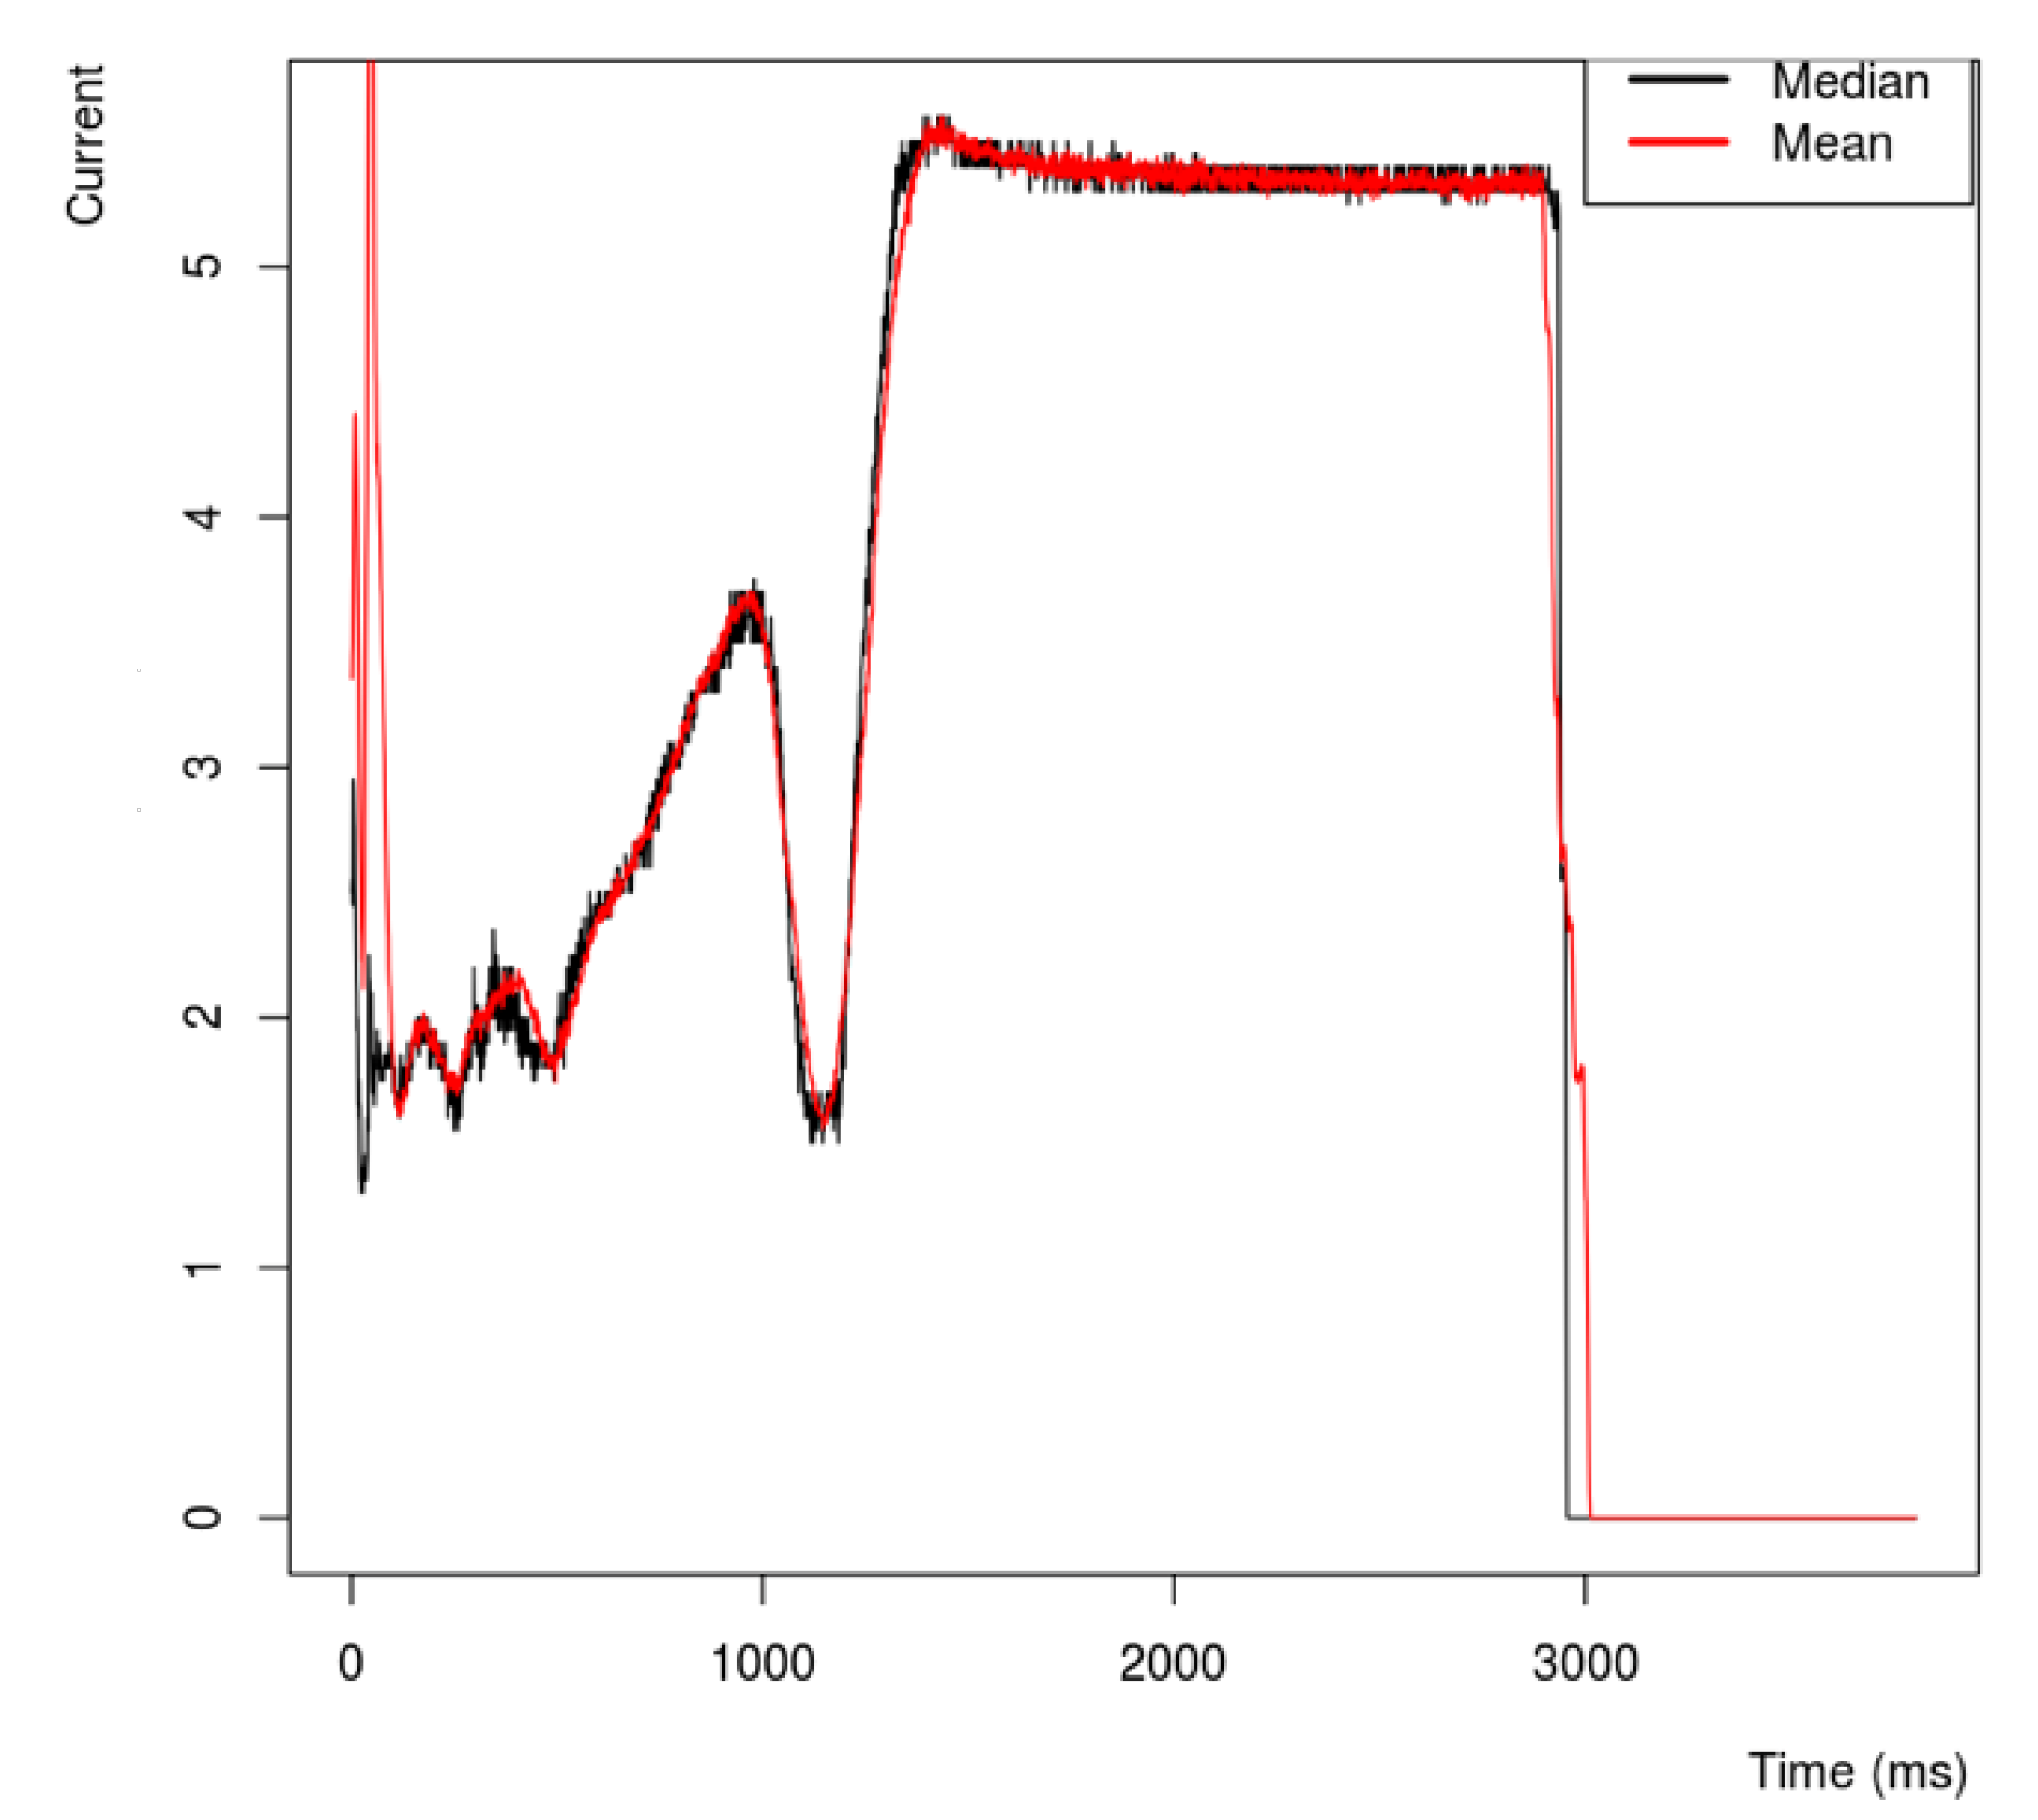
We have also tested the adaptability of the approach to switches with different internal structure and we have developed a similar model that has almost the same properties (
Figure 7) but with a very different current profile.
5. Measurement System for Proactive Maintenance of Railway Switches
Using only historical data is inadequate for predicting failures and diagnostics precisely, since a lot of factors that affect the condition of a railroad switch change over time and theses changes cannot be taken into account. In order to collect real-time data with the required precision and regularity, a completely new, low cost but non-invasive measurement system that can be attached in retrofit to operational switches has to be implemented. The main goal of this system is measuring new factors in real-time that affect the life expectancy of the railway infrastructure.
This system is based on the MANTIS platform [
26] built for proactive maintenance of cyber-physical systems, and complies with the architecture of the platform in full extent. Therefore, this system is a concrete instantiated example, and consists of the following modules (see details in [
3] and in
Figure 8):
Standalone data gathering edge device;
Edge broker implementing MQTT;
The MIMOSA database using Microsoft SQL Server;
Data analytic modules;
The MANTIS Human–Machine Interface (HMI).
These modules can be clearly mapped to the MANTIS platform reference architecture [
26], that contains sensors, local data processors (as edge nodes), central data processors (both batch and stream types), central databases, and distributed, tailored HMIs.
The heart of this device is an STM32F4 series MCU (Microcontroller Unit) which employs a single ARM-Cortex-M4 core. It is capable of collecting, storing and pre-processing the information, while also handing the messaging tasks, as well. It offers numerous communication interfaces (including UART, SPI, I2C) and 12-bit analogue-to-digital converts; thus both analogue and digital sensors can be used.
In this case, this system includes (i) one digital integrated humidity and ambient temperature sensor, (ii) one digital temperature sensor and (iii) four analogue displacement sensors.
5.1. Collecting New Set of Factors
The system measures several factors that can affect the wear of the railway switch over time. These expert-identified factors can be divided into two groups:
Operational factors: These parameters are directly related to the operation of switches—that is why they have a significant impact on condition deterioration. In our implementation, we measure lateral and longitudinal displacement of point blades. These point blades direct trains to one of the possible paths, i.e., they are the moving parts of a switch.
Environmental factors: These parameters are well-known to affect almost every physical system. The most significant one is temperature. More precisely, the ambient temperature and the temperature of the rails are measured. The latter value can cause dilation of rails, thus it affects the operation of switches indirectly. Another environmental quantity is humidity, which plays a lead role in corrosion.
Since the environmental parameters are changing slowly, reading the values periodically, e.g., every half an hour, provides appropriate accuracy and resolution for this use-case. In case of displacements of switch’s point blades, the required sampling frequency is higher than in the other case and we are interested in gathering data only during switching sequences.
Using event-driven measurement cycles is the chosen and effective solution, but it has disadvantages as well: The trigger signal can be noisy. For example, if a train crossing the junction shakes the whole equipment, the point blades and that shake will trigger a fake measurement. Moreover, if the device starts a measurement and the actual position does not reach the end position (just nearly approaches it), the measurement cycle will not stop.
Another option could be to trigger when the actual position of the point blades crosses a predefined threshold level and stop the measurement if it crosses another threshold level. In this case all information about the movement between the real end positions and the threshold levels would be lost.
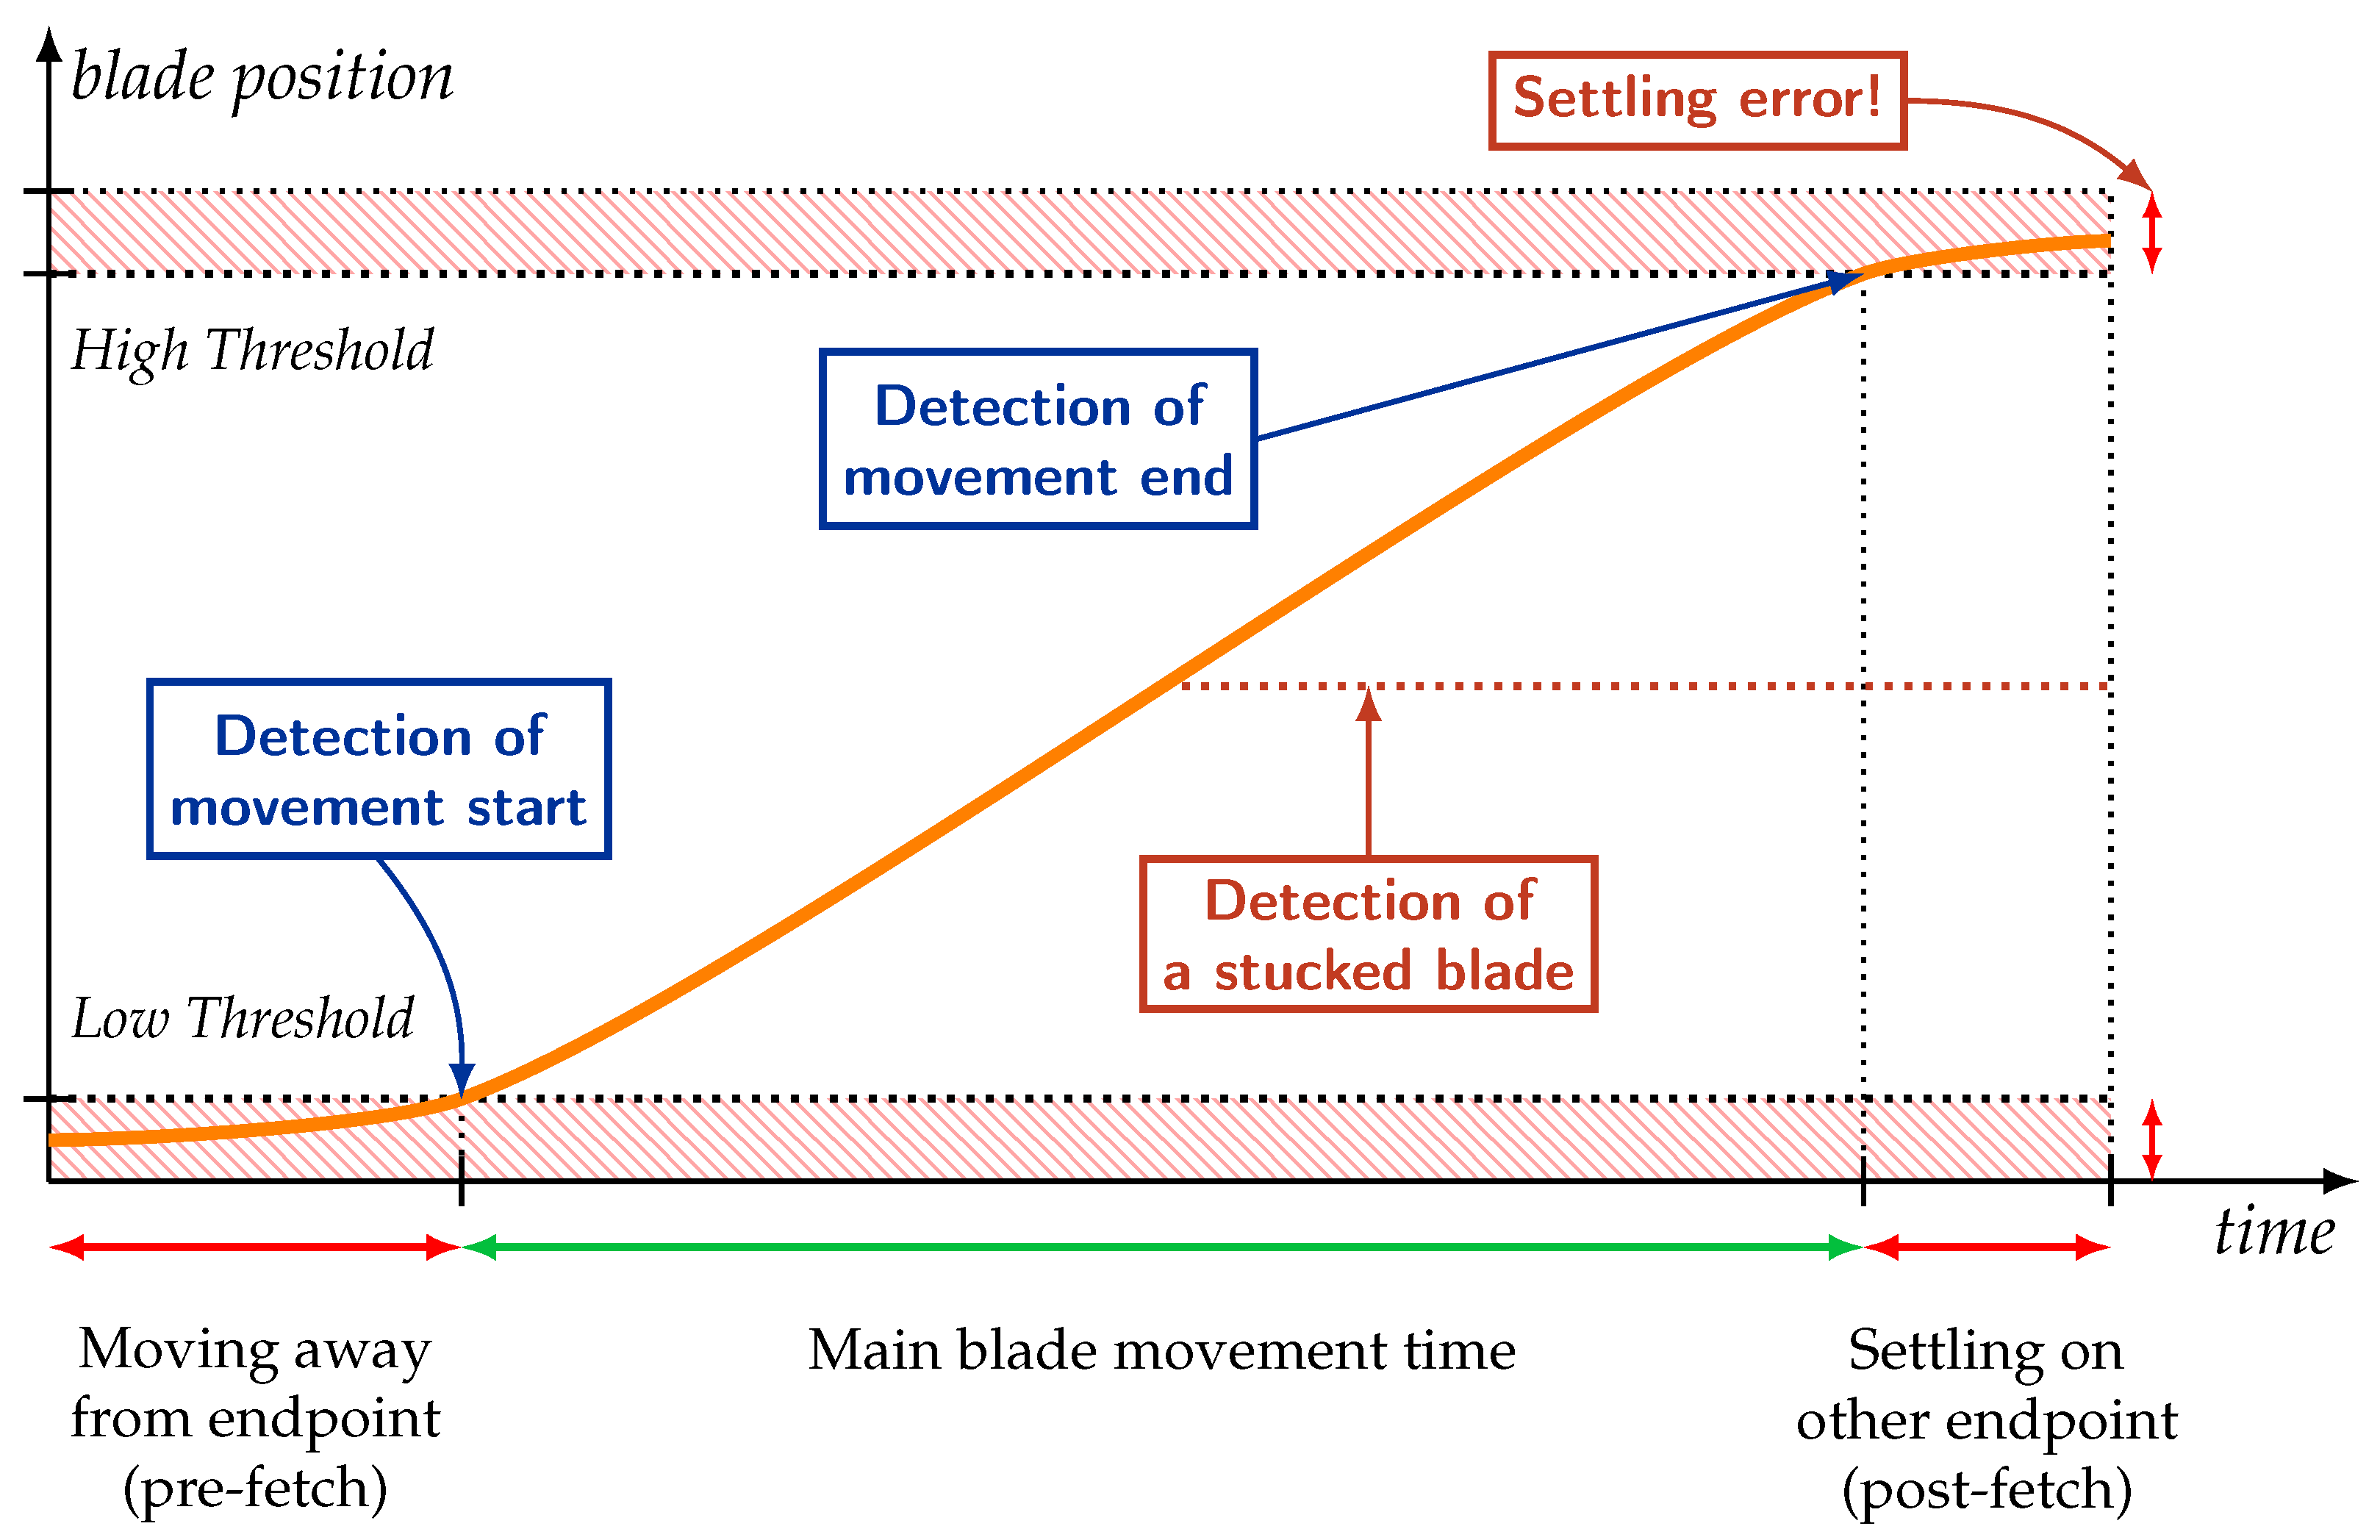
To mend these issues, our system is a mixed solution that relies upon trigger events. The values of displacement sensors are read continuously at a sample rate of 100 Hz into circular buffers with an appropriate size. If the actual position of the point blades crosses a threshold level, the device will store the data from the buffers until the position crosses the other threshold level. Moreover, the device will store less amounts of additional data that represents the moving between end positions and threshold levels. These intervals are called pre-fetch and post-fetch intervals, as
Figure 9 shows. Therefore, the stored dataset will cover the whole switching process without losing any relevant information.
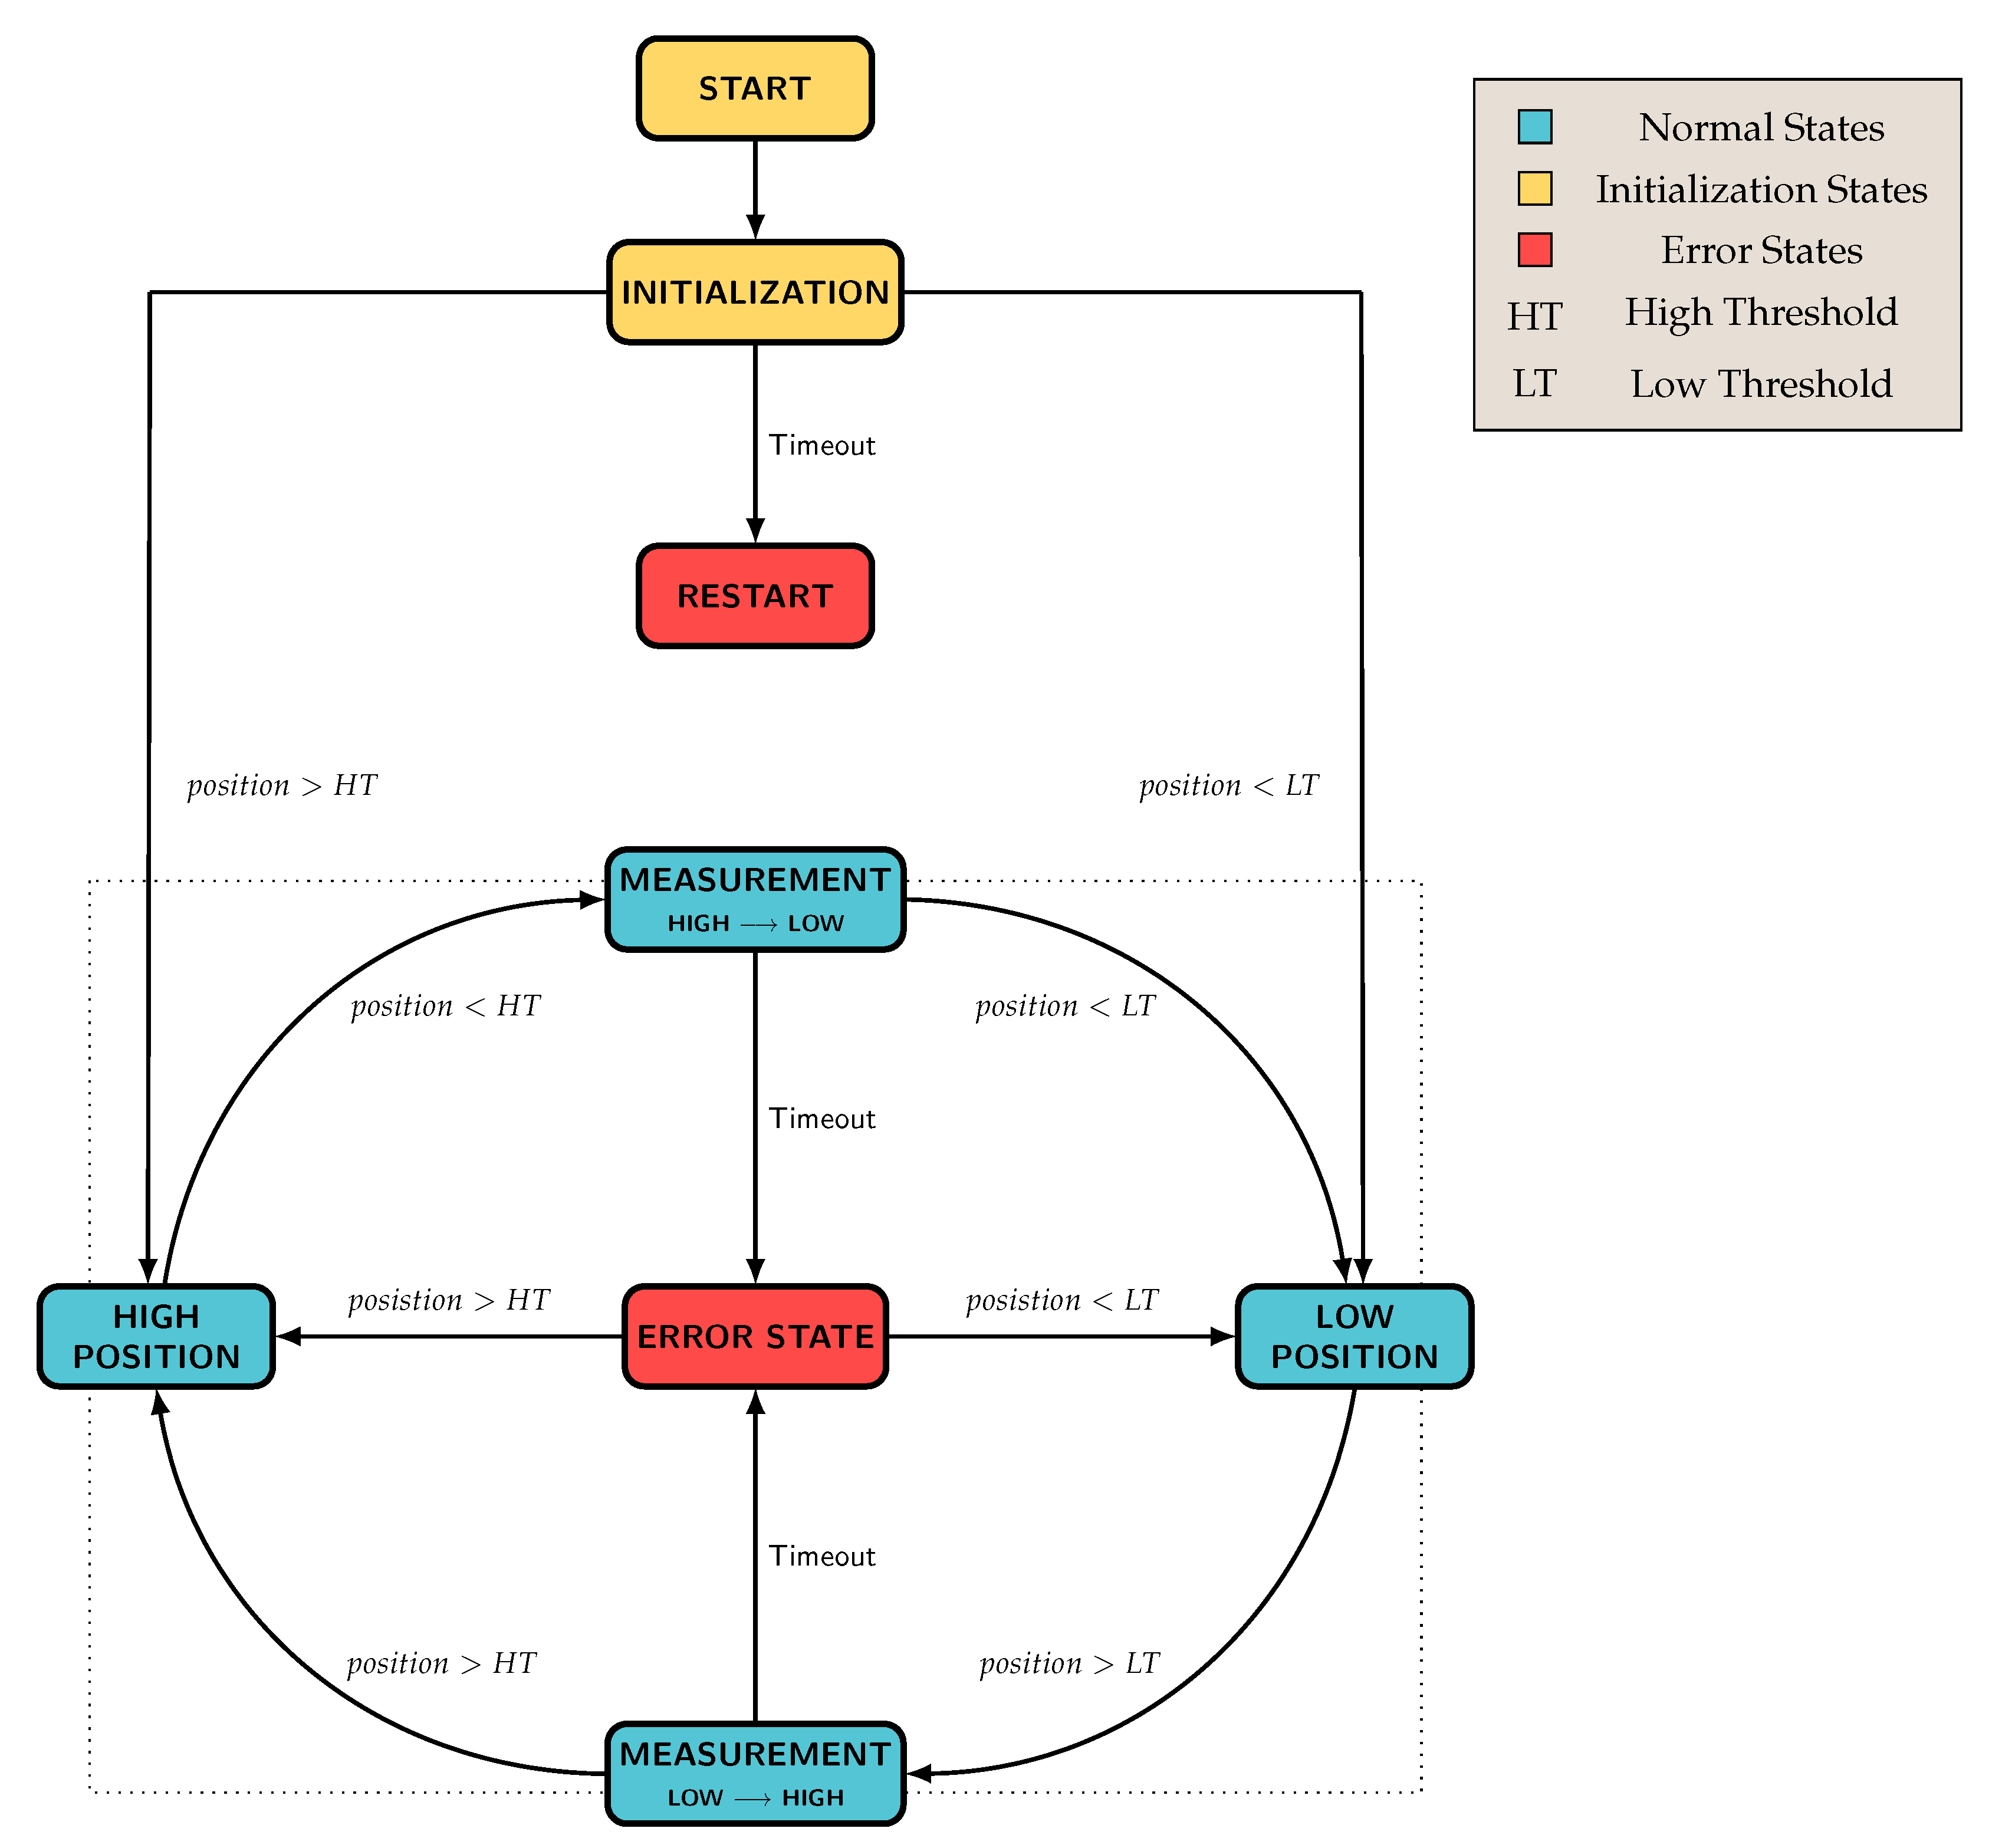
The state-transitions of the measurement are presented by
Figure 10. In the case the measurement takes longer than a predefined (expected) interval, the measurement stops and triggers the device to send a warning message to the central cloud. This function indicates an error, which means that the point blades were not able to reach their end position—so the switching operation failed. There is another, different error state, which relates to the settings of the threshold level. After starting, the device checks the actual position of point blades, and if its value is between the two threshold levels, the device will restart and wait for resetting the threshold values. The reason is that if the actual position is between the thresholds, that means the switching operation failed. Still, it’s unlikely to install—or maintain—the measurement system while the switch is out of order due to a malfunction.
5.2. Platform Level
The gathered information is placed into an interoperable JSON-based message format developed by the MANTIS project [
2], based on the domain ontology introduced by MIMOSA, an open standard for physical asset management [
27]. The messages contain not only the results of measurements, but also additional information: (i) Exact timestamp, (ii) duration of the measurement, (iii) identifier of the edge device instance and (iv) additional values that help the re-assembly of the message on broker side.
The messages are transmitted via MQTT protocol over TCP/IP. The wireless connection between the edge device and the central cloud is provided by a SIM-800 based GPRS modem which is attached to the MCU via serial line. The central cloud contains an MQTT Edge Broker, which handles the messaging, while both the Low-level Device and the cloud implement an MQTT client each.
In the central cloud, the message is received by a Mosquitto MQTT broker [
28] with specialized MANTIS developed parser client. The information is then stored into a MIMOSA OSA-CBM (Open System Architecture for Condition-Based Maintenance) database. MIMOSA is an extended implementation of the ISO-13373 functional specification [
29], adding data structures and defining interface methods for the functional blocks defined within the standard itself.
The parsed datasets will be processed offline by data mining and analysing tools. Future works include that the incoming message can be analysed online, automatically by a stream processor. This will enable an automated alerting and forecasting system to be developed.
The processed and analysed information is stored in the database, thus the central cloud can provide relevant information to different parts of the MANTIS architecture, for example for the Human–Machine Interfaces.
5.3. Data Records in MIMOSA
Since MIMOSA OSA-CBM is created for being a standard architecture and framework, the structure of the database—that stores measurement data provided by the edge device—is flexible only to a certain degree. Each entity (table) of the database is predefined and consists of attributes (columns) that are also predefined and described in MIMOSA Common Relational Information Schema (CRIS).
In relation to the railway switch case, the mentioned two types of measurements (operational and environment) are parsed into different tables. There are different MQTT topics created for the different types of data published by the MQTT broker. The various datasets are stored separately to ease searching and queries. The individual values within datasets (rows)—for instance temperature, humidity, or channels of ADC—have the same type code and these types have a universally unique identifier (see “Type Code” in
Table 1). Furthermore, there are other attributes that provide metadata for individual datasets:
Measurement location identifier as a foreign key reference to the entity, which stores different measurement locations and related metadata;
Date and time of the measurement, stamped by edge device;
Various meta-description in the case of measuring operational factors (e.g., number of samples, the channel number of analogue-to-digital converter, duration of measurement, etc.).
The MIMOSA CRIS comes in handy in all the maintenance-related use cases due to its wide range of entities and attributes. These cover all important parameters that are used to describe different data, although it also leads to bigger message sizes. Since the edge device has limited capabilities regarding messaging, lightweight and standard data representation (JSON) and data publishing (MQTT) have been chosen to support measurement information sharing. In order to reduce the message sending rate, datasets containing related value pairs are used during transmission. Datasets can be interpreted as containers of the two measured factor sets that consist of the following individual parameters:
Since the values in a given dataset are measured at the same time, their metadata are the same as well, therefore the edge device doesn’t have to send multiple messages—only the aggregated one.
Furthermore, since the actual state of the point blades should be able to be requested by the central entities, solicited information sending should be enabled as well. In our system, the parser client running in the cloud has an intermediary role to support this communication. It is able to receive HTTP GET request (e.g., from the operator’s HMI) and convert these requests into MQTT messages and send it to the edge node.
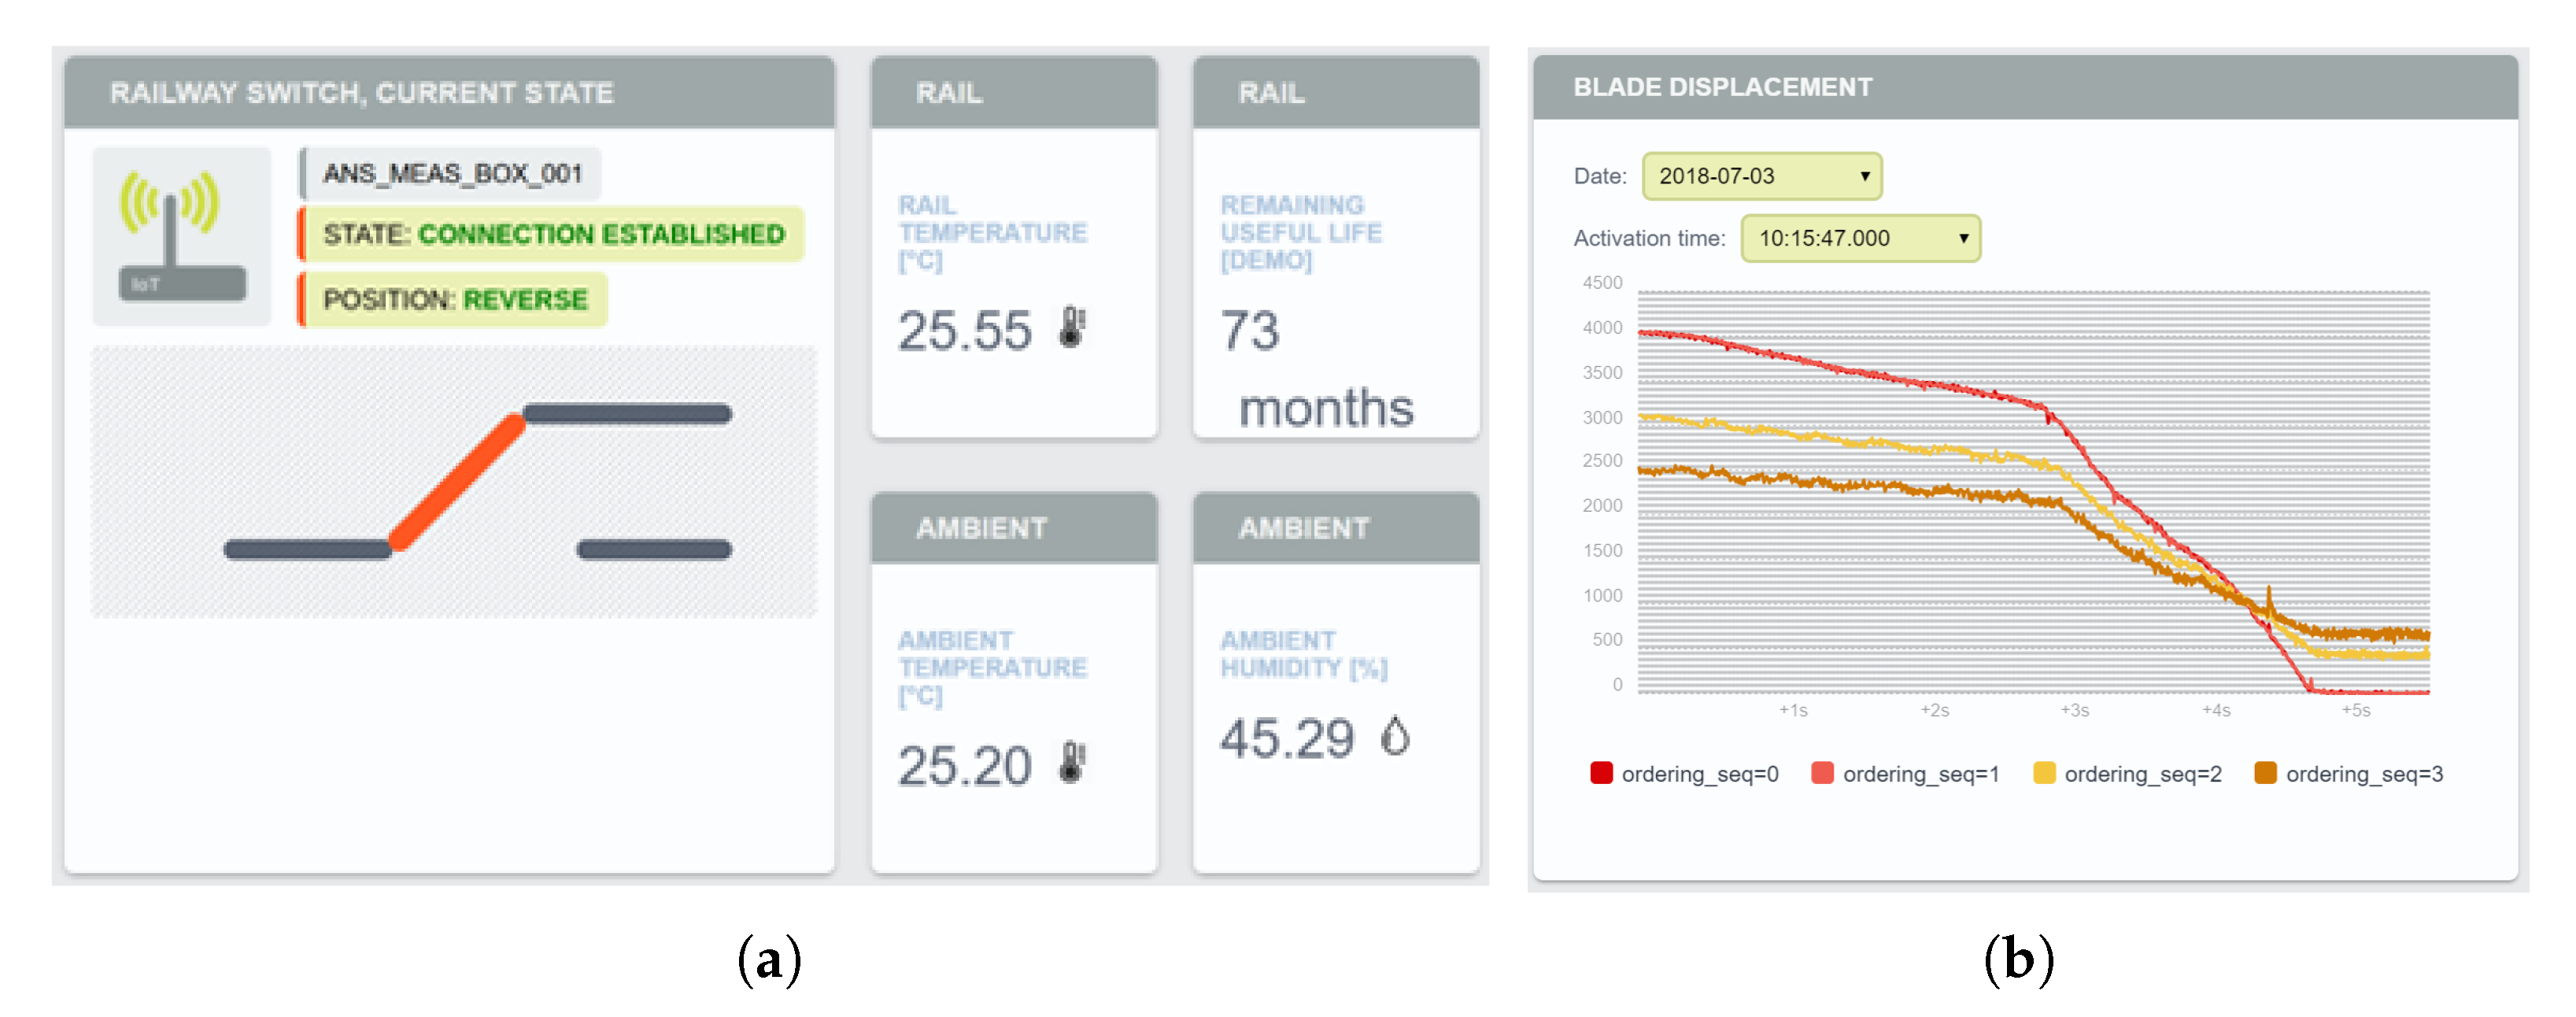
A request contains only the unique identifier of an edge device. Triggered by such a request, the parser client publishes a command message into a topic that the edge device is subscribed to. In case the edge device is not connected to the broker, the parser client responds to the request with an error code. On the other hand, if the edge device is online, the command triggers it to send a short message containing the actual state of the point blades. In this case the parser client responses to the request with a status code of OK (HTTP 200) and parse the message into an appropriate table of the database. Therefore, the result of the command can be read from the database and displayed on the HMI. Sending these requests can be done either by manual request or periodically (automatically), in order to check the actual state of point blades—as well as to make sure the edge device is still operating. Such typical status information is presented by the HMI as shown by
Figure 12a.
6. Data Visualization
Data visualization is an important aspect of the maintenance system. For the successful intervention of the human personnel, information need to be at hand, displayed in a way that minimizes their cognition effort and increases their productivity as much as possible [
30]. This requires the design and implementation of an intelligent and efficient user interface that allows monitoring of the railway switch parameters (see
Figure 12b), displaying the results of the data analysis and assisting the maintenance team in performing the necessary maintenance work (as an example, see
Figure 13).
6.1. The MANTIS Approach
In designing such human–machine interaction, we followed the methodology proposed by the MANTIS project. One of the goals of the project is to extract the main elements of the human–machine interaction for proactive and collaborative maintenance, and to apply them to diverse use-cases such as production assets and special-purpose vehicle maintenance, energy production and healthcare. The approach follows the user-centred scenario-based design paradigm, which primarily focuses on the users and their tasks [
31]. Scenario-based design is an established approach for describing the use of a system at an early point in the development process.
6.1.1. Functional Specifications
Each of the MANTIS industrial partners provided a number of human–machine interaction scenarios describing different users performing their everyday maintenance-related activities. Scenarios are written from the users’ perspective and are focused on the users’ tasks instead of on the system to ensure that the users’ interaction with the machine is pointed towards assisting the human personnel and delivering maximal value to the users. Interaction scenarios have been refined in several iterations to the point where the functional specifications of each HMI could have been identified.
Diverse interaction scenarios, provided by MANTIS use-cases, offer a common ground to identify the functionalities that are essential for proactive and collaborative maintenance. Interaction scenarios refinement phase resulted in the extensive list of HMI functionalities that are most commonly present in the broad range of use-cases, abstracted from the specific situation of every single use-case and that directly support the users in effectively performing proactive and collaborative maintenance tasks. Identified functionalities facilitate the users in performing five main high level tasks [
32]:
Monitoring the production assets allows the maintenance staff and machine operators to observe the past and current status of the asset of interest.
Data analysis-related functionalities are focused on presenting the insights such as predicted future wear-out of the asset or its remaining useful life, generated by the intelligent algorithms, to the maintenance personnel.
Maintenance tasks scheduling is supported by the wide range of functionalities from displaying and rescheduling maintenance tasks, managing spare parts to providing human feedback about the failure to the MANTIS system.
Reporting.
Communication related functionalities allow the users with the same or different roles to collaboratively tackle various maintenance tasks.
6.1.2. Generic HMI Prototype
To facilitate the implementation of the above presented functionalities of proactive and collaborative maintenance based human–machine interaction in MANTIS as well as potential future use-cases, a generic HMI prototype has been designed. The prototype by itself covers a large portion of these features, and lays foundations to implement the rest when applied to a particular use-case.
In particular:
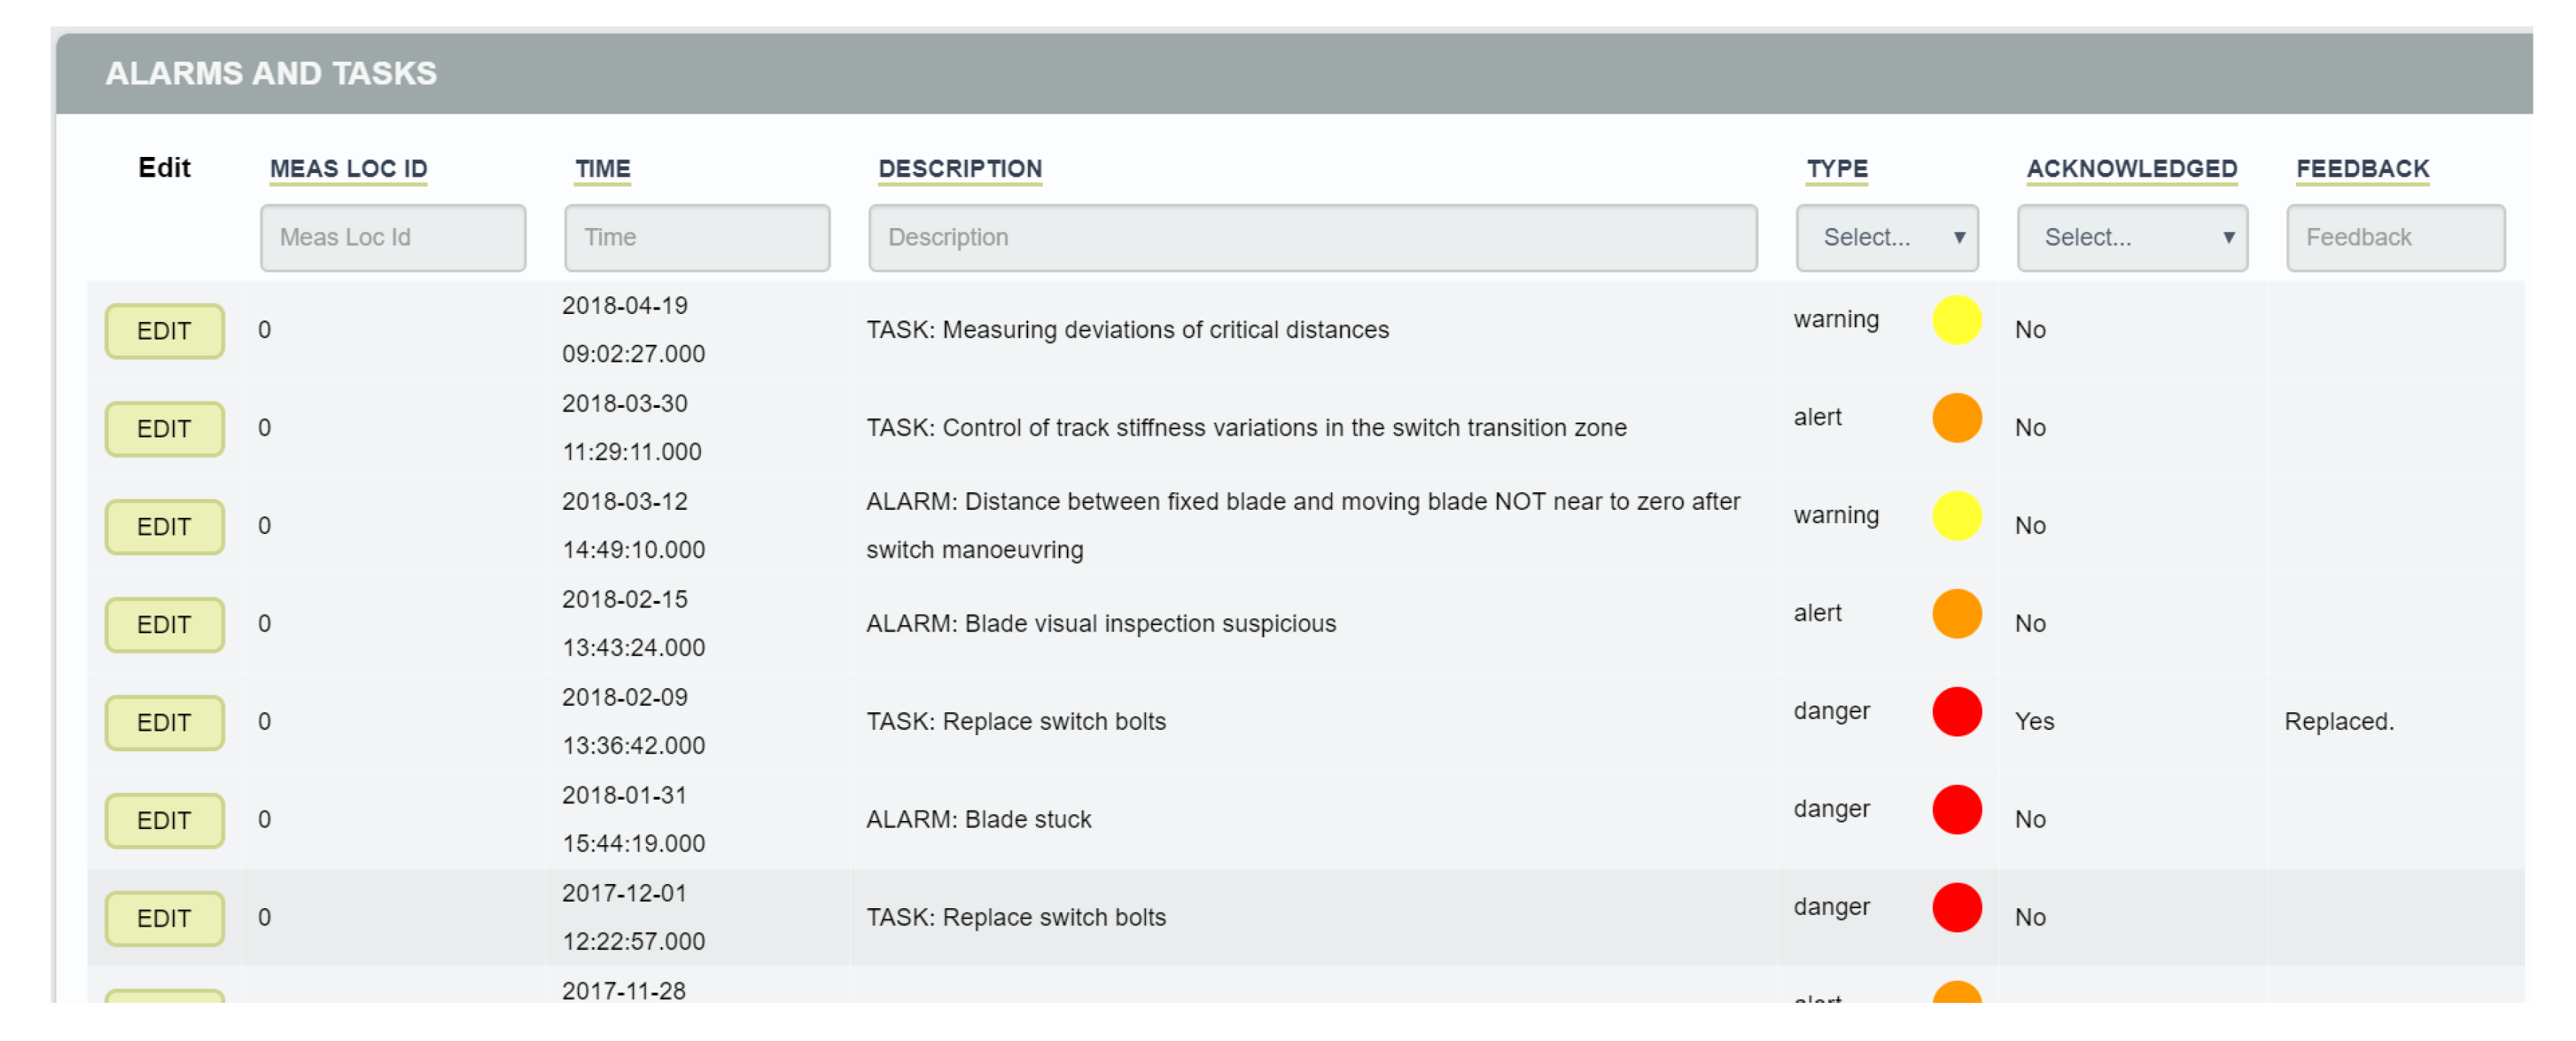
The prototype can display the scheduled tasks and alarms in the same table or separately (see
Figure 13). The table is editable, filterable and sortable, and allows the user to acknowledge the task/alarm as well as to enter textual feedback. Feedback, provided to the system, is especially important for improving the performance of the intelligent algorithms.
Monitoring the production assets is supported by the various widgets such as graphs, tables, or text boxes that display the sensor measurements (see
Figure 12). If alert thresholds for measurements are set, values out of range will also be shown as alarms.
Visualization of the data analysis and prediction results can be done through the same monitoring widgets. Apart from the sensor measurements, they can also show predictions, remaining useful life estimations, and other results of the MANTIS platform processing. For more in-depth analysis, Kibana visualizations are integrated (see example in
Figure 14).
Reports can be generated based on past alarms and events.
Communication and collaboration is supported through the sharing of dashboards and individual widgets among the users as well as the above mentioned textual feedback on alarms and tasks.
The prototype implements the basic aspects of each class of functionalities, leaving the use-case specific details for the stakeholders to implement on top.
6.1.3. Architecture of the HMI
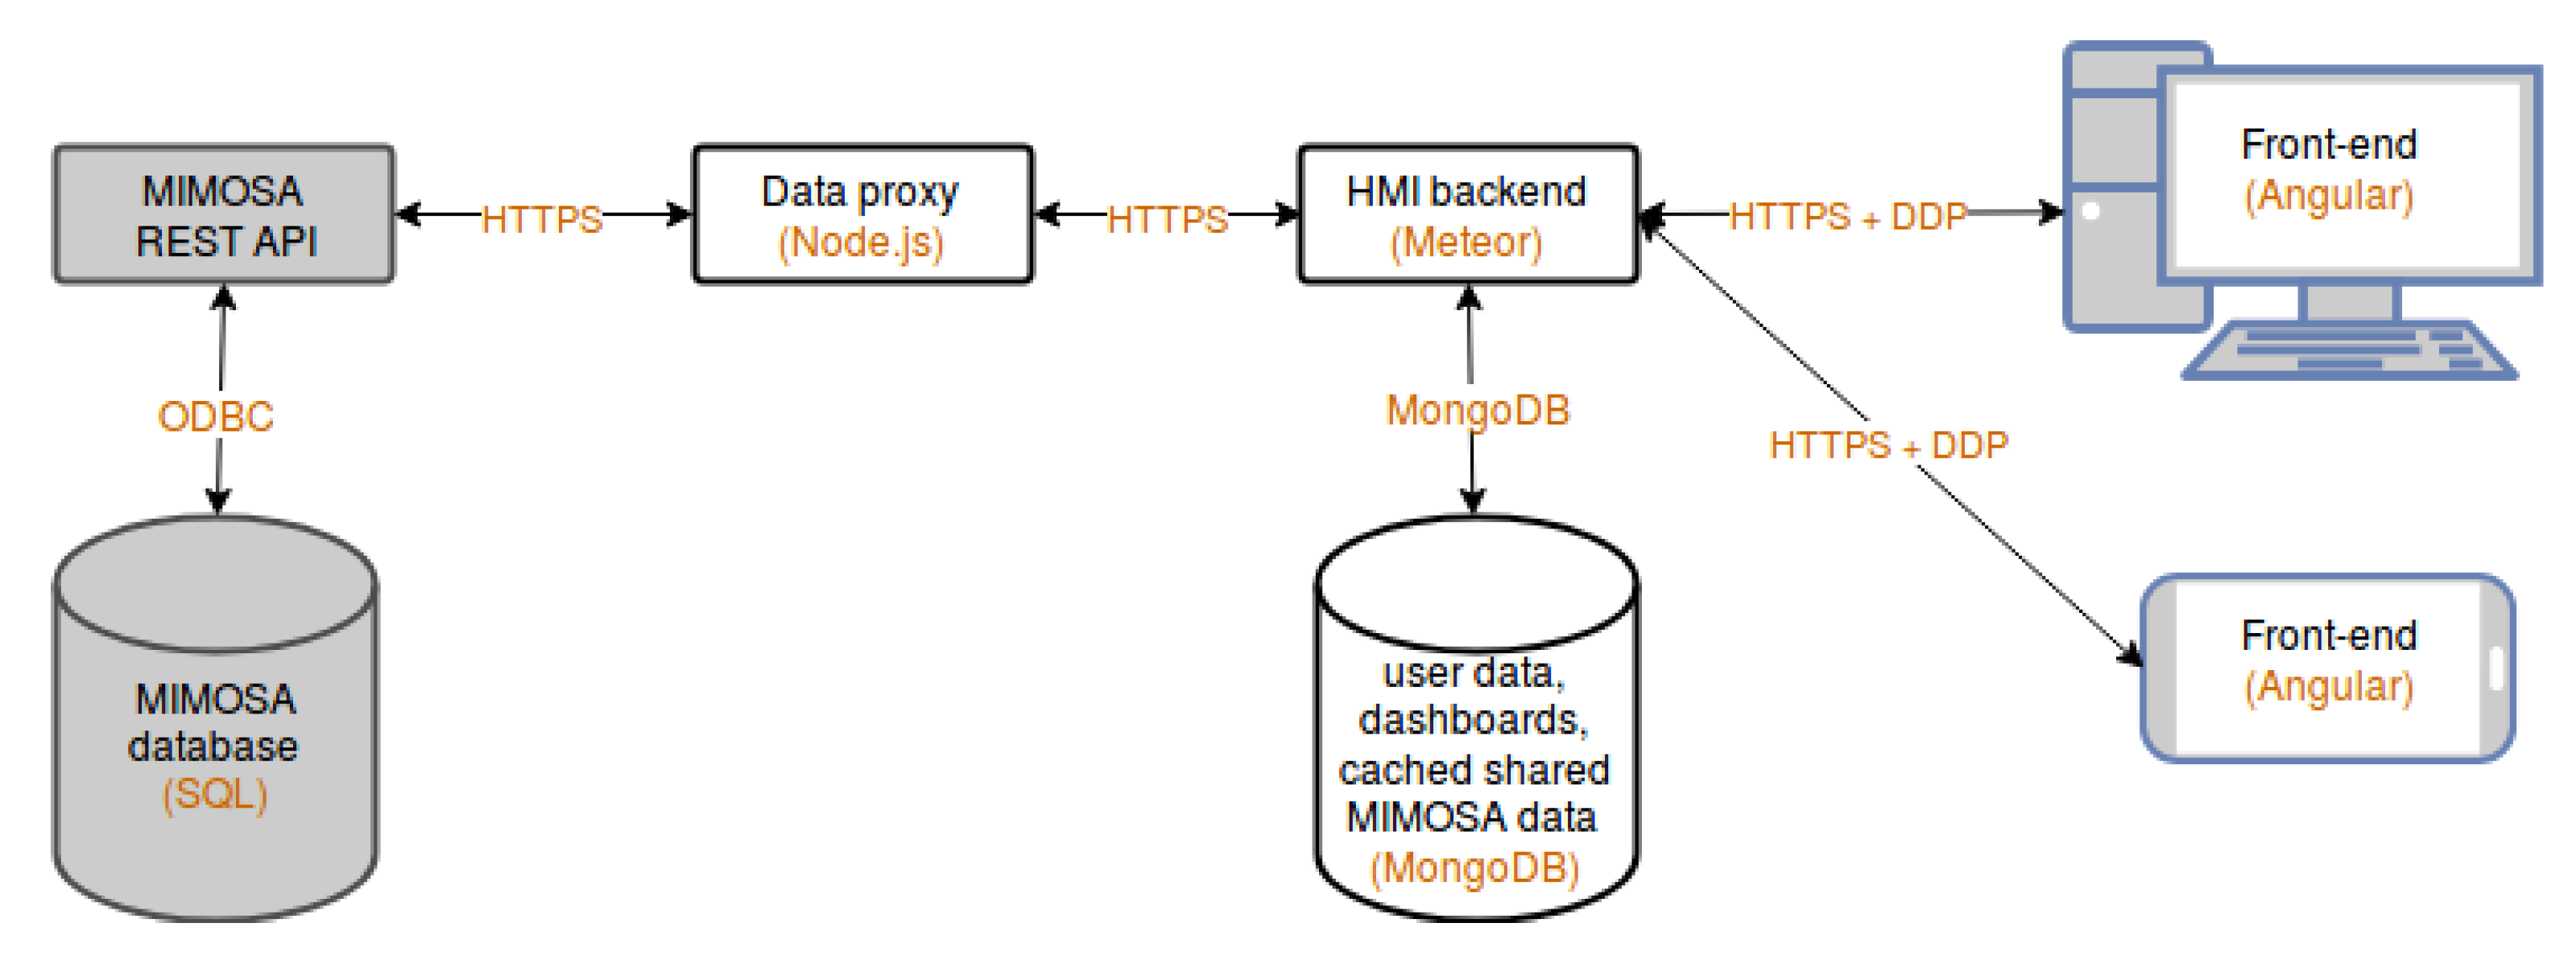
Figure 15 shows the HMI architecture. The MIMOSA database and the REST API for accessing the database are not actually parts of the HMI, but are required for the HMI to operate and are shown to illustrate their relation to the HMI. The REST API allows remote access to a subset of data stored in MIMOSA and enforces access control.
Web-based technology stack, used in the HMI implementation, was chosen to comply to as many technological settings as possible.
The data proxy serves as an abstraction point that presents a unified data access point for the rest of the HMI. It is designed to access the MIMOSA data (via the REST API), but the implementation allows adding support for other permanent data stores. It is also the only place where the credentials for accessing the maintenance data are stored.
The central point of the HMI is implemented as the Meteor [
33]-based HMI backend. It stores and manages the HMI-specific data (e.g., user accounts, settings, and layouts of all their dashboards) and temporarily stores the maintenance data fetched from the data proxy. All that data is stored in the MongoDB [
34] and provided to the HMI clients via subscriptions, which can be thought of as “bridges” between the MongoDB collection in the HMI backend and the client side Minimongo [
35] caches of that collection. Whenever a client requires a certain part of historic data (e.g., to draw a graph), the data is fetched from the data proxy and stored in MongoDB. Subsequent refreshes of the graph or showing the same (or a subset of) data on another client then do not require any more data fetches. The HMI backend also serves the front-end code to the clients on first load.
The front-end is implemented in Angular [
36]. It uses other proven open-source components for certain common widgets, such as Chartist [
37] (charts), Smart Table [
38] (interactive tables), and OpenStreetMap [
39] (maps with asset locations). It is designed to be extensible, such that use-case specific widgets can be implemented on top of it.
6.2. Railway Switch Maintenance HMI
In designing the HMI for the railway switch maintenance, the procedure, described in the above section, has been applied. Initially, user scenarios have been gathered and iteratively refined until they captured enough information to extract the functional specifications of the HMI. Scenarios are describing the everyday activities of five human roles including maintenance technician and business manager. From the description, a set of devices has been identified to be the most suitable for the activities in every scenario. To provide the efficient human–machine interaction for all identified roles, the resulting user interface should be developed for personal computer, tablets, and mobile devices.
Basic requirements, derived from the scenarios, include:
Monitoring the parameters given by the measurement box;
Displaying the alarms that indicate the abnormal movement of the railway switch;
Displaying the task schedule for the maintenance service;
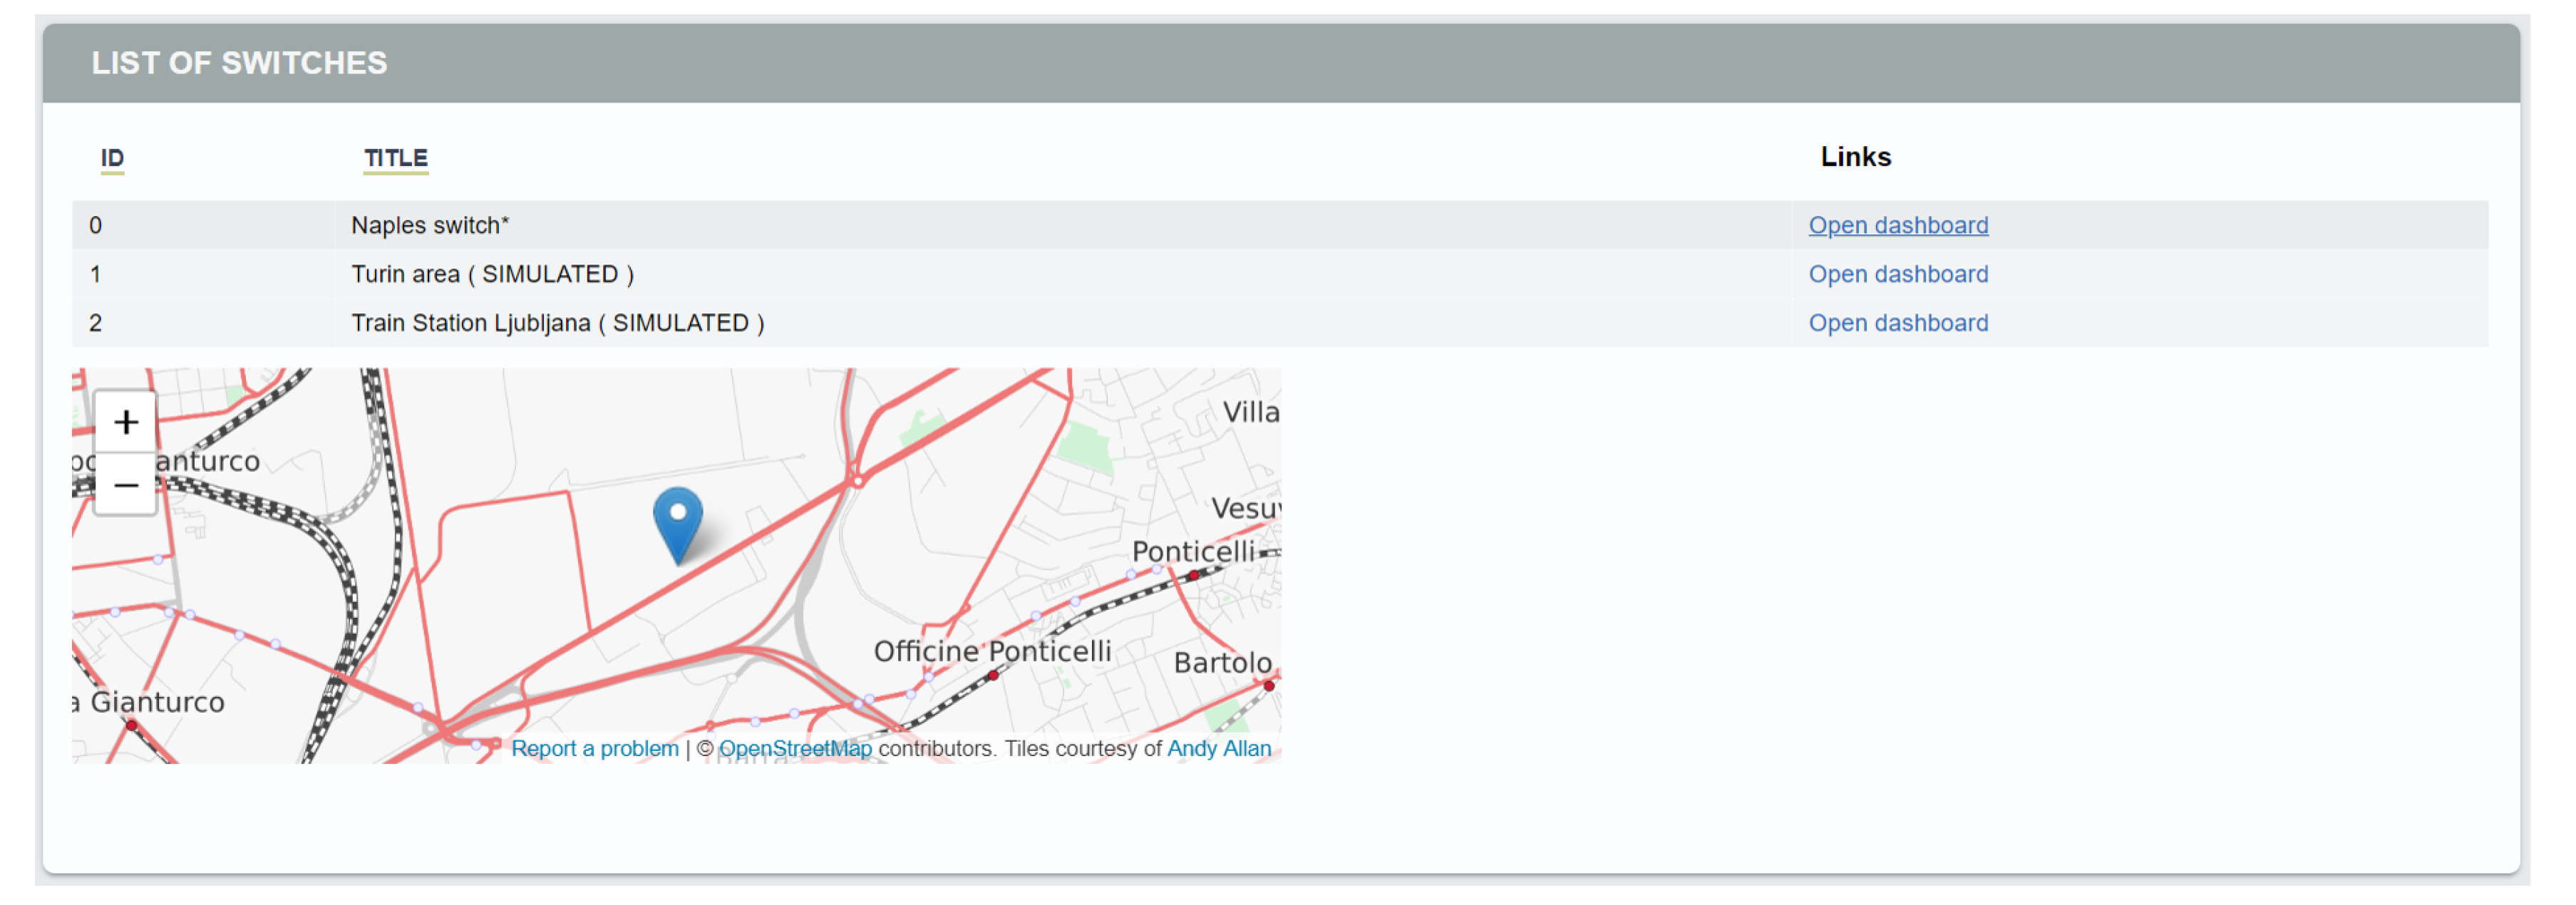
Support for multiple railway switch locations (see
Figure 16).
HMI developed for the railways use case is based on the generic MANTIS HMI prototype. The prototype itself is designed in a way that supports multiple users or roles by implementing a customized dashboard for each user and their intended interaction. Dashboard customization is user friendly and does not require any web development skills. Due to its web-based front-end, the HMI prototype is readily available on each of the identified devices.
Since the main interest of the maintenance personnel lays in railway switches, the first level dashboard allows the users to select the desired railway switch. A map with the location of the railway switch is displayed on a separate widget to assist the maintenance personnel working on the field (see
Figure 16). For the selected switch, a coloured IoT image graphics is displayed to indicate whether or not the connection to the measurement box has been established and the data presented in the HMI is reliable and up to date. A graphics that display the position of a switch together with the colour code of the position label allows the user to quickly notice if a blade has been stuck (see the left side of the
Figure 12).
A second level dashboard also provides an overview of the instant values of the switch-related parameters such as rail temperature and the remaining useful life of the switch, ambient temperature and humidity (see the right side of the
Figure 12a).
The additional functionality of the HMI allows the user to set the alarm threshold for a certain measurement. As a consequence, out of range parameter values will be shown as alarms in the alarm table (see
Figure 13). The railway switch maintenance HMI makes full use of the alarms component of MANTIS HMI described above, including efficient navigation, filtering, sorting, and providing feedback. The overall system health can be monitored by displaying alarm occurrence distribution in the form of a heatmap for every alarm of interest (see
Figure 17).
In addition to the instant parameter values, HMI displays the historic sensor measurement values and historic values of the environmental parameters. These values are displayed as a graph in a separate widget (see
Figure 12b). Through the same monitoring widgets, the results of the data analysis such as wear-out or remaining useful life estimations can be visualized.
6.2.1. Interactive and Customizable Visualizations
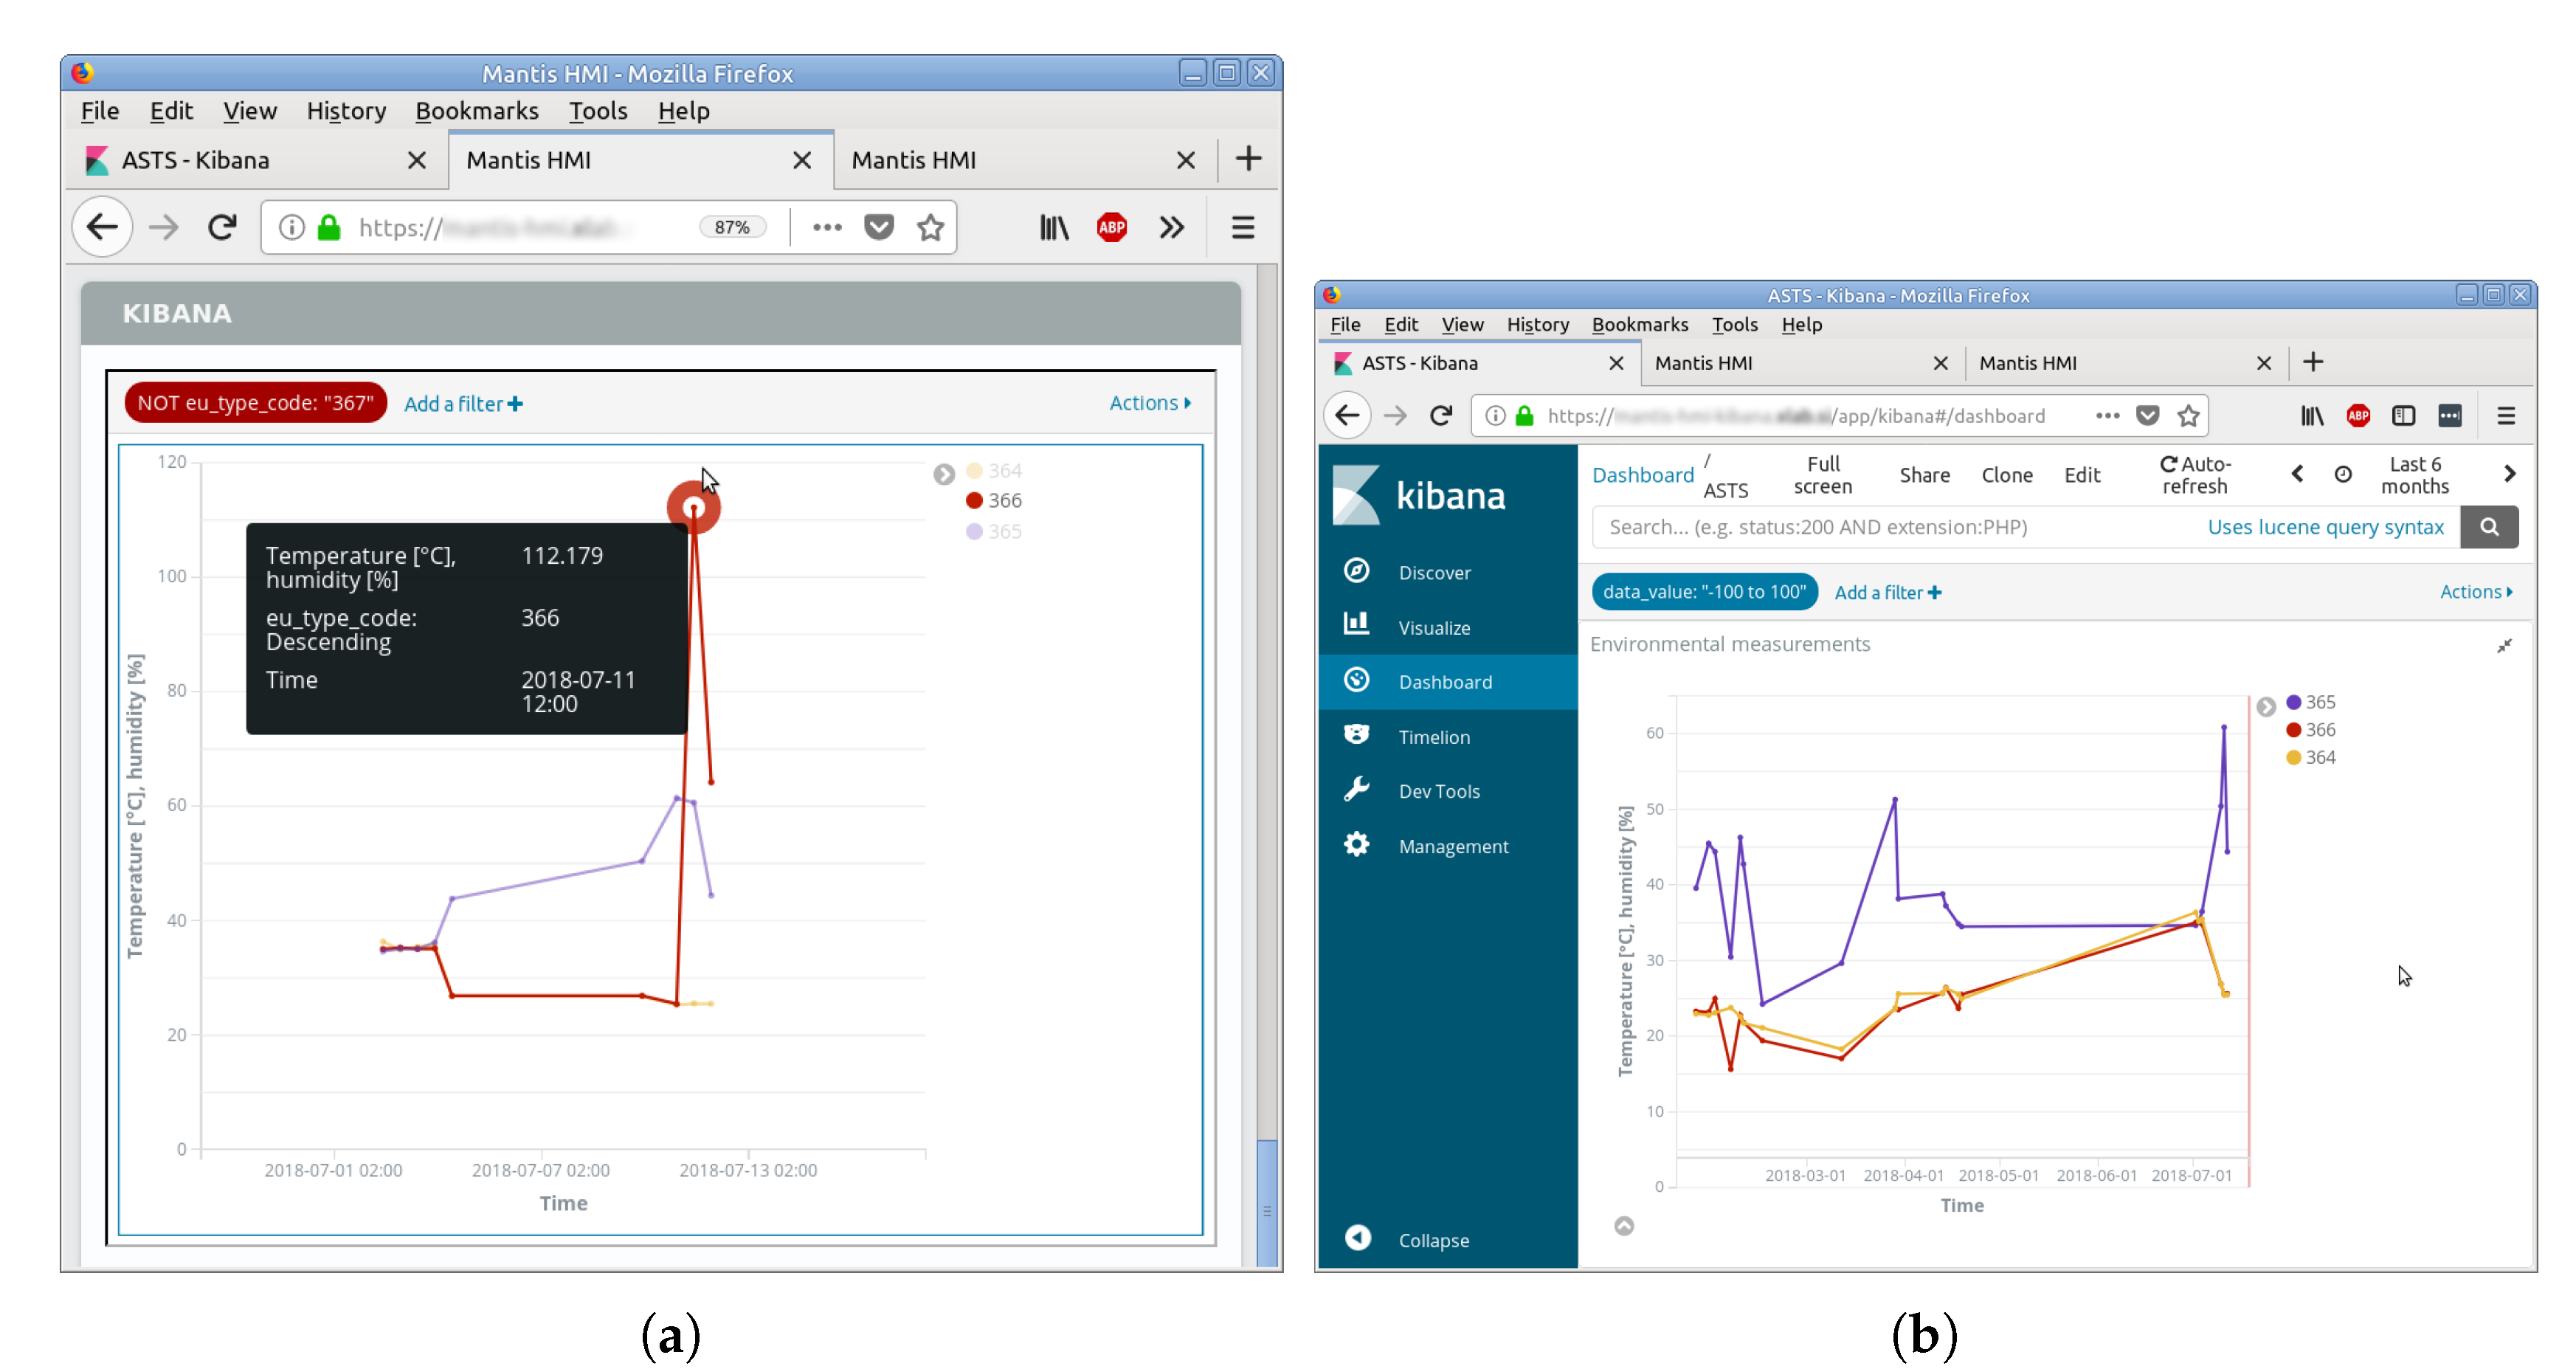
For more in-depth analysis, a powerful open-source search and analysis tool Elasticsearch and its visualization framework Kibana are integrated in the HMI. Elasticsearch requires that all data be imported into its own database, which duplicates the MIMOSA database that is already being used. However, it allows advanced users to go beyond simply viewing pre-defined data presentations. As shown in the
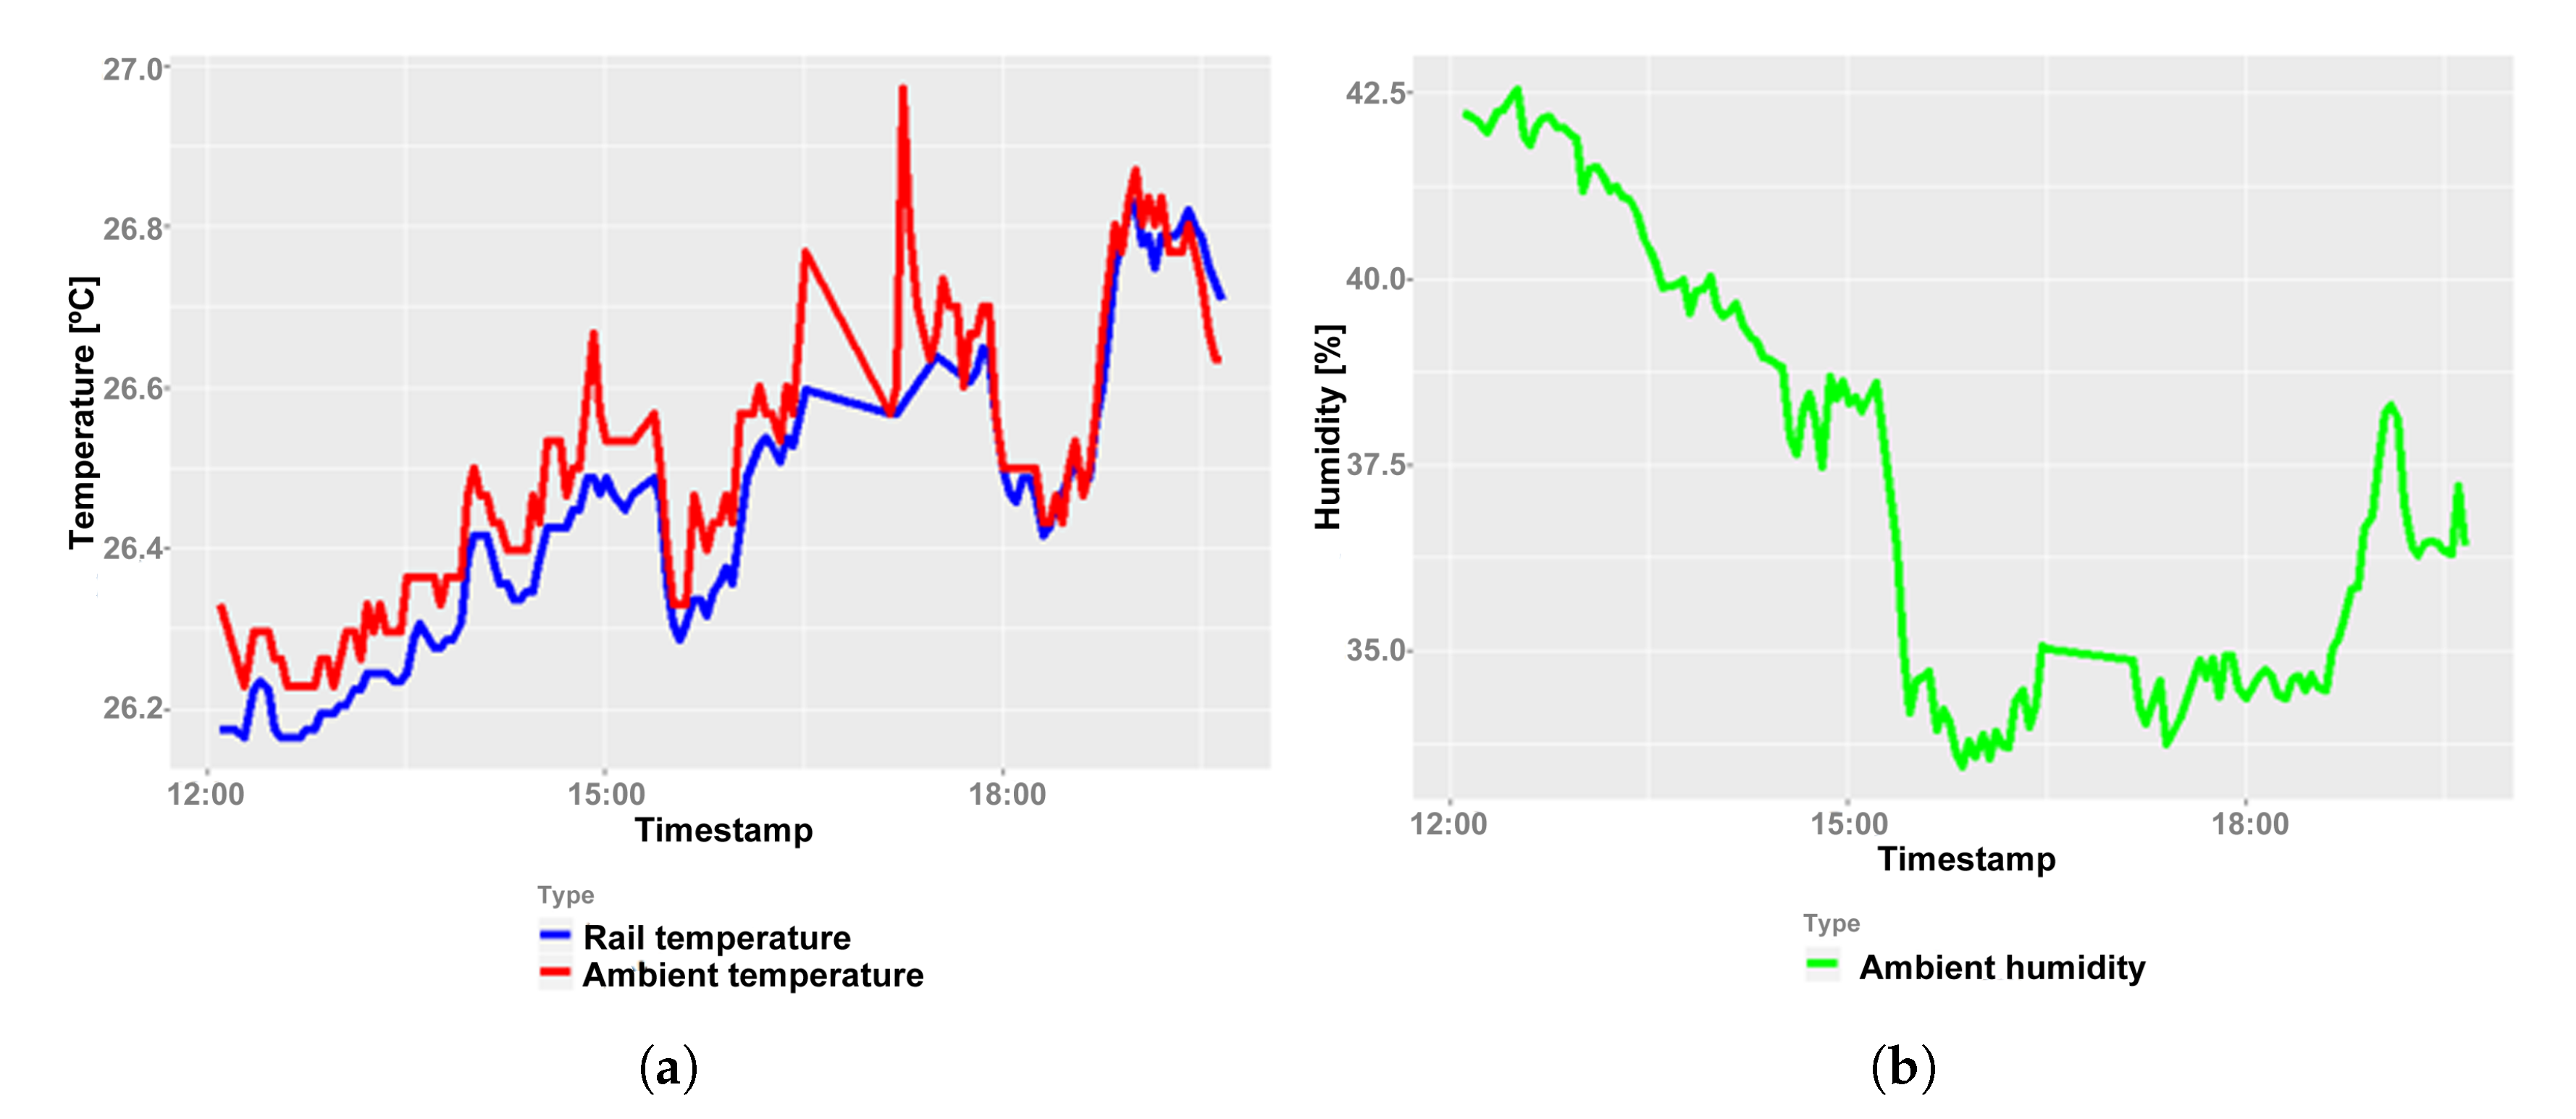
Figure 14a, the graph of environmental parameters (i.e., relative humidity) shows unexpected values.
The search capabilities of Elasticsearch allow the user to filter the data before visualization. The example in
Figure 14b shows a simple filter that hides the obvious outliers where the temperature or humidity is outside of the measurement range, thus only showing the data points that can probably be trusted.
6.2.2. Context-Aware Features
During the scenario refinement phase, a number of advanced context-aware features has been identified to provide the maximum assistance to the maintenance team. Such features proved to be most useful in performing the maintenance actions on the field and are mostly based on the user role and location. Whether the team is at the company’s headquarters, on their way to perform the maintenance action, or on the spot of the maintenance task, different widgets can be displayed to reduce the amount of unnecessary interaction and to provide the most valuable information at any given situation [
40]. Personalised suggestion is another context-aware feature that can improve the efficiency of the maintenance personnel. When the user interacts with the interface, a detailed description of the information can be collected in a form of logs. The interaction data can be analysed in order to predict the next step in user interaction and adapt the dashboard view accordingly.
