Article

A Hybrid System Model-Based Open-Circuit Fault Diagnosis Method of Three-Phase Voltage-Source Inverters for PMSM Drive Systems

School of Automation & Electrical Engineering, University of Science and Technology Beijing, Beijing 100083, China
*
Author to whom correspondence should be addressed.
Electronics 2020, 9(8), 1251; https://doi.org/10.3390/electronics9081251
Submission received: 29 June 2020 / Revised: 28 July 2020 / Accepted: 29 July 2020 / Published: 4 August 2020
(This article belongs to the Section Power Electronics)

Abstract

:
This paper presents an open-circuit (OC) fault diagnosis method of three-phase voltage-source inverters (VSIs) for permanent magnet synchronous motor (PMSM) drive systems based on the hybrid system model (HSM). On the basis of phase voltage analysis, the HSM of the PMSM-inverter system was established, which can describe the system more accurately. To quickly diagnose whether the fault occurs, a current estimator was constructed based on the healthy HSM. Different fault types of the VSI can be simulated synchronously by the HSM, and the similarity between each simulated fault type and the actual one is evaluated based on the Euclidean distance method. Therefore, the fault isolation can be carried out according to the characteristics of Euclidean distances. The proposed method has the advantages of fast diagnosis speed and strong robustness, and it does not require additional sensors. By the presented diagnosis algorithm, the fault can be detected and isolated within a time interval about 5% and 10% of the current fundamental wave period, respectively. The simulation and experimental results verify the effectiveness of the proposed method.

1. Introduction

Voltage-source inverters (VSIs) have been extensively applied in power quality applications and motor drives due to their excellent performance of energy-saving and control. With the widespread application of VSIs, the safety and reliability of the inverter system have attracted more and more attention during the last years [1,2]. In the permanent magnet synchronous motor (PMSM) drive system, the semiconductor devices are considered as the most vulnerable part because they are often exposed to high stress and harsh environmental conditions. Therefore, numerous fault diagnosis methods of power devices have been proposed.
The faults of inverter power devices can be broadly classified as open-circuit (OC) faults and short-circuit (SC) faults. Due to the characteristics of its rapid occurrence and strong destructiveness, hardware protection circuits are generally designed to handle SC faults in the drive systems. The design methods of hardware protection circuits for SC faults are summarized in [3]. Although OC faults are not as dangerous as SC faults, they may cause a secondary failure of the inverter or other drive components if they cannot be detected for an extended period of time, which would result in the total system shutdown and large economic losses [4]. In order to prevent the spread of OC faults, many fault-tolerant control methods have been proposed [5,6,7,8,9], but the premise of implementing these methods is the fast fault diagnosis.
According to whether the OC fault diagnosis methods are based on current or voltage measurement, they can be broadly classified into two categories: current-based and voltage-based methods. The current-based methods do not require additional sensors; they only need to use the current sensors existing in the closed-loop system to measure the currents for fault diagnosis. They have strong applicability and are widely used in practice. Therefore, various current-based diagnostic methods have been proposed, the most important of which are current-signal-based and current-observer-based methods. The current-signal-based methods may generate false alarms under the speed or load transient conditions of the motor drive system, and they take a long time to ensure high diagnostic accuracy. For example, the current vector trajectory analysis method is presented in [10]; the authors analyzed the characteristics of the current vector trajectory under different fault conditions and used the slope of the current vector trajectory to describe fault characteristics. In Mendes and Marques [11], the average current Park’s vector approach was proposed for diagnosing voltage-source inverter faults in variable-speed drive systems. The above two methods are simple in structure and easy to be implemented, but misdiagnosed results may be caused when the load currents are small. In order to get rid of effects of the load, the normalized current method was investigated in [12,13,14]. In Sleszynski et al. [12], the normalized current direct-current (DC) components method was introduced.In Zhang et al. [13], the absolute value of the normalized currents and the current zero-cross detection approach were employed to avoid the influence caused by the transient condition. Bae et al. [14] proposed an online fault identification method based on the average values of the normalized line-to-line currents for insulated gate bipolar transistor (IGBT) OC faults in three-phase pulse-width modulation (PWM) inverters. For current-observer-based methods, the residual signals between the measured outputs of the actual system and the estimated variables of the designed observer are used for fault diagnosis. For instance, in [15], a class of non-linear proportional-integral observers was presented to identify the DC components of the fault profiles; then a directional residual evaluation was suggested for fault isolation.In Espinoza et al. [2], a qualitative method based on a phasor representation of the residual vector was suggested for fault isolation in field-oriented control induction motor drives.In An et al. [16], the current residual vector method was introduced to diagnose the fault according to the residuals between the estimated currents and the measured currents. The main drawback of current-observer-based methods is that the diagnosis performance depends on the accuracy of observer model parameters. However, due to its fast, real-time detection capability and the advantage of being easily embedded in existing control algorithms, it is still widely studied and applied. In recent years, some new current-based methods have been proposed. The zero voltage vector sampling method was proposed in [17], which used a single dc-link current sensor to sample current during the two zero voltage vectors and reconstruct the three-phase currents, and then used the reconstructed three-phase currents to detect and locate the faulty power switch.In Wu and Zhao [18], the allelic points and corresponding functions were proposed to describe the symmetry of the three-phase VSI topology under healthy and different OC fault conditions for fault detection and isolation. The diagnosis times of the above current-based methods are not less than a quarter of the current fundamental wave period, and some methods even exceed one current fundamental wave period.
As for voltage-based techniques, the diagnosis speed is generally faster than that of the current-based methods, but they often require additional voltage sensors or hardware in practical applications. A voltage model analysis method was proposed in [19], which can detect and locate the faulty switch quickly by comparing the voltages measurements to their respective references. The fault diagnosis time of this method is within one-fourth of the current fundamental period, but additional voltage sensors are required to measure the inverter pole voltages, machine phase voltages, system line voltages or machine neutral point voltages.In Karimi et al. [20], a fast fault detection method based on the field-programmable gate array (FPGA) was introduced. The method can detect a faulty switch or driver in less than 10 μs, but it has complex hardware and high cost.In Choi and Lee [21], a voltage measurement-based sectoral diagnosis method was described for OC faults of inverter-fed PMSM drives. The proposed method used a separate residual for each switch as a sectoral average to improve the robustness of the fault diagnosis algorithm. In order to simplify the fault diagnosis circuit and avoid additional sensors, an indirect voltage measurement method using high-speed photocouplers was presented in [22].In Jung et al. [23], the fault diagnosis was achieved by a model reference adaptive system-based voltage distortion observer. The diagnosis speeds of the above three voltage-based methods are high and the fault diagnosis can be completed within 1 ms.
Some data-driven methods are also applied to OC fault diagnosis of inverters, such as neural networks [24,25,26], Bayesian networks [27], fuzzy logic [28,29], wavelet analysis [30], support vector machines [31] and machine learning [32]. However, these methods are difficult to be implemented due to the complex algorithms and large amounts of calculations, plus the diagnosis time is generally longer than one current fundamental wave period.
In this paper, a fast online fault diagnosis method is proposed for OC faults of three-phase voltage-source inverters in PMSM drive systems. The hybrid system model (HSM) of the PMSM-inverter system is established by analyzing the three-phase voltages under healthy conditions and different fault conditions. In order to reduce the amount of calculating during normal operations, a state estimator is constructed by using the healthy HSM to determine whether the fault occurs. In the process of fault isolation, the HSM is used to generate fault data of different fault types online, and then the fault type which is most similar to the actual one is found based on the Euclidean distance method, so as to achieve fault diagnosis. The proposed method has the features of avoiding the use of extra sensors, robustness against false alarms and fast diagnosis time, and can complete fault diagnosis within one-tenth of the current fundamental wave period. The rest of the paper is organized as follows: firstly, the HSM of the PMSM-inverter system is established in Section 2; secondly, the proposal for fault detection and isolation is detailed in Section 3; thirdly, Section 4 and Section 5 describe the simulation and experimental results; and finally, Section 6 presents the conclusion.

2. HSM of PMSM-Inverter System

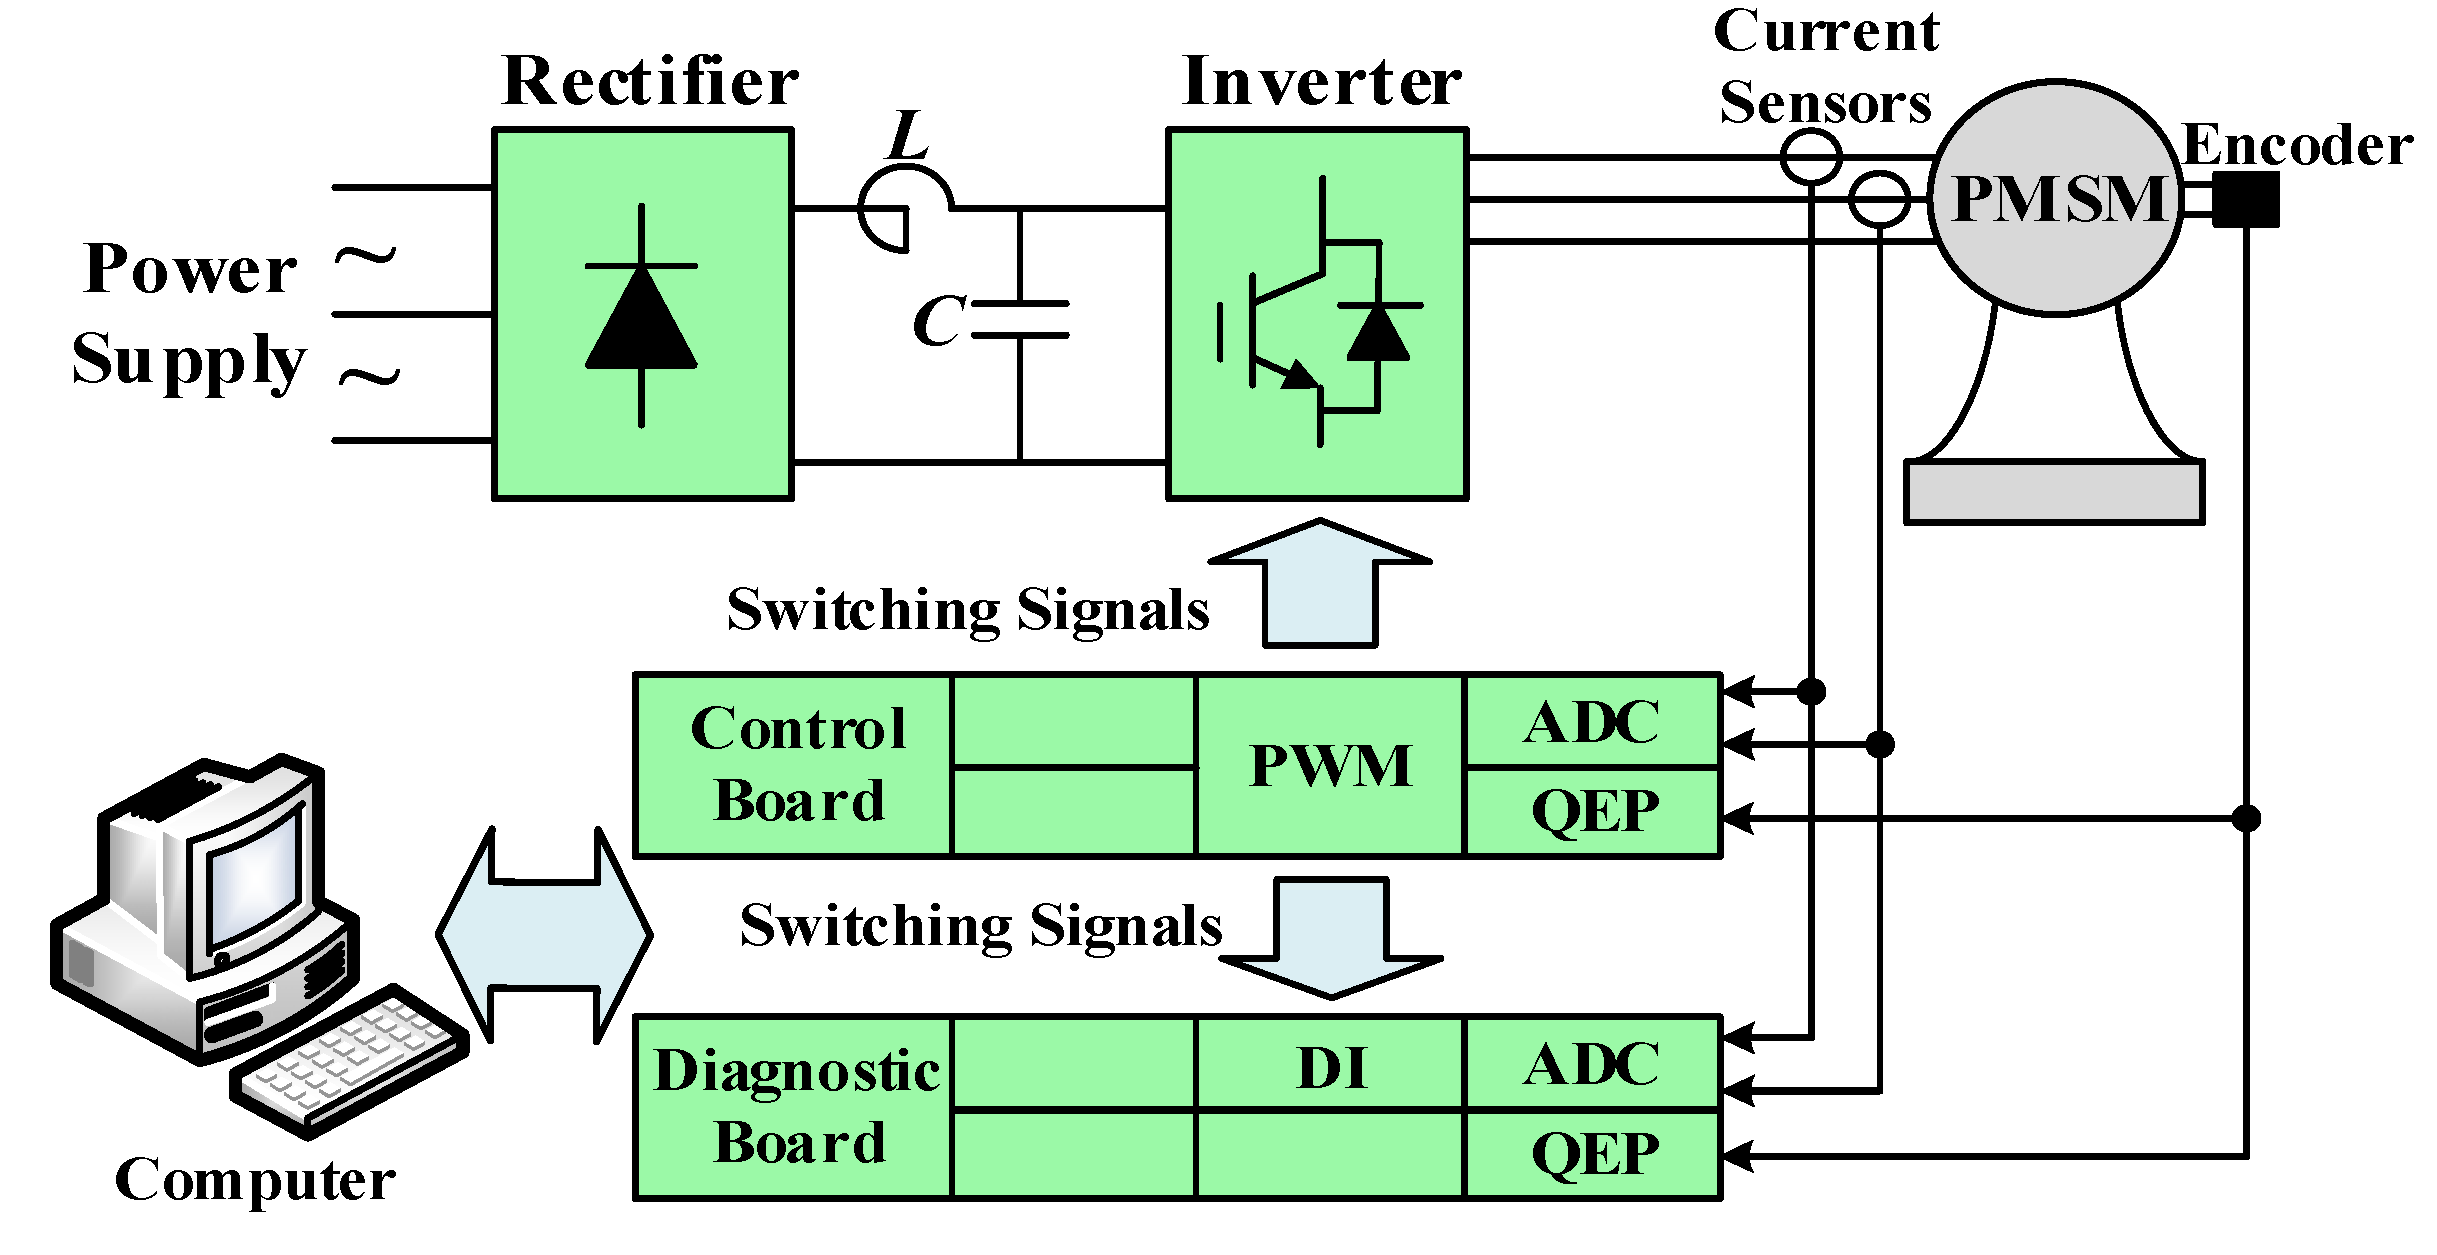
The PMSM-inverter system shown in Figure 1 is adopted in this paper. In this system, the controller calculates the switching signals according to the expected voltages, and the inverter can output the corresponding voltage pulses based on the switching signals; then these voltage pulses are applied to the motor windings to generate continuous state currents. Therefore, the PMSM-inverter system constitutes a typical hybrid system. The system state can be analyzed more accurately by establishing the hybrid system model of the PMSM-inverter system.

2.1. Phase Voltage Function Under Healthy Conditions

In the PMSM-inverter system, the current evolution paths are different under different switching states, which makes the output voltages of the inverter also different. In order to study the output voltages under different switching states, the switching function S x ( x = 1 6 ) is defined to represent the states of T1–T6 as follows:
S x = { 1 , ON 0 , OFF
According to the topology of the PMSM-inverter system, the relationship between switching states and winding-to-ground voltages under the healthy condition can be obtained, as shown in Table 1. u a g _ N F , u b g _ N F , u c g _ N F are the winding-to-ground voltages under the healthy conditions, and V dc is the dc-bus voltage.
According to the Kirchhoff’s law, it can be obtained that:
{ u a n = u a g u n g u b n = u b g u n g u c n = u c g u n g
where u a n , u b n and u c n are the phase voltages; u n g is the voltage between the neutral point n and the ground g.
For the star-connected winding, the following equation can be given:
u a n + u b n + u c n = 0
Combining Equation (2) and Equation (3), it can be obtained that:
u n g = 1 3 ( u a n + u b n + u c n )
By substituting Equation (4) into Equation (2), the phase voltages can be calculated by the following equation:
[ u a n u b n u c n ] = 1 3 [ 2 1 1 1 2 1 1 1 2 ] [ u a g u b g u c g ]
According to Equation (5), the relationship between switching states and phase voltages under healthy conditions can be derived as shown in Table 2. Therefore, the phase voltage function under the healthy conditions can be expressed as follows:
{ u a n _ N F = 1 3 [ S 1 ( S 4 + S 6 ) S 2 ( S 3 + S 5 ) ] V dc u b n _ N F = 1 3 [ S 3 ( S 2 + S 6 ) S 4 ( S 1 + S 5 ) ] V dc u c n _ N F = 1 3 [ S 5 ( S 2 + S 4 ) S 6 ( S 1 + S 3 ) ] V dc
In order to simplify the model, the logical variable vector under the healthy condition is defined as λ N F = [ λ 1 _ N F λ 2 _ N F λ 3 _ N F ] T . According to Equation (6), the following results are obtained:
{ λ 1 _ N F = S 1 ( S 4 + S 6 ) S 2 ( S 3 + S 5 ) λ 2 _ N F = S 3 ( S 2 + S 6 ) S 4 ( S 1 + S 5 ) λ 3 _ N F = S 5 ( S 2 + S 4 ) S 6 ( S 1 + S 3 )
Substituting Equation (7) into Equation (6), one can achieve
u N F = [ u a n _ N F u b n _ N F u c n _ N F ] T = 1 3 λ N F V dc

2.2. Phase Voltage Function under Different OC Fault Conditions

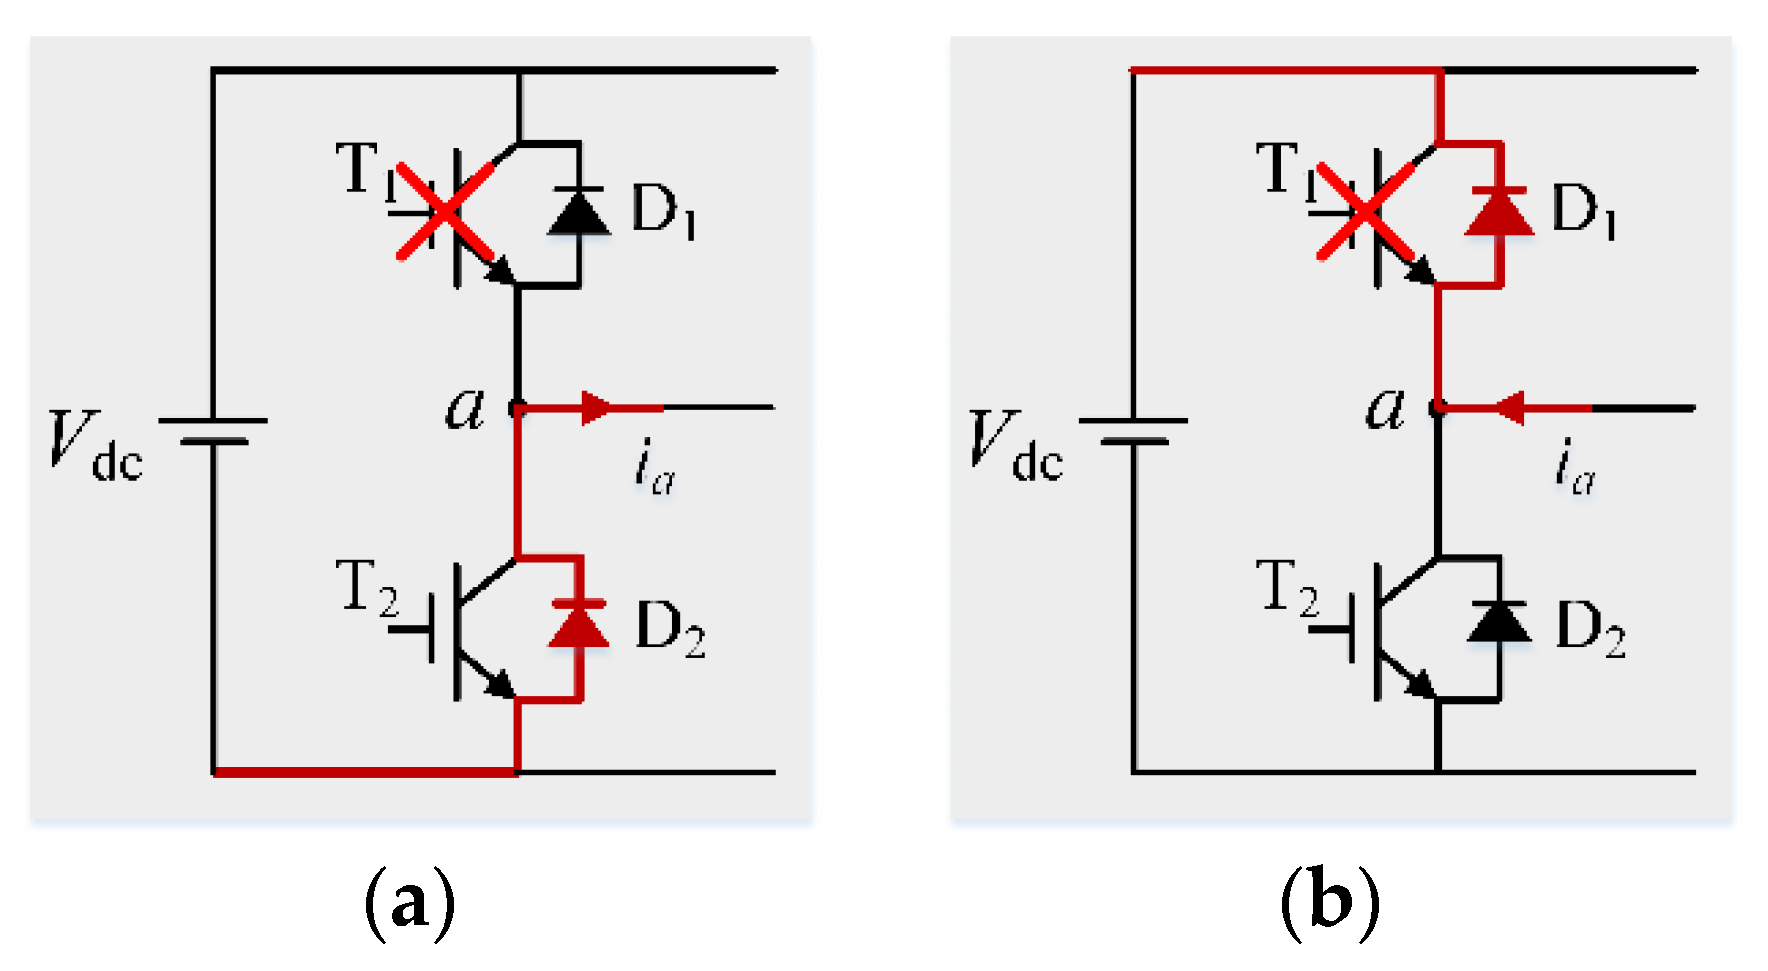
In the PMSM-inverter system, the output voltages of the inverter are not only controlled by the switching signals, but also associated with the current directions. It is defined that the currents flowing into the winding are positive. According to the switching states and the directions of phase currents, the phase voltages of the inverter can be obtained. As an example, assuming an OC fault occurs in T1, the affected switching states are “4”, “5”, “6” and “7”. The current paths of A-phase under T1 OC fault are shown in Figure 2a when i a > 0 and Figure 2b when i a 0 .
If T1 OC fault acts on the inverter circuits, then S 1 = S 2 = 0 . When under the switching state “4”, if i a > 0 , A-phase current flows into the winding through D2. Therefore, the equivalent switching states are S 1 = 0 , S 2 = 1 , so that u a g _ T 1 F = u b g _ T 1 F = u c g _ T 1 F = 0 , and then u a n _ T 1 F = u b n _ T 1 F = u c n _ T 1 F = 0 . If i a 0 , A-phase current flows into the positive pole of the power supply through D1. Therefore, the equivalent switching states are S 1 = 1 and S 2 = 0 , so that u a g _ T 1 F = V dc , u b g _ T 1 F = u c g _ T 1 F = 0 , and then u a n _ T 1 F = 2 / 3 V dc and u b n _ T 1 F = u c n _ T 1 F = 1 / 3 V dc . Similarly, the relationship between A-phase current direction and phase voltages in the case of a T1 OC fault acting on the inverter circuits under switching states “5,” “6” and “7” is obtained as shown in Table 3. Define logical variable η a = 1 to represent i a > 0 , and η a = 0 to represent i a 0 .
The phase voltage function in the case of a T1 OC fault acting on the inverter circuits can be obtained from Table 3 as follows:
{ u a n _ T 1 F = 1 3 S ¯ 1 S ¯ 2 [ ( S 4 + S 6 ) η ¯ a ( S 3 + S 5 ) η a ] V dc u b n _ T 1 F = 1 3 S ¯ 1 S ¯ 2 [ S 3 ( S 6 + η a ) S 4 ( S 5 + η ¯ a ) ] V dc u c n _ T 1 F = 1 3 S ¯ 1 S ¯ 2 [ S 5 ( S 4 + η a ) S 6 ( S 3 + η ¯ a ) ] V dc
where u a n _ T 1 F , u b n _ T 1 F and u c n _ T 1 F are the phase voltages in the case of a T1 OC fault acting on the inverter circuits.
In the case of a T2 OC fault acting on the inverter circuits, the affected switching states are “0”, “1”, “2” and “3”. Similarly, the relationship between A-phase current direction and phase voltages in the case of a T2 OC fault acting on the inverter circuits is obtained as shown in Table 4.
It can be seen from Table 4 that the phase voltages in the case of a T2 OC fault acting on the inverter circuits are the same as those for a T1 OC fault acting on the inverter circuits. Therefore, in both cases, the phase voltage function of the inverter is the same, so that the phase voltage function in the case of an A-phase OC fault acting on the inverter circuits is as follows:
{ u a n _ A F = 1 3 S ¯ 1 S ¯ 2 [ ( S 4 + S 6 ) η ¯ a ( S 3 + S 5 ) η a ] V dc u b n _ A F = 1 3 S ¯ 1 S ¯ 2 [ S 3 ( S 6 + η a ) S 4 ( S 5 + η ¯ a ) ] V dc u c n _ A F = 1 3 S ¯ 1 S ¯ 2 [ S 5 ( S 4 + η a ) S 6 ( S 3 + η ¯ a ) ] V dc
where u a n _ A F , u b n _ A F and u c n _ A F are the phase voltages in the case of an A-phase OC fault acting on the inverter circuits.
Define λ A F = [ λ 1 _ A F λ 2 _ A F λ 3 _ A F ] T , and
{ λ 1 _ A F = S ¯ 1 S ¯ 2 [ ( S 4 + S 6 ) η ¯ a ( S 3 + S 5 ) η a ] λ 2 _ A F = S ¯ 1 S ¯ 2 [ S 3 ( S 6 + η a ) S 4 ( S 5 + η ¯ a ) ] λ 3 _ A F = S ¯ 1 S ¯ 2 [ S 5 ( S 4 + η a ) S 6 ( S 3 + η ¯ a ) ]
Substituting Equation (11) into Equation (10), one can achieve
u A F = [ u a n _ A F u b n _ A F u c n _ A F ] T = 1 3 λ A F V dc
Similarly, the phase voltage functions in the case of B-phase and C-phase OC faults acting on the inverter circuits can be obtained. Define logical variable η b = 1 to represent i b > 0 , η b = 0 to represent i b 0 , η c = 1 to represent i c > 0 and η c = 0 to represent i c 0 . Then the phase voltages in the case of B-phase and C-phase OC faults acting on the inverter circuits are as follows:
{ u a n _ B F = 1 3 S ¯ 3 S ¯ 4 [ S 1 ( S 6 + η b ) S 2 ( S 5 + η ¯ b ) ] V dc u b n _ B F = 1 3 S ¯ 3 S ¯ 4 [ ( S 2 + S 6 ) η ¯ b ( S 1 + S 5 ) η b ] V dc u c n _ B F = 1 3 S ¯ 3 S ¯ 4 [ S 5 ( S 2 + η b ) S 6 ( S 1 + η ¯ b ) ] V dc
{ u a n _ C F = 1 3 S ¯ 5 S ¯ 6 [ S 1 ( S 4 + η c ) S 2 ( S 3 + η ¯ c ) ] V dc u b n _ C F = 1 3 S ¯ 5 S ¯ 6 [ S 3 ( S 2 + η c ) S 4 ( S 1 + η ¯ c ) ] V dc u c n _ C F = 1 3 S ¯ 5 S ¯ 6 [ ( S 2 + S 4 ) η ¯ c ( S 1 + S 3 ) η c ] V dc
where u a n _ B F , u b n _ B F and u c n _ B F are the phase voltages in the case of B-phase OC fault acting on the inverter circuits; u a n _ C F , u b n _ C F and u c n _ C F are the phase voltages in the case of C-phase OC fault acting on the inverter circuits.
Define λ B F = [ λ 1 _ B F λ 2 _ B F λ 3 _ B F ] T , λ C F = [ λ 1 _ C F λ 2 _ C F λ 3 _ C F ] T , and
{ λ 1 _ B F = S ¯ 3 S ¯ 4 [ S 1 ( S 6 + η b ) S 2 ( S 5 + η ¯ b ) ] λ 2 _ B F = S ¯ 3 S ¯ 4 [ ( S 2 + S 6 ) η ¯ b ( S 1 + S 5 ) η b ] λ 3 _ B F = S ¯ 3 S ¯ 4 [ S 5 ( S 2 + η b ) S 6 ( S 1 + η ¯ b ) ]
{ λ 1 _ C F = S ¯ 5 S ¯ 6 [ S 1 ( S 4 + η c ) S 2 ( S 3 + η ¯ c ) ] λ 2 _ C F = S ¯ 5 S ¯ 6 [ S 3 ( S 2 + η c ) S 4 ( S 1 + η ¯ c ) ] λ 3 _ C F = S ¯ 5 S ¯ 6 [ ( S 2 + S 4 ) η ¯ c ( S 1 + S 3 ) η c ]
Thus, we can get
u B F = [ u a n _ B F   u b n _ B F   u c n _ B F ] T = 1 3 λ B F V dc
u C F = [ u a n _ C F   u b n _ C F   u c n _ C F ] T = 1 3 λ C F V dc

2.3. HSM of PMSM-Inverter System

Considering the PMSM-inverter system shown in Figure 1, the voltage equation can be expressed as follows:
{ u a n = R s i a + L σ d i a d t + e a u b n = R s i b + L σ d i b d t + e b u c n = R s i c + L σ d i c d t + e c
where i a , i b and i c are the phase currents; e a , e b and e c are the back electromotive forces; R s is the stator winding resistance; and L σ is the stator winding inductance.
For the PMSM system, the three-phase back electromotive forces of the motor can be expressed as
[ e a e b e c ] = ω e ψ f [ s i n θ s i n ( θ 2 π / 3 ) s i n ( θ + 2 π / 3 ) ]
where ω e is the electric angular speed of the rotor, θ is rotor’s the electrical angle and ψ f is the rotor’s permanent magnet flux, which can be obtained through the indirect measurement.
According to the phase voltage functions under healthy conditions and different OC fault conditions, the phase voltage function of the PMSM-inverter system is obtained as follows:
u = [ u a n   u b n   u c n ] T = ( u N F , u A F , u B F , u C F ) = 1 3 λ V dc
where means to calculate the sum of all elements, and λ = ( λ N F , λ A F , λ B F , λ C F ) .
By substituting Equation (21) into Equation (19), the HSM of the PMSM-inverter system is derived as follows:
i ˙ = A i + B 1 e + B 2 λ
where i = [ i a   i b   i c ] T is the current state vector; the logic variable vector λ is the discrete input vector; e = [ e a   e b   e c ] T is the back electromotive force vector; A = R s I / L σ is the state coefficient matrix, B 1 = I / L σ is the continuous input coefficient matrix; B 2 = V dc I / 3 L σ is the discrete input coefficient matrix; and the identity matrix I = diag [ 1 , 1 , 1 ] .

3. Proposed Fault Diagnosis Method

The proposed fault diagnosis method can be divided into two steps: fault detection and fault isolation.

3.1. Fault Detection

Under healthy conditions, the system state variables can be estimated accurately by using the healthy HSM of the PMSM-inverter system. If an OC fault occurs in the inverter, the discrete input switching states of the actual system will change greatly, resulting in a large deviation between the estimated state variables obtained by the healthy HSM and the actual ones. Therefore, the healthy HSM can be used as a state estimator to observe the system state variables, and diagnose whether a OC fault has occurred according to the residuals between the estimated values and the actual measured values. The current state estimator of the healthy PMSM-inverter system by means of its healthy HSM is built as follows:
i ¯ ˙ = A i ¯ + B 1 e + B 2 λ N F
where i ¯ = [ i ¯ a i ¯ b i ¯ c ] T is the estimated current vector.
Under healthy conditions, the discrete input vector of the actual system is equal to that of the estimator; that is to say, λ = λ N F . When an OC fault occurs in the inverter, the discrete input vector of the actual system can no longer be same as that of the state estimator, resulting in the state residuals between estimated state variables and actual ones. The current residual function can be obtained by comparing Equation (22) with Equation (23) as follows:
i ˜ ˙ = A i ˜ + B 2 Δ λ
where i ˜ = i i ¯ is the current residual vector and Δ λ = λ λ N F is the discrete input vector deviation.
Define k d as the fault detection threshold; the fault flag variable F a u l t F l a g is given by
F a u l t F l a g = { 1 , if   | i ˜ j | k d 0 , if   | i ˜ j | < k d j { a , b , c }
where i ˜ j ( j { a , b , c } ) are the three-phase current residuals.

3.2. Fault Isolation

When the fault is detected, the HSM is used to simulate the fault data online. By setting the input signals of different switches as null, the simulated currents under different OC fault conditions can be calculated, and the similarity between the simulated currents and the measured currents can be evaluated by using the Euclidean distance method. If the simulated fault type is the same as the actual one, the simulated states will track the actual ones well, so the Euclidean distance between them will be very small; otherwise the Euclidean distance will be very large. Therefore, the fault can be isolated according to the characteristics of Euclidean distance. The Euclidean distance between measurement data and simulated data is defined as
d = i = 1 K ( x r i x s i ) 2
where x r i is the measurement data sequence, x s i is the simulated data sequence and K is the length of the data sequence.
When the fault is detected, online simulation of different fault types is carried out first; that is, the fault data of different fault types are generated synchronously by the HSM of the PMSM-inverter system. The Euclidean distance between the simulated fault type and the actual one is defined as
D s = ( d a s , d b s , d c s )
where d a s , d b s , d c s represent the Euclidean distances between three-phase simulated currents and three-phase measured currents, respectively; s = 1 , 2 , 3 , 4 , 5 , 6 represent six types of simulated faults, respectively.
In order to improve the speed of fault diagnosis and reduce the calculation, K is selected as 1/20 of the current fundamental wave period, which is defined as follows:
K = π 10 p ω m T s
where p is the number of pole pairs, ω m is the mechanical angular speed of the rotor and T s is the sampling period.
Define k t as the fault isolation threshold; the fault type variable F a u l t T y p e is given by
F a u l t T y p e = { s ,   if   D s k t 0 ,   if   D s > k t
It should be noted that, considering the influences when all three-phase currents are close to 0, the diagnosis result is invalid while more than one D s is less than k t . The proposed fault diagnosis principle is shown as Table 5.

3.3. Proposed Fault Diagnosis Algorithm

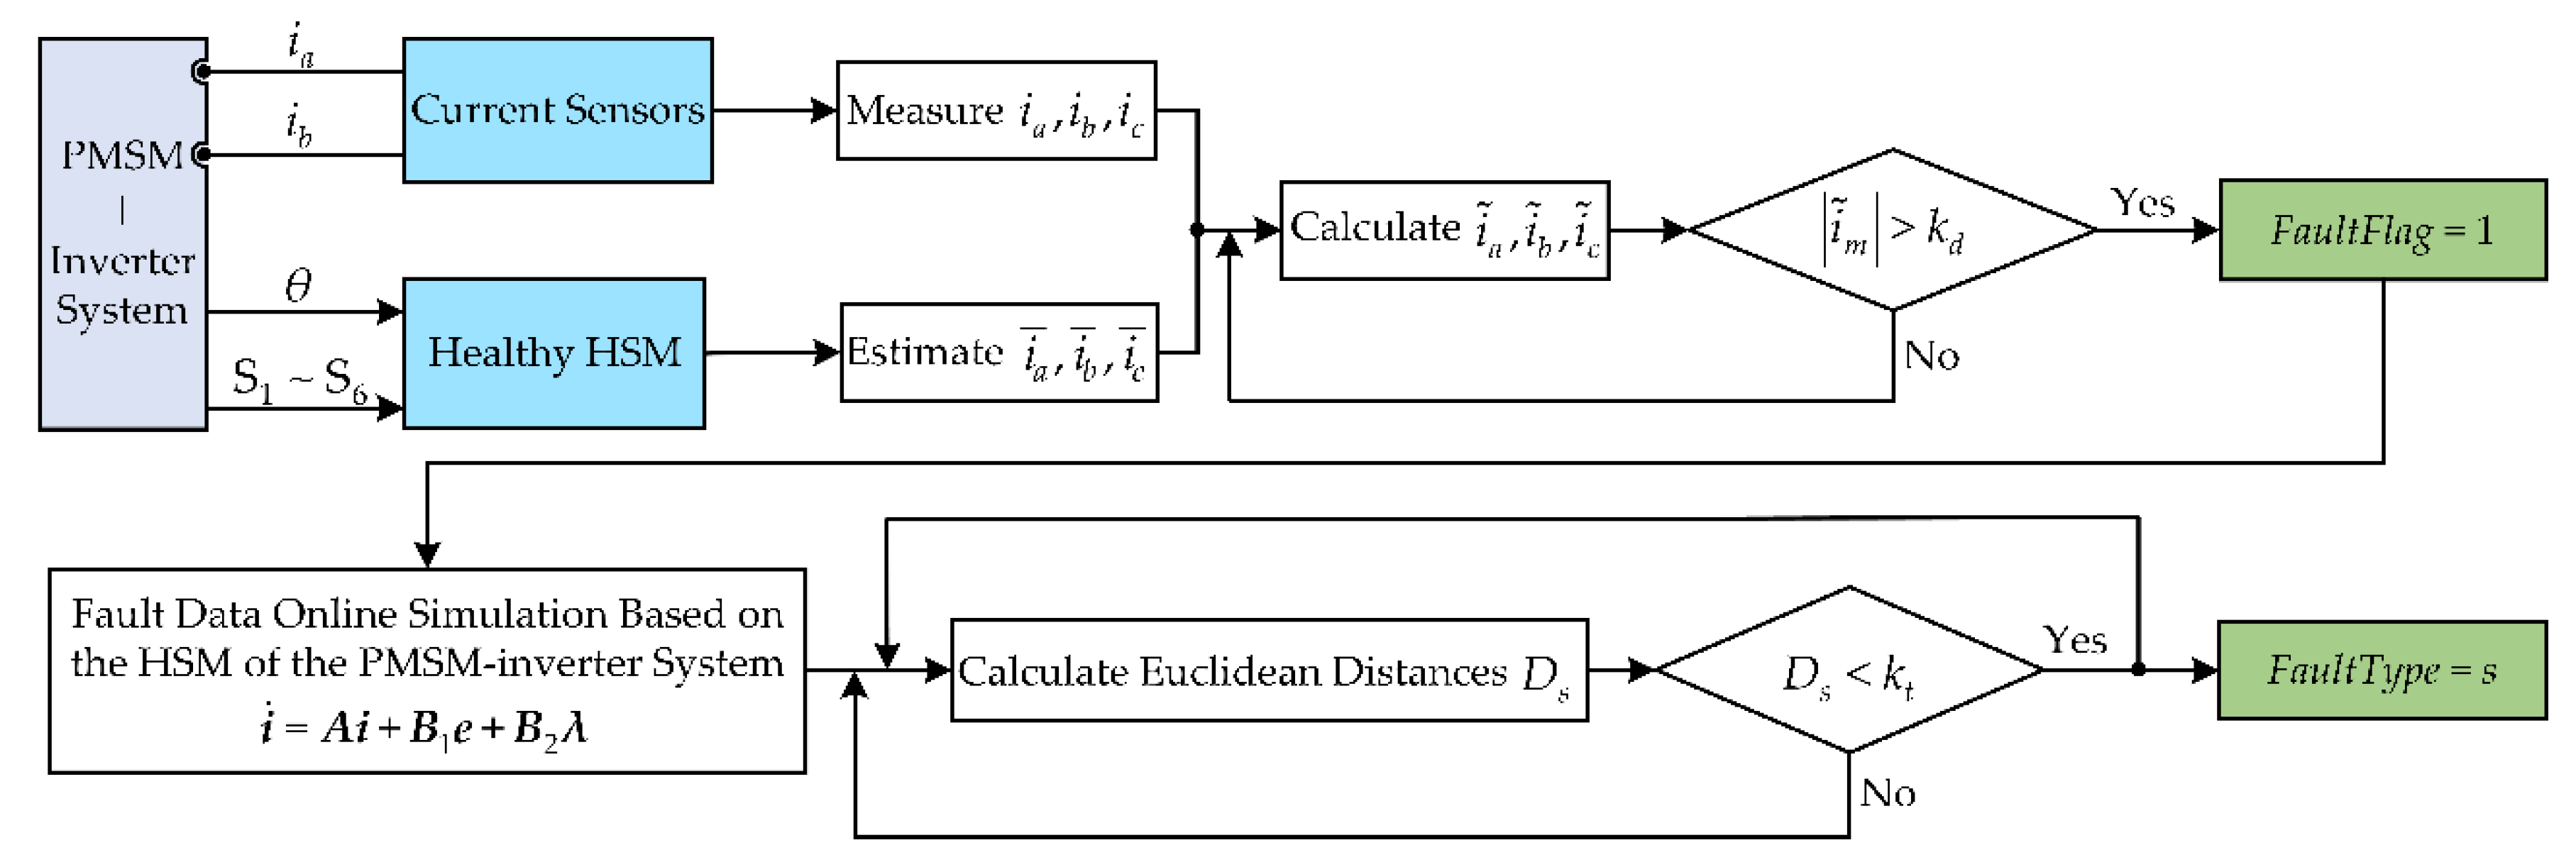
Figure 3 shows the flowchart of the proposed fault diagnosis algorithm. The fault diagnosis is accomplished in the following process: (1) The estimation of three-phase currents. (2) The calculation of three-phase current residuals. (3) Fault detection. (4) Fault isolation. Fault isolation includes three steps: (1) Fault data online simulation. (2) The calculation of Euclidean distances. (3) Identifying which switch is healthy or faulty.

3.4. Selection of Threshold Values

The selection of threshold values is a crucial factor related to the performance of the fault diagnosis algorithm. The appropriate threshold values can improve the reliability of fault diagnosis results and the speed of the diagnosis process, and eliminate the influences of measurement error and system noise. When the HSM of the PMSM-inverter system is used to estimate the motor phase currents, repeated test results show that the estimation error is generally less than 20% of the rated current. In order to ensure the reliability of the fault detection results, the fault detection threshold is set as the rated current, that is, k d = I N . In fault isolation, if the simulated fault type is the same as the actual one, the Euclidean distance between them will be less than D s _ max = 3 ( I N 20 % ) 2 K , so the fault isolation threshold k t = D s _ max can be set.

4. Simulation Results

The simulation model of OC fault diagnosis for three-phase voltage-source inverters based on the HSM was built in the Matlab/Simulink environment, and the rotor-field-oriented vector control strategy was applied to the control algorithm of the PMSM. The parameters related to the test motor are presented in Table 6. The three-phase voltage-source inverter was running with a switching frequency of 10 kHz, and the dc-bus voltage is 311 V. In this system, the threshold values k d = 6 and k t = 3.6 K 1 / 2 , and the Euclidean distances, are limited to 100 for ease of display. In order to reduce the calculation load, the maximum value of K was set to 200.

4.1. 1000-r/min Operation

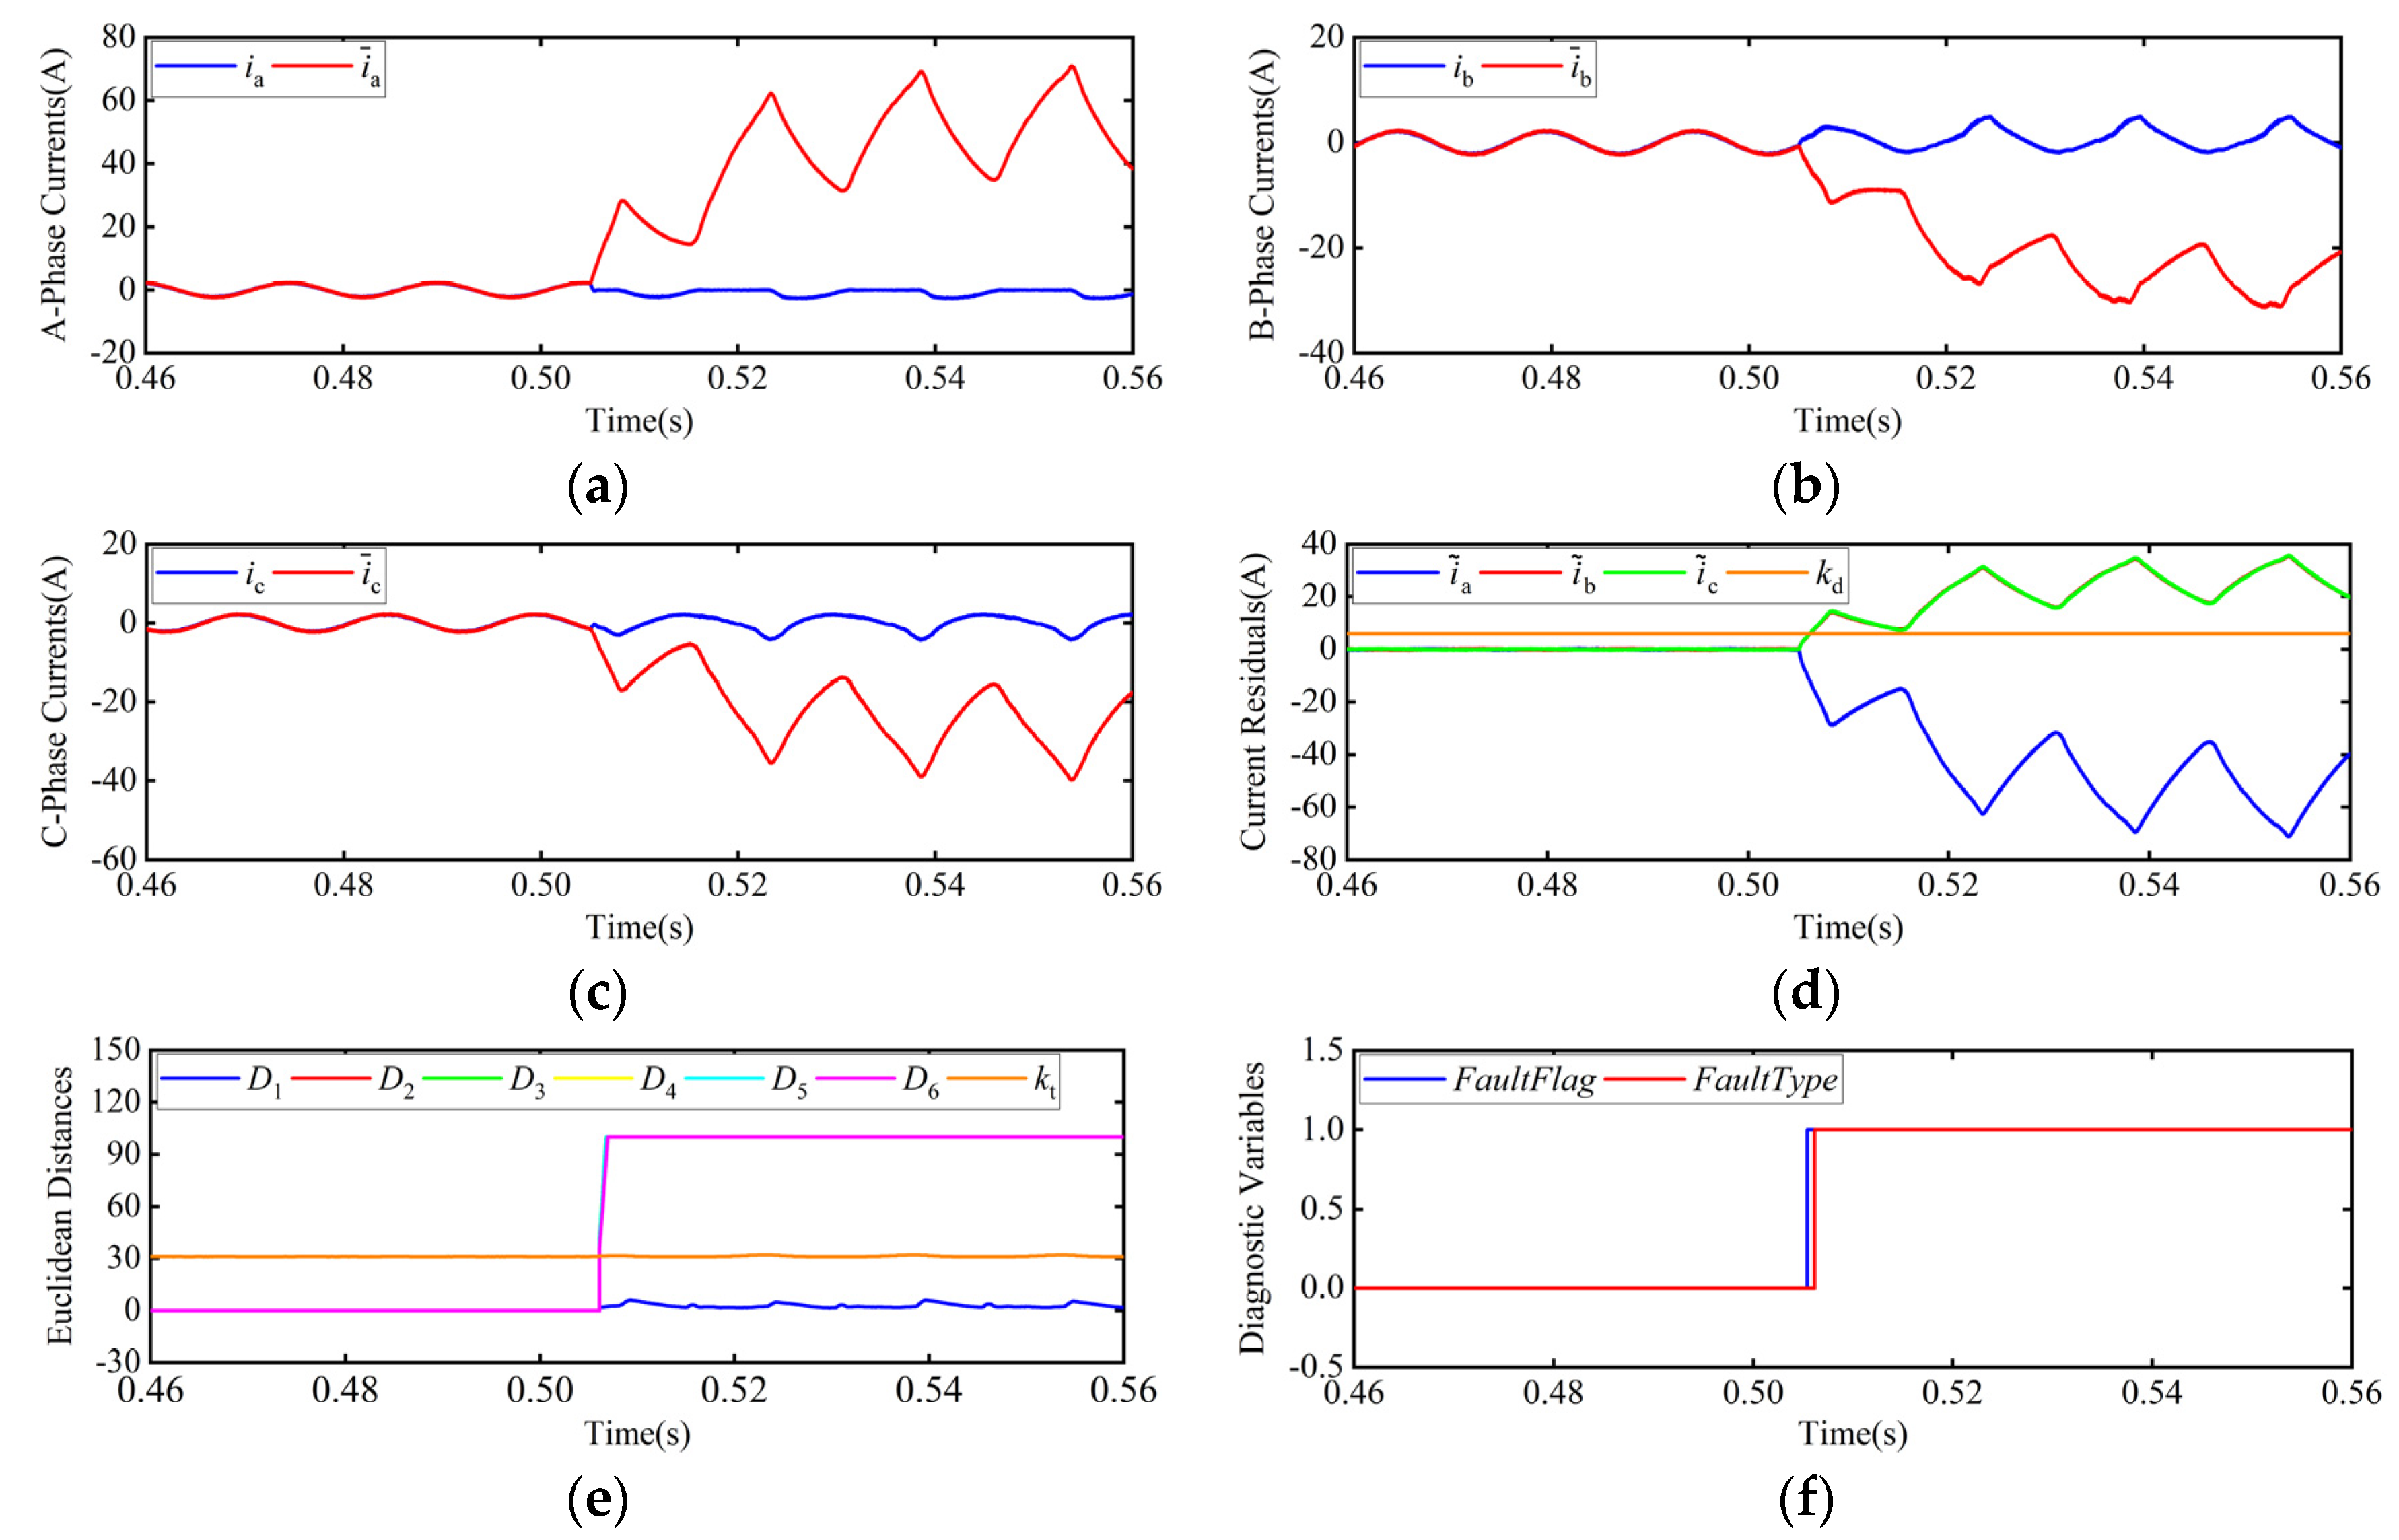
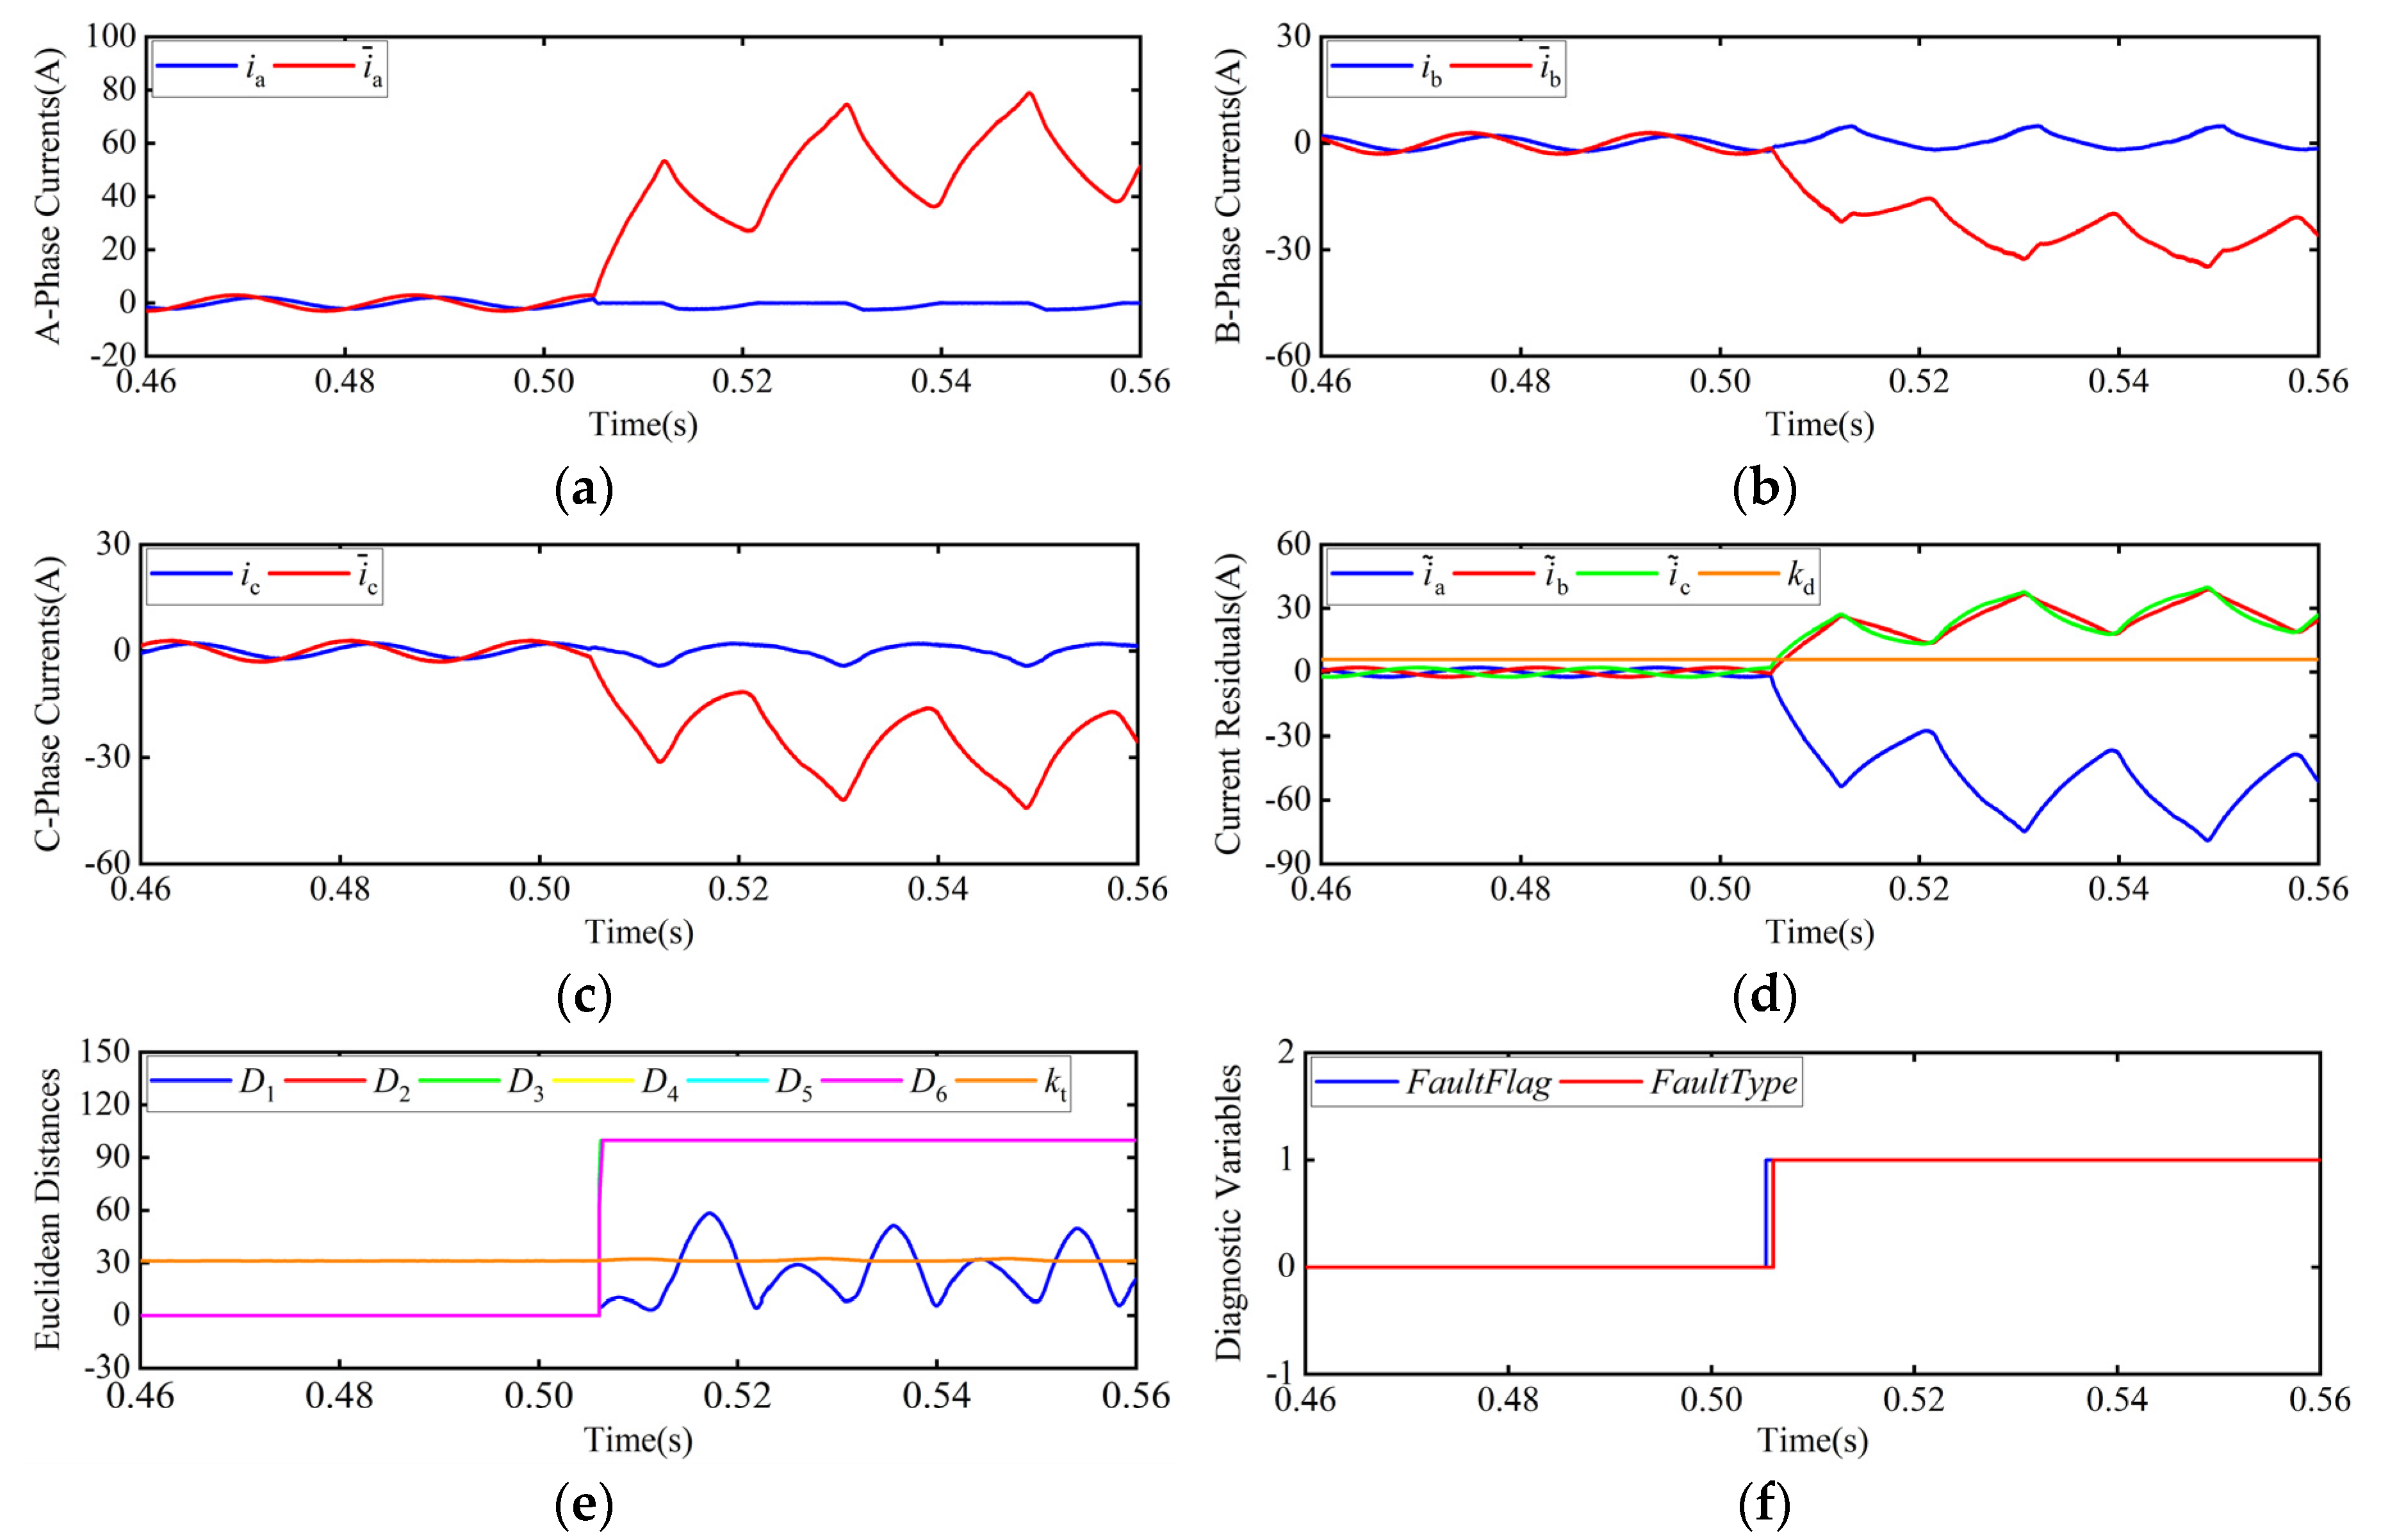
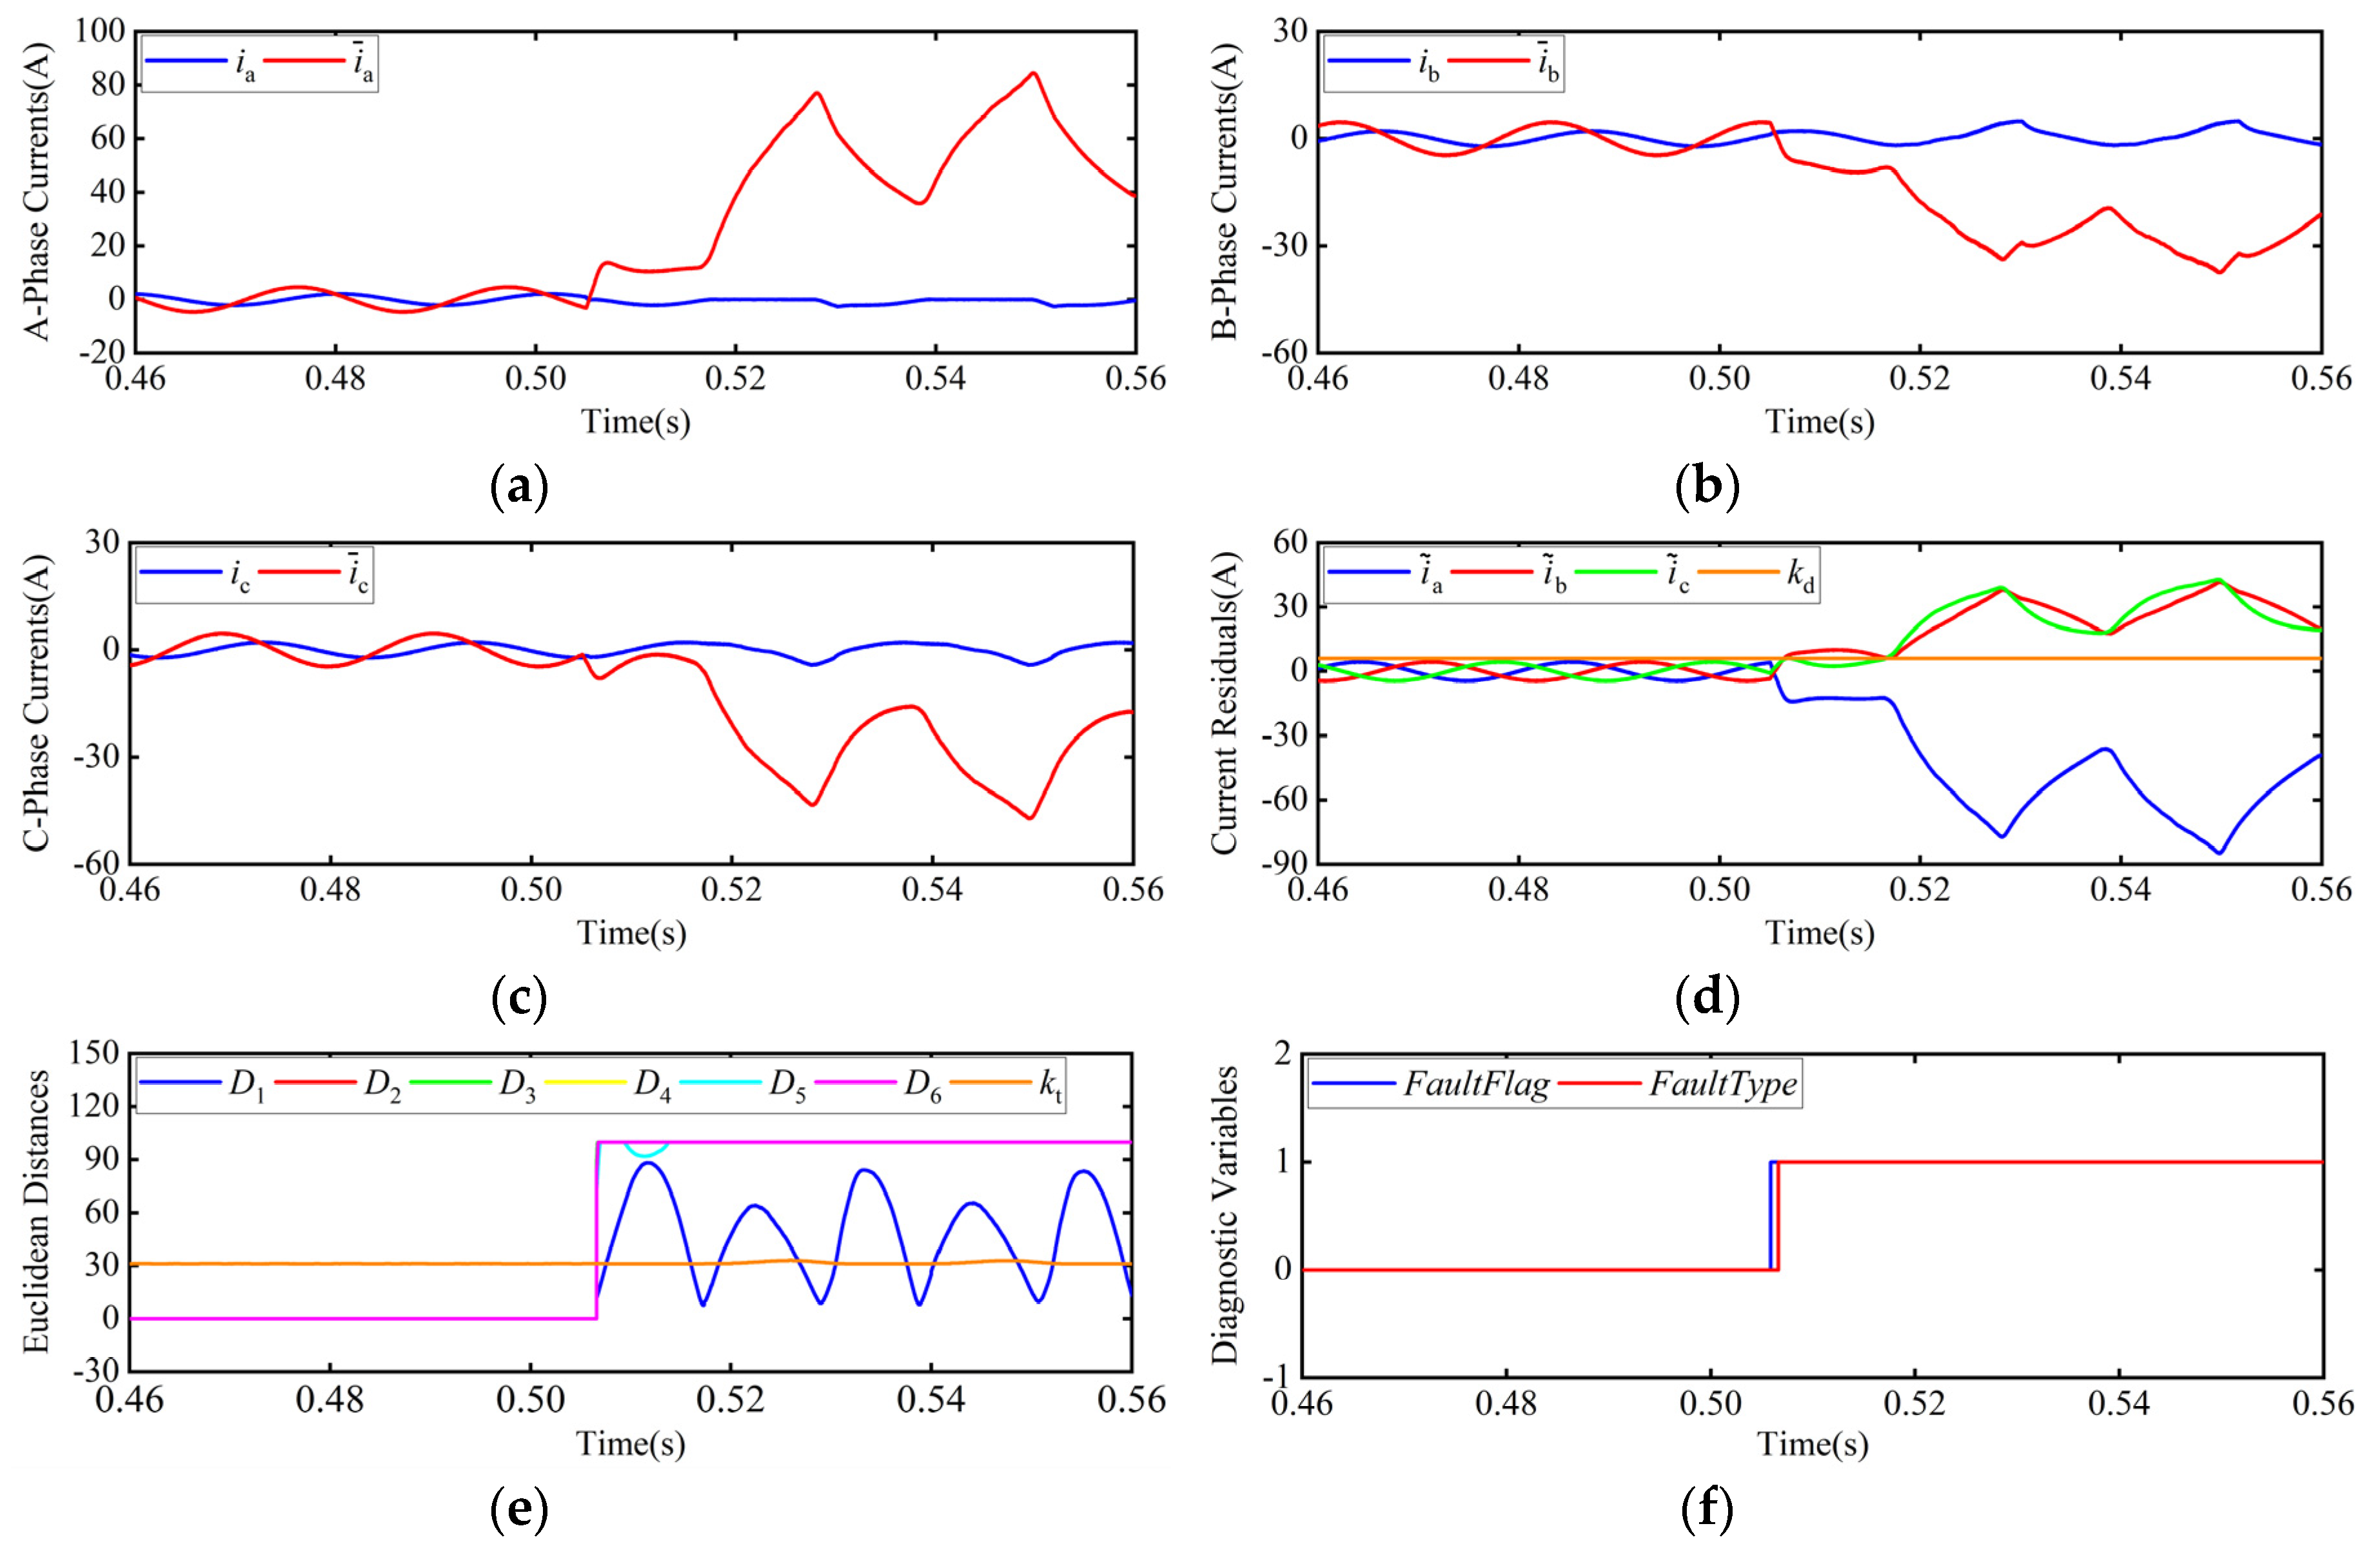
The performance of the fault diagnosis for an upper switch OC fault in T1 by considering a reference speed of 1000 r/min with 2 N·m load is illustrated in Figure 4. Under healthy conditions, the state estimator has the same discrete input vector as the actual system; the estimated currents are very close to the measured ones; and the amplitudes of the current residuals are within the threshold. Thus, the Euclidean distances D s   ( s = 1 , 2 , 3 , 4 , 5 , 6 ) are all near zero, and the fault diagnostic variables are null. When an OC fault occurred in the switch T1 at the instant t = 0.505 s, the estimated currents were no longer close to the measured ones; the amplitude of current residuals quickly exceeded the preset threshold. As a result, the fault flag variable F a u l t F l a g changed to 1 at the instant t = 0.5054 s, indicating that the fault had occurred. After this moment, the Euclidean distances D s ( s = 2 , 3 , 4 , 5 , 6 ) all quickly exceeded the fault isolation threshold k t ; only D 1 was much smaller than it. The fault type variable F a u l t T y p e changed to 1 at the instant t = 0.5061 s, which revealed the OC fault in T1. Furthermore, the faulty switch is correctly detected and isolated in 1.10 ms, which is about 7.33% of the current fundamental wave period.
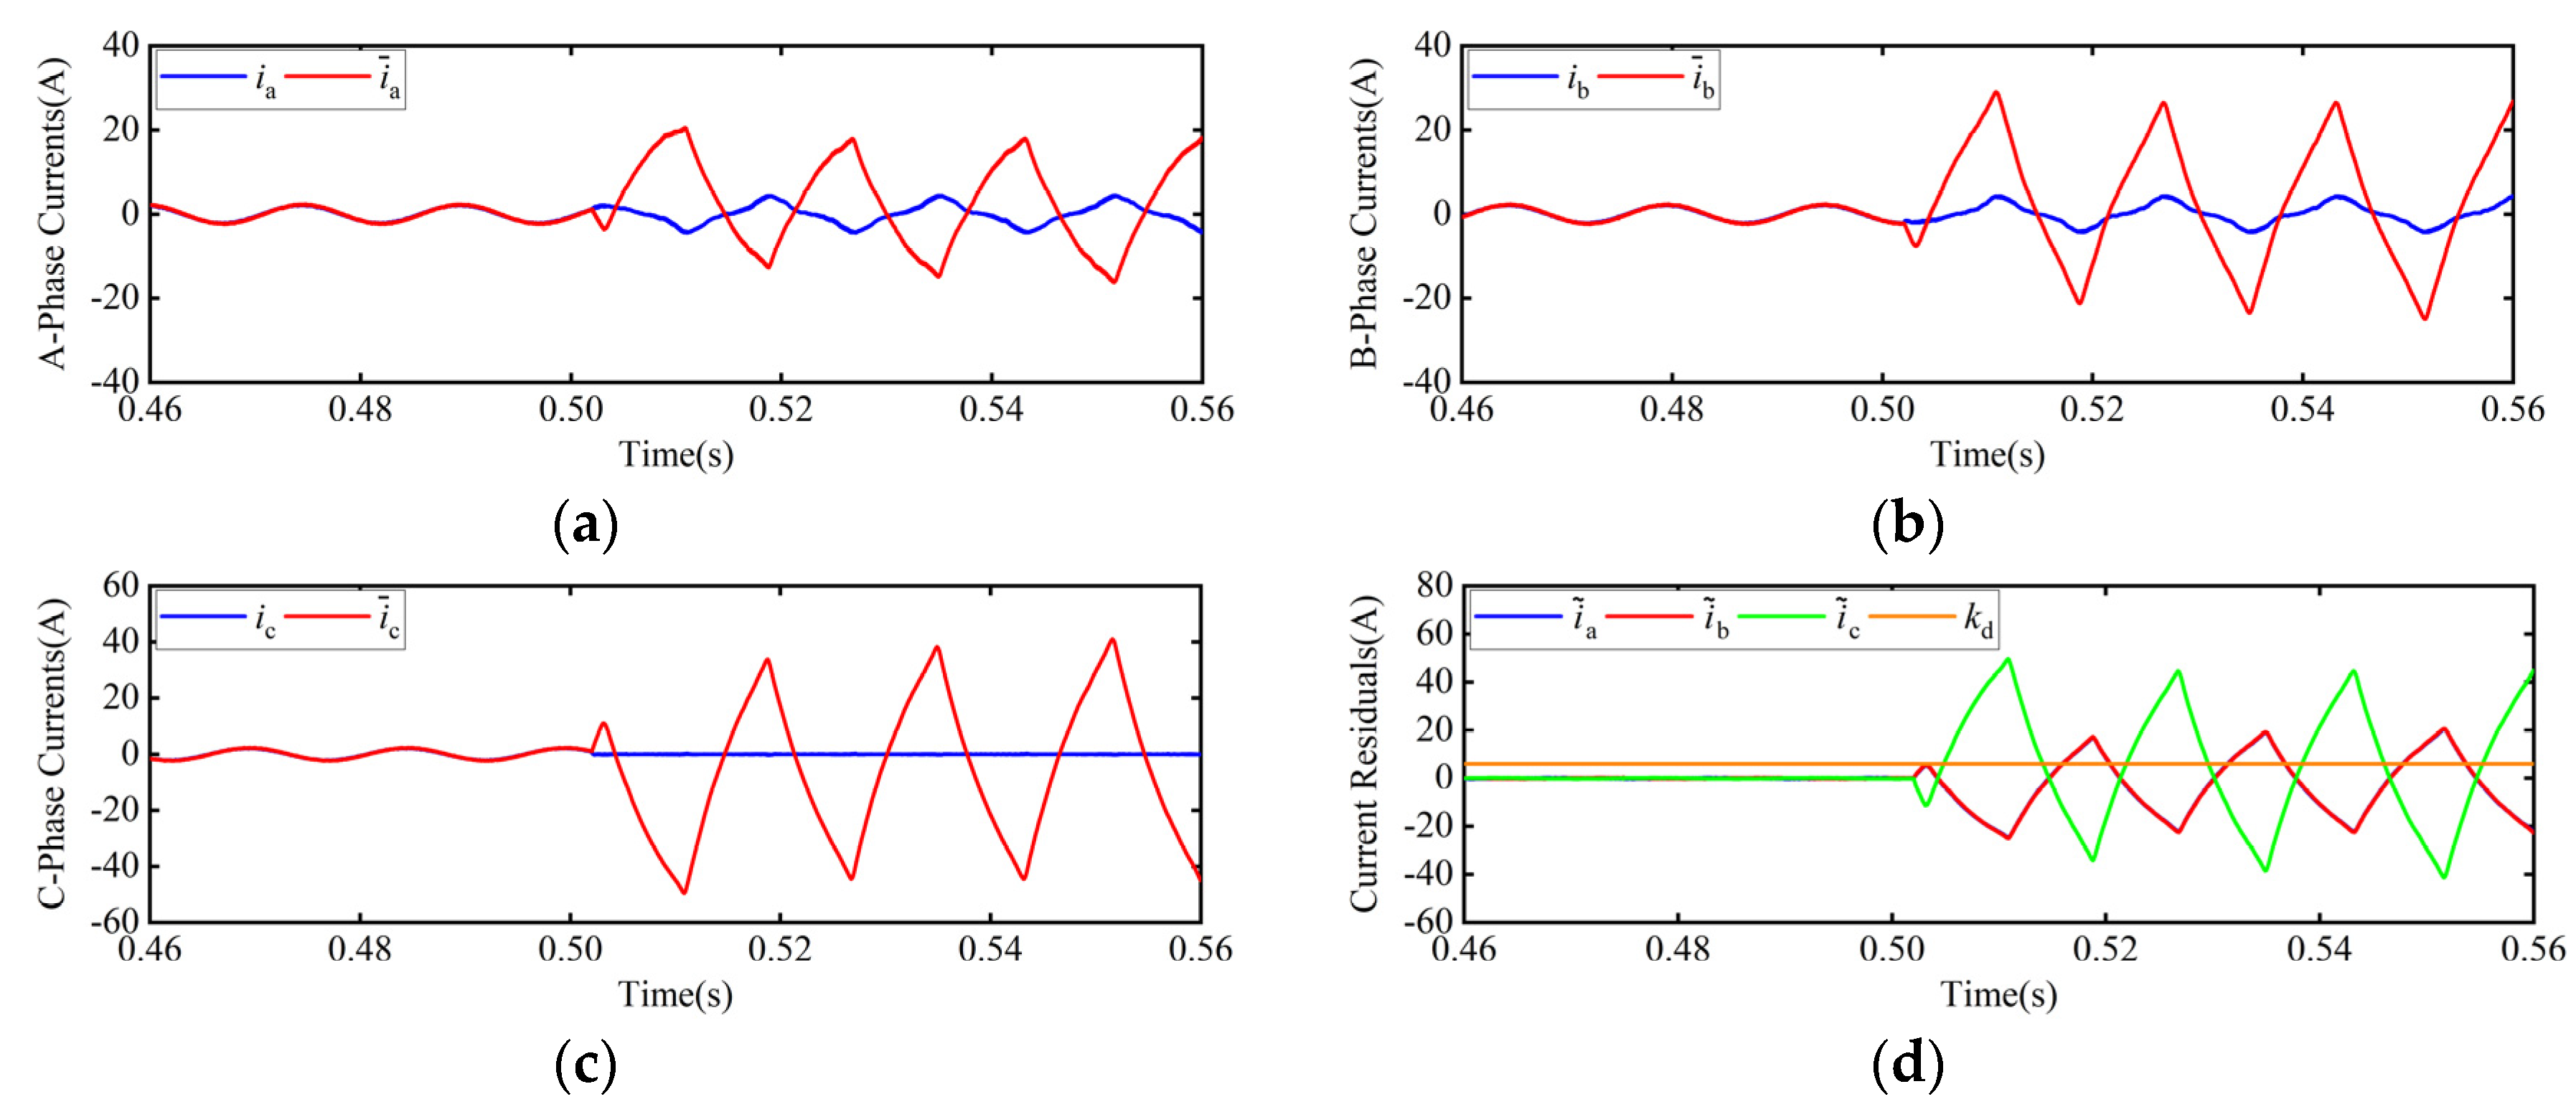
Figure 5 shows the performance of the fault diagnosis for a phase OC fault under 2 N·m load and by considering a reference speed of 1000 r/min, wherein the fault occurred in the switches T5 and T6 of C-phase simultaneously at the instant t = 0.502 s. In this case, at the instant t = 0.5025 s, the fault flag variable F a u l t F l a g changed to 1. Then the Euclidean distances D s ( s = 1 , 2 , 3 , 4 ) all quickly exceeded the fault isolation threshold k t . Differently from the above situation, the Euclidean distances D 5 and D 6 fluctuated above and below the fault isolation threshold k t , and they were not less than the threshold at the same time, which made the fault type variable F a u l t T y p e change between 5 and 6, indicating that the OC had faults in T5 and T6. At the instant t = 0.5033 s, the fault type variable F a u l t T y p e changed to 5, which means the diagnosis time of the faulty switch T5 was about 8.67% of the current fundamental wave period.

4.2. 10-r/min Operation

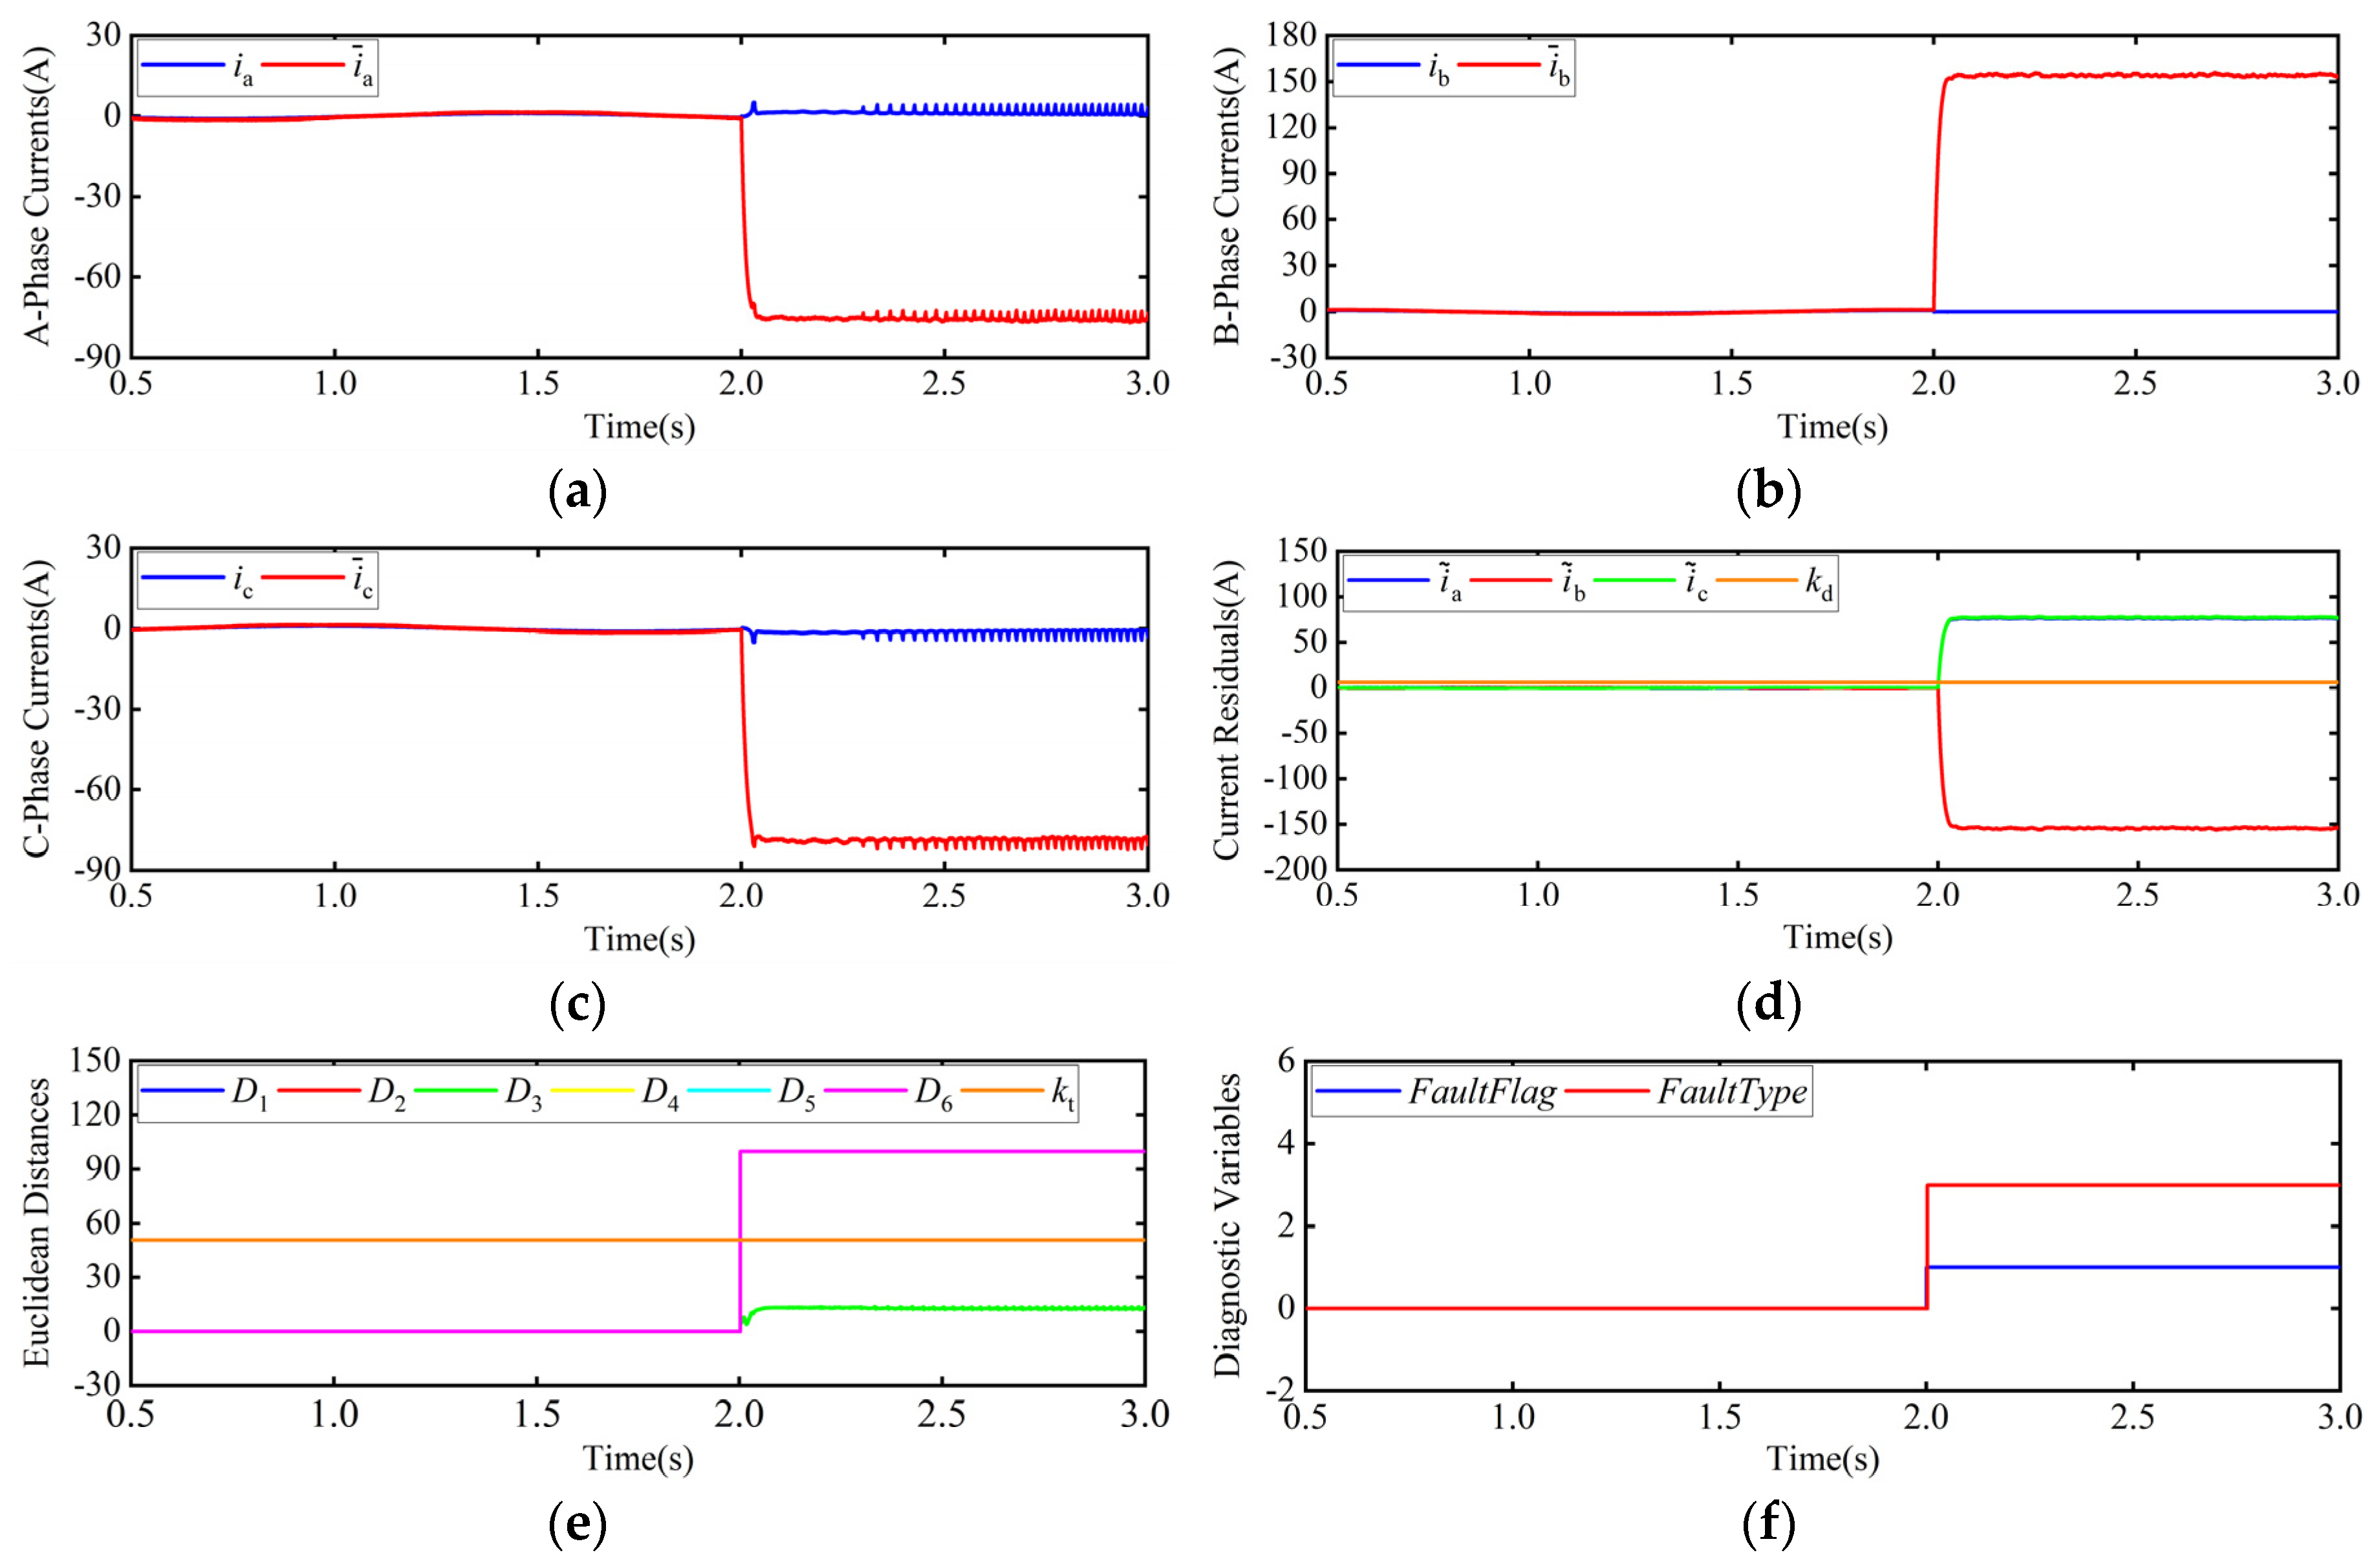
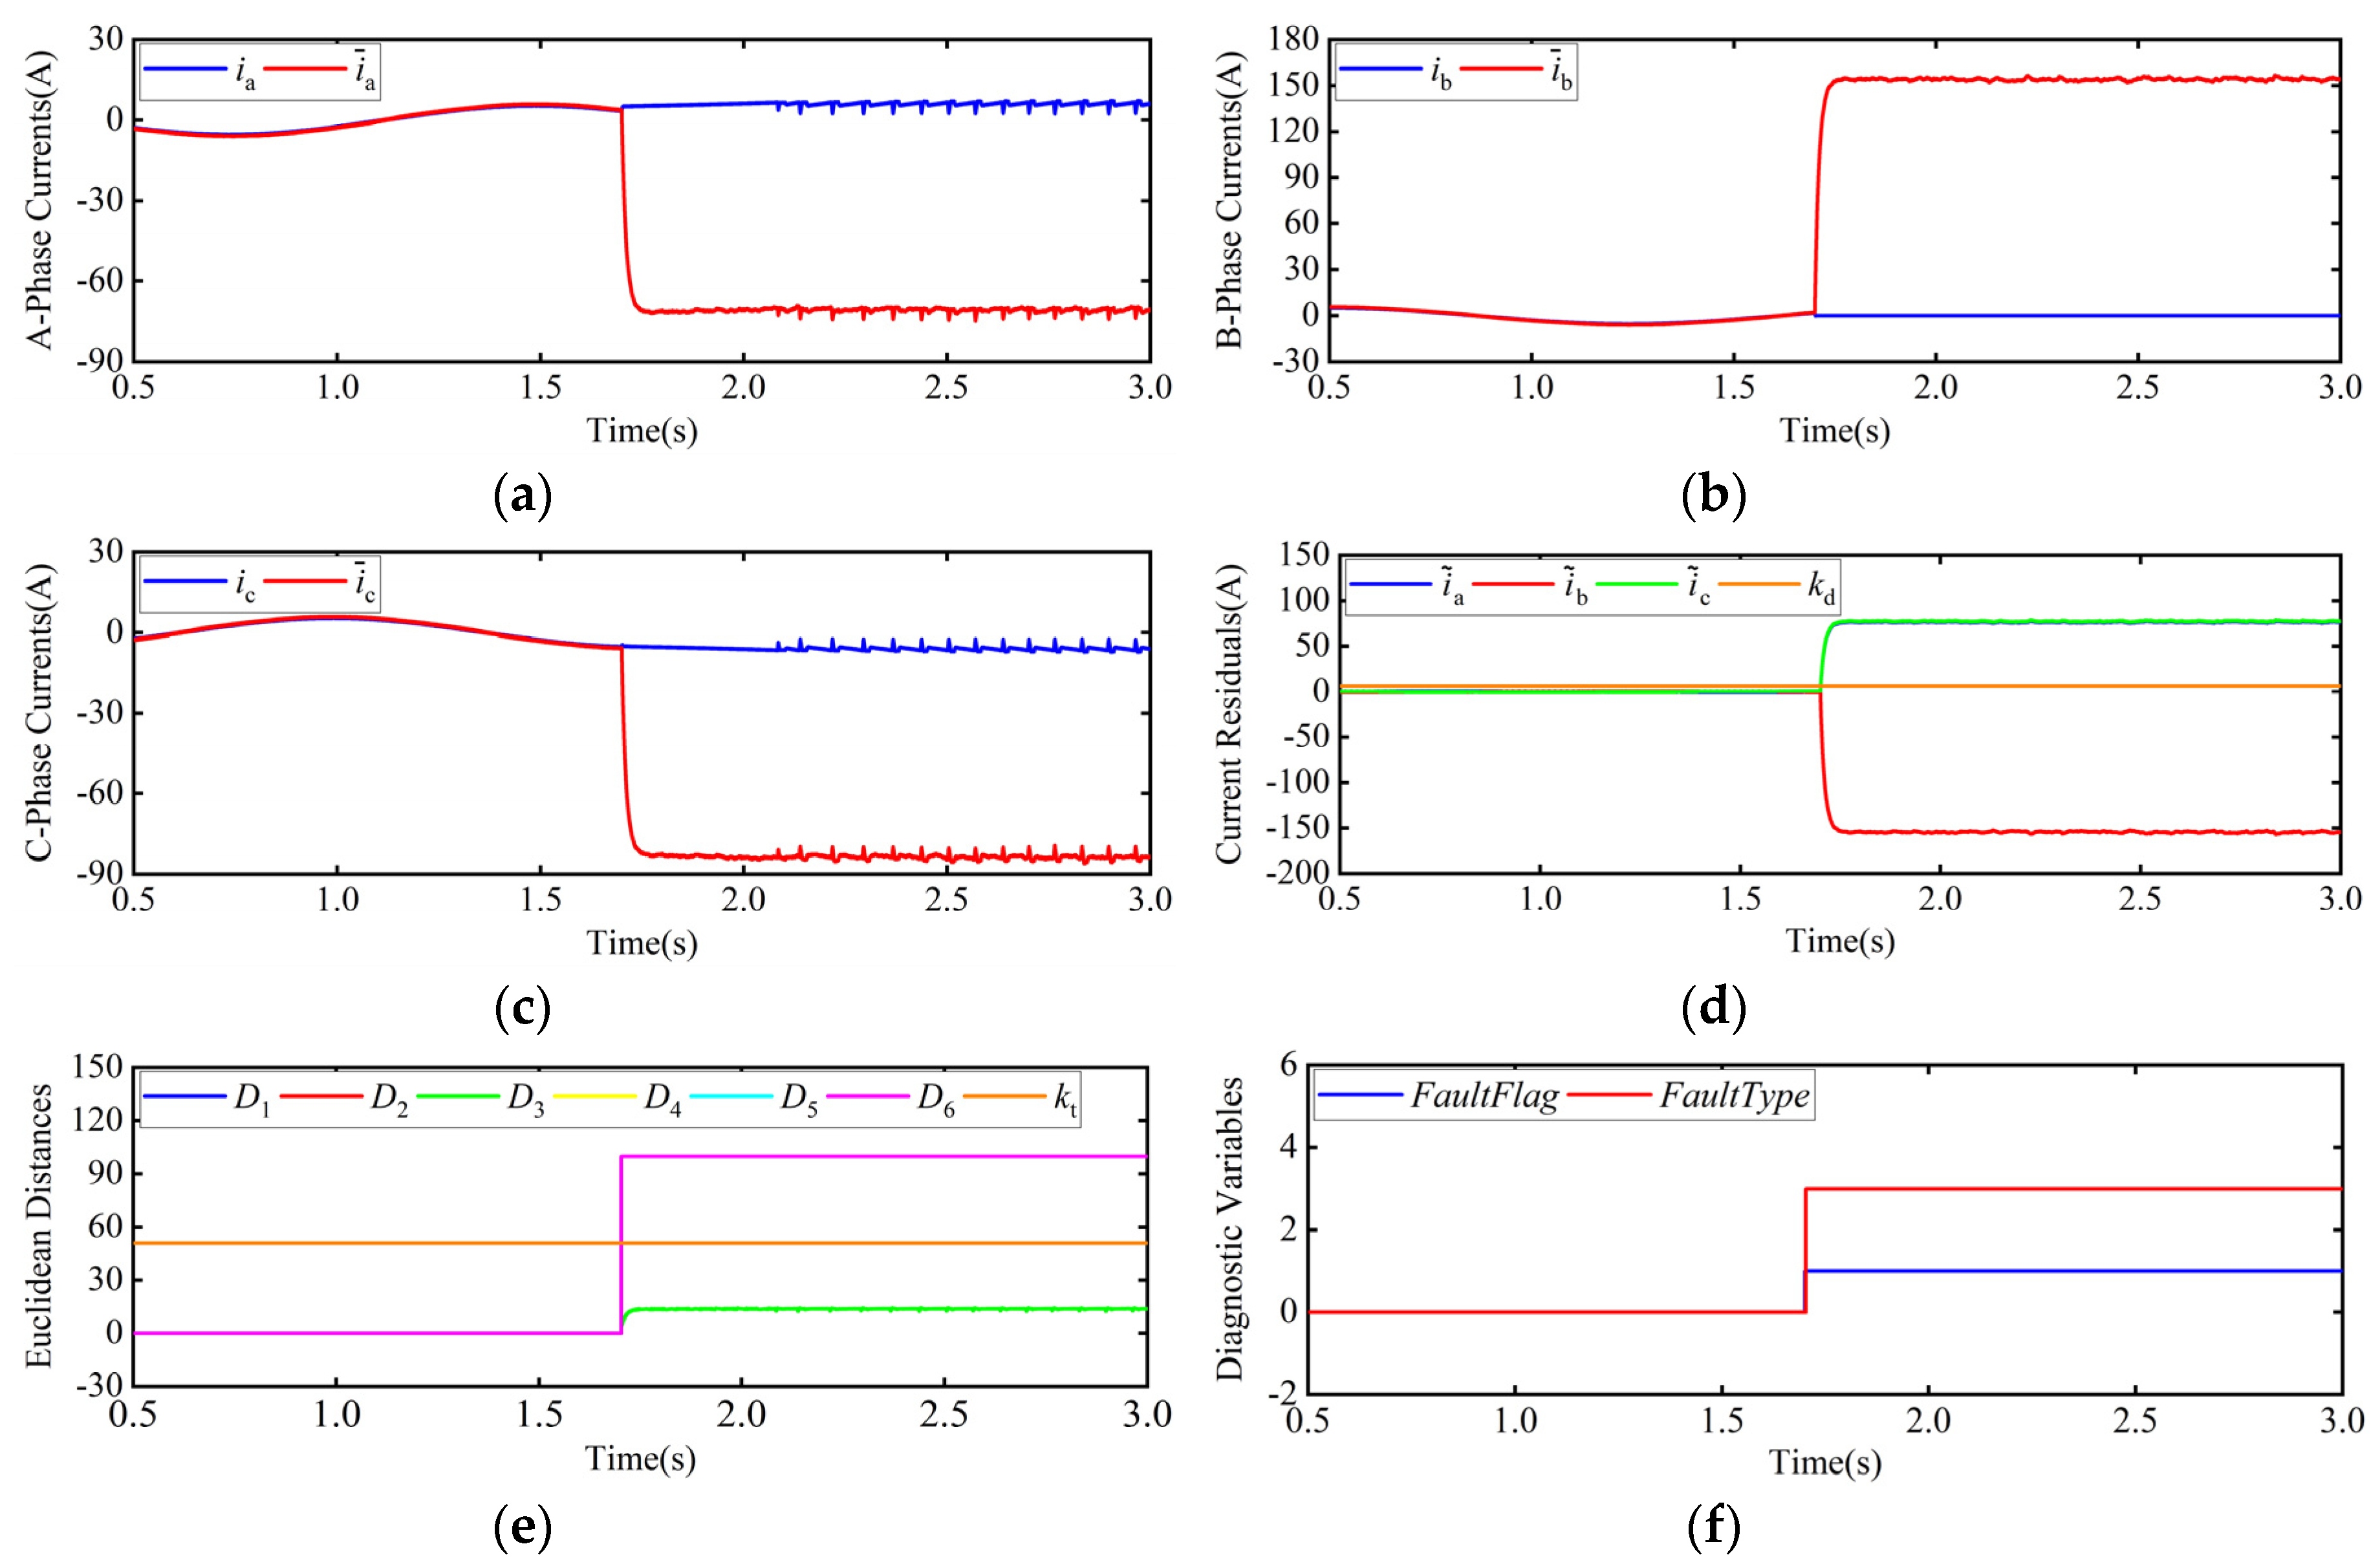
The performance of the fault diagnosis for a fault in T3 by considering a reference speed of 10 r/min is illustrated in Figure 6 and Figure 7. Figure 6 shows the test results for the fault occurring at the instant t = 2 s under 1 N·m load, and Figure 7 shows that for the fault occurring at t = 1.7 s under 5 N·m. It can be seen that for healthy conditions, the estimated currents are very close to the measured ones and the fault diagnostic variables are null. After the fault occurrence, the current residuals increase immediately and quickly exceed the fault detection threshold k d . As a result, the fault flag variable F a u l t F l a g changes to 1, which means the fault has occurred. Then, the Euclidean distances D s ( s = 1 , 2 , 4 , 5 , 6 ) all grow very rapidly, only D 3 is less than the fault isolation threshold k t , so the fault can be isolated according to Table 4. Regarding the diagnosis time, the abnormal inverter operation was detected and isolated in 5 ms, which is equivalent to 0.33% of the current fundamental wave period.

4.3. Speed and Load Variations

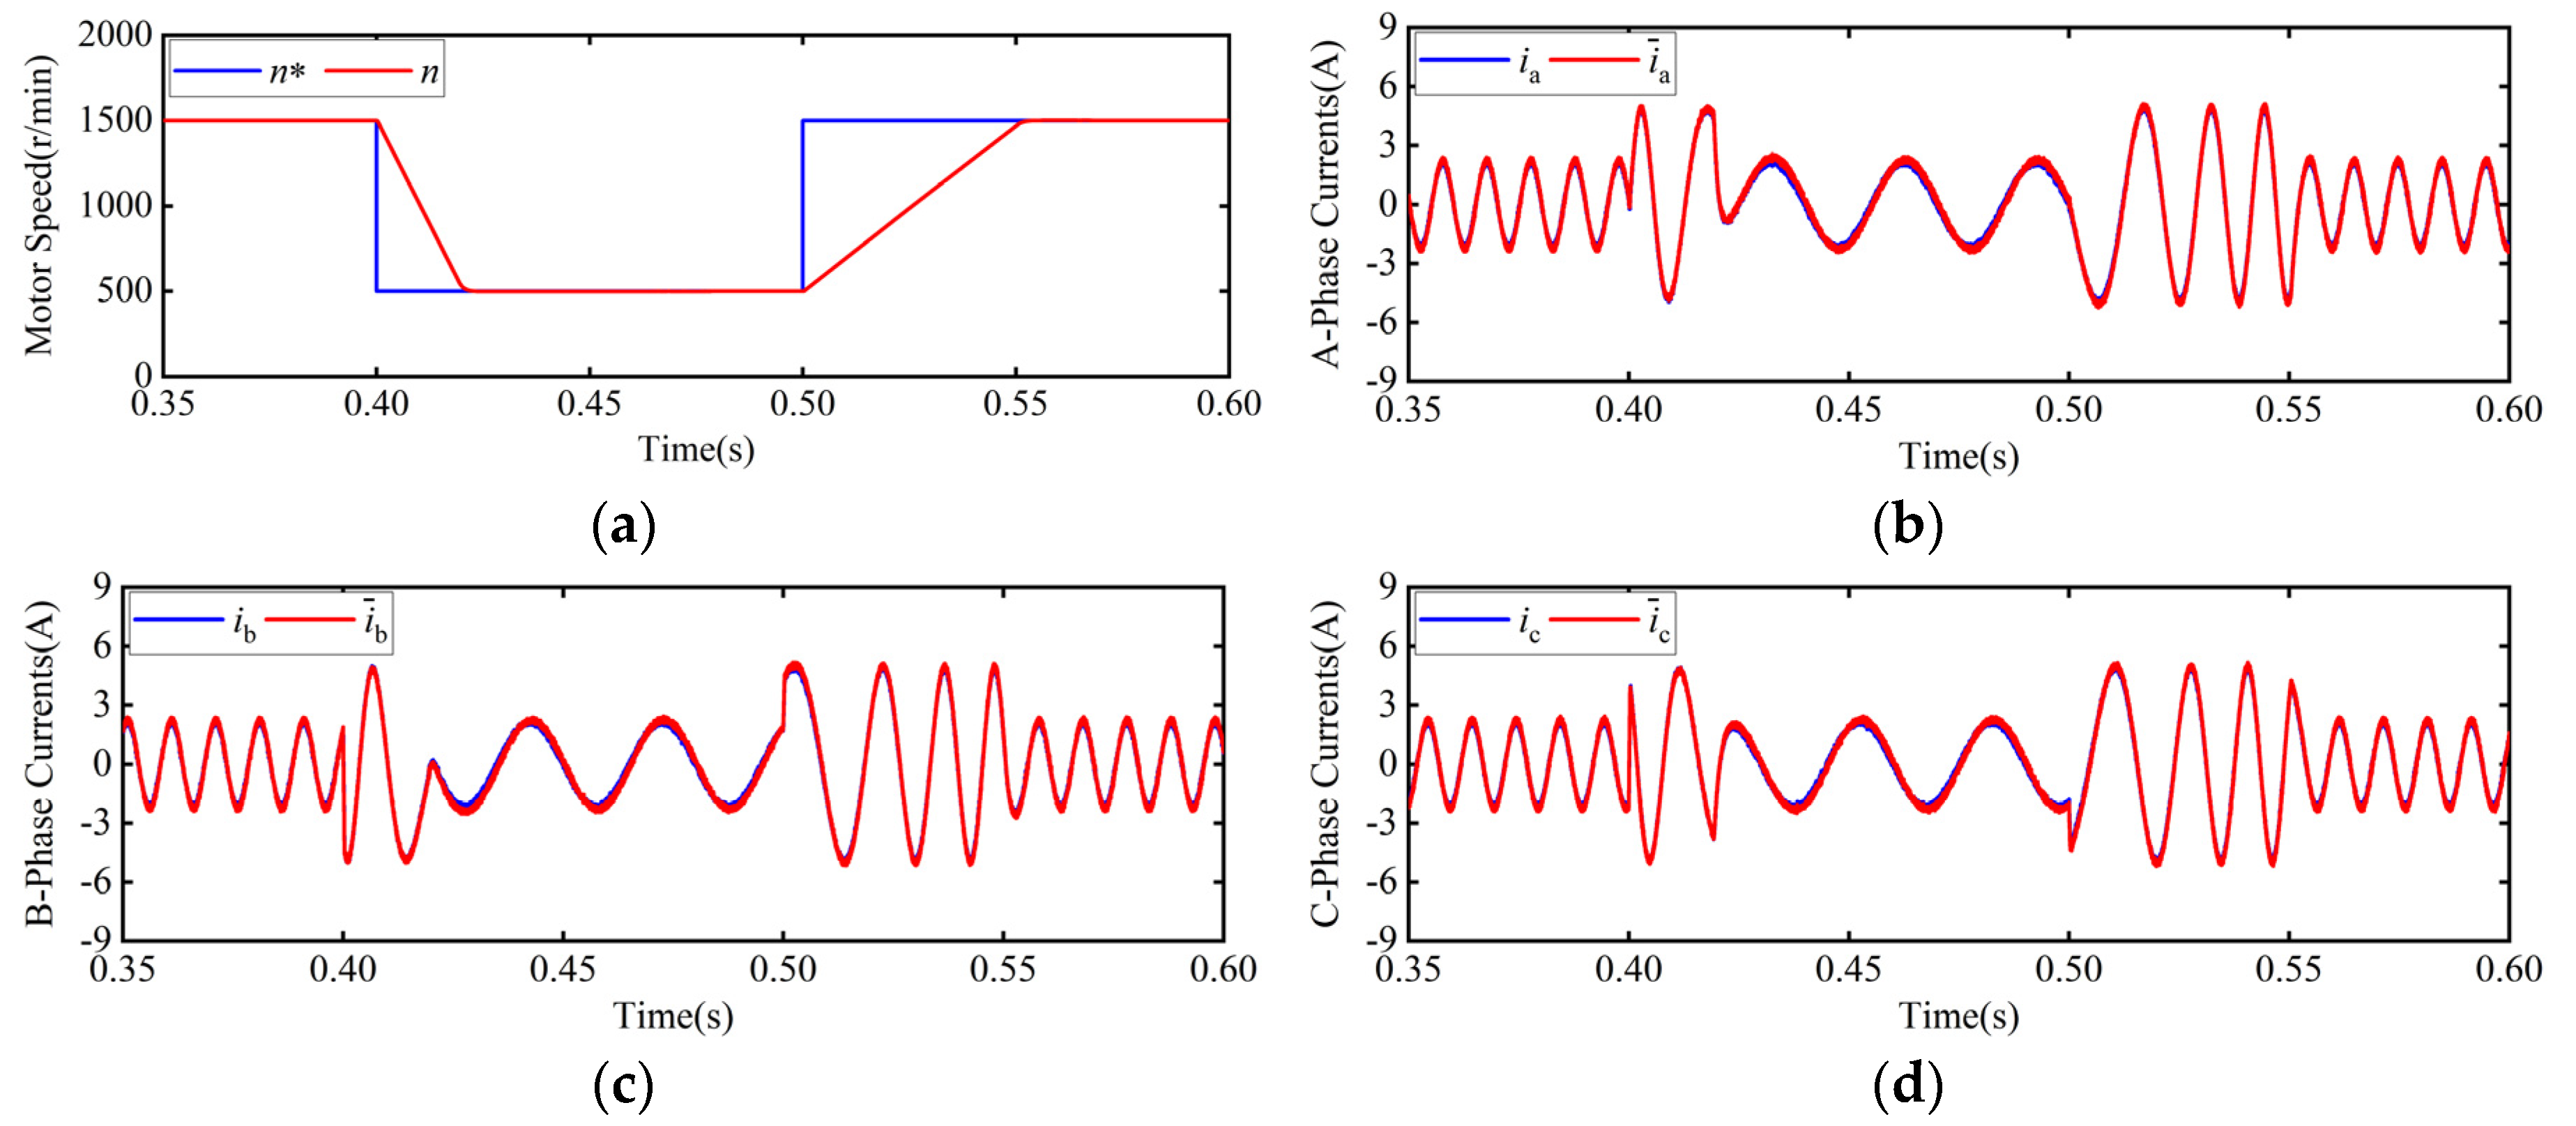
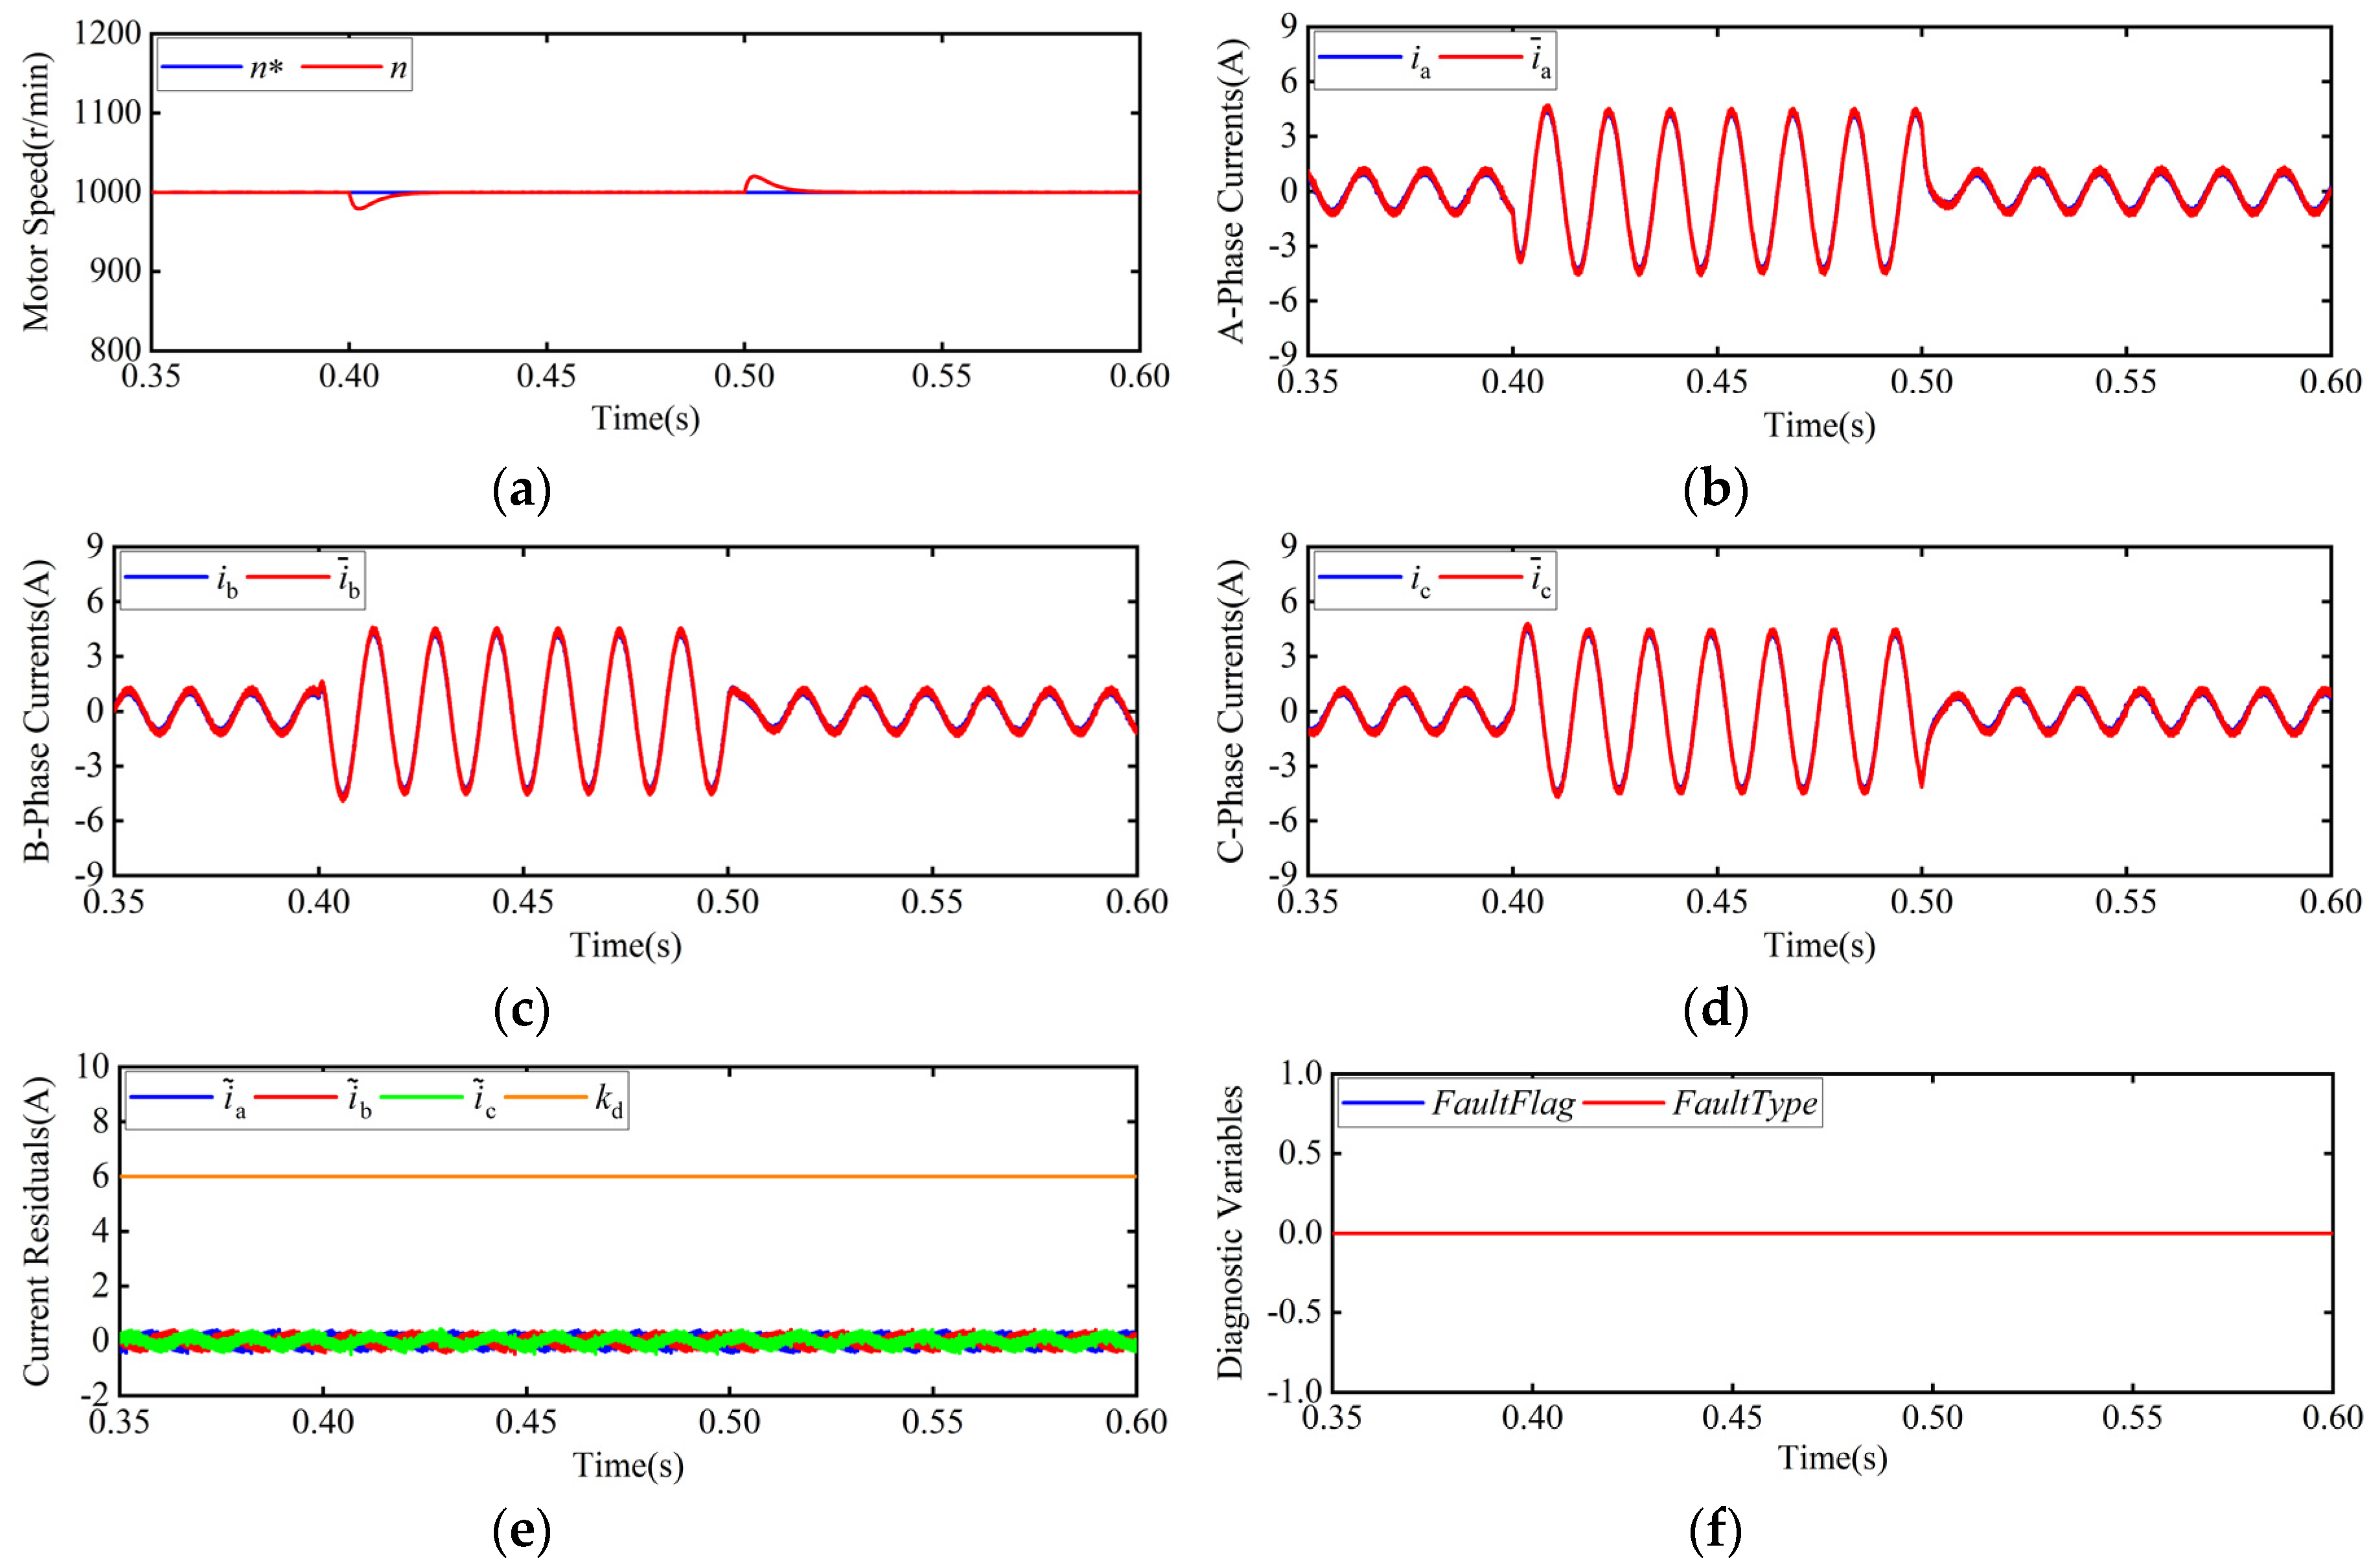
The responses for variations of the motor speed and load are shown in Figure 8 and Figure 9. Figure 8 shows that the test results for the motor speed changed from 500 to 1500 r/min and back to 500 r/min at the load of 2 N·m. Figure 9 shows that the test results for the load changed from 1 N·m to 4 N·m and back to 1 N·m at a reference speed of 1000 r/min. It is seen that the estimated currents can follow the measured currents well, even through abrupt speed or load changes, and the fault diagnostic variables are always null. The above two test results show that the proposed fault diagnosis method has high immunity to false alarms in transient states.

4.4. Parameter Variations

To evaluate the effect of parameter mismatch on diagnostic performance, the diagnostic results of parameter variations at a reference speed of 1000 r/min with 2 N·m load were investigated. Figure 10 shows the test results of 20% parameter deviations relative to nominal parameters (stator resistance Rs, q-axis inductance Lq, electric angular speed ω e ), for which the fault occurred in T1 at the instant t = 0.505 s, and Figure 11 shows the test results of 40% parameter deviations. From these results, it can be seen that for the healthy inverter operation, the current residuals are about 2 A when 20% parameter deviations are imposed, and they are nearly 5 A under 40% parameter deviations, both of which are less than the fault detection threshold k d , so no false alarms are generated. When an OC fault occurred in T1 at the instant t = 0.505 s, the amplitude of current residuals quickly exceeded k d , indicating that the fault had occurred. In the fault isolation step, the Euclidean distances D s ( s = 2 , 3 , 4 , 5 , 6 ) all quickly exceeded the fault isolation threshold k t in a short time. Although D 1 was larger than k t at some moments, the faulty switch could still be accurately isolated according to the proposed fault diagnosis principle. Therefore, the proposed method has high robustness and reliability against parameter mismatching.

5. Experimental Results

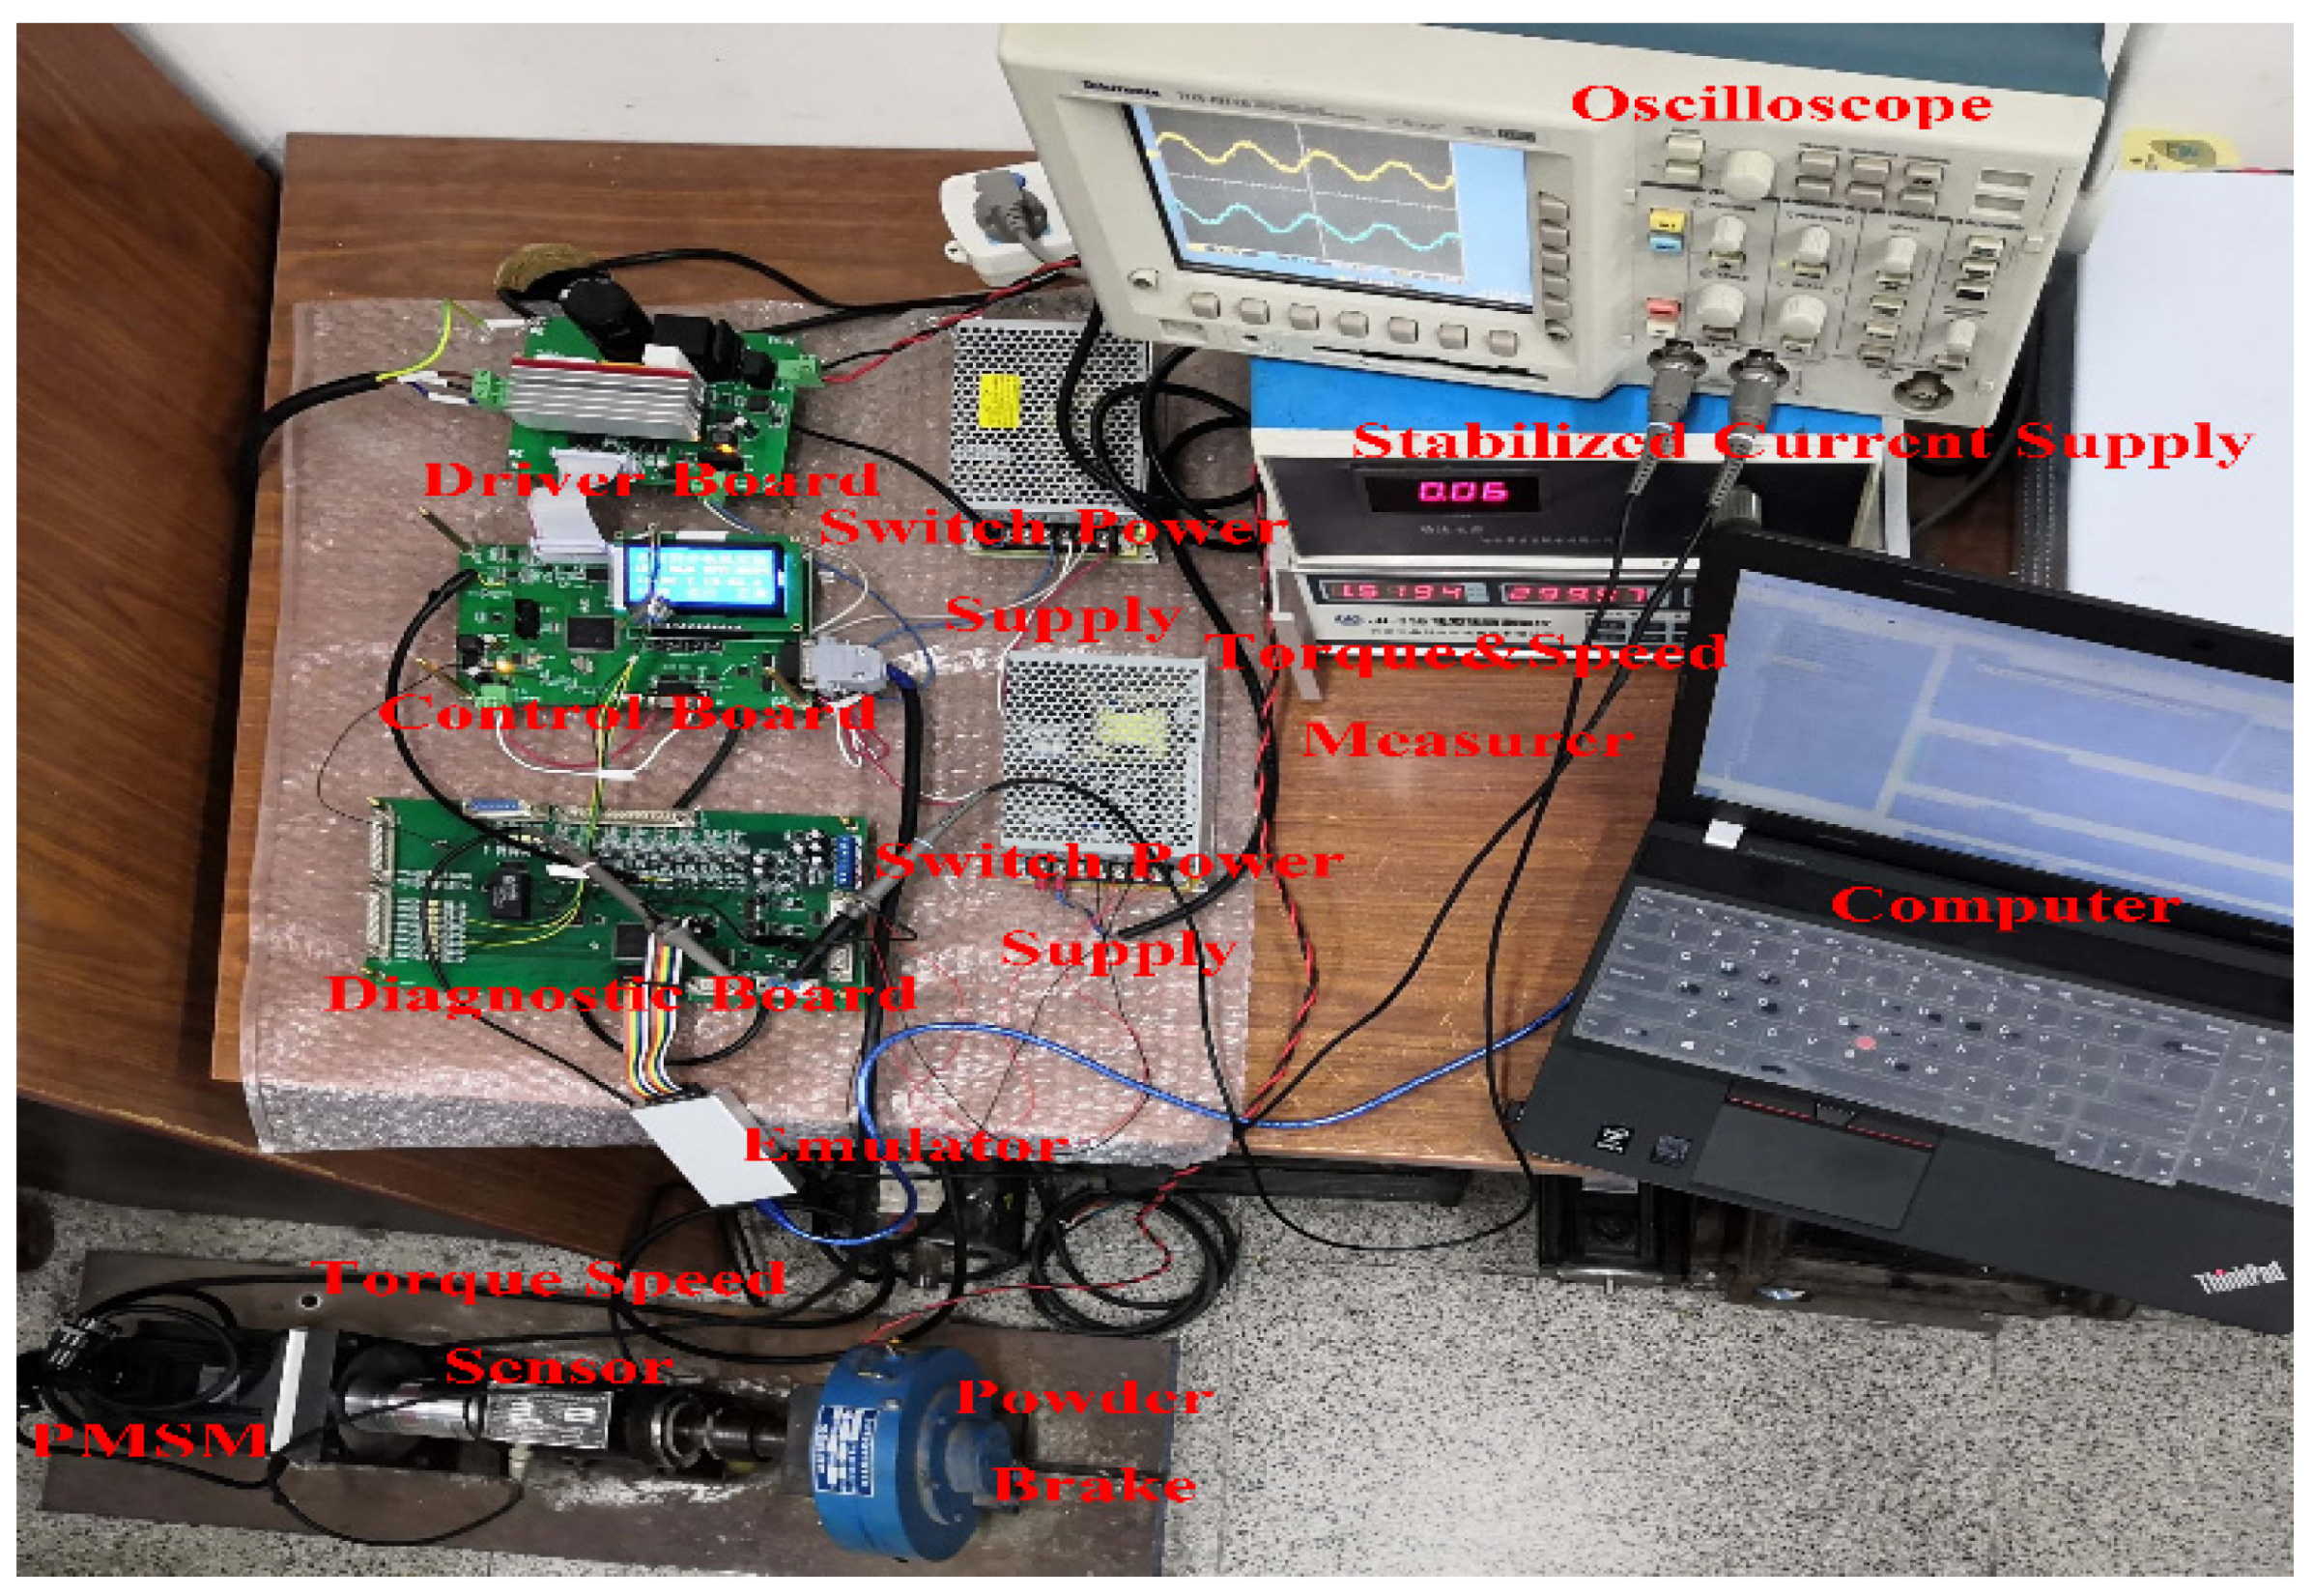
To verify the effectiveness of the proposed method, the experimental validation was implemented based on two digital signal processing (DSP) boards, and the scheme and photograph of the experiment platform are shown in Figure 12 and Figure 13, respectively. One DSP board (TMS320F28335) was used to control the motor, and the other (TMS320F2812) was used to diagnose the fault. The dc-bus voltage was 311 V, and the switching frequency was 5 kHz with a dead time of 2.67 μs. The sampling rate used for fault diagnosis was 10 kHz, and the one-step Euler method was used in the discrete time realization of the fault data online simulation with a sampling period of 50 μs. In experiments, the data were saved in the flash memory of the diagnostic board and transmitted to the PC after the motor stopped. All the data could be saved as CSV files for redrawing, and the following figures in experimental parts were obtained in this way. The motor parameters and the threshold values are the same as those of the simulation conditions, and the Euclidean distances are also limited to 100 for ease of display. For the convenience of the experiment, the OC faults are simulated by setting the gate drive signals of the power switches to null.
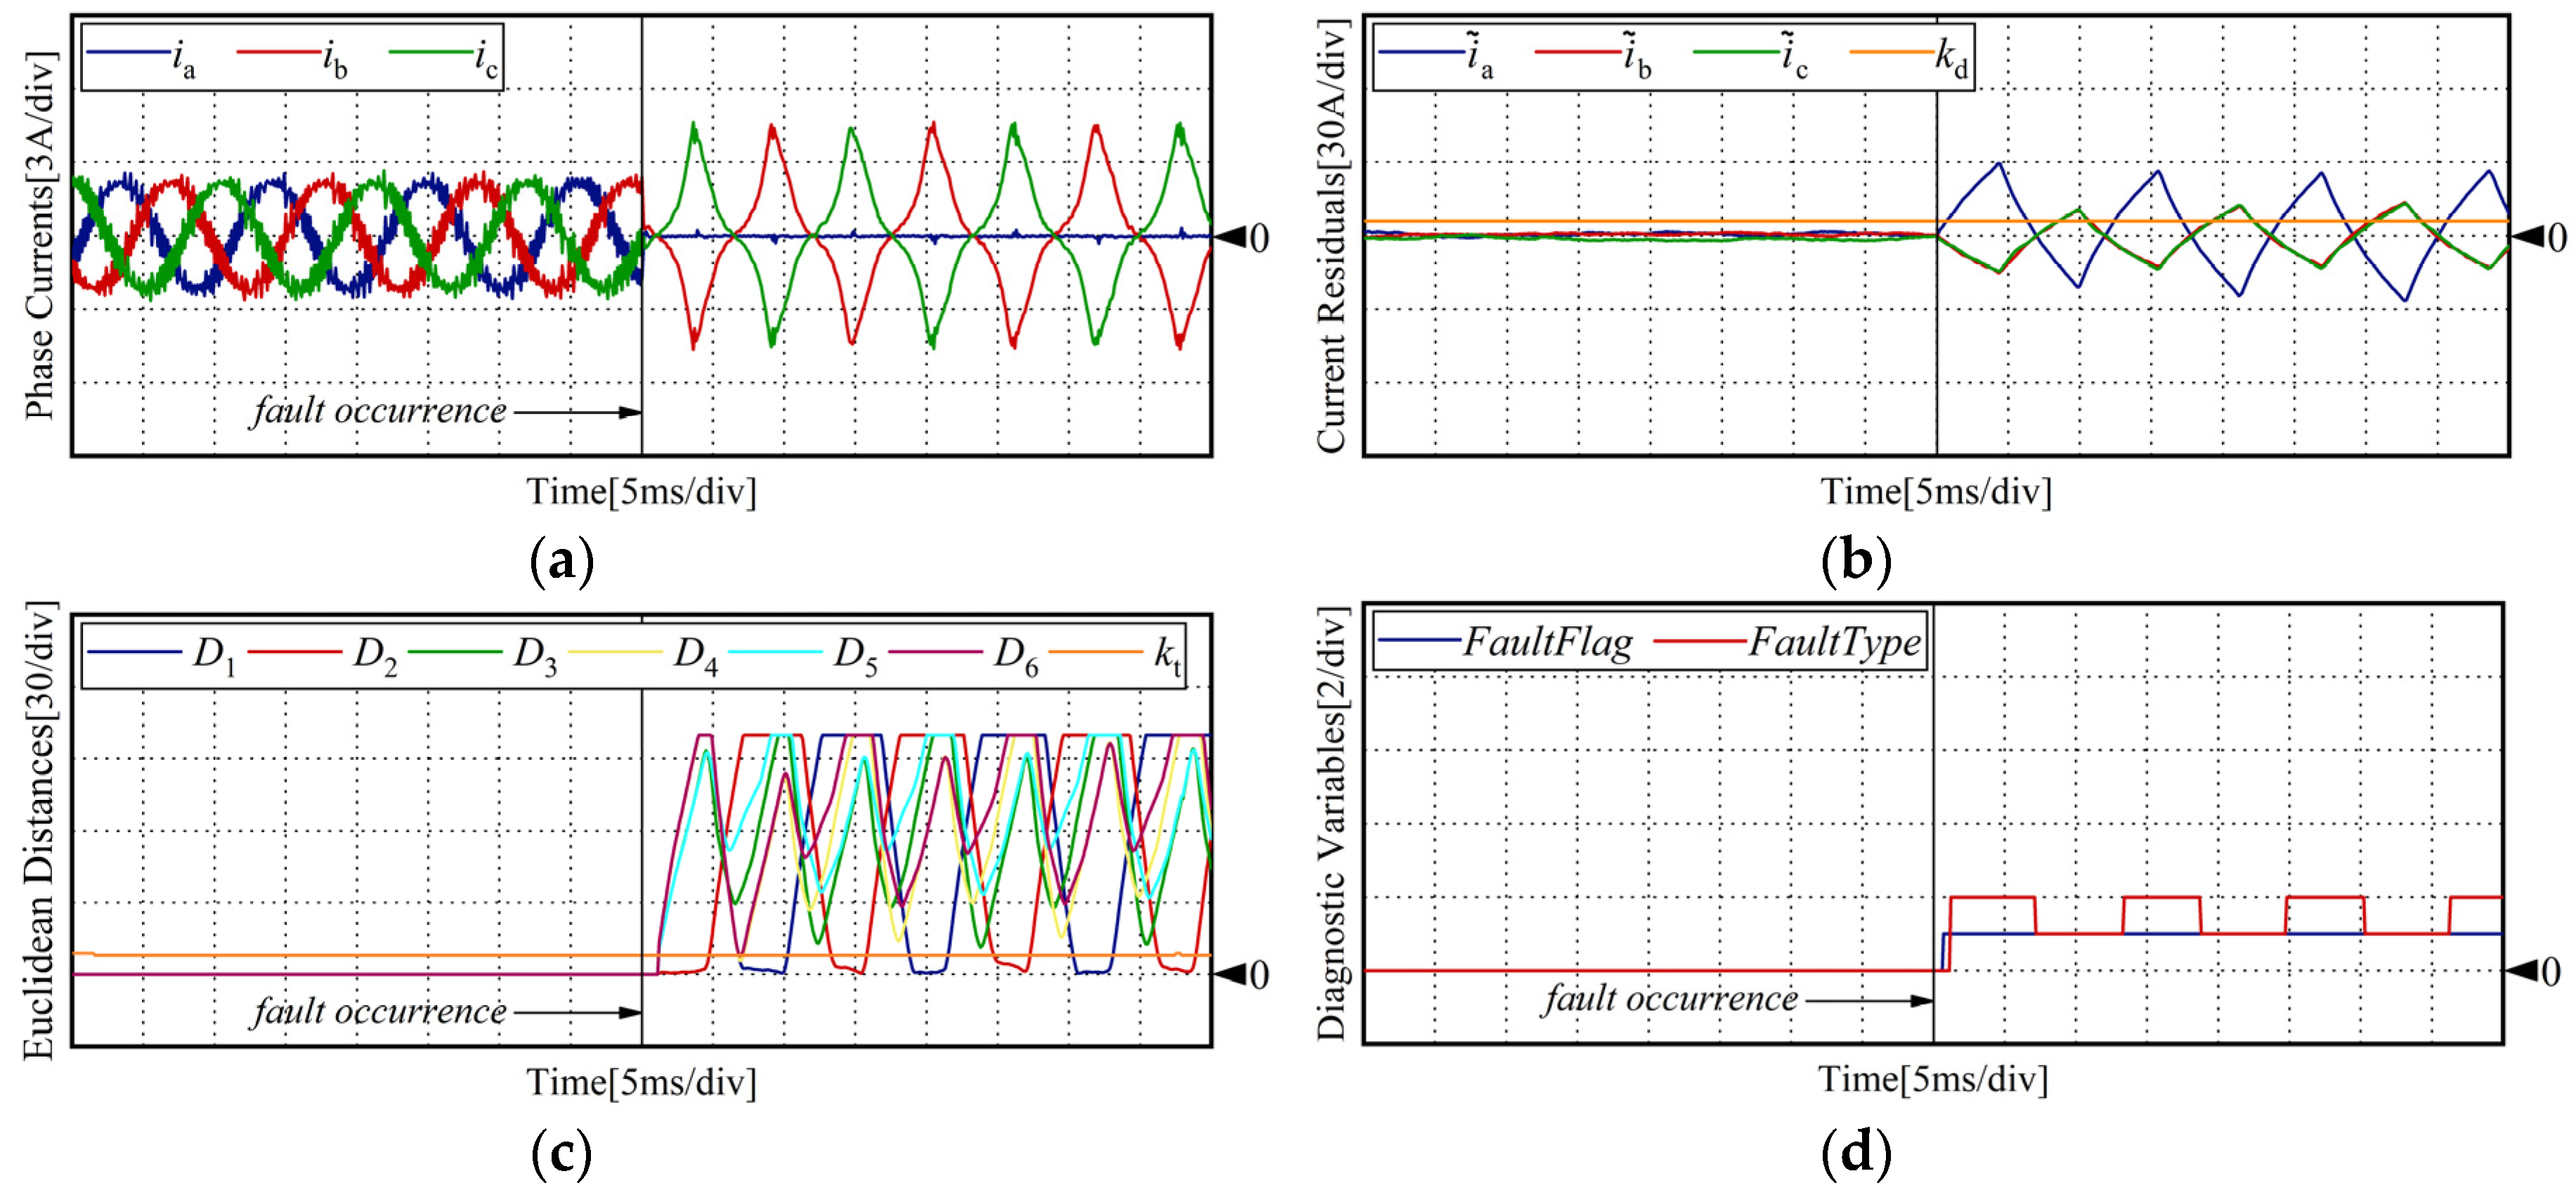
The time-domain waveforms of the motor phase currents together with the Euclidean distances and diagnostic variables for the OC fault by considering a reference speed of 800 r/min with 2 N·m load are shown in Figure 14 and Figure 15. Figure 14 shows the performance of the fault detection and isolation in the case of a lower switch OC fault; the fault occurred in the switch T2. Figure 15 shows the performance in the case of a phase OC fault in leg B. From these experimental results, the Euclidean distances and the fault output variables were all equal to zero under healthy conditions. When an OC fault occurred in the inverter, the motor three-phase currents were no longer sinusoidal and balanced, and the fault flag variable F a u l t F l a g changed to 1. As a result, the Euclidean distances began to change; each time at most one Euclidean distance was less than the preset threshold, and other Euclidean distances were far greater than the threshold, so the faulty switch can be isolated. Regarding the fault diagnosis time in the experiment, the obtained results show that the inverter’s abnormal operation was detected within 0.7 ms after the OC fault occurrence, which is about 3.73% of the current fundamental wave period, and the faulty switch can be correctly isolated in 1.50 ms, which is 8% of the current fundamental wave period.
Figure 16 and Figure 17 show the time-domain waveforms of the motor phase currents together with the Euclidean distances and diagnostic variables for the OC fault by considering a reference speed of 1400 r/min with 2 N·m load. Figure 16 shows the test results for an upper switch OC fault; the fault occurred in the switch T5. Figure 17 shows that in the case of a phase OC fault in the leg A. Similarly to the previous cases, under normal operating conditions, the Euclidean distances and the fault output variables wer all equal to zero values, and the faulty switch could be quickly detected and isolated by the proposed algorithm after an OC fault occurred. In this case, the fault detection time was about 0.5 ms, which is about 4.67% of the current fundamental wave period, and the isolation time was about 1.1 ms, which is about 10.27% of the current fundamental wave period.
The comparison of the proposed method and previous current-based methods is summarized in Table 7 in terms of diagnosis time, robustness (independence to transient disturbance, such as load fluctuation and variable speed), tuning effort (whether the threshold values are easy to select) and fault type (single fault, double fault or both). In this table, T m is defined to represent a current fundamental wave period. As can be seen in this table, compared with the previous current-based methods, the diagnosis speed is greatly improved.

6. Conclusions

An HSM-based OC fault detection and isolation method of three-phase VSIs has been proposed in this paper. By analyzing the phase voltage functions under healthy conditions and different OC fault conditions, the HSM of the PMSM-inverter system was established. The model can accurately estimate the real-time states of the system under different fault conditions. Therefore, it is proposed to use the HSM to generate fault data of different fault types online, and the similarity between each simulated fault type and actual fault type will be evaluated based on the Euclidean distance method; then the fault type can be identified according to the distances, so as to implement the fault diagnosis. The proposed method has the features of avoiding the use of extra sensors, high robustness, reliability against parameter mismatching and independence from the abrupt variations of speed and load. In addition, the fault diagnosis can be completed only by using 1/20 cycle current information, which can improve the diagnosis speed and reduce the computational load. Simulation and experimental results show that the proposed method performs fast diagnoses, compared with other current-based fault diagnosis methods; the presented algorithm significantly reduces the diagnosis time; and the method can complete fault detection and location within a time interval about 5% and 10% of the current fundamental wave period, respectively.

Author Contributions

Conceptualization, T.C. and Y.P.; methodology, T.C. and Y.P.; software, T.C. and Z.X.; validation, T.C. and Z.X.; formal analysis, T.C. and Y.P.; investigation, Z.X.; resources, T.C. and Z.X.; data curation, T.C.; writing—original draft preparation, T.C. and Z.X.; writing—review and editing, T.C. and Y.P.; visualization, T.C. and Z.X.; supervision, Y.P.; project administration, Y.P.; funding acquisition, Y.P. All authors have read and agreed to the published version of the manuscript.

Funding

This research was funded by the National Key R&D Program of China, grant number 2019YFB1309900.

Acknowledgments

Thanks to all the editors and anonymous reviewers who have worked for this article; due to your help, the level of the paper has been significantly improved.

Conflicts of Interest

The authors declare no conflict of interest.

References

  1. Campos-Delgado, D.U.; Pecina-Sánchez, J.A.; Espinoza-Trejo, D.R.; Román Arce-Santana, E.R. Diagnosis of open-switch faults in variable speed drives by stator current analysis and pattern recognition. IET Electr. Power Appl. 2013, 7, 509–522. [Google Scholar] [CrossRef]
  2. Espinoza-Trejo, D.R.; Campos-Delgado, D.U.; Bossio, G.; Barcenas, E.; Hernandez-Diez, J.E.; Lugo-Cordero, L.F. Fault diagnosis scheme for open-circuit faults in field-oriented control induction motor drives. IET Power Electron. 2013, 6, 869–877. [Google Scholar] [CrossRef]
  3. Lu, B.; Sharma, S.K. A Literature Review of IGBT Fault Diagnostic and Protection Methods for Power Inverters. IEEE Trans. Ind. Appl. 2009, 5, 1770–17779. [Google Scholar]
  4. Estima, J.O.; Marques Cardoso, A.J. A New Algorithm for Real-Time Multiple Open-Circuit Fault Diagnosis in Voltage-Fed PWM Motor Drives by the Reference Current Errors. IEEE Trans. Ind. Electron. 2013, 60, 3496–3505. [Google Scholar] [CrossRef]
  5. Choi, U.; Blaabjerg, F.; Lee, K. Reliability improvement of a T-type three-level inverter with fault-tolerant control strategy. IEEE Trans. Power Electron. 2014, 30, 2660–2673. [Google Scholar] [CrossRef]
  6. Choi, U.; Lee, J.; Blaabjerg, F.; Lee, K. Open-circuit fault diagnosis and fault-tolerant control for a grid-connected NPC inverter. IEEE Trans. Power Electron. 2015, 31, 7234–7247. [Google Scholar] [CrossRef]
  7. Zhou, D.; Li, Y.; Zhao, J.; Wu, F.; Luo, H. An embedded closed-loop fault-tolerant control scheme for nonredundant VSI-fed induction motor drives. IEEE Trans. Power Electron. 2016, 32, 3731–3740. [Google Scholar] [CrossRef]
  8. Nguyen, N.K.; Meinguet, F.; Semail, E.; Kestelyn, X. Fault-tolerant operation of an open-end winding five-phase PMSM drive with short circuit inverter fault. IEEE Trans. Ind. Electron. 2015, 63, 595–605. [Google Scholar] [CrossRef] [Green Version]
  9. Errabelli, R.R.; Mutschler, P. Fault-tolerant voltage source inverter for permanent magnet drives. IEEE Trans. Power Electron. 2011, 27, 500–508. [Google Scholar] [CrossRef]
  10. Peuget, R.; Courtine, S.; Rognon, J. Fault detection and isolation on a PWM inverter by knowledge-based model. IEEE Trans. Ind. Appl. 1998, 34, 1318–1326. [Google Scholar] [CrossRef]
  11. Mendes, A.M.S.; Marques Cardoso, A.J. Voltage source inverter fault diagnosis in variable speed AC drives by the average current Park’s vector approach. In Proceedings of the International Electric Machines and Drives Conference IEEE, Seattle, WA, USA, 9–12 May 1999; pp. 704–706. [Google Scholar]
  12. Sleszynski, W.; Nieznanski, J.; Cichowski, A. Open-transistor fault diagnostics in voltage-source inverters by analyzing the load currents. IEEE Trans. Ind. Electron. 2009, 11, 4681–4688. [Google Scholar] [CrossRef]
  13. Zhang, J.; Chen, Y.; Chen, Z.; Zhou, A. Open-Switch Fault Diagnosis Method in Voltage-Source Inverters Based on Phase Currents. IEEE Access 2019, 7, 63619–63625. [Google Scholar]
  14. Bae, C.J.; Lee, D.C.; Nguyen, T.H. Detection and identification of multiple IGBT open-circuit faults in PWM inverters for AC machine drives. IET Power Electron. 2019, 12, 923–931. [Google Scholar] [CrossRef]
  15. Espinoza-Trejo, D.R.; Campos-Delgado, D.U.; Bárcenas, E.; Martıınez-Loıpez, F.J. Robust fault diagnosis scheme for open-circuit faults in voltage source inverters feeding induction motors by using non-linear proportional-integral observers. IET Power Electron. 2012, 5, 1204–1216. [Google Scholar] [CrossRef]
  16. An, Q.; Sun, L.; Sun, L. Current residual vector-based open-switch fault diagnosis of inverters in PMSM drive systems. IEEE Trans. Power Electron. 2015, 30, 2814–2827. [Google Scholar] [CrossRef]
  17. Yan, H.; Xu, Y.; Zou, J.; Fang, Y.; Cai, F. A novel open-circuit fault diagnosis method for voltage  source  inverters  with  a  single  current  sensor. IEEE Trans. Power Electron. 2018, 33, 8775–8786. [Google Scholar] [CrossRef]
  18. Wu, F.; Zhao, J. A real-time multiple open-circuit fault diagnosis method in voltage-source-inverter fed vector controlled drives. IEEE Trans. Power Electron. 2016, 31, 1425–1437. [Google Scholar] [CrossRef]
  19. De Araujo Ribeiro, R.L.; Jacobina, C.B.; Da Silva, E.R.C.; Lima, A.M.N. Fault detection of open-switch damage in voltage-fed PWM motor drive systems. IEEE Trans. Power Electron. 2003, 18, 587–593. [Google Scholar] [CrossRef]
  20. Karimi, S.; Poure, P.; Saadate, S. Fast power switch failure detection for fault tolerant voltage source inverters using FPGA. IET Power Electron. 2009, 2, 346–354. [Google Scholar] [CrossRef]
  21. Choi, C.; Lee, W. Design and evaluation of voltage measurement-based sectoral diagnosis method for inverter open switch faults of permanent magnet synchronous motor drives. IET Electr. Power Appl. 2012, 6, 526–532. [Google Scholar] [CrossRef]
  22. An, Q.; Sun, L.; Zhao, K.; Sun, L. Switching function model-based fast-diagnostic method of open-switch faults in inverters without sensors. IEEE Trans. Power Electron. 2011, 26, 119–126. [Google Scholar] [CrossRef]
  23. Jung, S.; Park, J.; Kim, H.; Cho, K.; Youn, M. An MRAS-Based Diagnosis of Open-Circuit Fault in PWM Voltage-Source Inverters for PM Synchronous Motor Drive Systems. IEEE Trans. Power Electron. 2013, 28, 2514–2526. [Google Scholar] [CrossRef]
  24. Sobanski, P.; Kaminski, M. Application of artificial neural networks for transistor open-circuit fault diagnosis in three-phase rectifiers. IET Power Electron. 2019, 12, 2189–2200. [Google Scholar] [CrossRef]
  25. Khomfoi, S.; Tolbert, L.M. Fault diagnostic system for a multilevel inverter using a neural network. IEEE Trans. Power Electron. 2007, 22, 1062–1069. [Google Scholar] [CrossRef]
  26. Moosavi, S.S.; Djerdir, A.; Ait-Amirat, Y.; Arab Khaburi, D.; Diaye, A.N. Artificial neural network-based fault diagnosis in the AC–DC converter of the power supply of series hybrid electric vehicle. IET Electr. Syst. Transp. 2016, 6, 96–106. [Google Scholar] [CrossRef]
  27. Cai, B.; Zhao, Y.; Liu, H.; Xie, M. A data-driven fault diagnosis methodology in three-phase inverters for PMSM drive systems. IEEE Trans. Power Electron. 2017, 32, 5590–5600. [Google Scholar] [CrossRef]
  28. Zidani, F.; Diallo, D.; Benbouzid ME, H.; Nait-Said, R. A Fuzzy-Based Approach for the Diagnosis of Fault Modes in a Voltage-Fed PWM Inverter Induction Motor Drive. IEEE Trans. Ind. Electron. 2008, 55, 586–593. [Google Scholar] [CrossRef] [Green Version]
  29. Yan, H.; Xu, Y.; Cai, F.; Zhang, H.; Zhao, W.; Gerada, C. PWM-VSI Fault Diagnosis for a PMSM Drive Based on the Fuzzy Logic Approach. IEEE Trans. Power Electron. 2019, 34, 759–768. [Google Scholar] [CrossRef]
  30. Abdesh, M.; Khan, S.K.; Azizur Rahman, M. A new wavelet based diagnosis and protection of faults in induction motor drives. In Proceedings of the Power Electronics Specialists Conference IEEE, Rhodes, Greece, 15–19 June 2008; pp. 1536–1541. [Google Scholar]
  31. Hu, Z.K.; Gui, W.H.; Yang, C.H.; Deng, P.C.; Ding, S.X. Fault classification method for inverter based on hybrid support vector machines and wavelet analysis. Int. J. Control Autom. Syst. 2011, 9, 797–804. [Google Scholar] [CrossRef]
  32. Masrur, M.A.; Chen, Z.; Murphey, Y. Intelligent diagnosis of open and short circuit faults in electric drive inverters for real-time applications. IET Power Electron. 2010, 3, 279–291. [Google Scholar] [CrossRef]
Figure 1. Typical structure diagram of the PMSM (permanent magnet synchronous motor) drive system.
Electronics 09 01251 g001
Figure 2. The current paths of A-phase under a T1 open-circuit (OC) fault: (a) i a > 0 ; (b) i a 0 .
Electronics 09 01251 g002
Figure 3. Flowchart of the proposed fault diagnosis algorithm.
Electronics 09 01251 g003
Figure 4. Diagnosis for the OC fault of T1 under 2 N·m load and for a reference speed of 1000 r/min: (a) A-phase currents; (b) B-phase currents; (c) C-phase currents; (d) current residuals; (e) Euclidean distances; (f) diagnostic variables.
Electronics 09 01251 g004
Figure 5. Diagnosis for the OC fault of T5 and T6 under 2 N·m load and for a reference speed of 1000 r/min: (a) A-phase currents; (b) B-phase currents; (c) C-phase currents; (d) current residuals; (e) Euclidean distances; (f) diagnostic variables.
Electronics 09 01251 g005aElectronics 09 01251 g005b
Figure 6. Diagnosis for the OC fault of T3 under 1 N·m load and for a reference speed of 10 r/min: (a) A-phase currents; (b) B-phase currents; (c) C-phase currents; (d) current residuals; (e) Euclidean distances; (f) diagnostic variables.
Electronics 09 01251 g006
Figure 7. Diagnosis for the OC fault of T1 under 5 N·m load and for a reference speed of 10 r/min: (a) A-phase currents; (b) B-phase currents; (c) C-phase currents; (d) current residuals; (e) Euclidean distances; (f) diagnostic variables.
Electronics 09 01251 g007
Figure 8. Motor operation in speed variations: (a) Motor speed; (b) A-phase currents; (c) B-phase currents; (d) C-phase currents; (e) current residuals; (f) diagnostic variables.
Electronics 09 01251 g008aElectronics 09 01251 g008b
Figure 9. Motor operation in load variations: (a) motor speed; (b) A-phase currents; (c) B-phase currents; (d) C-phase currents; (e) current residuals; (f) diagnostic variables.
Electronics 09 01251 g009
Figure 10. Diagnostic results of 20% parameter deviations: (a) A-phase currents; (b) B-phase currents; (c) C-phase currents; (d) current residuals; (e) Euclidean distances; (f) diagnostic variables.
Electronics 09 01251 g010
Figure 11. Diagnostic results of 40% parameter deviations: (a) A-phase currents; (b) B-phase currents; (c) C-phase currents; (d) current residuals; (e) Euclidean distances; (f) diagnostic variables.
Electronics 09 01251 g011
Figure 12. Scheme of the experimental setup.
Electronics 09 01251 g012
Figure 13. Photograph of the experimental setup.
Electronics 09 01251 g013
Figure 14. Test for a T2 OC fault at a reference speed of 800 r/min: (a) phase currents; (b) current residuals; (c) Euclidean distances; (d) diagnostic variables.
Electronics 09 01251 g014
Figure 15. Test for B-phase OC fault at a reference speed of 800 r/min. (a) Phase currents. (b) Current residuals. (c) Euclidean distances. (d) Diagnostic variables.
Electronics 09 01251 g015
Figure 16. Test for T5 OC fault at a reference speed of 1400 r/min: (a) phase currents; (b) current residuals; (c) Euclidean distances; (d) diagnostic variables.
Electronics 09 01251 g016
Figure 17. Test for A-phase OC fault at a reference speed of 1400 r/min: (a) phase currents*;. (b) current residuals; (c) Euclidean distances; (d) diagnostic variables.
Electronics 09 01251 g017
Table 1. The relationship between switching states and the winding-to-ground voltages under healthy conditions.
State #S1S2S3S4S5S6uag_NFubg_NFucg_NF
0010101000
101011000Vdc
20110010Vdc0
30110100VdcVdc
4100101Vdc00
5100110Vdc0Vdc
6101001VdcVdc0
7101010VdcVdcVdc
Table 2. The relationship between switching states and phase voltages under healthy conditions.
State #S1S2S3S4S5S6uan_NFubn_NFucn_NF
0010101000
1010110−1/3Vdc−1/3Vdc2/3Vdc
2011001−1/3Vdc2/3Vdc−1/3Vdc
3011010−2/3Vdc1/3Vdc1/3Vdc
41001012/3Vdc−1/3Vdc−1/3Vdc
51001101/3Vdc−2/3Vdc1/3Vdc
61010011/3Vdc1/3Vdc−2/3Vdc
7101010000
Table 3. The relationship between switching states and phase voltages in the case of a T1 OC fault acting on the inverter circuits.
State #S1S2S3S4S5S6 η a uan_T1Fubn_T1Fucn_T1F
40001011000
02/3Vdc−1/3Vdc−1/3Vdc
50001101−1/3Vdc−1/3Vdc2/3Vdc
01/3Vdc−2/3Vdc1/3Vdc
60010011−1/3Vdc2/3Vdc−1/3Vdc
01/3Vdc1/3Vdc−2/3Vdc
70010101−2/3Vdc1/3Vdc1/3Vdc
0000
Table 4. The relationship between switching states and output voltages in the case of a T2 OC fault acting on the inverter circuits.
State #S1S2S3S4S5S6 η a uan_T2Fubn_T2Fucn_T2F
00001011000
02/3Vdc−1/3Vdc−1/3Vdc
10001101−1/3Vdc−1/3Vdc2/3Vdc
01/3Vdc−2/3Vdc1/3Vdc
20010011−1/3Vdc2/3Vdc−1/3Vdc
01/3Vdc1/3Vdc−2/3Vdc
30010101−2/3Vdc1/3Vdc1/3Vdc
0000
Table 5. Proposed fault diagnosis principle.
StateEuclidean DistancesFaulty SwitchesFaultType
Healthy D s > k t   ( s = 1 , 2 , 3 , 4 , 5 , 6 ) No0
Faulty D s > k t   ( s = 2 , 3 , 4 , 5 , 6 ) , D 1 < k t T11
D s > k t   ( s = 1 , 3 , 4 , 5 , 6 ) , D 2 < k t T22
D s > k t   ( s = 1 , 2 , 4 , 5 , 6 ) , D 3 < k t T33
D s > k t   ( s = 1 , 2 , 3 , 5 , 6 ) , D 4 < k t T44
D s > k t   ( s = 1 , 2 , 3 , 4 , 6 ) , D 5 < k t T55
D s > k t   ( s = 1 , 2 , 3 , 4 , 5 ) , D 6 < k t T66
D s > k t   ( s = 3 , 4 , 5 , 6 ) , D 1 < k t or D 2 < k t T1, T21, 2
D s > k t   ( s = 1 , 2 , 5 , 6 ) , D 3 < k t or D 4 < k t T3, T43, 4
D s > k t   ( s = 1 , 2 , 3 , 4 ) , D 5 < k t or D 6 < k t T5, T65, 6
Table 6. Main parameters of the test PMSM.
ParametersValue
Rated power (PN)1.5 kW
Rated torque (TN)6.0 N·m
Rated current (IN)6.0 A
Number of pole pairs (p)4
Stator phase resistance (Rs)1.21 Ω
d-axis inductance (Ld)12.5 mH
q-axis inductance (Lq)12.5 mH
Back electromotive force coefficient (Ke)65 V/krpm
Moment of inertia (J)1.26 × 10⁻³ kg·m2
Table 7. Comparison of fault diagnoses between previous current-based methods and the proposed method.
Fault Diagnosis MethodDiagnosis TimeRobustnessTuning EffortFault Type
Park’s vector method [11]about 2 Tmlowhighsingle
Normalized line-to-line current method [14]<Tmhighhighsingle and multiple
Non-linear proportional-integral observer method [15]<1.5 Tmhighlowsingle
Current residual vector method [16]<1/4Tmhighlowsingle and part of multiple
Zero voltage vector sampling method [17]about Tmhighlowsingle and part of multiple
Allelic point function method [18]about 1/4 Tmhighmediumsingle and multiple
Proposed methodabout 1/10 Tmhighlowsingle and part of multiple