Article

A Security Monitoring Framework for Mobile Devices

Department of Informatics Engineering, University of Coimbra, 3030-290 Coimbra, Portugal
*
Author to whom correspondence should be addressed.
Electronics 2020, 9(8), 1197; https://doi.org/10.3390/electronics9081197
Submission received: 19 May 2020 / Revised: 9 July 2020 / Accepted: 17 July 2020 / Published: 25 July 2020
(This article belongs to the Section Computer Science & Engineering)

Abstract

:
Quite often, organizations are confronted with the burden of managing mobile device assets, requiring control over installed applications, security, usage profiles or customization options. From this perspective, the emergence of the Bring Your Own Device (BYOD) trend has aggravated the situation, making it difficult to achieve an adequate balance between corporate regulations, freedom of usage and device heterogeneity. Moreover, device and information protection on mobile ecosystems are quite different from securing other device assets such as laptops or desktops, due to their specific characteristics and limitations—quite often, the resource overhead associated with specific security mechanisms is more important for mobile devices than conventional computing platforms, as the former frequently have comparatively less computing capabilities and more strict power management policies. This paper presents an intrusion and anomaly detection framework specifically designed for managed mobile device ecosystems, that is able to integrate into mobile device and management frameworks for complementing conventional intrusion detection systems. In addition to presenting the reference architecture for the proposed framework, several implementation aspects are also analyzed, based on the lessons learned from developing a proof-of-concept prototype that was used for validation purposes.

1. Introduction

Mobile devices such as tablets and smartphones have evolved considerably over the past several years, both in terms of computing power and capabilities. Along with the emergence of a plethora of novel uses and applications, mobile devices are taking upon most tasks that are usually related with mobility, sometimes even replacing stationary devices such as desktop computers. Consequently, as users increasingly trust them to assist their daily leisure and work routines, the amount of information produced and handled by such devices keeps increasing. This scenario naturally raises security concerns, since mobile devices are an obvious target for all sorts of malicious activities, such as information exfiltration, wiretapping, and trojan infections.
Those security risks are common to both personal and professional usage profiles. Corporations now need adequate security mechanisms for their devices and for the devices privately owned by employees but still used for professional activities—in line with the Bring Your Own Device (BYOD) [1] paradigm, which extends the possibilities of personal mobile device, but leads to issues regarding the management of security by corporations [2].
In order to address those security concerns, enterprise-level security platforms naturally started enlarging their perimeter, in order to properly encompass mobile device assets. However, conventional intrusion detection mechanisms, designed for devices such as servers, laptops and desktops, often fail to cope with the specific requirements of mobile devices, such as their intrinsic mobility and constrained resources (network, energy, computing power, and storage).
In this paper we present an intrusion and anomaly detection framework designed for mobile devices. More specifically, this framework supports the implementation of anomaly detection mechanisms in mobile device ecosystems, in a way that is complementary to classic intrusion detection techniques, providing the means to incorporate user behaviour data, resource optimization and multi-device analysis in the specific context of mobile devices. The scope of the proposed solution is mostly complementary to existing Mobile Device Management (MDM) frameworks, which it does not intend to replace, despite the fact that some evidence and feature-acquisition capabilities could be implemented using existing MDM Application Programming Interfaces (APIs). This paper further documents the efforts undertaken since the original inception of the concept [3], especially in terms of the implementation of a prototype.
The remaining of the paper is structured accordingly with the rationale next presented. Section 2 discusses the current landscape regarding mobile device security management in corporate environments, with Section 3 presenting the architecture of the proposed framework. Section 4 presents a series of practical considerations regarding a Proof-of-Concept (PoC) implementation of the proposed framework, whose evaluation and validation is discussed in Section 5, and Section 6 concludes the paper.

2. State-of-the-Art

In this section we start with an overview of the current landscape regarding mobile device security management in corporate environments, in order to contextualize the key drivers for the proposed framework. Next, we discuss the specific problem of event processing in the scope of this type of ecosystems.

2.1. Mobile Device Security Management and Monitoring

Mobile security solutions have appeared first in corporate environments, where the security risks justify the costs of deploying and managing such solutions, and where users are naturally more prone to accept a certain degree of centralized control over their mobile devices. Although some of the features of those security frameworks eventually made their way into general-purpose, consumer-oriented solutions, the corporate market clearly has a wider and deeper adoption of such frameworks.
Security is usually part of broader Mobile Device and Application Management (MDAM) platforms, where security is just another aspect of device management. Those platforms allow the management and the remote deployment of applications, configurations, and security policies on fleets of corporate mobile devices [4].
MDAM platforms are provided mainly by device manufacturers and major application stores (e.g., Samsung KNOX [5], Apple Business [6], Android Enterprise [7], Microsoft Intune [8]), although there are also a few independent specialized solutions, such as Flyve MDM [9]. Usually, these platforms provide features such as secure boot, profile isolation (e.g., separation between work and personal profiles), deployment and enforcement of enterprise-defined security policies, control of deployed applications by means of dedicated app stores, device monitoring, remote data wipe (e.g., in case of device theft), and secure execution. Specifically, the key features for each platform can be summarized as follows:
  • Android for Work/Android Enterprise is a platform that builds on several management and profile isolation features that are already part of the Android OS. Supported features include managed profiles, remote provisioning of certificates and configurations, and remote device control. Profile isolation implies separating the user’s personal data from the user’s business data through the use of containers. It allows the configuration and enforcement of VPN usage on work profiles, protecting work-related data communications over public/external networks.
  • Apple’s Business Manager platform is built on top of the Device Enrollment Program, which provides the device management features. It is primarily targeted at provisioning and configuring devices for work purposes. It does not support BYOD models, as it was conceived to only support corporate-owned devices, managing settings, applications, and services that the employees can use. It automatically configures the devices as they are switched on for the first time and there is no need for interaction from the user or any kind of enrollment afterwards.
  • Flyve MDM provides several features already present in Android for Work, also providing monitoring capabilities. It is an open-source solution that can be customized to the specific need of an enterprise. Its noteworthy features include the establishment of device groups, secure enrollment, device file deployment, remote control of mobile device features (e.g., Bluetooth, camera, GPS, Wi-Fi), geolocation device logging, and partial or total deletion of data from the device in case of loss or theft.
  • Microsoft Intune is not focused on a single mobile OS platform, offering its services for both Android and iOS mobile devices. Its feature scope is limited to the Microsoft 365 and Microsoft Azure app ecosystem, offering customizable security policies that are defined and enforced for each user, device, app, or groups of any of the prior subsets. It also allows for personal and corporate profile isolation within the same device, as well as exclusively storing data in the cloud.
  • Samsung KNOX is a vendor-specific solution from Samsung, leveraging multiple technologies to enable the BYOD paradigm. It makes use of security containers, which are employed to enable enterprise applications to run in an isolated environment, managed by means of the MDM APIs. It assures trust by supporting secure boot mechanisms and relying on runtime protections that are compliant with ARM (Advanced RISC Machines) TrustZone and SELinux.
An extensive analysis of those MDAM platforms, from a security viewpoint, is provided by [4]. Table 1 summarizes their security-related functionality and features. Overall, it can be said that Samsung KNOX has many security-oriented features lacked by other MDAM solutions because it is a product more focused on security than management, while several other solutions (Android Enterprise, Apple Business, Flyve, Intune) are essentially management solutions with some security features wrapped around specific apps. This concept of enveloping an app in extra layers of security and usage policies is aptly dubbed App Wrapping, and it is widely used in corporate environments. However, as one would imagine, solutions using this concept are often proprietary, more limited in their feature set (mainly restricted to secure email, file storage, and web browsing), being tightly coupled with their internal corporate use, and not marketed, thus making it very difficult to assess and compare them. In contrast, the solutions that we have previously analyzed are more generic (targeting a plethora of apps, users, companies, and devices) and are widely marketed, proving easier to compare and inspect their robustness.
As a side note, it must be referred that mobile device analytics solutions are also available, such as Google Firebase Analytics [10], Yahoo Flurry Analytics [11], Microsoft App Center Analytics [12], or Firebase (originally Fabric) Crashlytics [13]. However, these tools are focused on aspects related to a particular application performance, user retention, user experience, and centralized crash log management; they are not intended for security monitoring of the devices’ contents, two way communications patterns, or resource usage. In short, the ability to log user/device specific/contextual data is not their main focus.
Keeping adequate security levels with the support of conventional MDAM platforms is already a challenging task in traditional corporate ecosystems. Moreover, the growing adoption of BYOD paradigms further hampers such efforts, due to the inherent device heterogeneity and the introduction of hybrid control schemes for mobile devices and applications, filling the spectrum between the traditional “Corporate Owned, Corporate Enabled” (COCE) model for corporate usage and the “Personally Owned, Personally Enables” (POPE) model for personal usage, as summarized in Figure 1.
There are different security requirements for consumer and corporate environments. Consumer security is more focused on threats and attacks related to personal information leakage, such as bank account credentials, credit card fraud, monetary extortion, biometric data, and private images and messages. On the other hand, in corporate environments, where mobile devices are used to perform business or organizational-specific tasks, security is more focused on preventing the leakage of confidential information and malicious actions that can hinder the use of devices.
In BYOD usage contexts, single devices may need to support multiple profiles. BYOD schemes can be classified regarding device ownership and enabling model, as summarized in Table 2. The different types of BYOD schemes commonly available in enterprise environments introduce distinct Mobile Device Management (MDM) policies, which define admissible devices and the type of controls held over them (accessible data, applications, and functionalities). Recently, even large scale companies have begun to move from the COCE scheme to more BYOD friendly alternatives, such as COPE and POCE [14].
The emergence of these usage patterns has prompted organizations to become concerned with security and usage profile-related aspects that are beyond the capabilities provided by conventional MDM tools. This calls for an alternative or, at least, complementary approach to deal with such needs. In this line, the framework hereby proposed provides intrusion and anomaly detection capabilities for groups of (possibly heterogeneous) mobile devices. It may complement classic MDAM platforms—by adding enhanced Intrusion Detection System (IDS) capabilities—or work as a standalone IDS system independently operated.

2.2. Event Processing in the Scope of Mobile Device Security

In the last several years, potentiated by the advances in the Artificial Intelligence domain, and as a result of the ever-growing complexity of mobile security threats, several authors proposed different techniques to perform anomaly detection in mobile devices [15,16,17,18,19,20]. Most of these proposals work at device-level and employ signatures or machine-learning approaches as a way to detect different categories of malware applications, based on API calls, network traffic or app properties and permissions. Nevertheless, only a few of the surveyed research works focus on the practical discussion and implementation of how such features can be collected and analysed in real-time.
Another observed trend is the usage of lightweight machine-learning frameworks, such as TensorFlow Lite [21], as a way to incorporate the analytics component directly on the mobile device [22,23]. Whereas this approach can be suitable for simple scenarios, it is still restricted by the limited capabilities of a mobile device (when compared to a dedicated computing server). Moreover, it does not cover complex, large scale, and multi-device scenarios taking advantage of mining multiple sources of data from multiple devices—which can be seen as a Big Data Analytics (BDA) problem. Without aggregating and correlating data from multiple devices, several cross-service and cross-device attacks may go unnoticed. Moreover, it becomes more complex to build forensics repositories for the organizations’ mobile device assets [24].
BDA scenarios are still not widely explored in the specific scope of mobile device security. Nevertheless, at a more general level, different real-time Big Data architectures with potential application in this specific domain have been proposed in the literature, such as the lambda architecture, which incorporates both batch and streaming processing capabilities into a single framework [25], and the kappa architecture, a simpler alternative focused only on the streaming part [26].
Both approaches have pros and cons [27,28]. The lambda architecture considers two processing schemes which are specially useful when we have distinct algorithms with different requirements that can be further optimized (heavy processing algorithms vs. low-latency computations). The batch layer is also beneficial for re-computing large amounts of historical data. Nevertheless, it is often criticized for being a more complex architecture where there is a need to maintain two separate pipelines, often using distinct tools. This is scenario is now changing as more unified APIs and tools emerge (e.g., the Spark dataset APIs already support the representation of datasets as bounded or streaming data). On the other hand, the kappa approach, which does not fit all the use cases, focuses only on the near real-time processing component, considering all the data as an append-only log (the data stream). In this case, the re-computation, when needed (e.g., due to the changes in the application logic) is achieved by reconstructing the original data, which assumes data immutability and relies on the retention period of the data stream itself.
To address that gap, the recently introduced delta architecture [29] intends to unify both batch and stream processing into a single pipeline (instead of two different pipelines, as occurs in the lambda case). The delta architecture, associated with the Delta Lake [30], no longer assumes data immutability, but a multi-hop strategy of data tables which can be successively refined and updated as a result of the computation itself. However, this approach still needs to mature before widespread adoption.
The lambda and kappa architectures have been applied to other domains, such as telecommunications, IoT or smart grids [31,32,33,34], typically resorting to a wide range of popular OSS tools such as Apache Spark, Flink, Kafka, Cassandra or even the SMACK stack [35] as a way of handling massive amounts of data (e.g., network traffic, telemetry data or security events).
Considering the requirements for the framework proposed in this paper, and anticipating the need to collect, correlate and process large amounts of heterogeneous data in a central point, it was decided to pursue an approach based on a lambda architecture, as further detailed in Section 4.3.

3. Proposed Framework

Figure 2 provides a high-level perspective of the proposed IDS for mobile devices, highlighting the following key aspects:
  • Each covered mobile device features a device agent, an application that is responsible for the local monitoring, processing and reporting of relevant device indicators.
  • Mobile devices/agents are organized in clusters. According to the circumstances, these clusters may reflect administrative domains, geographic domains or simply be used for sake of scalability or reliability.
  • Agents collect data regardless of the device state (stand-by or active).
  • Each cluster is integrated by means of a message broker that relays the data published by each device agent to the central aggregator.
  • The central aggregator persists the data sent by the device agents in a database, which feeds the anomaly detection tools.
  • The central aggregator creates visual representations of the data received from the device agents, as well as the output from the analysis component, to be shown in a monitoring and management dashboard.

3.1. Device Agent

This subsection details the architecture of the device agent, which is based on an OS-neutral framework. Nevertheless, for the sake of readability, some technical details hereby presented directly relate with the PoC that was implemented for Android devices.
Device agents are composed of three types of components: collectors, aggregators, and the data publisher (cf. Figure 3).
The collectors are in charge of collecting data generated by the device, handling the specifics of dealing with its acquisition, handling and storage, accordingly with the nature of the data source (hence the reason for different types of collectors). The aggregators’ role is to consolidate measurements in order to produce compact reports, both for eventful and periodic data sources. The data publishing component sends the reports generated by the aggregators to a Message Broker.
Each collector incorporates an IntentService and a BroadcastReceiver component. The BroadcastReceiver is used to listen for events whose reception will trigger a matching action in the IntentService, which is in charge of handling them. Aggregators are very similar in structure to collectors, sharing the same event-driven scheduling approach.

3.2. Device/Agent Management

Device agents are controlled by a remote device management server that allows for remote (and possibly automated) asynchronous configuration operations. Figure 4 illustrates how the device management server interacts with the managed mobile devices and with the administration dashboard. The following key operations are supported:
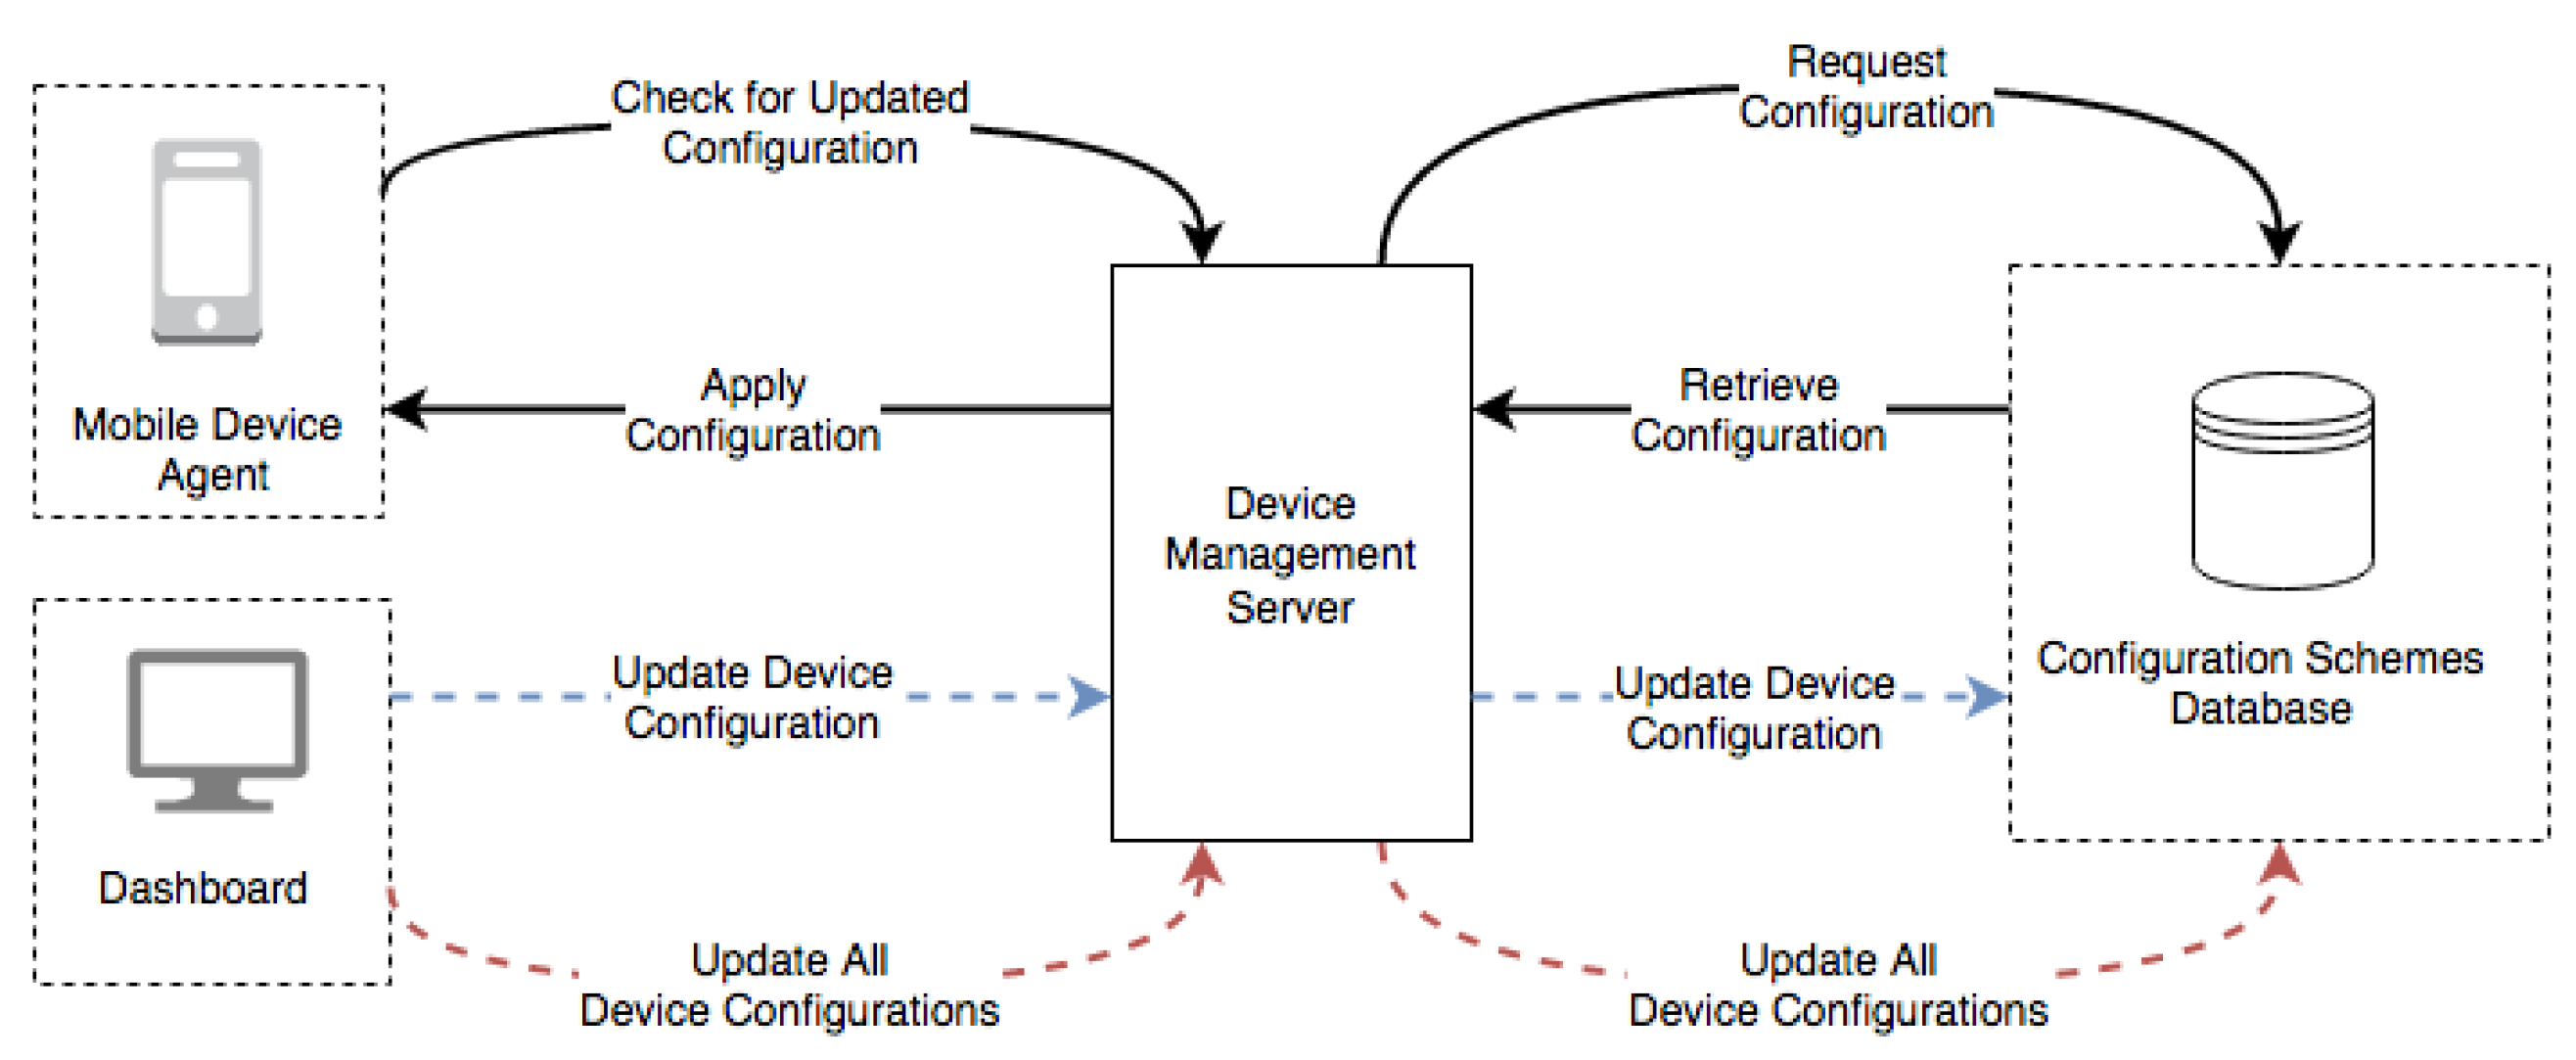
  • Device agents check for configurations changes in the Device Management Server.
  • The Device management server is able to query the configurations for a particular device agent.
  • The device management server may push new configurations to a specific device agent.
  • Via the dashboard UI, the platform administrator may alter the configurations for a specific device, via the device management server.
  • The administrator can perform bulk configuration updates for all devices.

4. Implementation

In this section we discuss several noteworthy aspects related with the challenge of implementing the proposed framework, based on our experience with the development of the proof-of-concept (PoC) prototype. While the proposed framework is platform-agnostic, the PoC was developed for the Android ecosystem, and therefore several technical choices discussed in this section directly derive from this target environment.

4.1. Device Agent

The agents are components which are deployed on Android devices and implemented as applications, whose purpose is to take care of the data collection and pre-processing (for instance, performing data aggregation), before sending it to an external analysis layer.

4.1.1. Collection

Concerning the acquisition of relevant telemetry features, the types of data that are collected can be split between two categories: Application Level and Device Level, according to the following criteria:
  • Application Level: Install/update/remove, RAM, CPU, permission list.
  • Device Level: Base station association status, GPS (optional), RAM and CPU usage, charging state, battery, connected network (WiFi/cellular data), data traffic (optional), open ports.
These different data sources will have distinct sampling rates, which need to be experimentally fine-tuned. Additionally, it should be noted that optional parameters are among the most likely battery drainers, requiring careful analysis. It is also worth mentioning that raw network data traffic analysis is only feasible on rooted devices, together with the use of a specific library or the tcpdump utility.
Another way of classifying the different types of acquired data is by grouping them per frequency and trigger category—specifically, if it is triggered by a recurring/scheduled event, an action that can repeat frequently, or an action that can only happen once.
  • Periodic: CPU, RAM, CPU usage, RAM usage, GPS, battery, open ports, data traffic.
  • Eventful: Base station connection/disconnection, charging state, time and timezone changes, network (WiFi/3G) connectivity status, power on/off.
  • One Time: Application permissions list, application install/removal/update.
Most of the acquired data will be used to identify potentially anomalous situations such as abnormal power/CPU usage or data transfer spikes, but also to facilitate the creation of an event timeline for each device agent. Each piece of gathered data is timestamped.

4.1.2. Event Management

In the Android ecosystem there are several ways to schedule background tasks, both at the system and application levels, namely:
  • Service—adequate for short, single-threaded tasks not requiring interaction with an activity.
  • IntentService—adequate for tasks that are more resource-demanding (threads, time, etc.) than regular services, not requiring interaction with UI elements.
  • Handler—these enable sending and processing Message and Runnable objects associated with a thread’s MessageQueue, being capable of managing UI elements in the background.
  • AsyncTask—Asynctasks provide a convenient abstraction for Handler objects, while providing tight coupling with an Activity’s UI thread. Asynctasks are able to interact/update UI components before, after or during task execution.
Most of the aforementioned examples are abstractions for Java thread management mechanisms, providing easily overridden methods for thread management while avoiding most of the security and integrity issues that are usually associated with race conditions, deadlocks, and livelocks.
These threading abstractions distinguish from one another based on the suitable task length, the ability to interact with UI components, and the degree of independence from an activity. For the device agent IntentServices were the preferred option, due to their versatility and UI-decoupled nature.
Besides selecting the appropriate mechanism to support background processing, there is also a requisite for being able to listen for and schedule events. However, an IntentService does not schedule autonomously, requiring resort to helper classes, namely:
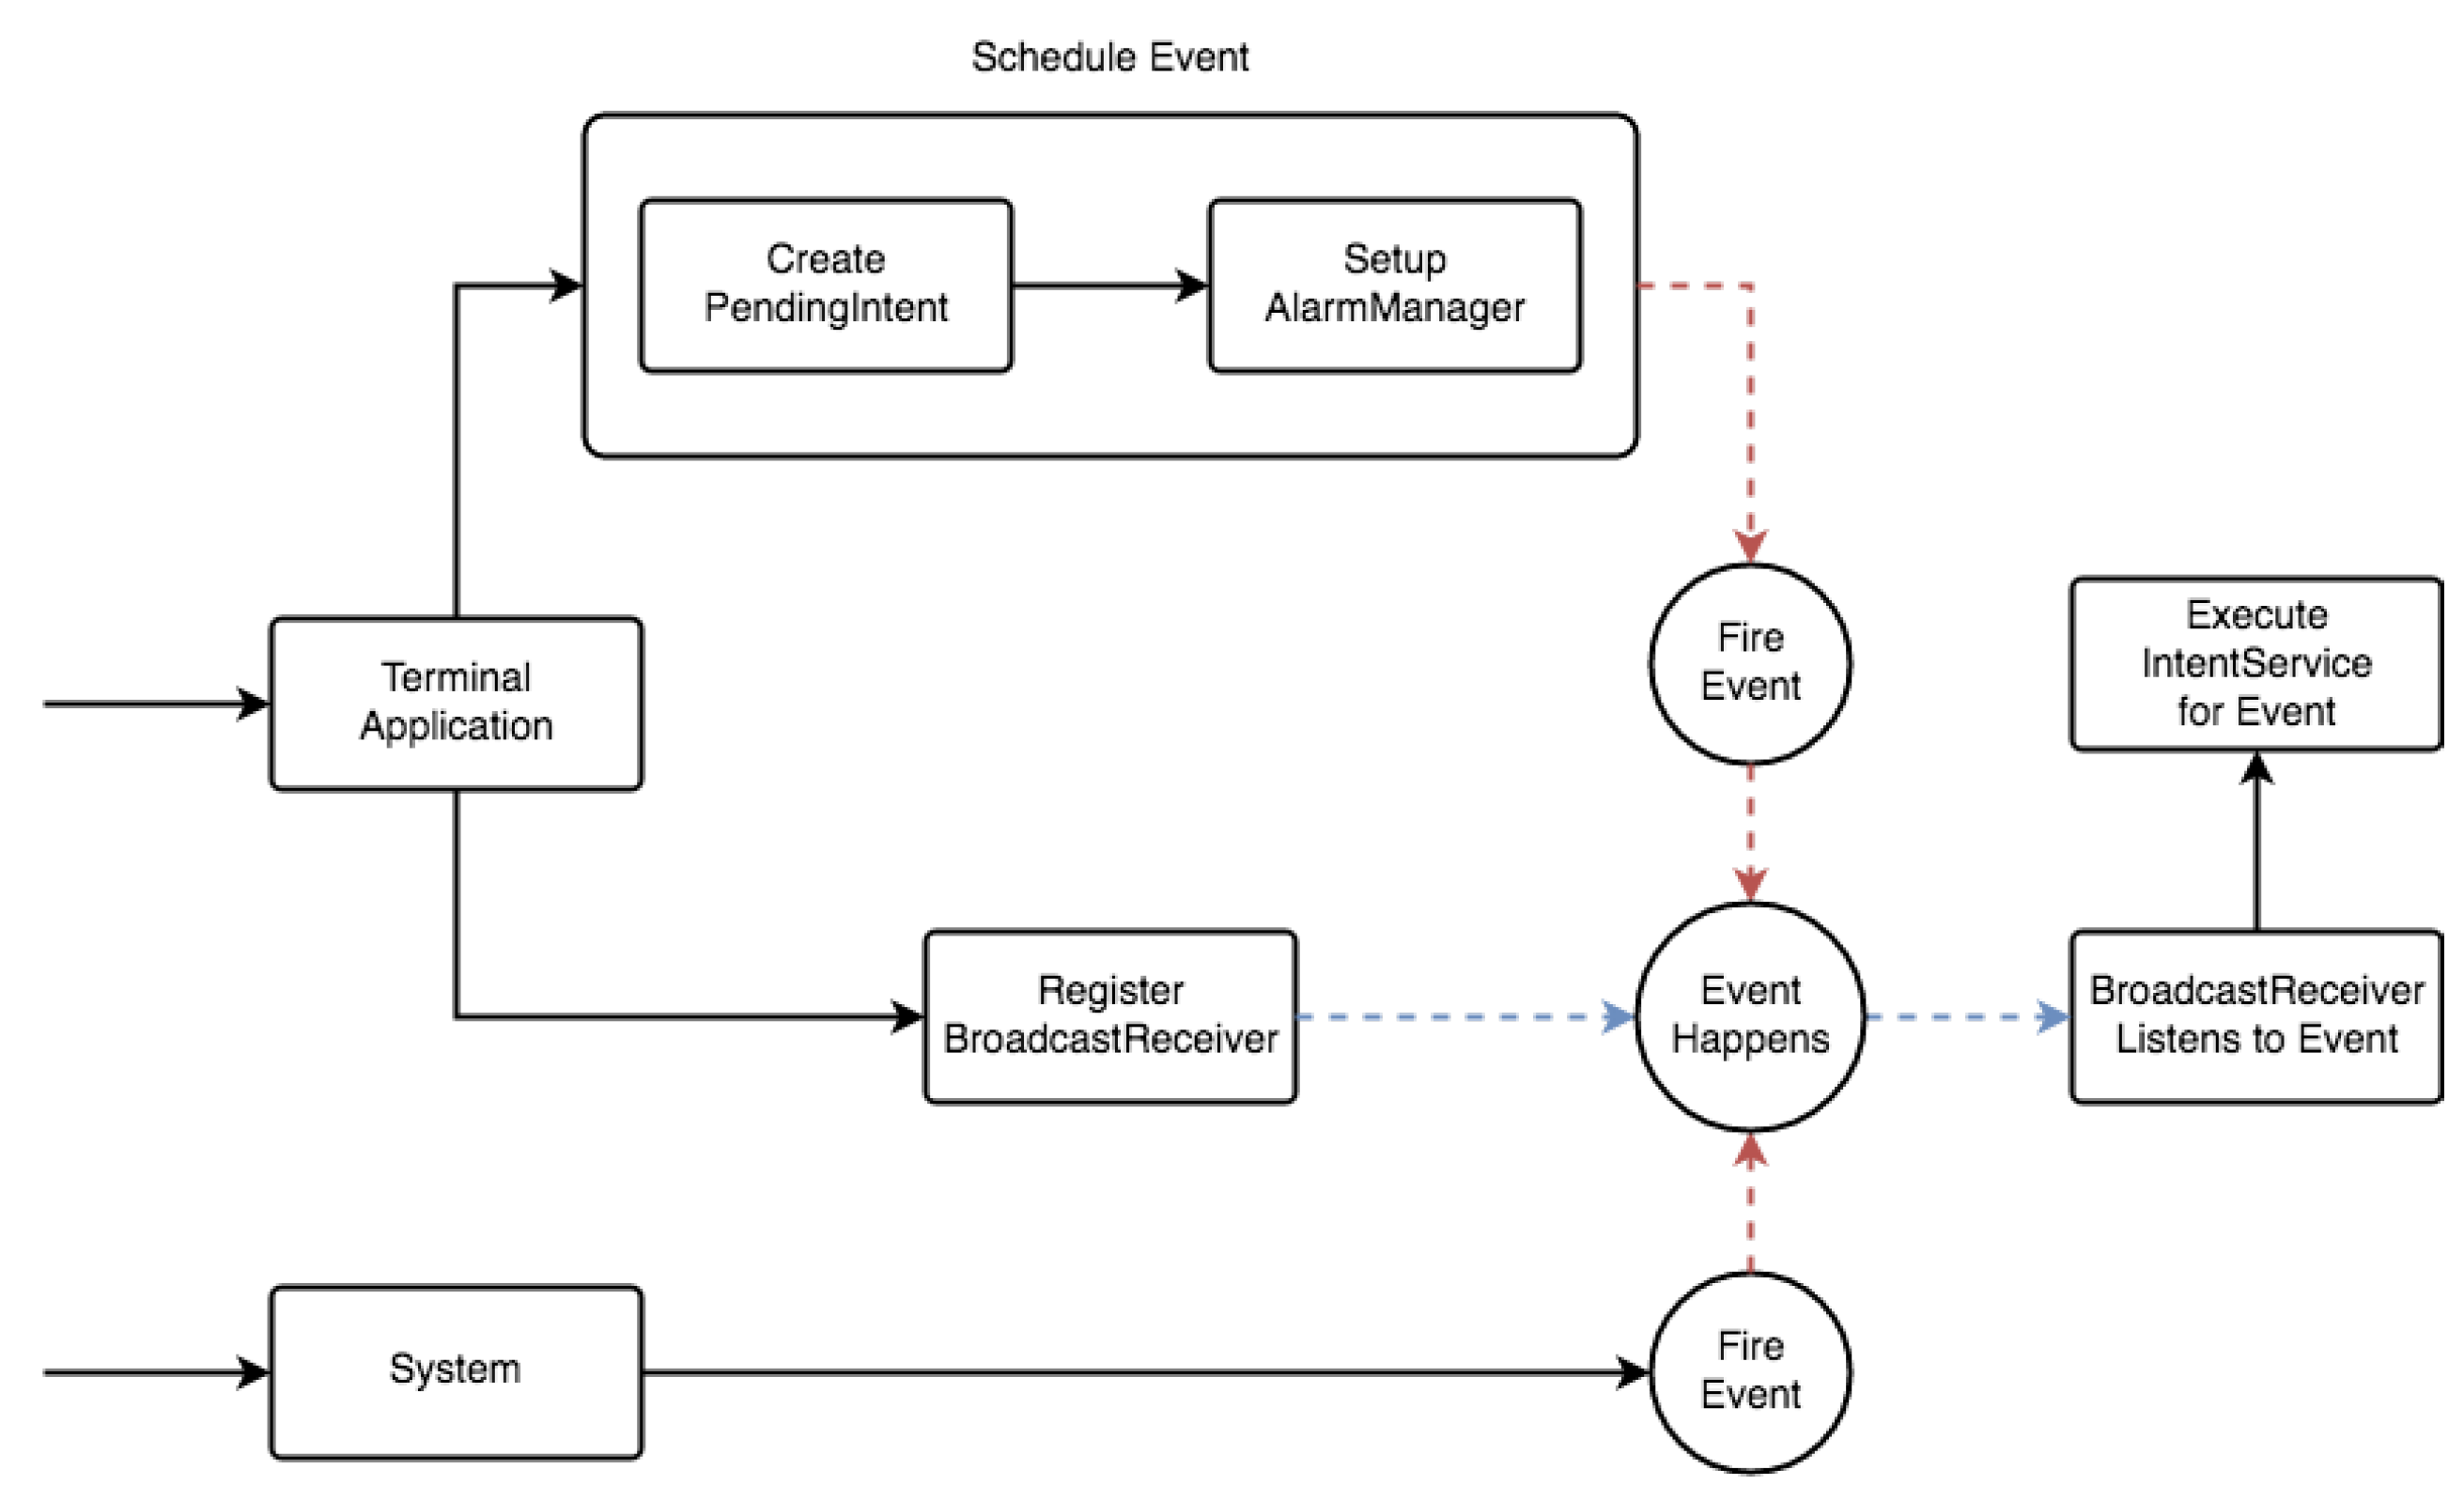
  • Register a BroadcastReceiver for the event type.
  • Listen for type-specific events.
  • Handle the event instance by executing the appropriate IntentService for it.
Events may be generated by the system or applications—for the latter, certain precautions are required, namely:
  • For an event is produced by the device agent:
    • Create a PendingIntent (the event), which will later be triggered and caught by the adequate BroadcastReceiver.
    • Schedule an AlarmManager instance to execute the PendingIntent after an elapsed interval of time.
  • In case the event is system-generated, the system itself takes care of dispatching an Intent, to be received by any BroadcastReceivers registerd for events of its kind.
Figure 5 illustrates the information flow.
It should be pointed out that an AlarmManager re-schedules automatically, except if an execution counter is associated with it. The inexact time measurement mode of the AlarmManager was used, in order to keep resource usage at a minimum, while the agent is running in the background.

4.1.3. Device Agent Configuration Management within MQTT

As previously referred, the central aggregator not only receives the data from the agents, but it is also able to manage them. In order to push configuration updates to the device agents ConfigurationMessage, objects are serialized and published to the MQTT broker, allowing for each device agent to retrieve its updated configurations under the Configurations/<device_ID> topic.
The frequency for periodic data aggregation can be modified by means of a JSON-encoded ConfigurationMessage, sent to a specific device agent update subtopic. This message can carry several configuration attributes for device agents, namely:

Device Agent Configurations: Periodic Collection Actions (Configuration Name (ACTION_), Default Value (s), Description)

  • RAM, 60 (s), Measure RAM usage
  • CPU, 60 (s), Measure CPU usage
  • GPS, 60 (s), Query GPS location data
  • CPU_USAGE, 10 (s), Measure application CPU usage
  • RAM_USAGE, 10 (s), Measure application RAM usage
  • BATTERY, 300 (s), Measure battery level
  • OPEN_PORTS, 60 (s), Gather which ports are open for communications
  • OPEN_DATA_TRAFFIC, 300 (s), Measure total amount of data received and sent by device (in bytes)

Device Agent Configurations: Other Actions (Configuration Name (ACTION_), Default Value (s), Description)

  • AGGREGATE_PERIODIC_DATA, 1800 (s), Aggregate the collected periodic data
  • AGGREGATE_EVENTFUL_DATA, 1800 (s), Aggregate the collected eventful data
  • PUBLISH_DATA, 3600 (s), Send the collected data to the MQTT server
  • UPDATE_CONFIGURATIONS, 3600 (s), Check for updated configurations sent from the MQTT server

Device Agent Configurations: Messaging (Configuration Name (MESSAGING_), Default Value, Description)

  • MQTT_TIMEOUT, 10 (s), Timeout value for a network connection to the MQTT server to be established
  • MQTT_KEEP_ALIVE, 10 (s), The maximum interval for periodic MQTT keepalive messages, sent or received
  • SERVER_PROTOCOL, tcp, Protocol used to communicate with the MQTT server
  • SERVER_URI, MQTT server’s URI or IP address
  • SERVER_PORT, MQTT server TCP port
  • SERVER_BASE_PUBLISH_TOPIC, “OryxInput”, MQTT topic used to publish the data collected from a device
  • SERVER_BASE_UPDATE_TOPIC, “Configurations”, subscribed MQTT topic for device agent configuration updates
  • SERVER_PASSWORD, MQTT server password
Figure 6 depicts the configuration and alarm update procedure (for periodic operations), which is coherent with the event management workflow (presented in Figure 5). When starting, the device agent fetches its configurations, scheduling an alarm for each item. One such example is the Update Alarm, which triggers an MQTT server connection to check for configuration updates. When new messages are found, the device agent will apply them—moreover, if an updated parameter is related to an alarm, it will be first cancelled and then rescheduled with the new value.

4.1.4. Aggregation

Besides using shared preferences, there are other approaches for storing information in an Android application, such as embedded SQLite databases or logging. While logging may be a convenient way to retain collected data in files, it may not be the best option, due to the need to perform preprocessing tasks requiring frequent read-modify-write cycles on log files. For this reason it was decided to store acquired data in an SQLite database.
The aim of this aggregation step is to reduce the amount of data that is sent to the central aggregator, combining several records or event instances, captured over a specific time window. For this purpose, diverse indicators of central tendency can be computed from the acquired data, each one being suitable for different purposes:
  • Median—corresponds to the value separating the higher from the lower half, in a series of observations.
  • Geometric mean—often used when comparing different items—finding a single “figure of merit” for these items—when each item has multiple properties that have different numeric ranges
  • Arithmetic mean—it corresponds to the sum of a number list divided by the number of elements in that list.
  • Harmonic mean—it strongly tends toward the least elements of a number list. It has the benefit of (unlike the arithmetic mean) mitigating the effect of large outliers, at the expense of aggravating the effect of small ones.
  • Generalized mean or power mean—a generalized formulation for which the previous alternatives are particular cases. In its generic form it constitutes a non-linear moving average which is shifted towards small or big values depending on its parameter p.
Considering the specific needs of the proposed framework, it was decided to use the median and harmonic means, due to their tendency for providing accurate summaries of data that includes outliers.

4.2. Message Brokers

Message brokers mediate the transport of the information gathered by the device agents, in order to be sent to the analytics layer. These components must provide a scalable, efficient and low-overhead transport mechanism, helping integrate the system components. For this purpose, both a REST/HTTPS API and the MQTT protocol where considered.

4.2.1. Why MQTT

MQTT (Message Queue Telemetry Transport) [36] is a lightweight messaging protocol based on publish-subscribe message queues, conceived for unreliable network connections and humble devices, making it suitable for Internet of Things (IoT) and Machine-to-Machine (M2M) environments. While MQTT does not provide any security to the transport mechanism (due to encryption overhead), it doesn’t prevent it either. For instance, MQTT can be used together with a transport layer security schema, such as Secure Sockets Layer/Transport Layer Security (SSL/TLS).
When used with MQTT, the SSL/TLS provides an asymmetric encryption scheme which is added on top of a symmetric encryption scheme, to protect data exchanges and avoid MITM (man-in-the-middle) attacks, which consist on inserting a malicious third party between two communication endpoints, which is able to read and relay the messages, often having the ability to modify the message’s payload.
Another alternative that was considered was the implementation of a REST (Representative State Transfer) API over HTTPS. A few considerations were taken into account when choosing between MQTT and HTTPS:
  • The use of a REST/HTTPS API would only cover data exchanges. Message ordering, persistence and queue semantics would have to be managed by a separate entitiy: a broker, or enterprise service bus component;
  • Several companies successfully use MQTT for Big Data-related projects involving millions of devices;
  • MQTT allows to adopt one of the several existing open-source MQTT brokers, some of which have adequate scalability characteristics;
  • MQTT is less resource-intensive than a similar service built on HTTPS;
  • The max payload size for MQTT messages is 256 MB, with 65 KB for a topic message, which is perfectly adequate for the purposes of this framework;
Overall, MQTT was eventually selected for usage in the proposed platform, moreover because there is out-of-the-box integration with Apache Spark [37]. Nevertheless, the issue of message encryption had yet to be addressed.

4.2.2. Encryption and Security

Since the MQTT protocol documentation does not standardize encryption mechanisms, it was originally planned to encapsulate agent messages by resorting to an encryption scheme with less overhead than SSL/TLS. This approach intended to strike a balance, by providing message confidentiality and integrity while keeping a modest CPU, memory, and energy consumption footprint.
(Full) Homomorphic encryption [38], was one of the considered alternatives. This is a form of encryption that allows for computation to be directly carried out on the cyphertext, generating an encrypted output whose decryption matches the result of the same operation applied to the plaintext operands. Despite its potential, homomorphic encryption implementations are slow and are likely to remain as such: “In late-2014, a re-implementation of homomorphic evaluation of the AES-encryption circuit using HElib [39], reported evaluation time of just over four minutes on 120 inputs, bringing the amortized per-input time to about 2 s” [39]. As such, it was deemed unsuitable for the proposed framework, due to overhead and speed issues.
As far as security is concerned, there are three different approaches that were considered for the proposed framework, namely:
  • Network level—one solution might be to resort to a physically secure network or Virtual Private Network (VPN) to protect clients-broker communication, providing a secure and trustworthy connection. This could be feasible for scenarios where devices are being used on a remote LAN that is bridged to the broker, over a VPN gateway.
  • Transport level—When the goal is to provide confidentiality, TLS/SSL can be used to provide transport encryption. This approach constitutes a secure and proven way protect communications, which can be reinforced by using certificate-based authentication.
  • Application level—apart from transport-level protection (which is covered by the previous items), the MQTT protocol supports a client identifier and username/password credentials, that can also be used implement application level authentication (however, ACL-style controls are dependent on the specific broker implementation). Moreover, the use of payload encryption on the application level could also be used, providing message confidentiality guarantees, even without full fledged transport encryption.
The two last mechanisms where adopted, adding a hash signature to each message to certify its integrity, allowing the aggregator. While the original rationale considered SSL/TLS overhead a critical factor, practical experience has demonstrated the opposite, mostly due to optimized implementations. Eventually, SSL/TLS handshakes may constitute the only relevant overhead if appropriate session and caching parameters are configured. While the most common implementations of SSL, namely OpenSSL, may be too resource intensive for some hosts, there are faster and lighter alternatives such as wolfSSL, bearSSL or matrixSSL. As of writing, matrixSSL appears to be an interesting open source candidate as it was specifically developed for IoT scenarios.

4.3. Aggregator

As already mentioned, taking into the requirements for the framework proposed in this paper and the need to collect, correlate and process large amounts of heterogeneous data in a central point, the proposed framework follows an an approach based on a lambda architecture.
The platform aggregator deals with data generated from multiple sources, which requires for it to be able to perform analysis of new and previously collected elements. Among the Big Data frameworks that were considered for inclusion in the proposed framework the most notable competitors were Apache Hadoop [40] and Apache Spark [37].
Hadoop is one of the earlier and most popular frameworks to tackle the challenges of Big Data. It is better known for its implementation of MapReduce [41] and its file manager HDFS (Hadoop Distributed File System) [40,42]. It operates by processing data in batches, splitting it into smaller jobs which are spread across a cluster, later combining the results.
Spark constitutes a departure from Hadoop, regarding several aspects, the most obvious ones being the support for in-memory computing, potentially speeding up processing times—also, it doesn’t include file manager capabilities. Spark also provides an alternative to the linear data flow enforced by MapReduce, allowing for a more customizable pipeline.
It should be emphasized that Spark and Hadoop can be used together, allowing for hybrid architectures to be developed and customized for each case. For such reasons, it was decided to employ several Apache technologies, namely HDFS (from Hadoop), and Spark, leveraging the potential of both frameworks.
There are essentially two approaches for Big Data processing: stream and batch processing. Stream processing is used to analyse small chunks of transferred data, usually by resorting to sliding windows moved across data streams, being particularly suited for small, real-time computations. The analysed data must embed timestamps for ordering purposes and adjustment of the timeframe for the sliding window. Batch processing is adequate to process large blocks of data at once, with relaxed restrictions in terms of processing time. This methodology is mostly employed for offline processing of large amounts of data, over extended timeframes.
Overall, it was decided that the central aggregator should support both batch and stream processing. Stream processing would be adopted to provide real-time updated information in the dashboard, maintaining a viable human-in-the-loop architecture providing enough feedback for a human supervisor. Moreover, batch processing will be used for the Machine Learning layer of the central aggregator, analysing the slew of collected data.
This decision to adopt both processing methods corresponds to a lambda architecture pattern [43,44]. As already mentioned in Section 2.2, a lambda architecture encompasses two parallel data processing layers: one for stream processing (fast, real-time) and a batch-processing layer, for larger tasks. Both are connected to a data source layer and a query management layer. This approach attempts at balancing latency and throughput, by exploring the specific benefits of the two data processing strategies. Figure 7 illustrates this concept.
Due to the focus on low-latency reads and updates, several lambda architecture use cases have been proposed in the literature, mainly for data analysis in IoT scenarios [45] or massive social networks such as Twitter [46]. This architectural pattern has a diverse number of applications, which leverage the benefits of a considerable number of available tools and frameworks, as well as the benefits of specific integration approaches.

4.4. Machine Learning (ML)

One of the key advantages of the proposed architecture resides in its capability to identify potential anomalies using Machine Learning. It is no coincidence that Apache Spark was chosen in this project, as it supports MLlib [47], a set of machine learning tools and algorithms, including: dimensionality reduction, classification, regression, recommendation, clustering, topic modeling, and statistics, among others.
MLlib provides a large, diverse and heterogeneous toolset, encouraging experimentation while leaving a comfortable margin for deciding and fine-tuning which is the most effective and relevant subset for the proposed solution.
In its present version, the proposed framework implements the following workflow pipeline:
  • Pre-processing—Before any form of heavy processing or machine learning is used, it might be desirable to sanitize or alter the used data using techniques such as outlier removal, normalization or missing value interpolation. Extra caution is required in this step because, since this is a binary classification problem (anomalous vs. normal), certain unique samples may be crucial for the classification step.
  • Feature selection—Before any form of classification is performed it is important to identify and select which features are relevant, resorting to summary statistics, correlation matrix or average value functions.
  • Feature reduction—The fact that some dataset dimensions may not be relevant for the classification step can hinder the performance of the classifier. As such, principal component analysis (PCA) is used to reduce the number of relevant features used for analysis, using the Kaiser criteria and Scree test to identify the number of considered factors.
  • Classification—Malware strains and other anomalies are constantly changing, posing a serious challenge for signature-based detection methods. For this reason, it makes sense to resort to an unsupervised classification toolbox, using suitable clustering methods such as K-means. After some data has been collected it can be labeled using unsupervised classification and fed through supervised classification methods such as decision trees, SVM, K-Nearest Neighbours or neural network. For this last step, a Triple Modular Redundancy approach will be employed, with the final classification being calculated as the rounded median value of three distinct classification techniques, minimizing misclassification errors.
The diversity of techniques and algorithms supported by Spark/MLib makes the proposed platform an attractive proposition, which can be tailored and adapted to support sophisticated big data analytic pipelines for behaviour profiling or anomaly detection purposes. It should be stressed that the work hereby documented is mainly focused on the implementation of the overall support architecture for the propose framework, instead of addressing in detail specific algorithms and/or techniques.

4.5. Data Visualization

After each analysis process batch is executed (which can use ML tool ensembles and other techniques), immutable graphs are generated for the existing data, enabling the dashboard users to visually grasp the current state of the system, as well as the properties of the data that was collected. In this perspective, there are three fundamental characteristics for the proposed solution:
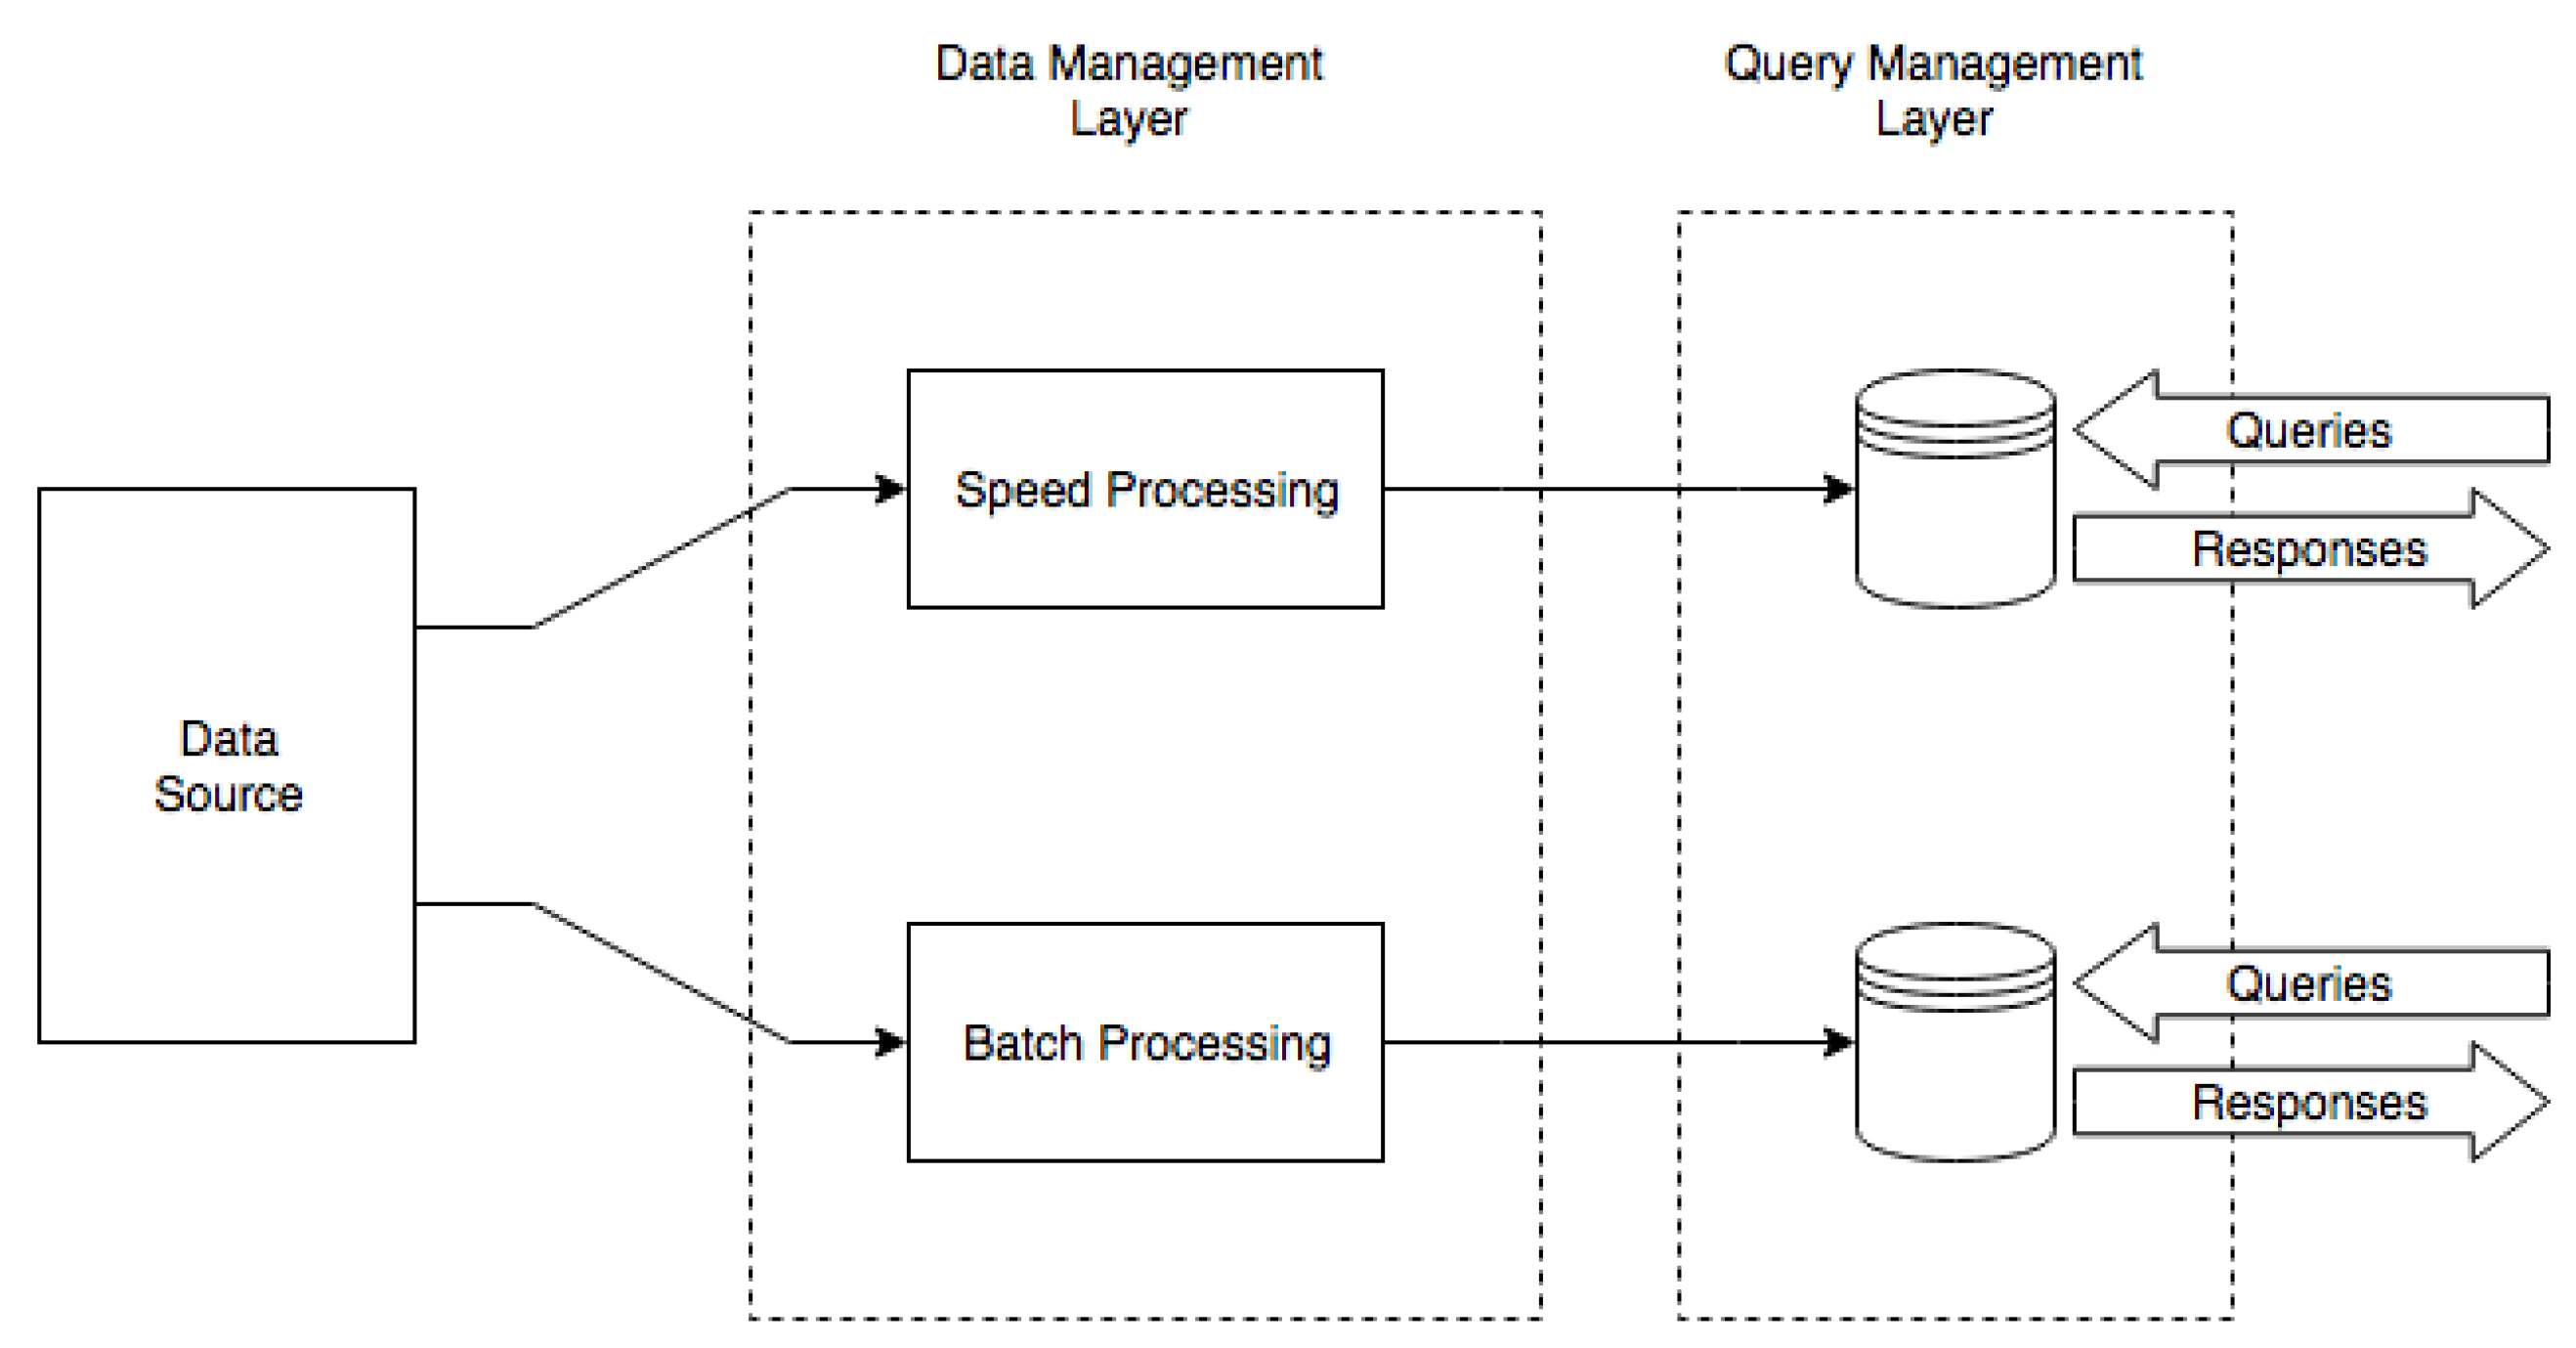
  • Large-scale data collection of device measurements.
  • Frequent and intensive ingestion of collected data.
  • Identification of anomalies based on the acquired data.
Besides the inherent need for timestamping and other attributes, it also becomes evident the need to relate acquired data to specific devices. Since each item is a device message object which contains measurements from a specific device agent, it must be some sort of binding or association between them. It is even possible to move a step further, as each measurement belongs to a type/category—therefore, devices can be associated to their uniquely collected measurements, which in turn are connected to a general telemetry category. Figure 8 is the visual representation of said connections using an undirected weighted graph.
The undirected weighted graph depicted in Figure 8 can be explained as such:
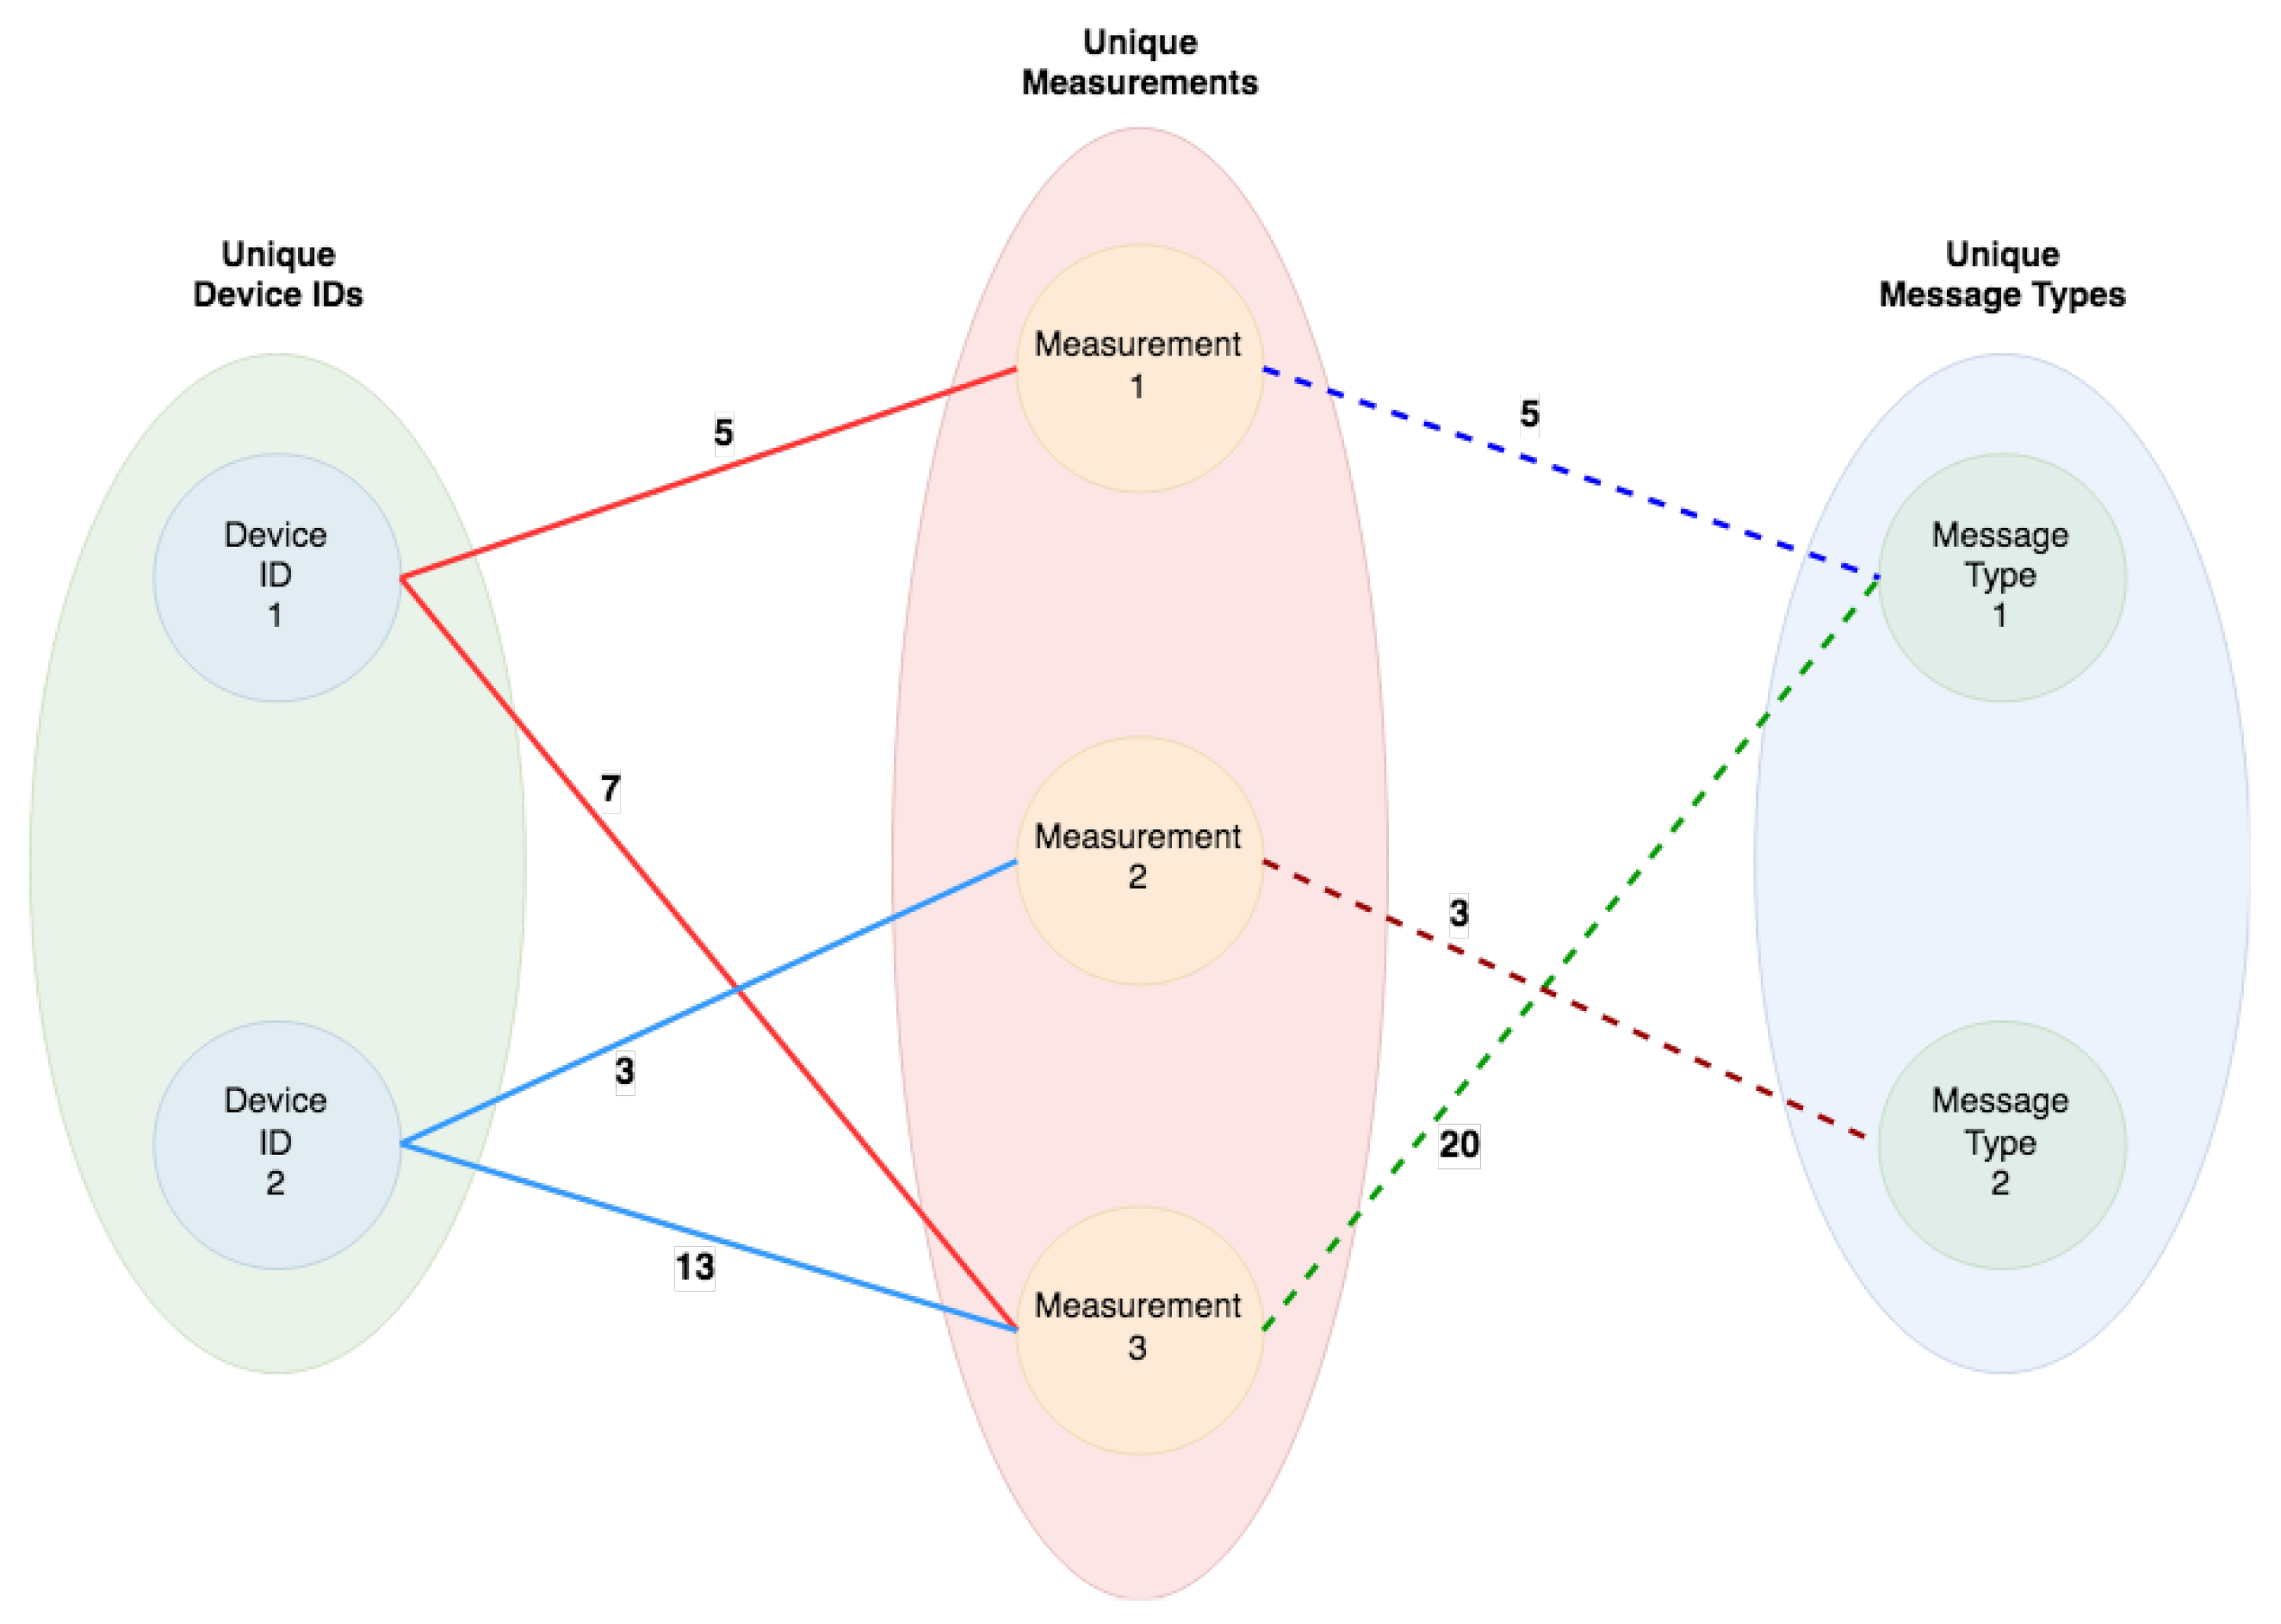
  • There are three node groups, each encompassing a variable number of nodes
  • Each node on the left node group represents a device agent by means of it’s unique device ID
  • Each node on the middle node group represents a unique measurement
  • Each node on the right node group represents a type of message
  • A device agent belonging to the left group is connected to each one of the unique measurements it generated, in the middle group
  • A unique measurement in the middle group is connected to the corresponding category in the right group
  • Each edge between the left and middle node groups has a weight which is equal to the number of measurements recorded for the specific Device ID node
  • Each edge between the middle and right node groups has a weight which is equal to the number of times that specific measurement has been collected in the system
Once the rules to create a device message graph are established, it is now possible to proceed and interpret a hypothetical scenario such as the one in Figure 9.
Figure 9 depicts two distinct devices in this scenario. Device 1 has collected five measurements of Measurement 1 and seven of Measurement 3 over time, whilst Device 2 has collected three measurements of Measurement 2 and 13 of Measurement 3. It can be also confirmed that Measurements 1 and 3 are classified as belonging to Message Type 1 type, of which a count of 5 and 20 measurements have been collected, respectfully. In addition, three measurements of Measurement 2 have been collected in total, belonging to Message Type 2.
The main benefit of this graph-based representation has to do with its convenience, allowing for the quick identification of several characteristics for the acquired data, by inspecting the connections between node groups, such as: is that it lets us quickly identify many aspects of the data by simply inspecting the connections between the node groups, namely:
  • The least frequent measurement
  • The total amount of measurements
  • The most frequent measurement
  • The amount of measurements by type/category
  • The least frequent type of measurement
  • The most frequent type of measurement
  • The amount of measurements collected by each device agent
  • The device agent with the most amount of measurements collected
  • The device agent with the least amount of measurements collected
This specific representation/visualization is considered to improve readability, therefore enabling the end-user to detect any anomalies with more ease.

4.6. Dashboard

Spark entails GraphX, a tool capable of generating immutable graphs for the existing data, which will be used after each Machine Learning process batch is executed. This helps dashboard users analysing the system’s conclusions current state. The purpose of the dashboard is to implement a human-in-the-loop management and result analysis approach, by enabling human operators to interact with the system in real time, with the aim of improving the feedback loop. This can be summarized in Figure 10.
In addition, while some Machine Learning (ML) capabilities may be powerful, quite often direct data analysis can be just as effective while being less expensive, both in terms of resources and time. Necessarily, this mainly depends on the complexity of the inferences or indicators one is searching for. For this purpose, it was decided to monitor several aspects regarding the acquired data, both for each and all users, such as the average, most common, and least common entries.
These metrics might help the Dashboard user to identify compromised devices that the central aggregator ML component has missed, or simply its fine tuning. This approach is named Exploratory Data Analysis (EDA) and its purpose is to suggest hypotheses about the causes of observations, assessing assumptions for statistical inference while supporting the selection of appropriate statistical tools and techniques and providing a basis for further data collection. EDA strives to extract information from data that goes beyond the formal modeling or hypothesis testing tasks, often resorting to visual aids such as plots and graphs to ease the identification of outliers, trends and patterns that might have otherwise gone unnoticed.

5. Testing and Validation

The success of the proposed framework, opposed to the local processing at device level adopted by most of the known previous works, depends on two critical factors: keeping an acceptable overhead at device level (collection, preprocessing and communications); and maintaining a limited impact on the mobile network due to the concentration of the data from multiple devices for aggregation and correlation purposes. As such, in this section we detail the testing and validation process adopted for our PoC. More specifically, we provide an analysis of the overhead induced by the device agent and an estimate of the network traffic generated per device (with the aim of empirically estimating the aggregated network traffic generated in a production scenario with large sets of devices).
The detailed evaluation of specific ML algorithms is outside the scope of this paper, since we are mainly focused on introducing the overall concept and the PoC. A detailed study comparing the performance of several algorithms for the scenarios enabled by our approach is currently underway.

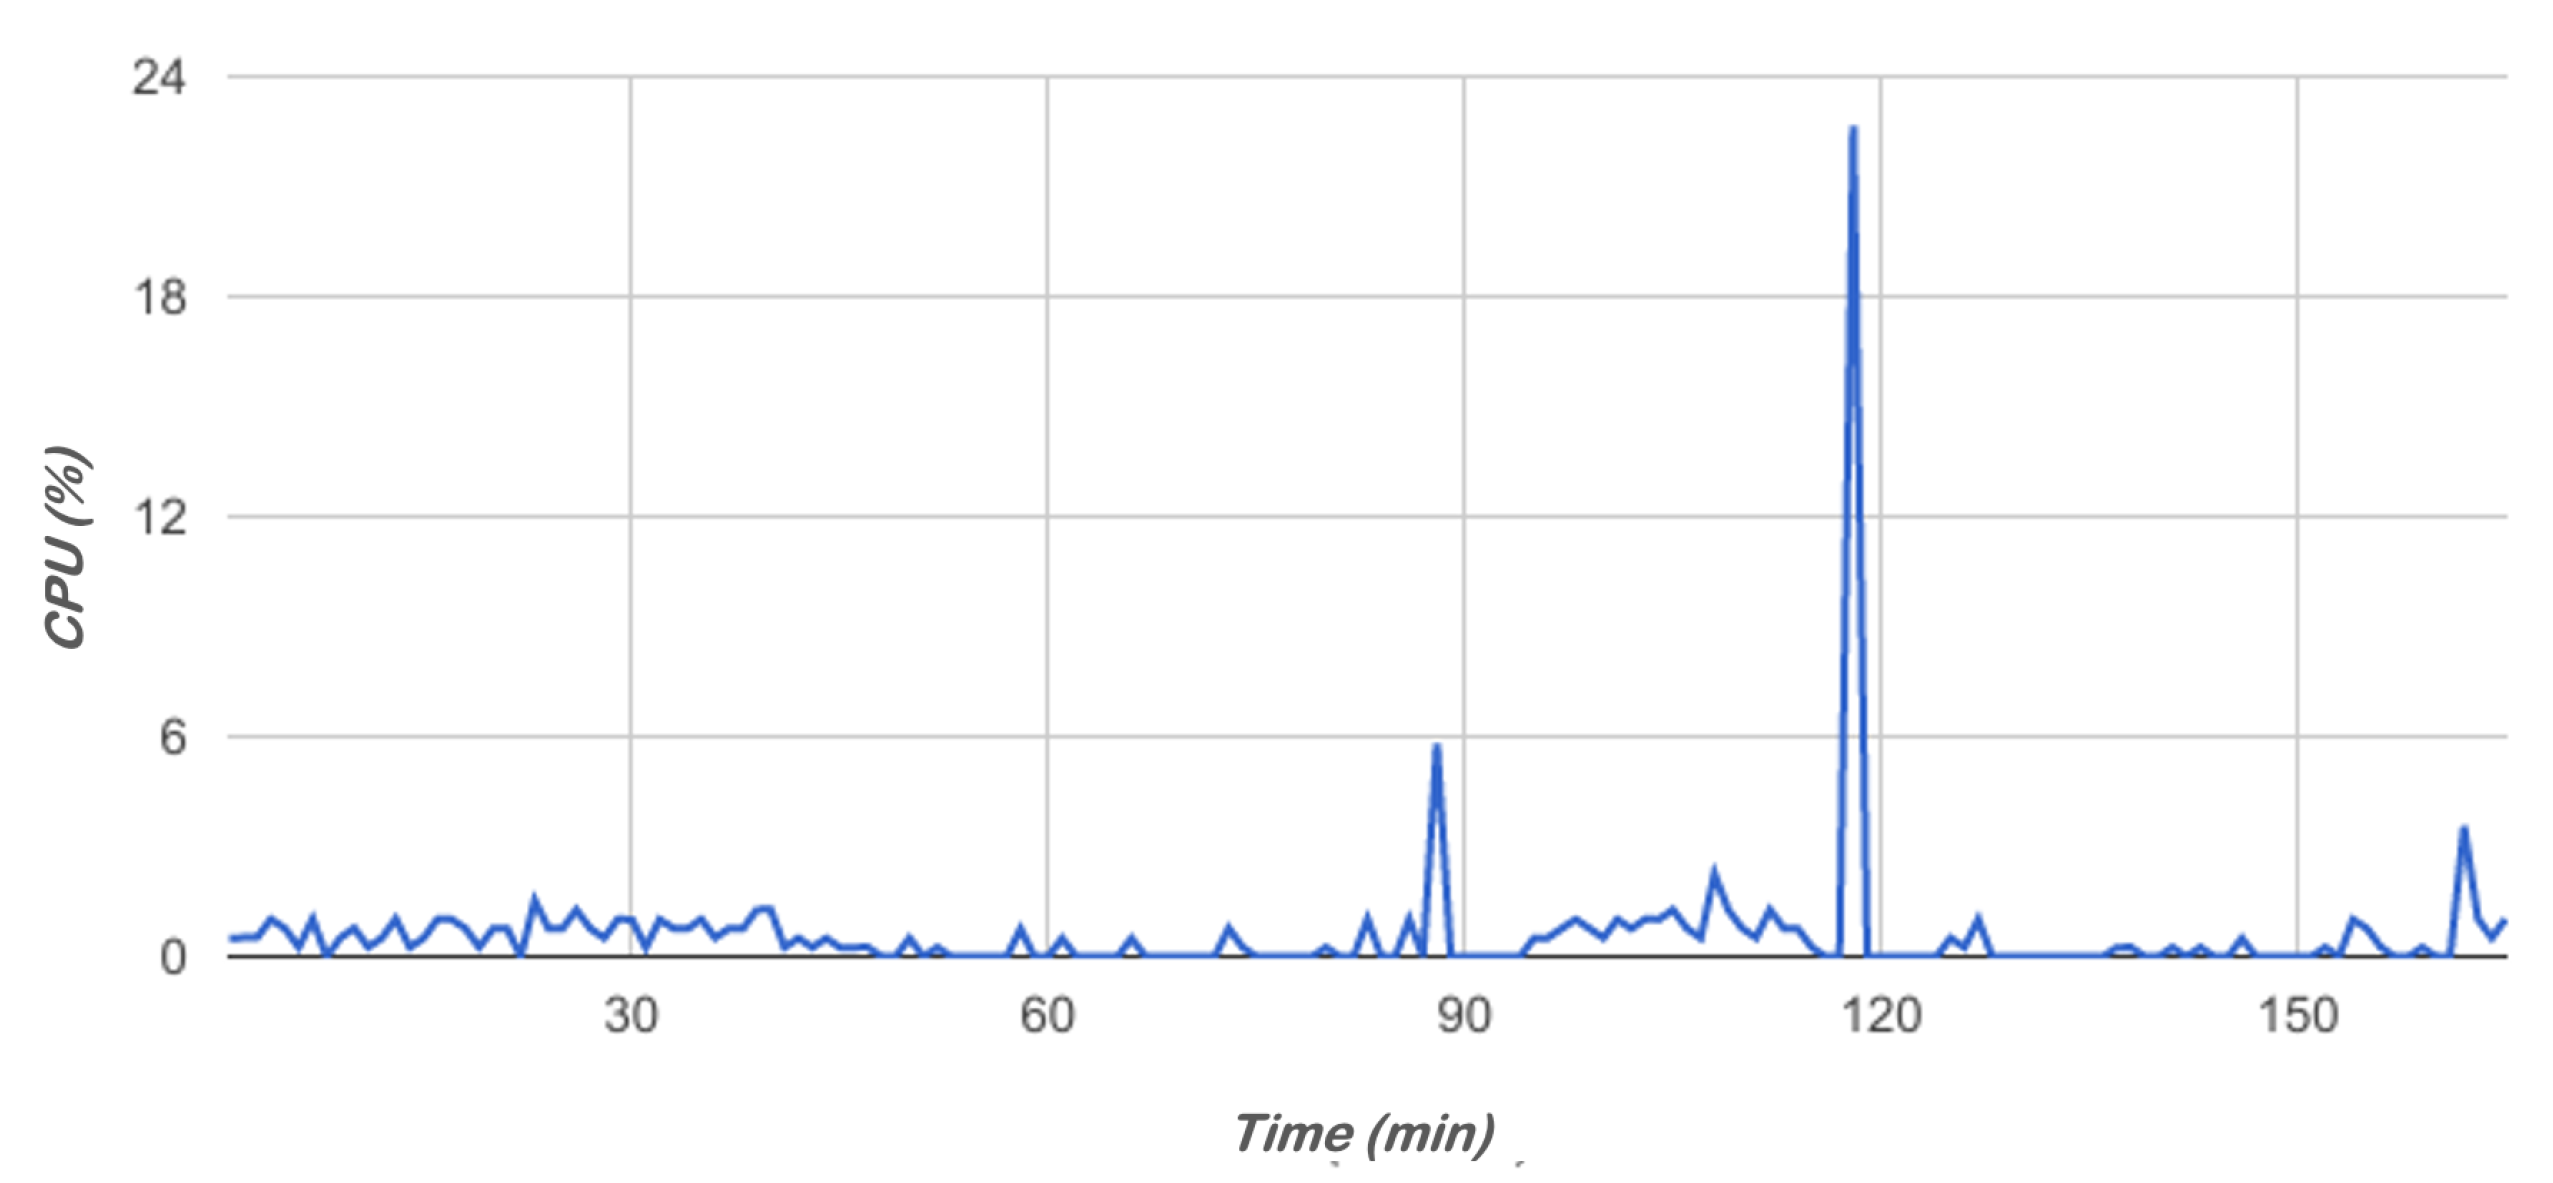
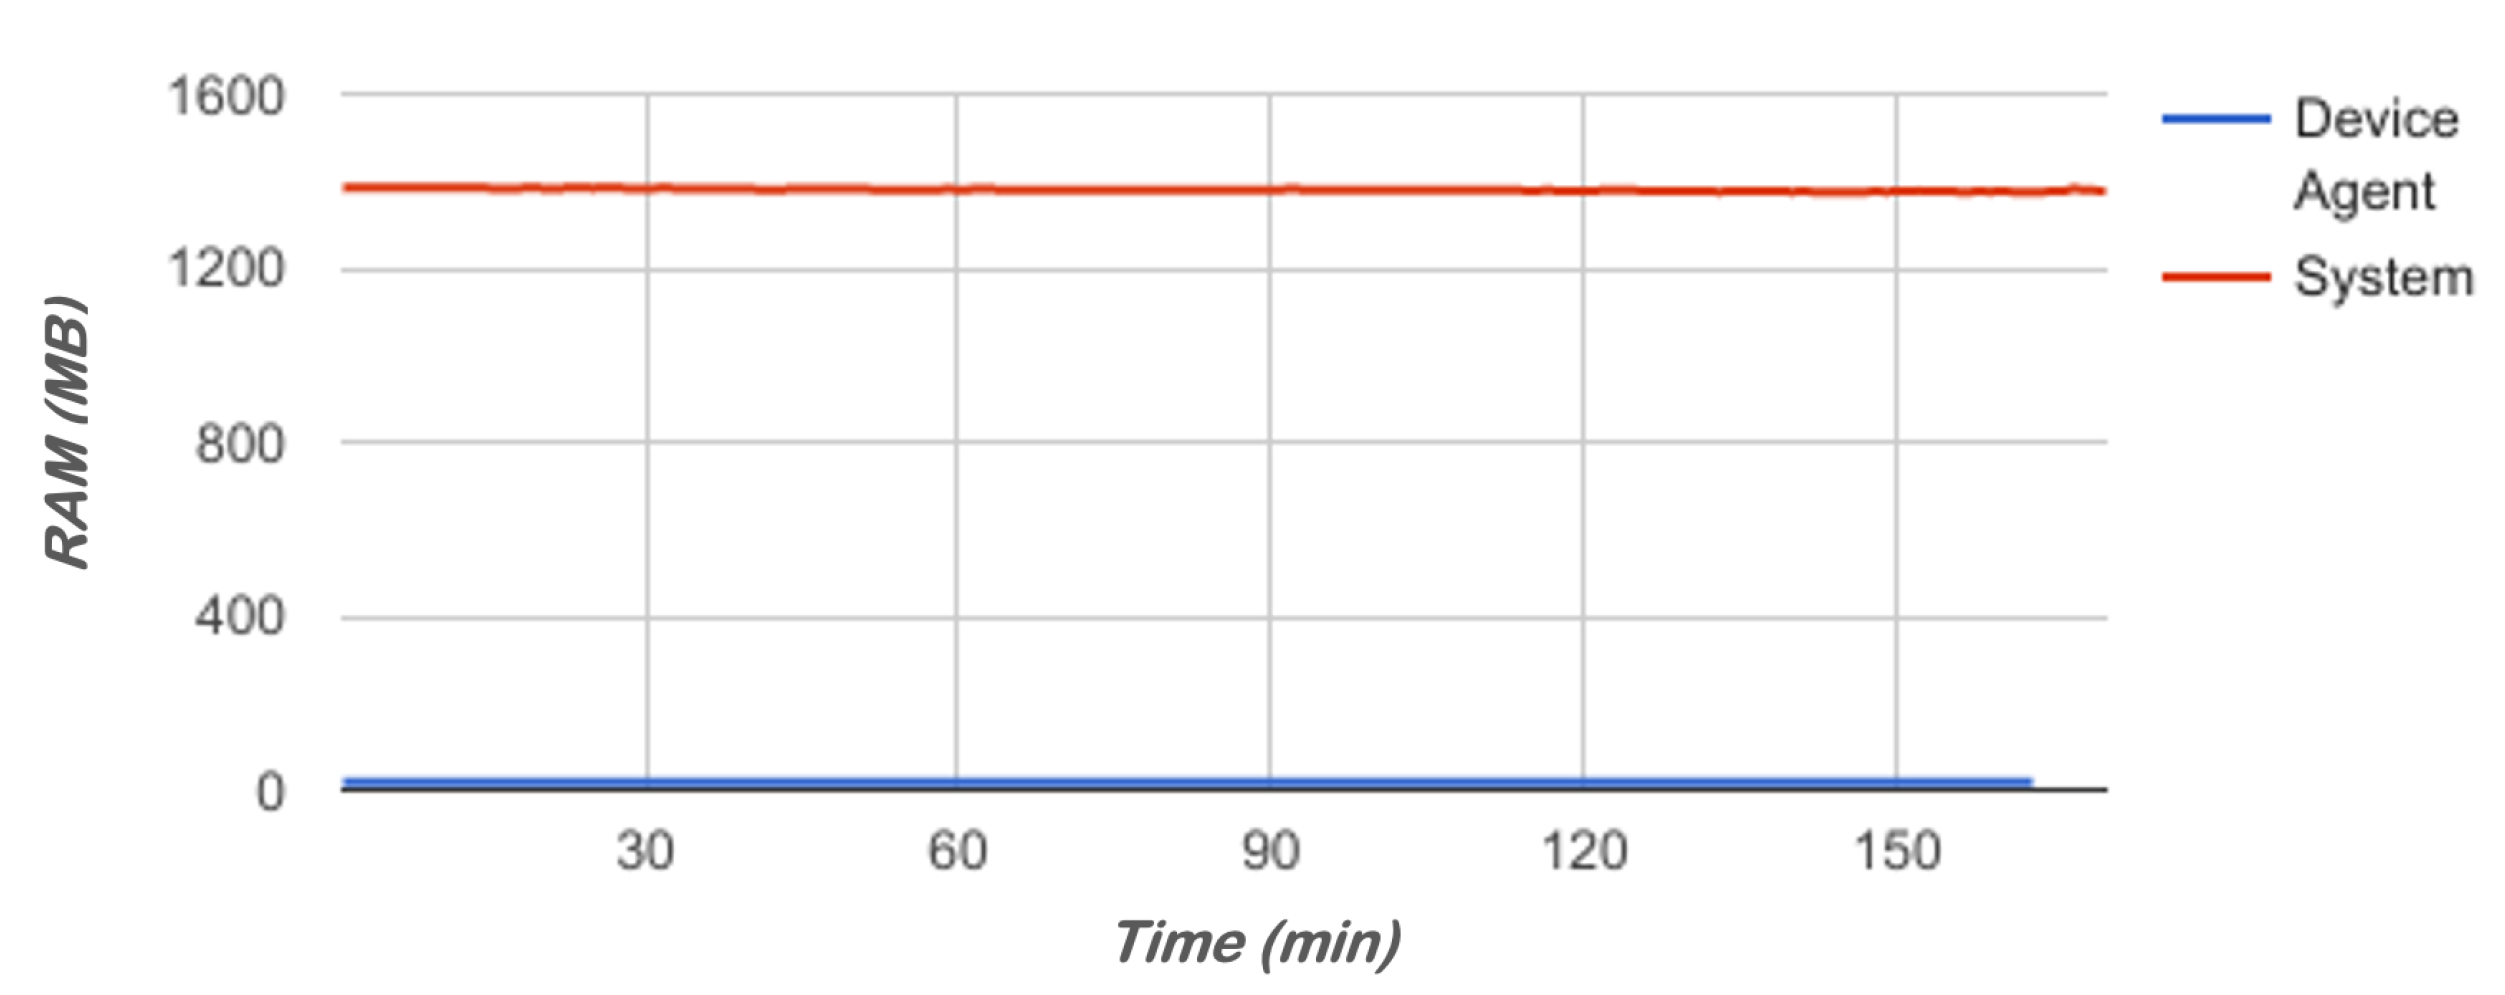
5.1. Impact of the Agent in the Mobile Device

The proposed device agent was designed to run in the background, with minimal overhead. This requirement is due to the fact that mobile devices are often limited in terms of resources such as CPU, RAM, battery life, memory and connectivity. As such, the validation effort for this component will be mostly focused on analyzing its CPU and RAM usage profile—it should be noted that, since the agent is a background application there is no significant screen time to account for, therefore being possible to indirectly infer the impact on the device battery life from the CPU usage patterns.
The analysis of the device agent impact on the system’s RAM is depicted on Table 3 and Figure 11 and Figure 12. The test procedure consisted on running the device agent application on a standard, factory reset, Nexus 5 emulator instance for an approximate period of 6 h. During the test interval, the application’s RAM usage was recorded every 10 s, with the available system RAM and CPU (Figure 13) usage being sampled each 60 s, generating an approximate total of 500 measurements for each attribute, during the duration of the tests. The use of factory reset device contributed to further enhance the controllability of the tests—thus, besides the device agent application only a few other default/stock Android applications and utilities such as the telephony, clock, calendar or the launcher were running in the device.
The device was also externally monitored using the Android Debug Bridge (ADB) and the top command, obtaining 5179 measurements for the device CPU usage, summarized in Table 4 and Figure 14. Table 4 analyzes the device agent application CPU percentile usage and the number of threads used, while Figure 14 shows the RAM usage for the device and the application.
As can be seen, the implemented Android device agent has minimal device resource overhead, being able to monitor it without hindering its operation or interfering with other applications running on the same device. The device agent RAM and CPU overhead accounts for about 0–1% of the system’s, according to Figure 14, and Table 3 and Table 4. It is noteworthy that, although the application spawns a considerable number of worker threads, its showcases a modest RAM and CPU footprint. This can be explained by the event-driven, short-lived nature of each thread, which is only active during the time span that is needed to record the current status of the system.

5.2. Impact on the Network

Due to concerns related to factors such as the network performance overhead, data plan thresholds or the battery penalty imposed by the use of WiFi or cellular data connections, there was also the need to evaluate the network traffic overhead for the device agent. In fact, the efficient use of network resources was one of the main concerns during the design of the proposed framework right from the start, also being one of the driving forces for many of the technological choices that were undertaken (e.g., MQTT).
When connected to the Internet, a device agent must send the collected data to a message broker—this connection can be established either via WiFi or mobile networks. While WiFi connectivity has become faster, generally with few limits or data caps, mobile networks are still somehow restrictive regarding these aspects (more or less depending on the data plan). As such, it was decided to measure the average and maximum expected data transfers (in bytes) for each connection, for the device and on a system-level basis. For this purpose, it was decided to estimate the expected impact on network traffic by analyzing the size and frequency of the existing messages when sent from the device agents, in order to establish the theoretical limits.
All the support calculations for this section are also available at the spreadsheet available in [48], which can be copied and edited to simulate other scenarios.

5.2.1. Individual Message Analysis

It must be taken into consideration that the bulk of the system is written in Java, which means that the characteristics of its specific primitive data types should to be taken into account. For instance, time configurations are stored using Integers (int), taking 32 bits or 4 bytes in memory. However, it should be noted that what is encoded and sent over the network are not the 4 bytes representing these integers, but rather their plain text string representations—as such, the number 60,000, whose integer representation would fit in 4 bytes, will in fact take 5 bytes as “60,000”, with one byte being used for each character (messages use ASCII characters, being compatible with 1-byte UTF-8 encoding). Therefore, it can be inferred that they will occupy 10 bytes (2 31 − 1 = 2,147,483,647) at most, with a minimum of 1 byte (“0”), for valid entries (this explains the “Min” and “Limit” value for several items on Table 5 and Table 6).
Table 5, Table 6 and Table 7 present the projected overhead for each of the ConfigurationMessage and DeviceMessage types, in terms of size and daily frequencies, considering the default agent configuration documented in Section 4.1.3 and the same conditions as the ones used for the device agent tests from Section 5.1, using 500 samples. Unlike Table 5 and Table 6, the possible value range for the messages in Table 7 is substantially wider, thus only the average message size per message type is going to be analyzed, based on the test observations. It is also worth mentioning that Table 5 and Table 6 doe not take into account the inherent JSON message encoding overhead, but only the attribute string size overhead.
Regarding Table 7, it should be noted that eventful and one time messages do not have predefined or stable frequencies because they are dependant on certain triggering events, which can occur at any moment, depending on the user behaviour. Therefore, in order to avoid discarding them from this analysis, the values assumed for these calculations are the ones that have been listed, being considered as a rough and optimistic estimation of what could be the daily behaviour of a regular device. Therefore, it is assumed that the user will at least interact with his phone 25 times, and experience 1 cell tower handover, during that period. It is also considered that the user won’t install/modify any new/existing applications, experience a timezone change, nor power off his phone. The values for the periodic and aggregated correspond to the default device agent settings, listed in Section 4.1.3.
Finally, it is a also assumed that no device agent configuration changes were made during the tests, which means that no configuration messages are exchanged over the network.

5.2.2. Empirical Device-Level Network Traffic Overhead Analysis

Using the values provided by Table 5, Table 6 and Table 7, it is now possible to infer the expected network traffic generated by each device, which will called the Average Device Network Traffic (ADNT). This is a purely empirical evaluation effort, which attempts to provide an estimation of the projected network overhead imposed by the proposed solution.
This is calculated by multiplying the size overhead of a device message by the sum of the expected impact of each type of message in the system, which itself is the product of the Average Number of Device Messages of type m per day (ANDM(m)) and the Average Size of Device Messages of type m (ASDM(m)). The JSON-related overhead is also accounted for DMJSO and CJSO).
ADNT = DMJSO + ( ANDM ( m ) × ( ASDM ( m ) + CJSO ) )
  • ADNT—Average Device Network Traffic
  • DMJSO—Device Message JSON Size Overhead
  • ANDM ( m ) —Average Number of Device Messages of type m per day
  • ASDM ( m ) —Average Size of Content in Device Messages of type m
  • CJSO—Content’s JSON string representation Size Overhead
  • Message Type— m { PM |EM|OM| AM }
  • Set of Periodic Messages— PM   =   { RAM, CPU, GPS, CPU Usage, RAM Usage, Battery, Open Ports, Data Traffic}
  • Set of Eventful Messages— EM   =   { Time Change, Charging Change, Connection Change, Screen Change, Pwr Change}
  • Set of One Time Messages— OM   =   { Package Change}
  • Set of Aggregated Messages— AM   =   { Aggregated Periodic, Aggregated Eventful}
Accounting for an estimated CJSO of 73 bytes and a DMJSO of 124 bytes (measured through our tests) as average message containers, it can be calculated that the ADNT should be around 4,146,254 bytes, which means that each device should produce around 4.1 MB of data every day, while using the default configurations and the subsequent values in Table 7.

5.2.3. Aggregated Network Traffic Overhead Analysis

Having the ADNT, it becomes possible to extrapolate the expected network traffic generated for any number of managed devices by simply multiplying it.
ANT = ADNT × NSDN
  • ANT—Average Network Traffic
  • ADNT—Average Device Network Traffic
  • NSDN—Number of Managed Devices in Network
These formulas give us the expected Average Network Traffic, but the same logic could be applied to the minimum and maximum network traffic, giving us boundaries to assess the system’s network traffic. Since our system was designed with BYOD and MDM environments in mind, it may be possible to extrapolate how this analysis scales up for an increasingly higher number of users, going from a personal/testing environment (1 to 100), to an enterprise environment (100 to 100 K), to an international environment (large multinational corporations in the IT sector may range from 100 K to 400 K employees, albeit 1M is considered as a worst-possible case).
Table 8 provides a daily account for the network traffic generated accordingly to the number of managed devices. The numbers are quite acceptable for current mobile network capabilities, even considering a few thousand devices per domain.
The proposed solution appears as fairly conservative, even when data collection takes place at an increased rate (thousands of samples per day, for each user). Furthermore, there is plenty of space for improvement, either by reducing the data collection frequencies or by reducing the overhead of each message. The first should be trivial, thanks to the device agent management feature. The latter, however, is more challenging. First, instead of sending the messages in JSON plaintext, they could be compressed beforehand and decompressed on the other end, but this would raise the question whether the additional computing overhead is justified, eventually requiring further testing. Second, a substantial percentage of the message payload can be attributed to serialized variable names, meaning that the adoption of a shorter naming schema could save space. Finally, the collected data content itself could be even further streamlined by stripping excessive whitespaces. Considering that, for the default configurations, there are approximately 30,000 generated on a daily basis (per user), these changes are sure to add up.

6. Conclusions and Ongoing Work

The framework hereby presented constitutes a security management platform whose scope is complementary to existing MDM solutions. Besides scalability concerns, which implicitly derive from the potential number of supported endpoint devices, the proposed solution also had to take into consideration aspects such as resource usage and energy efficiency.
The proof-of-concept prototype that was ultimately developed and evaluated constitutes a complete end-to-end solution which encompasses a device agent (for capturing relevant metrics), a transport and pre-processing subsystem (for transmission of security telemetry data) and a core processing layer, which can be used to implement a series for anomaly detection algorithms, in a flexible way. Both the transport and core processing layers were designed with scale-out properties, allowing them to horizontally scale accordingly with the increase in the number of monitored devices and/or features used for security analysis purposes.
The evaluation effort, which was undertaken on a proof-of-concept implementation for the Android OS platform, demonstrated the efficiency of the device agent component architecture. Moreover, the empirical evaluation of the platform scalability characteristics, using a reference profile has also proven the validity of the proposed approach, from a raw data throughput perspective.

Author Contributions

Conceptualization, A.L., L.R., T.C. and P.S.; funding acquisition, P.S.; software, A.L. and L.R.; supervision, T.C. and P.S.; writing—original draft, A.L., T.C. and P.S.; writing—review and editing, L.R., T.C. and P.S. All authors have read and agreed to the published version of the manuscript.

Funding

This work was partially funded by the “Mobilizador 5G” P2020 Project (project 10/SI/2016 024539) and FCT—Foundation for Science and Technology, I.P., within the scope of the project CISUC-UID/CEC/00326/2020 and by the European Social Fund, through the Regional Operational Program Centro 2020.

Conflicts of Interest

The authors declare no conflict of interest.

References

  1. Lennon, R. Changing user attitudes to security in bring your own device (BYOD) & the cloud. In Proceedings of the 5th Romania Tier 2 Federation Grid, Cloud & High Performance Computing Science (RQLCG), Cluj-Napoca, Romania, 13 June 2012; pp. 49–52. [Google Scholar]
  2. Lebek, B.; Degirmenci, K.; Breitner, M.H. Investigating the Influence of Security, Privacy, and Legal Concerns on Employees’ Intention to Use BYOD Mobile Devices. In Proceedings of the Nineteenth Americas Conference on Information Systems, Toronto, ON, Canada, 15–17 August 2008; pp. 1–8. [Google Scholar]
  3. Lima, A. Analysis and Detection of Anomalies in Mobile Devices. Master’s Thesis, Universidade de Coimbra, Coimbra, Portugal, 2017. Available online: https://estudogeral.sib.uc.pt/handle/10316/83277 (accessed on 20 January 2020).
  4. Lima, A.; Sousa, B.; Cruz, T.; Simões, P. Security for Mobile Device Assets: A Survey. In Mobile Apps Engineering; CRC Press: Boca Raton, FL, USA, 2018; Volume 1, pp. 1–34. ISBN 9781138054356. [Google Scholar]
  5. Samsung KNOX. Available online: https://www.samsungknox.com/en (accessed on 22 September 2019).
  6. Apple Business Manager. Available online: https://business.apple.com (accessed on 22 September 2019).
  7. Android Enterprise. Available online: https://www.an-droid.com/enterprise/ (accessed on 22 September 2019).
  8. Microsoft Intune. Available online: https://docs.microsoft.com/en-us/mem/intune/fundamentals/what-is-intune (accessed on 2 July 2020).
  9. Flyve Open-Source Device Management. Available online: https://www.flyve-mdm.com (accessed on 22 September 2019).
  10. Google Analytics for Firebase. Available online: https://firebase.google.com/products/analytics (accessed on 22 May 2020).
  11. Yahoo Flurry Analytics. Available online: https://www.flurry.com (accessed on 22 May 2020).
  12. Microsoft App Center Analytics. Available online: https://docs.microsoft.com/en-us/appcenter/analytics/ (accessed on 22 May 2020).
  13. Firebase Crashlytics. Available online: https://firebase.google.com/docs/crashlytics (accessed on 22 May 2020).
  14. Garba, A.B.; Armarego, J.; Murray, D.; Kenworthy, W. Review of the information security and privacy challenges in Bring Your Own Device (BYOD) environments. J. Inf. Priv. Secur. 2015, 11, 38–54. [Google Scholar] [CrossRef]
  15. Hou, S.; Ye, Y.; Song, Y.; Abdulhayoglu, M. Hindroid: An intelligent android malware detection system based on structured heterogeneous information network. In Proceedings of the 23rd ACM SIGKDD International Conference on Knowledge Discovery and Data Mining, Halifax, NS, Canada, 13–17 August 2017; pp. 1507–1515. [Google Scholar]
  16. Memon, L.U.; Bawany, N.Z.; Shamsi, J.A. A comparison of machine learning techniques for android malware detection using apache spark. J. Eng. Sci. Technol. 2019, 14, 1572–1586. [Google Scholar]
  17. Zhu, H.J.; You, Z.H.; Zhu, Z.X.; Shi, W.L.; Chen, X.; Cheng, L. DroidDet: Effective and robust detection of android malware using static analysis along with rotation forest model. Neurocomputing 2018, 272, 638–646. [Google Scholar] [CrossRef]
  18. Abawajy, J.H.; Kelarev, A. Iterative Classifier Fusion System for the Detection of Android Malware. IEEE Trans. Big Data 2019, 5, 282–292. [Google Scholar] [CrossRef]
  19. DeLoach, J.; Caragea, D.; Ou, X. Android malware detection with weak ground truth data. In Proceedings of the 2016 IEEE International Conference on Big Data (Big Data), Washington, DC, USA, 5–8 December 2016; pp. 3457–3464. [Google Scholar]
  20. Tong, F.; Yan, Z. A hybrid approach of mobile malware detection in Android. J. Parallel Distrib. Comput. 2017, 103, 22–31. [Google Scholar] [CrossRef]
  21. Google Brain Team. TensorFlow Lite: Deploy Machine Learning Models on Mobile and IoT Devices. Available online: https://www.tensorflow.org/lite (accessed on 21 July 2020).
  22. Feng, R.; Chen, S.; Xie, X.; Ma, L.; Meng, G.; Liu, Y.; Lin, S. MobiDroid: A Performance-Sensitive Malware Detection System on Mobile Platform. In Proceedings of the 2019 24th International Conference on Engineering of Complex Computer Systems (ICECCS), Hong Kong, China, 10–13 November 2019; pp. 61–70. [Google Scholar]
  23. Takawale, H.C.; Thakur, A. Talos App: On-Device Machine Learning Using TensorFlow to Detect Android Malware. In Proceedings of the 2018 Fifth International Conference on Internet of Things: Systems, Management and Security, Valencia, Spain, 15–18 October 2018; pp. 250–255. [Google Scholar]
  24. Barmpatsalou, K.; Cruz, T.; Monteiro, E.; Simoes, P. Current and Future Trends in Mobile Device Forensics: A Survey. ACM Comput. Surv. 2018, 51. [Google Scholar] [CrossRef]
  25. Marz, N.; Warren, J. Big Data: Principles and Best Practices of Scalable Real-Time Data Systems; Manning Publications Co.: New York, NY, USA, 2015. [Google Scholar]
  26. Kreps, J. Questioning the Lambda Architecture. July 2014. Available online: https://www.oreilly.com/radar/questioning-the-lambda-architecture/ (accessed on 21 July 2020).
  27. Forgeat, J. Data Processing Architectures—Lambda and Kappa; Ericsson: Stockholm, Sweden, 2015. [Google Scholar]
  28. Feick, M.; Kleer, N.; Kohn, M. Fundamentals of Real-Time Data Processing Architectures Lambda and Kappa. In Proceedings of the SKILL 2018—Studierendenkonferenz Informatik, Berlin, Germany, 26–27 September 2018; pp. 55–66. [Google Scholar]
  29. Databricks. Delta Architecture, a Step Beyond Lambda Architecture. Available online: https://pt.slideshare.net/JuanPauloGutierrez/delta-architecture (accessed on 23 July 2020).
  30. Linux Foundation. Delta Lake—Reliable Data Lakes at Scale. Available online: https://delta.io/ (accessed on 23 July 2020).
  31. Zahid, H.; Mahmood, T.; Morshed, A.; Sellis, T. Big data analytics in telecommunications: Literature review and architecture recommendations. IEEE/CAA J. Autom. Sin. 2019, 7, 18–38. [Google Scholar] [CrossRef]
  32. Liu, X.; Iftikhar, N.; Nielsen, P.S.; Heller, A. Online anomaly energy consumption detection using lambda architecture. In International Conference on Big Data Analytics and Knowledge Discovery; Springer: Cham, Switzerland, 2016; pp. 193–209. [Google Scholar]
  33. Seyvet, N.; Viela, I.M. Applying the Kappa Architecture in the Telco Industry. 2016. Available online: https://www.oreilly.com/content/applying-the-kappa-architecture-in-the-telco-industry/ (accessed on 21 July 2020).
  34. Carvalho, O.; Roloff, E.; Navaux, P.O. A Distributed Stream Processing Based Architecture for IoT Smart Grids Monitoring. In Proceedings of the UCC ’17 Companion 10th International Conference on Utility and Cloud Computing, Austin, TX, USA, 5–8 December 2017; Association for Computing Machinery: New York, NY, USA, 2017; pp. 9–14. [Google Scholar] [CrossRef]
  35. Estrada, R. Fast Data Processing Systems with SMACK Stack; Packt Publishing Ltd.: Birmingham, UK, 2016. [Google Scholar]
  36. Dizdarević, J.; Carpio, F.; Jukan, A.; Masip-Bruin, X. A Survey of Communication Protocols for Internet of Things and Related Challenges of Fog and Cloud Computing Integration. ACM Comput. Surv. 2019, 51, 1–29. [Google Scholar] [CrossRef]
  37. Apache Spark (2017b) Spark Overview. Available online: https://spark.apache.org/docs/1.0.1/index.html (accessed on 22 September 2019).
  38. Acar, A.; Aksu, H.; Selcuk, A.; Conti, M. A Survey on Homomorphic Encryption Schemes: Theory and Implementation. ACM Comput. Surv. 2018, 51, 1–35. [Google Scholar] [CrossRef]
  39. Halevi, S.; Shoup, V. HElib: An Implementation of Homomorphic Encryption. Available online: https://github.com/shaih/HElib (accessed on 31 December 2014).
  40. Apache Hadoop Project. Available online: http://hadoop.apache.org (accessed on 22 September 2019).
  41. Dean, J.; Ghemawat, S. MapReduce: Simplified Data Processing on Large Clusters. Commun. ACM 2008, 51, 107–113. [Google Scholar] [CrossRef]
  42. Shvachko, K.; Kuang, H.; Radia, S.; Chansler, R. The Hadoop Distributed File System. In Proceedings of the 2010 IEEE 26th Symposium on Mass Storage Systems and Technologies (MSST), Incline Village, NV, USA, 3–7 May 2010; pp. 1–10. [Google Scholar] [CrossRef]
  43. Bertran, P.F. Lambda Architecture: A State-of-the-Art. 2014. Available online: http://www.datasalt.com/2014/01/lambda-architecture-a-state-of-the-art/ (accessed on 20 January 2017).
  44. Bijnens, N.; Hausenblas, M. Lambda Architecture: A State-of-the-Art. 2016. Available online: http://lambda-architecture.net/ (accessed on 20 January 2017).
  45. Nierbeck, A. IoT Analytics Platform. 2016. Available online: https://blog.codecentric.de/en/2016/07/iot-analytics-platform/ (accessed on 20 January 2017).
  46. Bertran, P.F. An Example “Lambda Architecture” for Real-Time Analysis of Hashtags Using Trident, Hadoop and Splout SQL. 2013. Available online: http://www.datasalt.com/2013/01/an-example-lambda-architecture-using-trident-hadoop-and-splout-sql (accessed on 22 September 2019).
  47. Apache Spark (2017a) Machine Learning Library (MLlib). Available online: https://spark.apache.org/docs/1.0.1/mllib-guide.html (accessed on 22 September 2019).
  48. Lima, A. Network Traffic Spreadsheet. 2017. Available online: https://goo.gl/BHn2oZ (accessed on 21 July 2020).
Figure 1. Enterprise mobility schemes (adapted from [3]).
Electronics 09 01197 g001
Figure 2. Overview of proposed IDS framework.
Electronics 09 01197 g002
Figure 3. Components of the device agent.
Electronics 09 01197 g003
Figure 4. Device/agent management.
Electronics 09 01197 g004
Figure 5. Device agent—creating, listening, and handling events.
Electronics 09 01197 g005
Figure 6. Update management flowchart.
Electronics 09 01197 g006
Figure 7. Example of a lambda architecture.
Electronics 09 01197 g007
Figure 8. Device message graph concept.
Electronics 09 01197 g008
Figure 9. Device message graph example.
Electronics 09 01197 g009
Figure 10. Interaction between human, dashboard and aggregator.
Electronics 09 01197 g010
Figure 11. Device agent RAM usage over time.
Electronics 09 01197 g011
Figure 12. System RAM usage over time.
Electronics 09 01197 g012
Figure 13. System CPU usage over time.
Electronics 09 01197 g013
Figure 14. Available RAM over time.
Electronics 09 01197 g014
Table 1. Security-related features of Mobile Device and Application Management (MDAM) frameworks.
Samsung KNOXAndroid for WorkFlyve MDMMicrosoft IntuneApple DEP
Secure Boot
Profile Isolation
Deployment of Security Policies
Deployment of Apps
Dedicated Apps
Device Monitoring
Remote data Wipe
Secure Execution
Supported OSsAndroidAndroidAndroidAndroid, iOSiOS
Table 2. Bring Your Own Device (BYOD) schemes and enterprise mobility schemes.
BYOD SchemeDevice Control# Devices in Corporation
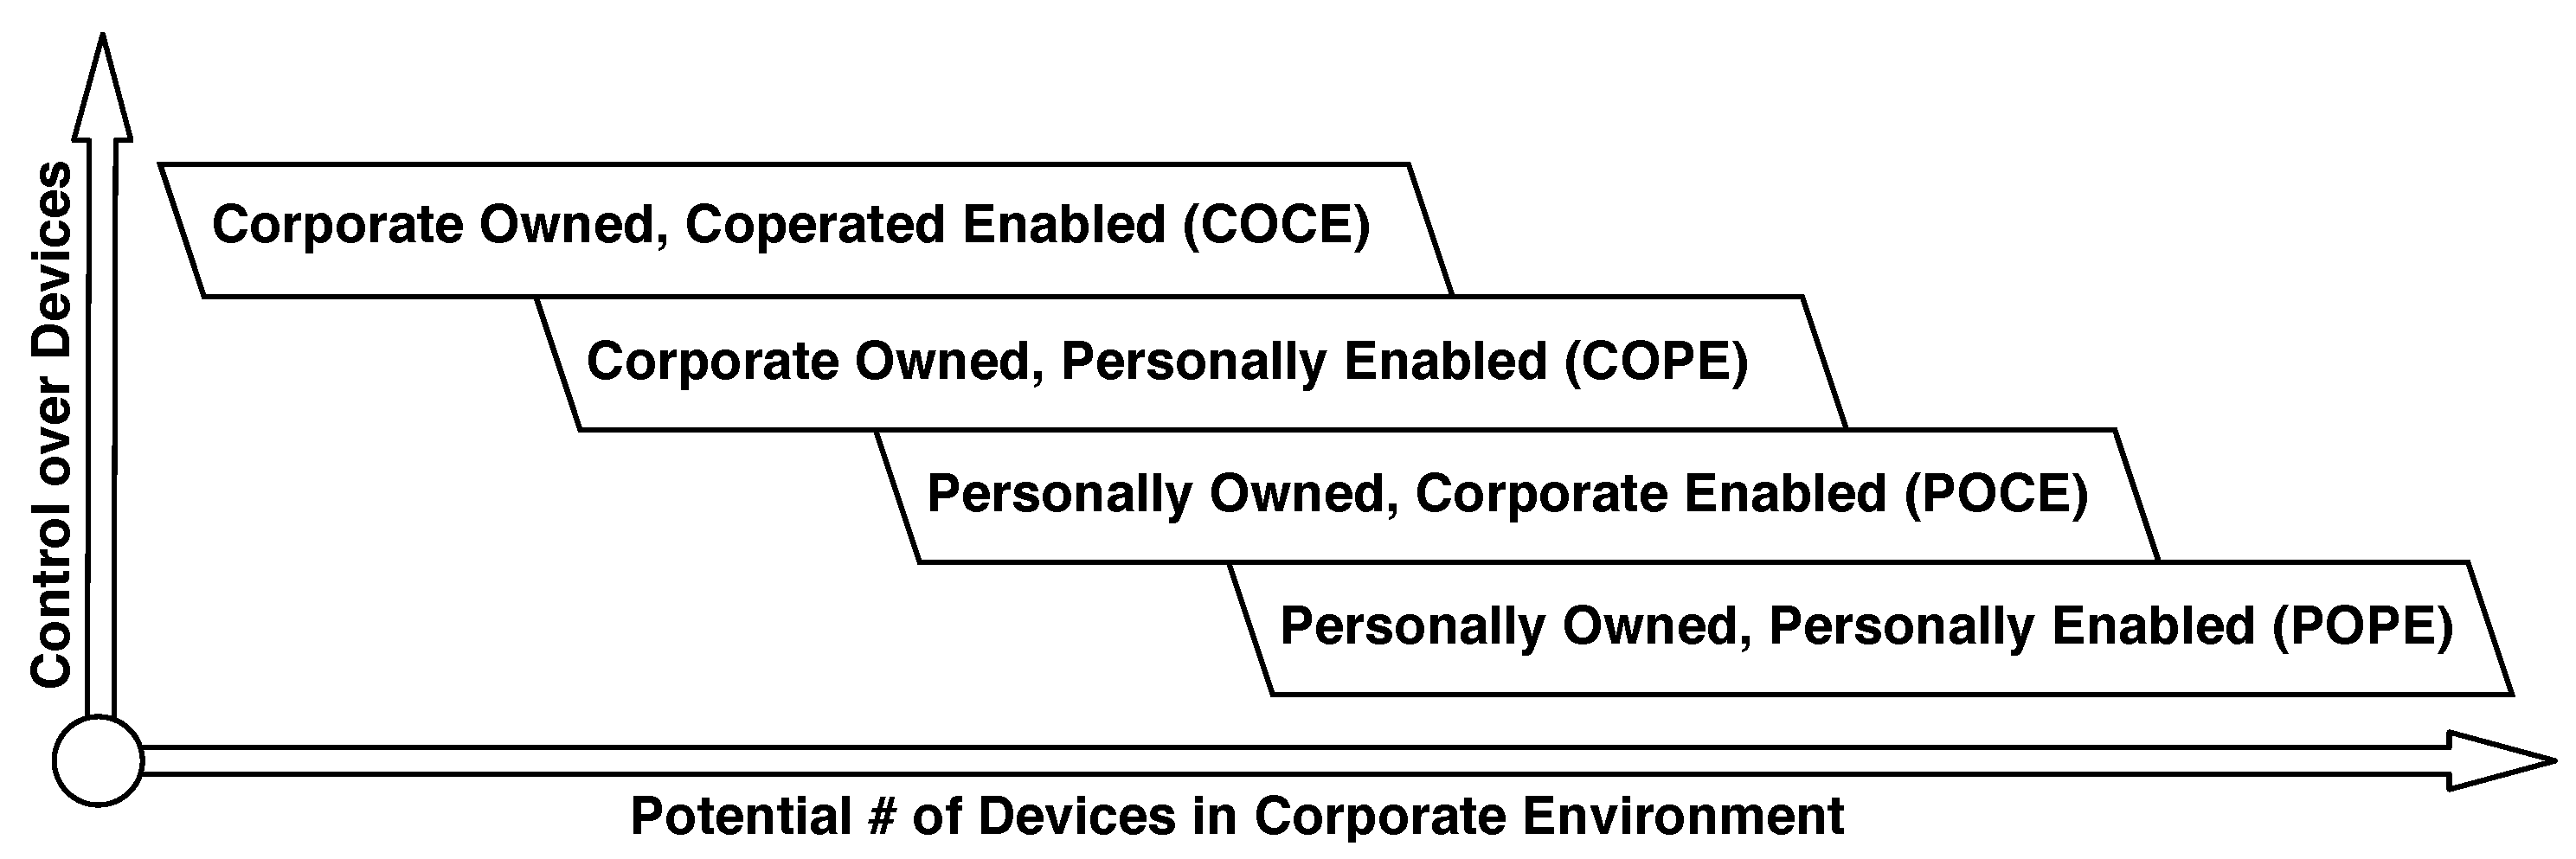
Corporate Owned Corporate Enabled (COCE)+++++
Corporate Owned Personally Enabled (COPE)+++++
Personally Owned Corporate Enabled (POCE)+++++
Personally Owned Personally Enabled (POPE)+++++
Table 3. Device agent test results analysis.
#MinAvg σ Max
Application RAM (MB)46717,75618,77354423,521
Available System RAM (MB)4931,365,2701,383,27063611,395,916
Available System CPU (%)47600.81.622.6(6)
Table 4. ADB “top” analysis.
MinAvg σ Max
Application CPU (%)00.0070.36826
Application Threads (#)1417.870.82322
Table 5. Configuration Message Size Analysis—telemetry.
Aprox. Size (bytes)
Configuration Message Type MinAvgLimitStdev
Data Generation
RAM15100.82
CPU15100.23
GPS15100.13
CPU_USAGE15100.62
RAM_USAGE15101.21
BATTERY16100.11
OPEN_PORTS15101.13
DATA_TRAFFIC16103.84
AGGREGATE_PERIODIC_DATA17101.88
AGGREGATE_EVENTFUL_DATA17102.62
Table 6. Configuration message size analysis—message management.
Aprox. Size (bytes)
Configuration Message TypeMinAvgLimit
Message Management
PUBLISH_DATA1710
UPDATE_CONFIGURATIONS1710
MQTT_TIMEOUT1210
MQTT_KEEP_ALIVE1210
SERVER_PROTOCOL334
SERVER_URI11523
SERVER_PORT1410
SERVER_BASE_PUBLISH_TOPIC1965,536
SERVER_BASE_UPDATE_TOPIC11465,536
SERVER_PASSWORD01665,535
Table 7. Device message daily frequency analysis.
Message Type (m)ANDM (#)ASDM (bytes)Stdev
Periodic
RAM1440374.7
CPU1440214.1
GPS1440356.1
CPU Usage8640442.8
RAM Usage8640725.5
Battery288131.8
Open Ports14401551.7
Data Traffic2888412.1
Eventful
Time Change065N/C
Charging Change170N/C
Connection Change163N/C
Cell Location Change1100N/C
Screen Change50701.8
Power Change070N/C
One Time
Package Change0150N/C
Aggregated
Aggregated Periodic28801206.1
Aggregated Eventful2880904.7
Total29,4291259
Table 8. Projected daily network traffic analysis.
NSDN (#)Aprox. ANT (bytes)
14 MB
1040 MB
100400 MB
1 K4 GB
10 K40 GB
100 K400 GB

