Article

Extended Segmented Beat Modulation Method for Cardiac Beat Classification and Electrocardiogram Denoising

Department of Information Engineering, Università Politecnica delle Marche, 60131 Ancona AN, Italy
*
Author to whom correspondence should be addressed.
Current address: Via Brecce Bianche, 60131 Ancona, Italy.
Electronics 2020, 9(7), 1178; https://doi.org/10.3390/electronics9071178
Submission received: 24 April 2020 / Revised: 12 July 2020 / Accepted: 17 July 2020 / Published: 20 July 2020
(This article belongs to the Section Bioelectronics)

Abstract

:
Beat classification and denoising are two challenging and fundamental operations when processing digital electrocardiograms (ECG). This paper proposes the extended segmented beat modulation method (ESBMM) as a tool for automatic beat classification and ECG denoising. ESBMM includes four main steps: (1) beat identification and segmentation into PQRS and TU segments; (2) wavelet-based time-frequency feature extraction; (3) convolutional neural network-based classification to discriminate among normal (N), supraventricular (S), and ventricular (V) beats; and (4) a template-based denoising procedure. ESBMM was tested using the MIT–BIH arrhythmia database available at Physionet. Overall, the classification accuracy was 91.5% while the positive predictive values were 92.8%, 95.6%, and 83.6%, for N, S, and V classes, respectively. The signal-to-noise ratio improvement after filtering was between 0.15 dB and 2.66 dB, with a median value equal to 0.99 dB, which is significantly higher than 0 (p < 0.05). Thus, ESBMM proved to be a reliable tool to classify cardiac beats into N, S, and V classes and to denoise ECG tracings.

1. Introduction

Cardiovascular diseases (CVDs) continue to be the leading cause of death worldwide with a reported increase in the CVD mortality rate from 12.3 million in the year 1990 to approximately 17.9 million in the year 2016. This accounts for 31% of the global death count. The World Health Organization (WHO) attributes the major causes of CVDs to behavioral factors like smoking, excessive alcohol consumption, physical inactivity, and nutritional/dietary deficiencies, in addition to pre-existing medical conditions such as diabetes, hypertension, hyperlipidaemia, or having a family history of CVD. Identifying those at highest risk of CVDs is vital to ensure that the patients receive timely and appropriate treatment, as 80% of premature heart diseases and strokes are said to be preventable [1,2].
Electrocardiogram (ECG) is both noninvasive and the most common medical test among the procedures used by clinicians to detect and analyze cardiac arrhythmia. A cardiac arrhythmia is defined as any deviation (regular or irregular/sustained or nonsustained) from normal sinus rhythm. It is caused by abnormalities in impulse formation or in the conduction of electrical signals due to alterations in the heart tissue or activity [3]. There has been great deal of interest shown by clinicians and researchers working in the field of cardiology in the diagnosis of automated arrhythmia [4,5,6,7,8,9,10] in the past decade. However, the analysis and detection of arrhythmic cardiac beats using ECG is met by some technical challenges. First, the ECG acquired in the raw form is prone to different kinds of noise and interference, such as power-line interference, electrode motion artifacts, muscle artifacts, respiration, and others. Second, the classification of cardiac beats in long-term ECG recordings using visual analysis to identify critical and noncritical arrhythmia is laborious, time-consuming, and it is not a feasible solution considering the large amount of data acquired in long-term and continuous monitoring scenarios. Hence, novel and effective solutions are needed for both the classification and denoising of ECG with design requirements focused on retaining the morphological parameters that are good enough for clinical assessment and a sensitive arrhythmic beat detection with reduced time complexity to be beneficial in automated analysis of cardiac arrhythmia in such diverse and long-term datasets.
Numerous noise cancellation methods have been proposed for the denoising of ECG signals. Several efficient denoising techniques have been presented in the past few years to separate the useful ECG components from background noise contamination emanating from various sources. Linear and adaptive filtering techniques have been used for the removal of baseline wander, muscle activity, and motion artifact noise [11,12]. Variations in wavelet transform have proven to overcome other time-frequency methods since they allow the ECG noise factors to be analyzed at multiresolution [13,14]. Statistical methods such as principal component analysis [15,16], independent component analysis [16], and deep neural networks [17] have also been used to extract a noise-free signal from the original ECG recording. In addition, our research group presented a noise cancellation method, the segmented beat modulation method (SBMM) [18,19]. It was proposed as a template-based ECG filter with reproducibility of heart-rate and morphological variability. It has previously been tested in applications relative to abdominal fetal ECG [20] and electromyography filtering from ECG corruption [21], all in the case of short-term ECG recordings.
In the published articles, SBMM does not include a differentiating function for normal sinus beats and abnormal beats, hence it is a template-based denoising method with proven applicability to the normal sinus rhythm only [18,19,22,23,24,25]. The current work overcomes this limitation of SBMM and adds a classification function based on a convolutional neural network (CNN) to classify the beats into three beat classes selected among the five beat classes defined by the American National Standards Institute (ANSI) and the Association for the Advancement of Medical Instrumentation (AAMI) standard (ANSI/AAMI EC57:1998) [26] and further apply SBMM for the denoising of arrhythmic beats. This also extends the SBMM applicability to ECG recordings with arrhythmic cardiac cycles (CC).

2. Methodology

2.1. Preprocessing

In the preprocessing stage, power and low-frequency interference is removed from the raw ECG signal using a 6th-order bidirectional Butterworth band-pass filter with lower and upper cut-off frequencies of 0.5 Hz and 40 Hz, respectively. The baseline is computed as a cubic spline interpolation of fiducial points, placed 90 ms before R-peak position and subtracted from the bandpass-filtered signal.

2.2. Review of Segmented Beat Modulation Method

The originally proposed SBMM [18,19] is typically applied to short ECG recordings, the length of which is defined by the user as number of beats (typically a few tens of beats) or time (up to one minute). In case of a longer ECG recording, ECG windows of the chosen length are recursively extracted from the ECG recording and then singularly submitted to the SBMM. SBMM performs cardiac cycle (CC) identification and segmentation by assuming CC-onset fiducial mark Δ t before each R-peak and CC-offset fiducial mark at Δ t before the next consecutive R-peak (usually, Δ t = 40 ms). R-peak to previous R-peak interval (RR) is computed for each identified CC. All CCs are then segmented into a QRS segment ( ± Δ t around the R peak) and TUP segment (from Δ t after the R-peak until the end of current CC). Using the observations reported in [27], the duration of the QRS segment is assumed to be independent from RR, while the duration of the TUP segment is, in first approximation, proportional to it. Hence, the duration of all QRS segments is considered constant for all CCs (i.e., 2 × Δ t), whereas the duration of TUP segments (i.e., CC duration-QRS duration) is RR- and thus CC-dependent. All TUP segments are stretched/compressed in length to match the calculated median (over all available beats) TUP length and then concatenated with their respective QRS segments to get modulated CCs. All CCs being of equal length now, a median operation is performed over all CCs to compute a median-template. This template, which represents a clean version of the most common beat morphology existing in the recording, is also divided into QRS and TUP segments. Again, QRS is assumed constant and the median TUP is replicated to the number of CCs in the recording and then each CC is compressed/stretched to match the CC length of the input signal. All CCs are now concatenated to form a clean output ECG recording. As CC identification and segmentation is done using R-peak positions, SBMM requires, as input, the raw ECG recording plus the R-peak position vector either provided as annotations compiled by experts using visual analysis or found using any standard peak detection algorithm.

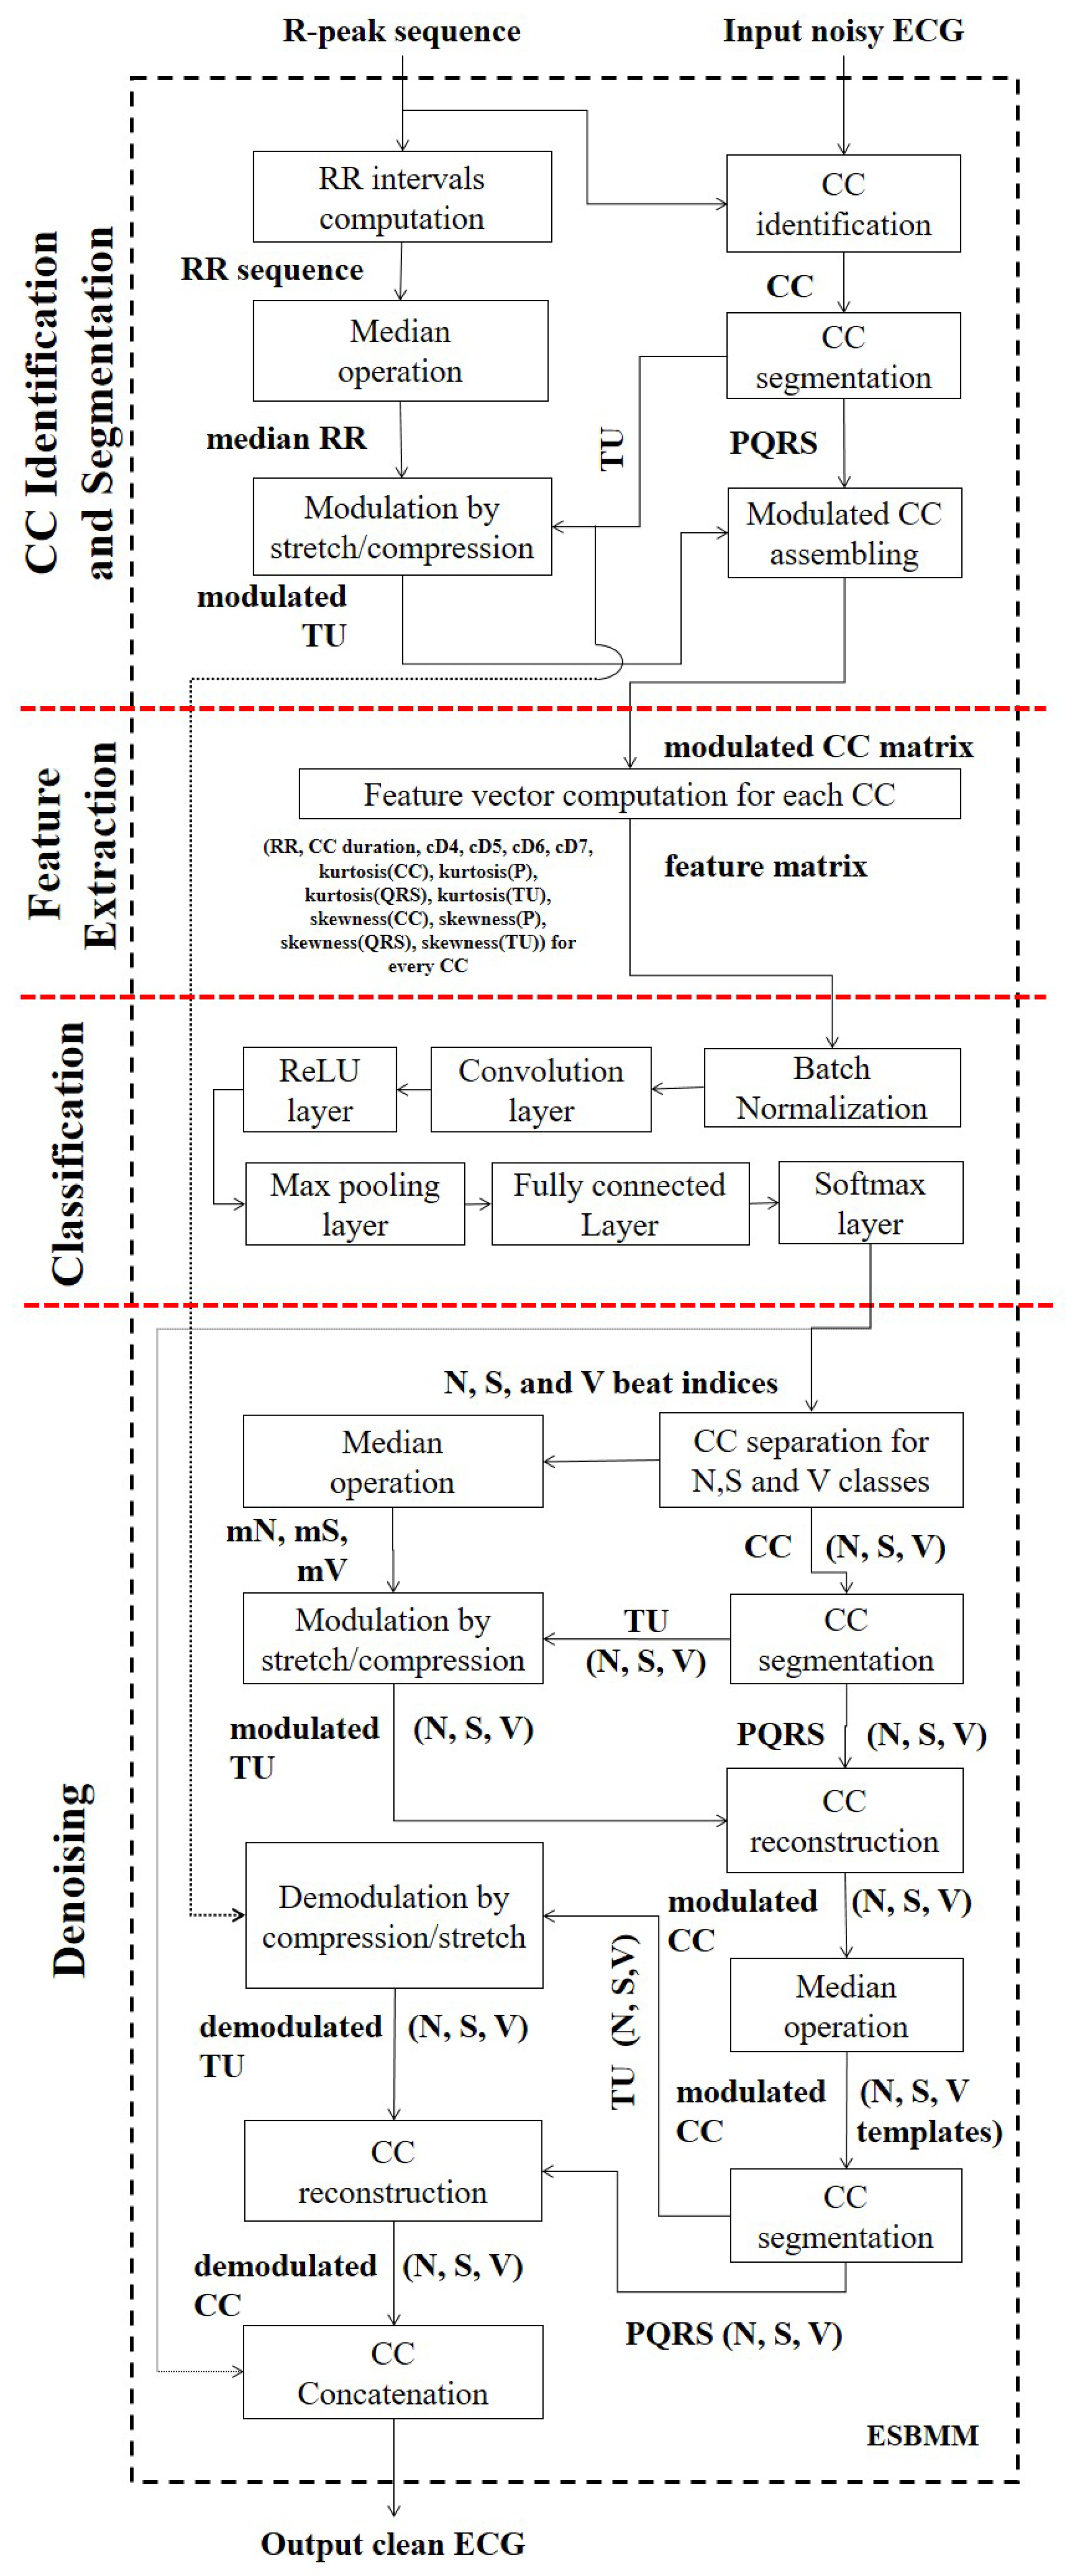
2.3. Extended Segmented Beat Modulation Method (ESBMM)

Similar to the originally proposed SBMM, ESBMM is applied to short ECG recordings, the length of which is defined by the user as number of beats (typically a few tens of beats) or time (up to one minute). In case of a longer ECG recording, ECG windows of the chosen length are recursively extracted from the ECG recording and then singularly submitted to the ESBMM. The ESBMM was proposed to overcome the SBMM’s main limitation of being applicable only in case of the normal sinus rhythm. The ESBMM is based on a different CC segmentation from the SBMM (Figure 1) and performs the following four steps (Figure 2): (1) a CC identification and segmentation step, in which each CC is segmented into PQRS and TU segments (instead of QRS and TUP segments as done in the SBMM); (2) a feature-extraction step, in which each CC is characterized in terms of temporal, morphological, and spectral features; (3) a classification step, based on a convolutional neural network (CNN), in which beats are classified as N, S, or V; and (4) a denoising step. A clean ECG estimate is obtained at the output to retain the heart rate and morphological variability of the input ECG. The proposed method was tested on the well-known MIT–BIH arrhythmia database [28] and evaluated under two performance criteria: (1) classification for normal (N), supra-ventricular (S), and ventricular (V) beat classes according to the patient-based assessment; and (2) denoising reporting signal-to-noise ratios for the ECG recordings in the database evaluated on the basis of noise cancellation assessment criteria. Details of the proposed procedure are reported below.

2.3.1. Cardiac Cycle Identification and Segmentation

According to the ESBMM, the CC onset fiducial mark is assumed at Δ t 1 before each R-peak position, and the CC offset as Δ t 1 before the succeeding R-peak position (typically, Δ t 1 = 250 ms) as shown in Figure 1. All CCs are then segmented into a PQRS segment (from Δ t 1 before the R-peak position until Δ t 2 after the R-peak position; typically, Δ t 2 = 40 ms) and TU segment (from Δ t 2 after the R-peak position until the end of CC). The TU segments are then modulated (stretched or compressed) to match the median TU length calculated over lengths of all TU segments (CC duration − ( Δ t 1 + Δ t 2 )). The CCs are then reconstructed by concatenating PQRS and modulated TU segments. The result is a batch consisting of all CCs of equal length. Figure 3 shows examples of CC waveforms for beats classified as N, S, and V, respectively.

2.3.2. Feature Extraction

For each CC, a feature vector was computed. The feature vector was constructed using the following: features related to temporal intervals, features obtained by applying discrete wavelet transform to the modulated CC, and statistical features. The features related to temporal intervals are RR interval and CC duration. The features based on the ’Daubechies 4’ wavelet transform of the modulated CC are obtained using decomposed wavelet coefficients at detail levels 4 to 7 (cD4, cD5, cD6, and cD7) [29]. The statistical features are kurtosis (4th order statistics) and skewness (3rd order statistics) calculated as in Equations (1) and (2), respectively, of the entire CC, and of P (onset: Δ t 1 ms before the R-peak position, offset: Δ t 2 ms before the R-peak position; Figure 1), QRS (onset: Δ t 2 ms before and after the R-peak position; Figure 1), and TU (onset: Δ t 2 ms after the R-peak position, offset: Δ t 2 ms before the next consecutive R-peak position; Figure 1) waves taken from the modulated CC since they represent the morphological distortion of the entire CC and of P, QRS, and TU waves, respectively.
kurtosis = i = 1 N ( x i x ¯ ) 4 / N s t d 4
skewness = i = 1 N ( x i x ¯ ) 3 / N s t d 3
where x ¯ is the mean, std is the standard deviation, and N is the number of data points. The final feature vector now becomes the RR interval, CC duration, cD4, cD5, cD6, cD7, kurtosis (CC), kurtosis (P), kurtosis (QRS), kurtosis (TU), skewness (CC), skewness (P), skewness (QRS), and skewness (TU).

2.3.3. Convolutional Neural Network Classification

The CNN classifier input consists of the number of parameters equal to the number of features extracted in the previous step and the number of samples equal to the number of beats in the ECG recording currently being processed. The output consists of three beat classes: normal (N), supraventricular (S) and ventricular (V) beat classes, respectively. Synthetic data are used to overcome the imbalance in the number of ECG heartbeats in the three classes according to the synthetic minority oversampling technique [30]. N class, in this case, is the majority class, hence, the number of the CCs in S and V classes is increased to match the number of CCs in the N class. The architecture of the implemented CNN is as follows: the input feature vector, batch normalization layer, convolution layer (kernel size: 3, filters: 16), fully connected layer (number of neurons: 16), fully connected layer (number of neurons: 3), and output SoftMax layer. True AAMI beat labels were used as references during training.

2.3.4. Denoising

Beats classified as N, S, and V were used to create three templates, one for each class. For each class, the median beat duration, the median PQRS duration, and the median TU duration are computed using the RR-intervals of all beats belonging to the same class. Each CC of each beat is then segmented into PQRS and TU segments. The TU segment of each beat is modulated (stretched/compressed) to match the median TU duration of its class. All CCs of all beats belonging to the same class are now characterized by the same length, and the template of that class can be obtain mediating all these beats. Finally, each noisy beat of noisy ECG is replaced by the demodulated (compressed/stretched) template of corresponding class.

2.4. Data

The data used for testing the classification and denoising efficiency of the proposed algorithm were taken from the MIT–BIH arrhythmia database developed by Massachusetts Institute of Technology (MIT) and Boston’s s Beth Israel Hospital (BIH) in 1987 and available as open source on Physionet [28,31]. Only limb lead II (as in [32]) of the 35 ECG recordings (ID 100, 101, 105, 106, 108, 109, 113, 114, 116, 118, 119, 123, 124, 200, 201, 202, 203, 205, 207, 208, 209, 210, 213, 214, 215, 217, 219, 220, 222, 223, 228, 231, 232, 233, 234) out of the 48 available ones were used here, since the remaining 13 were single beat-class recordings for which the proposed ESBMM simplifies into the SBMM. The 35 ECG recordings used were approximately 30 min long and were acquired from 35 subjects, 19 men (53 to 89 years old) and 16 women (23 to 89 years old). Approximately 60% of these recordings were obtained from inpatients. Recording numbers 100–124, with some numbers missing, include a variety of waveforms and artifacts that an arrhythmia detector might encounter in routine clinical use. Furthermore, recording numbers 200–234, again with some numbers missing, include a variety of rare but clinically important phenomena such as complex ventricular, junctional, supraventricular arrhythmias and conduction abnormalities. Each recording is supported by an annotation file made available by the MIT–BIH arrhythmia database, providing the positions of R-peaks and corresponding label for each heartbeat compiled by clinical experts [28,31]. From each ECG recording, ECG windows containing 30 consecutive beats were consecutively extracted to be analyzed from the ESBMM. A division of the dataset was used to train (60%) and test (40%) the ESBMM in the classification step of the methodology. True AAMI beat labels were used as references. ESBMM performance was evaluated on a PC workstation with two Intel(R) Core (TM) 3.40 GHz (CG8250) processors and 12 GB of RAM. Detail of the MIT–BIH database is provided in Table 1.

2.5. Validation Study

2.5.1. Classification

The ESBMM performance in classifying heart beats into the three N, S, and V classes was performed in terms of overall accuracy (Acc) and individual positive predictive value of each class (PP(N), PP(S), and PP(V), respectively) as computed in Equation (3) to Equation (6), respectively:
A c c = T N + T S + T V T N + F N + T S + F S + T V + F V ,
P P ( N ) = T N T N + F N ,
P P ( S ) = T S T S + F S ,
P P ( V ) = T V T V + F V ,
where, TN, TS, and TV represent correctly classified (true) N, S, and V beats, respectively, and FN, FS, and FP represent wrongly classified (false) N, S, and V beats, respectively.

2.5.2. Denoising

ESBMM performance in ECG denoising was assessed in terms of signal-to-noise improvement ( S N R i m p ) as given in Equation (7), where S N R i n and S N R o u t are the signal-to-noise ratio (in dB) of the ECGs at ESBMM input and output, respectively, and are defined as in Equations (8) and (9):
S N R i m p = S N R o u t S N R i n ,
S N R i n = 20 × l o g ( P e a k t o P e a k E C G i n 4 × s t d ( E C G i n ) ) ,
S N R o u t = 20 × l o g ( P e a k t o P e a k E C G o u t 4 × s t d ( E C G o u t ) ) ,
where P e a k T o P e a k E C G i n , o u t is an ECG signal-measure representing a median over maximum minus minimum amplitudes of all ECG beats and s t d ( E C G i n , o u t ) is a noise-measure representing standard deviation of E C G i n , o u t respectively. Normality of the S N R i m p value over the 35 ECG recordings was evaluated using the Lilliefors test. Non-normal distributions were described in term of median (50th percentile) and its [25–75th] percentiles range, and compared using the rank sum test. A median S N R i m p value statistically greater than zero (p-value < 0.05) indicates a significant improvement in signal quality, and thus a good denoising performance of the ESBMM.

2.6. Robustness to Noise Evaluation

In order to verify the ESBMM ability to properly classify beats and denoise ECG signals in noisy conditions, we performed the following evaluation: from each of the 35 selected recordings of the MIT database, we selected, if present, a 5-min ECG segment with at least 3 N, 3 S,and 3 V beat instances. This selection criterion was introduced to have a balanced number of beats in each class despite the reduction in ECG length. Successively, three different noise types typically affecting the ECG were added, which are baseline wander, muscle activity, and electrode motion artifacts. All noise signals were taken from the MIT–BIH Noise Stress Test database [33] also available on Physionet and consist of real noise recordings acquired through ECG electrodes located on the limbs to make the amplitude of the ECG component negligible (and thus not visible) with respect to that of the noise. Both clean and corrupted versions of each ECG segment were eventually submitted to the ESBMM in order to evaluate its robustness to noise in terms of Acc, PP(N), PP(S), PP(V), and S N R i m p .

3. Results

3.1. Validation Study

3.1.1. Classification

The proposed algorithm took approximately 273 min (approx. 4.5 h) to process all 35 ECG recordings. Table 2 represents data split into training and testing subsets, and the data split was carried out according to beat annotations provided with the dataset. A 60:40 division ratio of the total dataset into training and testing datasets led to the distribution of beats over the N, S, and V classes as reported in Table 2.
Confusion matrices relative to beat classification as N, S, and V for the training, testing and total datasets are reported in Table 3. Overall, more than 90% of the total beats were correctly classified. Values of Acc, PP(N), PP(S), and PP(V) for the testing, training, and total datasets are reported in Table 4.
Recording numbers 108, 114, 118, 124, 200, 201, 202, 205, 207, 210, 213, 215, 219, 223, 228, 233, and 234 each have N, S, and V beats. Recording numbers 100, 101, 113, 209, 220, 222, 231, and 232 each have N and S beats. Recording numbers 105, 106, 109, 116, 119, 123, 203, 208, 214, 217 contain N and V each. Recording number 102, 103, 104, 107, 111, 112, 115, 117, 121, 122, 212, 221, and 230 have no or single abnormal beat instances.

3.1.2. Denoising

S N R i m p distribution was not normal; its median value was 0.99 [0.15;2.66] dB, which was significantly higher than 0 (p < 0.05). Figure 4 shows, as an example, a noisy section of recording number 105 with E C G i n and E C G o u t computed using the proposed ESBMM algorithm; for this recording S N R i m p was 6.08 dB.

3.2. Robustness to Noise Evaluation

Overall, 33 5-min ECG segments were found to satisfy the criteria for the evaluation of the ESBMM robustness to noise. The results relative to this evaluation are reported in Table 5. Regarding classification, Acc and PP(N) were only slightly affected by noise; PP(S) decreased significantly only in the presence of electrode motion artifacts; and PP(V) was affected by all types of noise even though it remained at least at 60%. Eventually, S N R i m p was less than 2 dB in the absence of noise but increased in the presence of noise until exceeding 5 dB in the presence of electrode motion artifacts. Figure 5 shows, as an example, a 10 s section of recording number 202 with E C G i n corrupted by: (a) no additional noise; (b) baseline wander; (c) muscle activity; and (d) electrode motion and the respective E C G o u t computed using the proposed ESBMM algorithm.

4. Discussion

The current work proposes the ESBMM as an extended and improved version of the existing SBMM, which is able to denoise ECG tracings characterized by sinus as well as nonsinus rhythm. This feature makes the ESBMM applicable in many more applications than the SBMM. The main differences between the ESBMM and SBMM consist in a different segmentation of the cardiac cycle and in the insertion of a procedure for beat classification. According to the ESBMM, each cardiac cycle is still segmented into two segments, but the first (i.e., the PQRS segment) includes the P wave and the QRS complex, while the second (i.e., TUP segment) includes the T and U waves, respectively. Differently, according to the SBMM, the first segment (i.e., the QRS segment) includes only the QRS complex, while the second (i.e., the TUP segment) includes the T wave, the U wave, and the P wave of the successive cardiac beat. The reason for including the P wave in the same segment in which the QRS complex is present relies on the fact that the P wave and QRS complex both represent the same electric phenomenon, which is depolarization, though of the atria and ventricles, respectively. Consequently, they can be hypothesized to show a similar dependency of instantaneous heart rate. Moreover, evaluation of P-wave presence and morphology is fundamental for a beat classification (all supraventricular arrhythmias show abnormalities at P-wave level). Taking into account that the electrical activity of a cardiac beat starts with the P wave, when classifying a cardiac beat, its P wave has to be present in the segments representing it and not in the segments representing the previous one.
Beat classification relies on features related to temporal intervals (RR interval and CC duration), features obtained applying discrete wavelet transform to the modulated CC (cD4 to cD7), and statistical features (kurtosis and skewness). Since in each ECG recordings, after modulation of all TUPs, each CC is equal in length, the number of wavelet decomposed coefficients is the same for all beats. Asl et al. [29] reported that the representative and distinct components for each type of heartbeat can be found in the detail information at level 4 to 7. Hence, only the wavelet coefficients at detail levels 4 to 7 (i.e., cD4, cD5, cD6, and cD7, respectively) were used here as features for morphological classification. Zhang et al. [34] proved that the RR interval is a highly distinguishing factor for the separation of N and S beats, hence each CC had an associated RR-interval feature. The skewness and kurtosis are effective in estimating shape distortion of any signal compared to Gaussian distribution. They were well able to distinguish between V and other beats since the major difference of V beats with other types of beats is the shape [35]. Hence, the kurtosis of CC and skewness of CC were considered.
Beat classification was performed using a convolutional neural network which receives several temporal and morphological ECG features as input. Some of them were standard (such as the RR interval); others were obtained by analyzing the ECG signal using the discrete wavelet transform and by computation of higher order statistics. Several techniques have been previously proposed for classification of cardiac arrhythmic beats in the past years [32,34,36,37,38,39,40,41]. Table 6 proposes a comparison of the results obtained with the ESBMM against other methods that were tested on the same database. De Chazal et al. [42] used a simple feature set based on heartbeat and RR intervals plus wave morphology. Zhang et al. [34] presented a one-versus-one feature reduction strategy focusing on the disease-specific features supporting the traditional support vector machine binary classifier. Eventually, Chen et al. [32] proposed a combination of projected and dynamic features for arrhythmia classification and a support vector machine classifier to cluster heartbeats. As can be seen from Table 6, all methods were able to reliably classify N and V beats, but only the ESBMM was also able to reliably classify S beats. The numbers of false positives in V beats seems to be quite high. This effect could be due to the presence of bundle branch block beats in the class N, that could be erroneously classified in class V. Future studies will evaluate the possibility of including the bundle branch block beats in an additional fourth class, in order to solve this limitation of our approach.
The ESBMM is a template-based method for ECG denoising. It operates in short-term ECG. In case of long-term ECG, it is applied to short ECG windows recursively extracted from the long recording. This design choice allows one to maintain physiological ECG variability (time and amplitude) by significantly reducing the level of noise. However, thanks to the beat classification procedure, three templates (instead of one, as for the SBMM) are computed, one for each beat class (N, S, and V). Each template is obtained by performing the median computation over all beats belonging to a class, an operation which is known to reduce noise and to provide the most likely morphology in a class of beats. In order to perform the median operator, all CC needs to be modulated to have the same length. Indeed, the hypothesis behind the procedure is that each beat of a class is a slight modification of a class specific morphology (best represented by the median, i.e., the template). Thus, the beat modulation is only an intermediate step to obtain a denoised template for each class. Template waveforms are then concatenated, demodulated, and adjusted in order to provide an output clean ECG tracing characterized by the same beat-to-beat heart-rate variability characterizing the input noisy ECG.
The ESBMM’s ability to denoise ECG tracings is confirmed by the statistically significant improvement of the signal-to-noise ratio that, on average, was 0.99 dB, with peaks of up to 6.08 dB. The median limited improvement in the MIT–BIH arrhythmia database is not due to the fact that the ESBMM’s denoising ability is limited, but, rather, to the low level of noise affecting the recordings. The MIT–BIH arrhythmia database was chosen because it allowed us to evaluate the performance of the ESBMM in beat classification, which is the main novelty of the ESBMM with respect to the SBMM. However, the ESBMM’s robustness to corrupting factors such as baseline wanders, muscle activity, and electrode motion artifacts was also evaluated. The results confirm the ability of the method to estimate good quality ECG recordings in the presence of typical noises affecting the ECG, especially for the N class, analogous to what was previously observed for the SBMM [18,19]. Indeed, since in an ECG recording, the number of N beats is generally much higher than the number of S and V beats, the template of class N is typically much cleaner than the templates of class S and V. Consequently, PP(N) is much less affected by the presence of noise than PP(S) and PP(V).
This paper proposes the following:
  • A new ECG segmentation procedure that separates repolarization waveforms from depolarization waveforms;
  • A proposed feature vector composed of spectral, RR interval, and higher-order statistical features;
  • A convolutional neural network to classify cardiac beats into N, S, and V classes;
  • A denoising algorithm designed to separately construct median templates for N, S, and V beats and reconstruct the original ECG recording including arrhythmic beats to match the original beat duration and morphology.

5. Conclusions

In this paper, the extended segmented beat modulation method is proposed. The ESBMM proved to be a reliable tool to classify cardiac beats into N, S, and V classes and to denoise ECG tracings characterized by both sinus and nonsinus rhythms.

Author Contributions

Conceptualization, A.N. and L.B.; methodology, A.N.; validation, A.N., A.S. and M.M.; formal analysis, A.N. and A.S.; investigation, A.S.; resources, L.B and A.S.; writing—original draft preparation, A.N. and L.B.; writing—review and editing, A.S., M.M. and L.B.; supervision, L.B.; funding acquisition, L.B. All authors have read and agreed to the published version of the manuscript.

Funding

This research was funded by Fondazione Cariverona, Italy and by Department of Information Engineering (DII), Università Politecnica delle Marche grant number RSA-B2018.

Conflicts of Interest

The authors declare no conflict of interest.

Abbreviations

The following abbreviations are used in this manuscript:
AAMIAssociation for the Advancement of Medical Instrumentation
ANSIAmerican National Standards Institute
CCCardiac Cycle
CNNConvolutional Neural Network
ECGElectrocardiogram
ESBMMExtended Segmented Beat Modulation Method
NNormal sinus beat
SSupraventricular beat
SBMMSegmented Beat Modulation Method
VVentricular beat

References

  1. Meier, T.; Gräfe, K.; Senn, F.; Sur, P.; Stangl, G.I.; Dawczynski, C.; März, W.; Kleber, M.E.; Lorkowski, S. Cardiovascular mortality attributable to dietary risk factors in 51 countries in the WHO European Region from 1990 to 2016: A systematic analysis of the Global Burden of Disease Study. Eur. J. Epidemiol. 2019, 34, 37–55. [Google Scholar] [CrossRef] [PubMed] [Green Version]
  2. Naghavi, M.; Abajobir, A.A.; Abbafati, C.; Abbas, K.M.; Abd-Allah, F.; Abera, S.F.; Aboyans, V.; Adetokunboh, O.; Afshin, A.; Agrawal, A.; et al. Global, regional, and national age-sex specific mortality for 264 causes of death, 1980–2016: A systematic analysis for the Global Burden of Disease Study 2016. Lancet 2017, 390, 1151–1210. [Google Scholar] [CrossRef] [Green Version]
  3. Arrhythmia. Available online: https://www.nhlbi.nih.gov/health-topics/arrhythmia (accessed on 22 November 2019).
  4. Luz, E.J.D.S.; Schwartz, W.R.; Cámara-Chávez, G.; Menotti, D. ECG-based heartbeat classification for arrhythmia detection: A survey. Comput. Methods Programs Biomed. 2016, 127, 144–164. [Google Scholar] [CrossRef] [PubMed]
  5. Hoefman, E.; Bindels, P.J.; van Weert, H.C. Efficacy of diagnostic tools for detecting cardiac arrhythmias: Systematic literature search. Neth. Heart J. 2010, 18, 543–551. [Google Scholar] [CrossRef] [PubMed]
  6. Kutlu, Y.; Kuntalp, D. A multi-stage automatic arrhythmia recognition and classification system. Comput. Biol. Med. 2011, 41, 37–45. [Google Scholar] [CrossRef]
  7. Sahab, A.; Gilmalek, Y.M. An automatic diagnostic machine for ECG arrhythmias classification based on wavelet transformation and neural networks. Int. J. Circuits Syst. Signal Process. 2011, 5, 255–262. [Google Scholar]
  8. Vijayavanan, M.; Rathikarani, V.; Dhanalakshmi, P. Automatic classification of ECG signal for heart disease diagnosis using morphological features. Int. J. Comput. Sci. Eng. Technol. 2014, 5, 449–455. [Google Scholar]
  9. Alickovic, E.; Subasi, A. Medical decision support system for diagnosis of heart arrhythmia using DWT and random forests classifier. J. Med. Syst. 2016, 40, 108. [Google Scholar] [CrossRef]
  10. Yıldırım, Ö.; Pławiak, P.; Tan, R.S.; Acharya, U.R. Arrhythmia detection using deep convolutional neural network with long duration ECG signals. Comput. Biol. Med. 2018, 102, 411–420. [Google Scholar] [CrossRef]
  11. Shang, Z.; Zhao, Y.; Lian, Y. Removal of Baseline Wander Noise in ECG Signal Using Asymmetrical Frequency-Response Masking Bandpass Filters. In Proceedings of the 40th Annual International Conference of Engineering in Medicine and Biology Society (EMBC 2018), Honolulu, HI, USA, 18–21 July 2018; pp. 6002–6005. [Google Scholar]
  12. Da Poian, G.; Rozell, C.J.; Bernardini, R.; Rinaldo, R.; Clifford, G.D. Matched filtering for heart rate estimation on compressive sensing ECG measurements. IEEE Trans. Biomed. Eng. 2017, 65, 1349–1358. [Google Scholar] [CrossRef]
  13. Goel, S.; Tomar, P.; Kaur, G. An optimal wavelet approach for ECG noise cancellation. Int. J. Bio-Sci. Bio-Technol. 2016, 8, 39–52. [Google Scholar] [CrossRef]
  14. Jenkal, W.; Latif, R.; Toumanari, A.; Dliou, A.; El B’charri, O.; Maoulainine, F.M. An efficient algorithm of ECG signal denoising using the adaptive dual threshold filter and the discrete wavelet transform. Biocybern. Biomed. Eng. 2016, 36, 499–508. [Google Scholar] [CrossRef]
  15. Duhan, M. ECG De-noising Techniques and Optimal Feature Selection Using Principle Component Analysis. J. Telecommun. Switch. Syst. Netw. 2018, 5, 14–20. [Google Scholar]
  16. Artoni, F.; Delorme, A.; Makeig, S. Applying dimension reduction to EEG data by Principal Component Analysis reduces the quality of its subsequent Independent Component decomposition. NeuroImage 2018, 175, 176–187. [Google Scholar] [CrossRef] [PubMed]
  17. Xiong, P.; Wang, H.; Liu, M.; Liu, X. Denoising autoencoder for eletrocardiogram signal enhancement. J. Med. Imaging Health Inform. 2015, 5, 1804–1810. [Google Scholar] [CrossRef]
  18. Agostinelli, A.; Giuliani, C.; Burattini, L. Extracting a clean ECG from a noisy recording: A new method based on segmented-beat modulation. In Proceedings of the Computing in Cardiology Conference (CinC 2014), Cambridge, MA, USA, 7–10 September 2014; pp. 49–52. [Google Scholar]
  19. Agostinelli, A.; Sbrollini, A.; Giuliani, C.; Fioretti, S.; Di Nardo, F.; Burattini, L. Segmented beat modulation method for electrocardiogram estimation from noisy recordings. Med. Eng. Phys. 2016, 38, 560–568. [Google Scholar] [CrossRef] [PubMed]
  20. Agostinelli, A.; Sbrollini, A.; Burattini, L.; Fioretti, S.; Di Nardo, F.; Burattini, L. Noninvasive fetal electrocardiography part II: Segmented-Beat Modulation Method for signal denoising. Open Biomed. Eng. J. 2017, 11, 25–35. [Google Scholar] [CrossRef] [Green Version]
  21. Sbrollini, A.; Strazza, A.; Candelaresi, S.; Marcantoni, I.; Morettini, M.; Fioretti, S.; Di Nardo, F.; Burattini, L. Surface electromyography low-frequency content: Assessment in isometric conditions after electrocardiogram cancellation by the Segmented-Beat Modulation Method. Inform. Med. Unlocked 2018, 13, 71–80. [Google Scholar] [CrossRef]
  22. Agostinelli, A.; Giuliani, C.; Fioretti, S.; Di Nardo, F.; Burattini, L. Robustness of the segmented-beat modulation method to noise. In Proceedings of the 2015 Computing in Cardiology Conference (CinC), Nice, France, 6–9 September 2015; pp. 205–208. [Google Scholar]
  23. Nasim, A.; Della Santa, E.; Tanchi, D.; Sbrollini, A.; Marcantoni, I.; Morettini, M.; Burattini, L. GPU-Based Segmented-Beat Modulation Method for Denoising Athlete Electrocardiograms During Training. In Proceedings of the Computing in Cardiology Conference (CinC 2018), Maastricht, The Netherlands, 23–26 September 2018; Volume 45, pp. 1–4. [Google Scholar]
  24. Nasim, A.; Sbrollini, A.; Marcantoni, I.; Morettini, M.; Burattini, L. Compressed Segmented Beat Modulation Method using Discrete Cosine Transform. In Proceedings of the 41st Annual International Conference of the IEEE Engineering in Medicine and Biology Society (EMBC), Berlin, Germany, 23–27 July 2019; pp. 2273–2276. [Google Scholar]
  25. Nasim, A.; Pinti, F.; Gentili, A.; Belli, A.; Palma, L.; Pierleoni, P. Dynamic Segmented Beat Modulation Method for Denoising ECG Data from Wearable Sensors. In Proceedings of the International Conference on Sensing and Instrumentation in IoT Era (ISSI 2019), Lisbon, Portugal, 29–30 August 2019; pp. 1–4. [Google Scholar]
  26. EC57, A.A. Testing and Reporting Performance Results of Cardiac Rhythm and ST Segment Measurement Algorithms; Association for the Advancement of Medical Instrumentation: Arlington, VA, USA, 1998. [Google Scholar]
  27. Malik, M.; Hnatkova, K.; Sisakova, M.; Schmidt, G. Subject-specific heart rate dependency of electrocardiographic QT, PQ, and QRS intervals. J. Electrocardiol. 2008, 41, 491–497. [Google Scholar] [CrossRef] [PubMed]
  28. Moody, G.B.; Mark, R.G. The impact of the MIT–BIH arrhythmia database. IEEE Eng. Med. Biol. Mag. 2001, 20, 45–50. [Google Scholar] [CrossRef]
  29. Asl, B.M.; Setarehdan, S.K.; Mohebbi, M. Support vector machine-based arrhythmia classification using reduced features of heart rate variability signal. Artif. Intell. Med. 2008, 44, 51–64. [Google Scholar] [CrossRef] [PubMed]
  30. Chawla, N.V.; Bowyer, K.W.; Hall, L.O.; Kegelmeyer, W.P. SMOTE: Synthetic minority over-sampling technique. J. Artif. Intell. Res. 2002, 16, 321–357. [Google Scholar] [CrossRef]
  31. Goldberger, A.L.; Amaral, L.A.; Glass, L.; Hausdorff, J.M.; Ivanov, P.C.; Mark, R.G.; Mietus, J.E.; Moody, G.B.; Peng, C.K.; Stanley, H.E. PhysioBank, PhysioToolkit, and PhysioNet: Components of a new research resource for complex physiologic signals. Circulation 2000, 101, e215–e220. [Google Scholar] [CrossRef] [Green Version]
  32. Chen, S.; Hua, W.; Li, Z.; Li, J.; Gao, X. Heartbeat classification using projected and dynamic features of ECG signal. Biomed. Signal Process. Control 2017, 31, 165–173. [Google Scholar] [CrossRef]
  33. Moody, G.B.; Muldrow, W.; Mark, R.G. A noise stress test for arrhythmia detectors. Comput. Cardiol. 1984, 11, 381–384. [Google Scholar]
  34. Zhang, Z.; Dong, J.; Luo, X.; Choi, K.S.; Wu, X. Heartbeat classification using disease-specific feature selection. Comput. Biol. Med. 2014, 46, 79–89. [Google Scholar] [CrossRef] [PubMed]
  35. He, J.; Sun, L.; Rong, J.; Wang, H.; Zhang, Y. A pyramid-like model for heartbeat classification from ECG recordings. PLoS ONE 2018, 13, e0206593. [Google Scholar] [CrossRef] [PubMed]
  36. Martis, R.J.; Acharya, U.R.; Min, L.C. ECG beat classification using PCA, LDA, ICA and discrete wavelet transform. Biomed. Signal Process. Control 2013, 8, 437–448. [Google Scholar] [CrossRef]
  37. Ye, C.; Kumar, B.V.; Coimbra, M.T. Heartbeat classification using morphological and dynamic features of ECG signals. IEEE Trans. Biomed. Eng. 2012, 59, 2930–2941. [Google Scholar] [PubMed]
  38. Korürek, M.; Doğan, B. ECG beat classification using particle swarm optimization and radial basis function neural network. Expert Syst. Appl. 2010, 37, 7563–7569. [Google Scholar] [CrossRef]
  39. Yu, S.N.; Chou, K.T. Integration of independent component analysis and neural networks for ECG beat classification. Expert Syst. Appl. 2008, 34, 2841–2846. [Google Scholar] [CrossRef]
  40. De Chazal, P.; Reilly, R.B. A patient-adapting heartbeat classifier using ECG morphology and heartbeat interval features. IEEE Trans. Biomed. Eng. 2006, 53, 2535–2543. [Google Scholar] [CrossRef] [PubMed]
  41. Sahoo, S.; Kanungo, B.; Behera, S.; Sabut, S. Multiresolution wavelet transform based feature extraction and ECG classification to detect cardiac abnormalities. Measurement 2017, 108, 55–66. [Google Scholar] [CrossRef]
  42. De Chazal, P.; O’Dwyer, M.; Reilly, R.B. Automatic classification of heartbeats using ECG morphology and heartbeat interval features. IEEE Trans. Biomed. Eng. 2004, 51, 1196–1206. [Google Scholar] [CrossRef] [PubMed] [Green Version]
Figure 1. Cardiac cycle (CC) with its PQRS and TU segments, and associated RR interval according to extended segmented beat modulation method (ESBMM).
Electronics 09 01178 g001
Figure 2. Flow chart of the extended segmented beat modulation method (ESBMM).
Electronics 09 01178 g002
Figure 3. Examples of cardiac cycle (CC) waveforms for beats classified as normal (N; panel (a)), supraventricular (S; panel (b)) and ventricular (V; panel (c)).
Electronics 09 01178 g003
Figure 4. As an example, the figure depicts an electrocardiogram (ECG) window from recording number 105 at the input ( E C G i n ) and at the output ( E C G o u t ) of the extended segmented beat modulation method (ESBMM).
Electronics 09 01178 g004
Figure 5. As an example, the figure depicts an ECG window from recording number 202 at the input ( E C G i n ) and at the output of the extended segmented beat modulation method (ESBMM). In panel (a), E C G i n was not corrupted by additional noise. Differently, in panels (bd), E C G i n was corrupted by baseline wander, muscle activity, and electrode motion artifacts, respectively.
Electronics 09 01178 g005
Table 1. Association for the Advancement of Medical Instrumentation (AAMI) to MIT–BIH annotation mapping detail.
AAMIMIT–BIHBeat Description
NN or .Normal beat
LLeft bundle branch block
RRight bundle branch block
eAtrial escape beat
jNodal (junctional) escape beat
SSSupraventricular premature beat
AAtrial premature beat
aAberrated atrial premature beat
JNodal (junctional) premature beat
VVPremature ventricular contraction
EVentricular escape beat
!Ventricular flutter wave
Table 2. Number of beats per beat-class and datasets.
Dataset/ClassNSVTotal
Training41,0201646405746,723
Testing27,3461097270431,147
Total68,3662743676177,870
Table 3. Confusion matrices relative to beat classifications (normal (N), supraventricular (S), and ventricular) for the training, testing, and total datasets.
True/PredictedNSVTotal
TrainingN39,205765105041,020
S151604271646
V20234235134057
Total39,4222711459046,723
TestingN25,388722123627,346
S511019271097
V39119821152704
Total25,8301939337831,147
TotalN64,6031487227668,366
S662623542743
V59352356456761
Total65,2624633797577,870
Table 4. Values of overall accuracy (Acc), PP(N), PP(S), and PP(V) for the testing, training, and total datasets.
DatasetAccPP(N)PP(S)PP(V)
(%)(%)(%)(%)
Training94.8685.5797.4486.59
Testing91.5792.8492.8978.21
Overall93.5894.4995.6283.49
Table 5. Values of Acc, PP(N), PP(S), PP(V), and  S N R i m p for selected 5-minute ECG segments corrupted by various types of noise.
Noise TypeAccPP(N)PP(S)PP(V) SNR imp
(%)(%)(%)(%)(dB)
No additional noise93.3896.4876.3378.601.71 [0.46; 2.97]
Baseline wander91.3695.8875.4462.332.67 [1.76; 3.57]
Muscle activity91.5296.4573.1160.003.86 [3.01; 4.68]
Electrode motion artifacts91.1195.8552.8865.435.02 [3.30; 6.71]
Table 6. Beat classification performances over the MIT–BIH.
Method%Acc%PP(N)%PP(S)%PP(V)
ESBMM91.592.895.683.4
deChazal [42]81.999.238.581.9
Zhang [34]86.799.036.092.8
Chen [32]93.195.438.485.1

