Article

Automatic ECG Diagnosis Using Convolutional Neural Network

by
Roberta Avanzato
and
Francesco Beritelli
*
Department of Electrical, Electronic and Computer Engineering, University of Catania, 95125 Catania, Italy
*
Author to whom correspondence should be addressed.
Electronics 2020, 9(6), 951; https://doi.org/10.3390/electronics9060951
Submission received: 24 April 2020 / Revised: 1 June 2020 / Accepted: 5 June 2020 / Published: 8 June 2020
(This article belongs to the Special Issue Application of Neural Networks in Biosignal Process)

Abstract

:
Cardiovascular disease (CVD) is the most common class of chronic and life-threatening diseases and, therefore, considered to be one of the main causes of mortality. The proposed new neural architecture based on the recent popularity of convolutional neural networks (CNN) was a solution for the development of automatic heart disease diagnosis systems using electrocardiogram (ECG) signals. More specifically, ECG signals were passed directly to a properly trained CNN network. The database consisted of more than 4000 ECG signal instances extracted from outpatient ECG examinations obtained from 47 subjects: 25 males and 22 females. The confusion matrix derived from the testing dataset indicated 99% accuracy for the “normal” class. For the “atrial premature beat” class, ECG segments were correctly classified 100% of the time. Finally, for the “premature ventricular contraction” class, ECG segments were correctly classified 96% of the time. In total, there was an average classification accuracy of 98.33%. The sensitivity (SNS) and the specificity (SPC) were, respectively, 98.33% and 98.35%. The new approach based on deep learning and, in particular, on a CNN network guaranteed excellent performance in automatic recognition and, therefore, prevention of cardiovascular diseases.

1. Introduction

For many years, doctors have been aware that cardiovascular diseases constitute a class of diseases considered to be one of the main causes of mortality [1]. Cardiovascular diseases occur in the form of myocardial infarction (MI). Myocardial infarction, commonly referred to as heart attack, stands for the failure of heart muscles to contract for a fairly long period of time. Using appropriate treatment within an hour of the start of the heart attack, the mortality risk of the person who suffers from a heart attack in progress can be reduced.
When a heart condition occurs, the first diagnostic check consists of an electrocardiogram (ECG), which, therefore, is the main diagnostic tool for cardiovascular disease (CVD). The electrocardiograph detects the electrical activity of the heart during the test time, which is then represented on a graphic diagram that reflects cyclical electrophysiological events in the cardiac muscle [2]. By conducting a careful analysis of the ECG trace, doctors can diagnose a probable myocardial infarction. It is important, however, to underline that the sensitivity and specificity of manual detection of acute myocardial infarction are 91% and 51%, respectively [3].
Developing a computer-aided system to automatically detect MI would help the cardiologists make better decisions. Hence, lately, various studies have been conducted on automatic MI detection.
Given the nonlinearity of the heart anomaly classification, techniques based on neural networks have recently been adopted. In a precedent study, the authors proposed a training technique based on a radial basis probabilistic neural network (RBPNN) in order to offer an efficient solution in the diagnosis of cardiovascular illness [4]. The proposed method has been tested for ECG analysis and the detection of abnormal heartbeats that have been classified by the network in the related pathologies.
Recently, authors have successfully experimented with the newest and most innovative neural network (NN) models [5,6] and, more specifically, machine and deep learning techniques, such as the convolutional neural networks (CNN) and audio biometrics techniques [7,8,9]. CNN has been utilized in arrhythmia detection, coronary artery disease detection, and beats classification [10,11,12]. A deep belief network has been used to classify signal quality in ECG [13].
Some researchers have implemented 11-layer CNN to detect MI [14]. The authors have demonstrated the use of a shallow convolutional neural network, only focusing on inferior myocardial infarction. This network benefits from the use of varying filter sizes in the same convolution layer, which allows it to learn features from signal regions of varying lengths.
In [15], the authors proposed a classification system of cardiovascular diseases using the MLP (Multi Layer Perceptron) network and the CNN network. In particular, they compared the results obtained by both models, using the same data set but different classes. There were two classes used in the MLP network: “arrhythmias” and “normal”, while nine classes were used for 4-layer CNN. ECG data used for the training/validation and test dataset were downloaded from PhysioBank.com and kaggle.com. This study showed low performance both using the MLP network and the CNN network, i.e., 88.7% and 83.5%, respectively.
There are many other studies that deal with the classification of heart disease via the ECG signal using deep learning algorithms based on convolutional neural networks. Table 1 shows the list of the main techniques comparing the learning models used, the parameters of CNN implemented, and the obtained performance.
Many other papers extract functionality from the PQRST complex and take advantage of machine learning algorithms based on other techniques. In [19], the authors used rough sets (RS) and quantum neural network (QNN) to recognize electrocardiogram (ECG) signals. For feature extraction (Peaks-P, Q, R, S, and T waves), after normalization of signals, the wavelet transform (WT) was used. Then, the attribute reduction of RS was applied as preprocessor so that redundant attributes and conflicting objects could be deleted from the decision-making table but retain efficient information losslessly. After that, the classification modeling and forecasting test based on QNN was trained using a gradient descent method; the accuracy of these systems was 91.7%.
In [20], RR interval is calculated using the recordings from the MIT-BIH Arrhythmia Database. MLPNN and SVM (Support Vector Machine) classifiers are compared in this paper. Results show that MLPNN is good for testing performance, while SVM shows good training performance.
In [21], the authors proposed a survey on the classification of ECG signals based on machine learning techniques other than CNN.
Table 1 of the study highlights the main techniques for classifying ECG signals, including the number of features, feature names, pre-processing techniques, database, modeling techniques, performance measures used, and accuracy achieved in each paper.
This paper proposed a low-complexity solution for automatic heart disease recognition based on the direct application of a CNN-based classification network to EGC signals, thus bypassing any possible heart disease ECG signals from the time domain to other domains, e.g., frequency domain as MFCC (Mel-Frequency Cepstral Coefficients), wavelet, etc. This paper evaluated the performance of a classifier in the following three classes: “normal”, “atrial premature beat”, and “premature ventricular contraction”. The obtained performances were remarkable.

2. ECG Signal and Dataset

From a graphic or numerical point of view, electrocardiogram (ECG) represents the electrical activity of the heart during its operation. The most important elements of an ECG waveform, which repeats for each cardiac cycle, are shown in Figure 1.
ECG is carried out to provide information about different heart diseases that a person can suffer from [22], in order to guarantee effective therapy.
According to international conventions, the specific points that are identified in the trace of an electrocardiogram are labeled with the letters P, Q, R, S, T and, in particular, are the following:
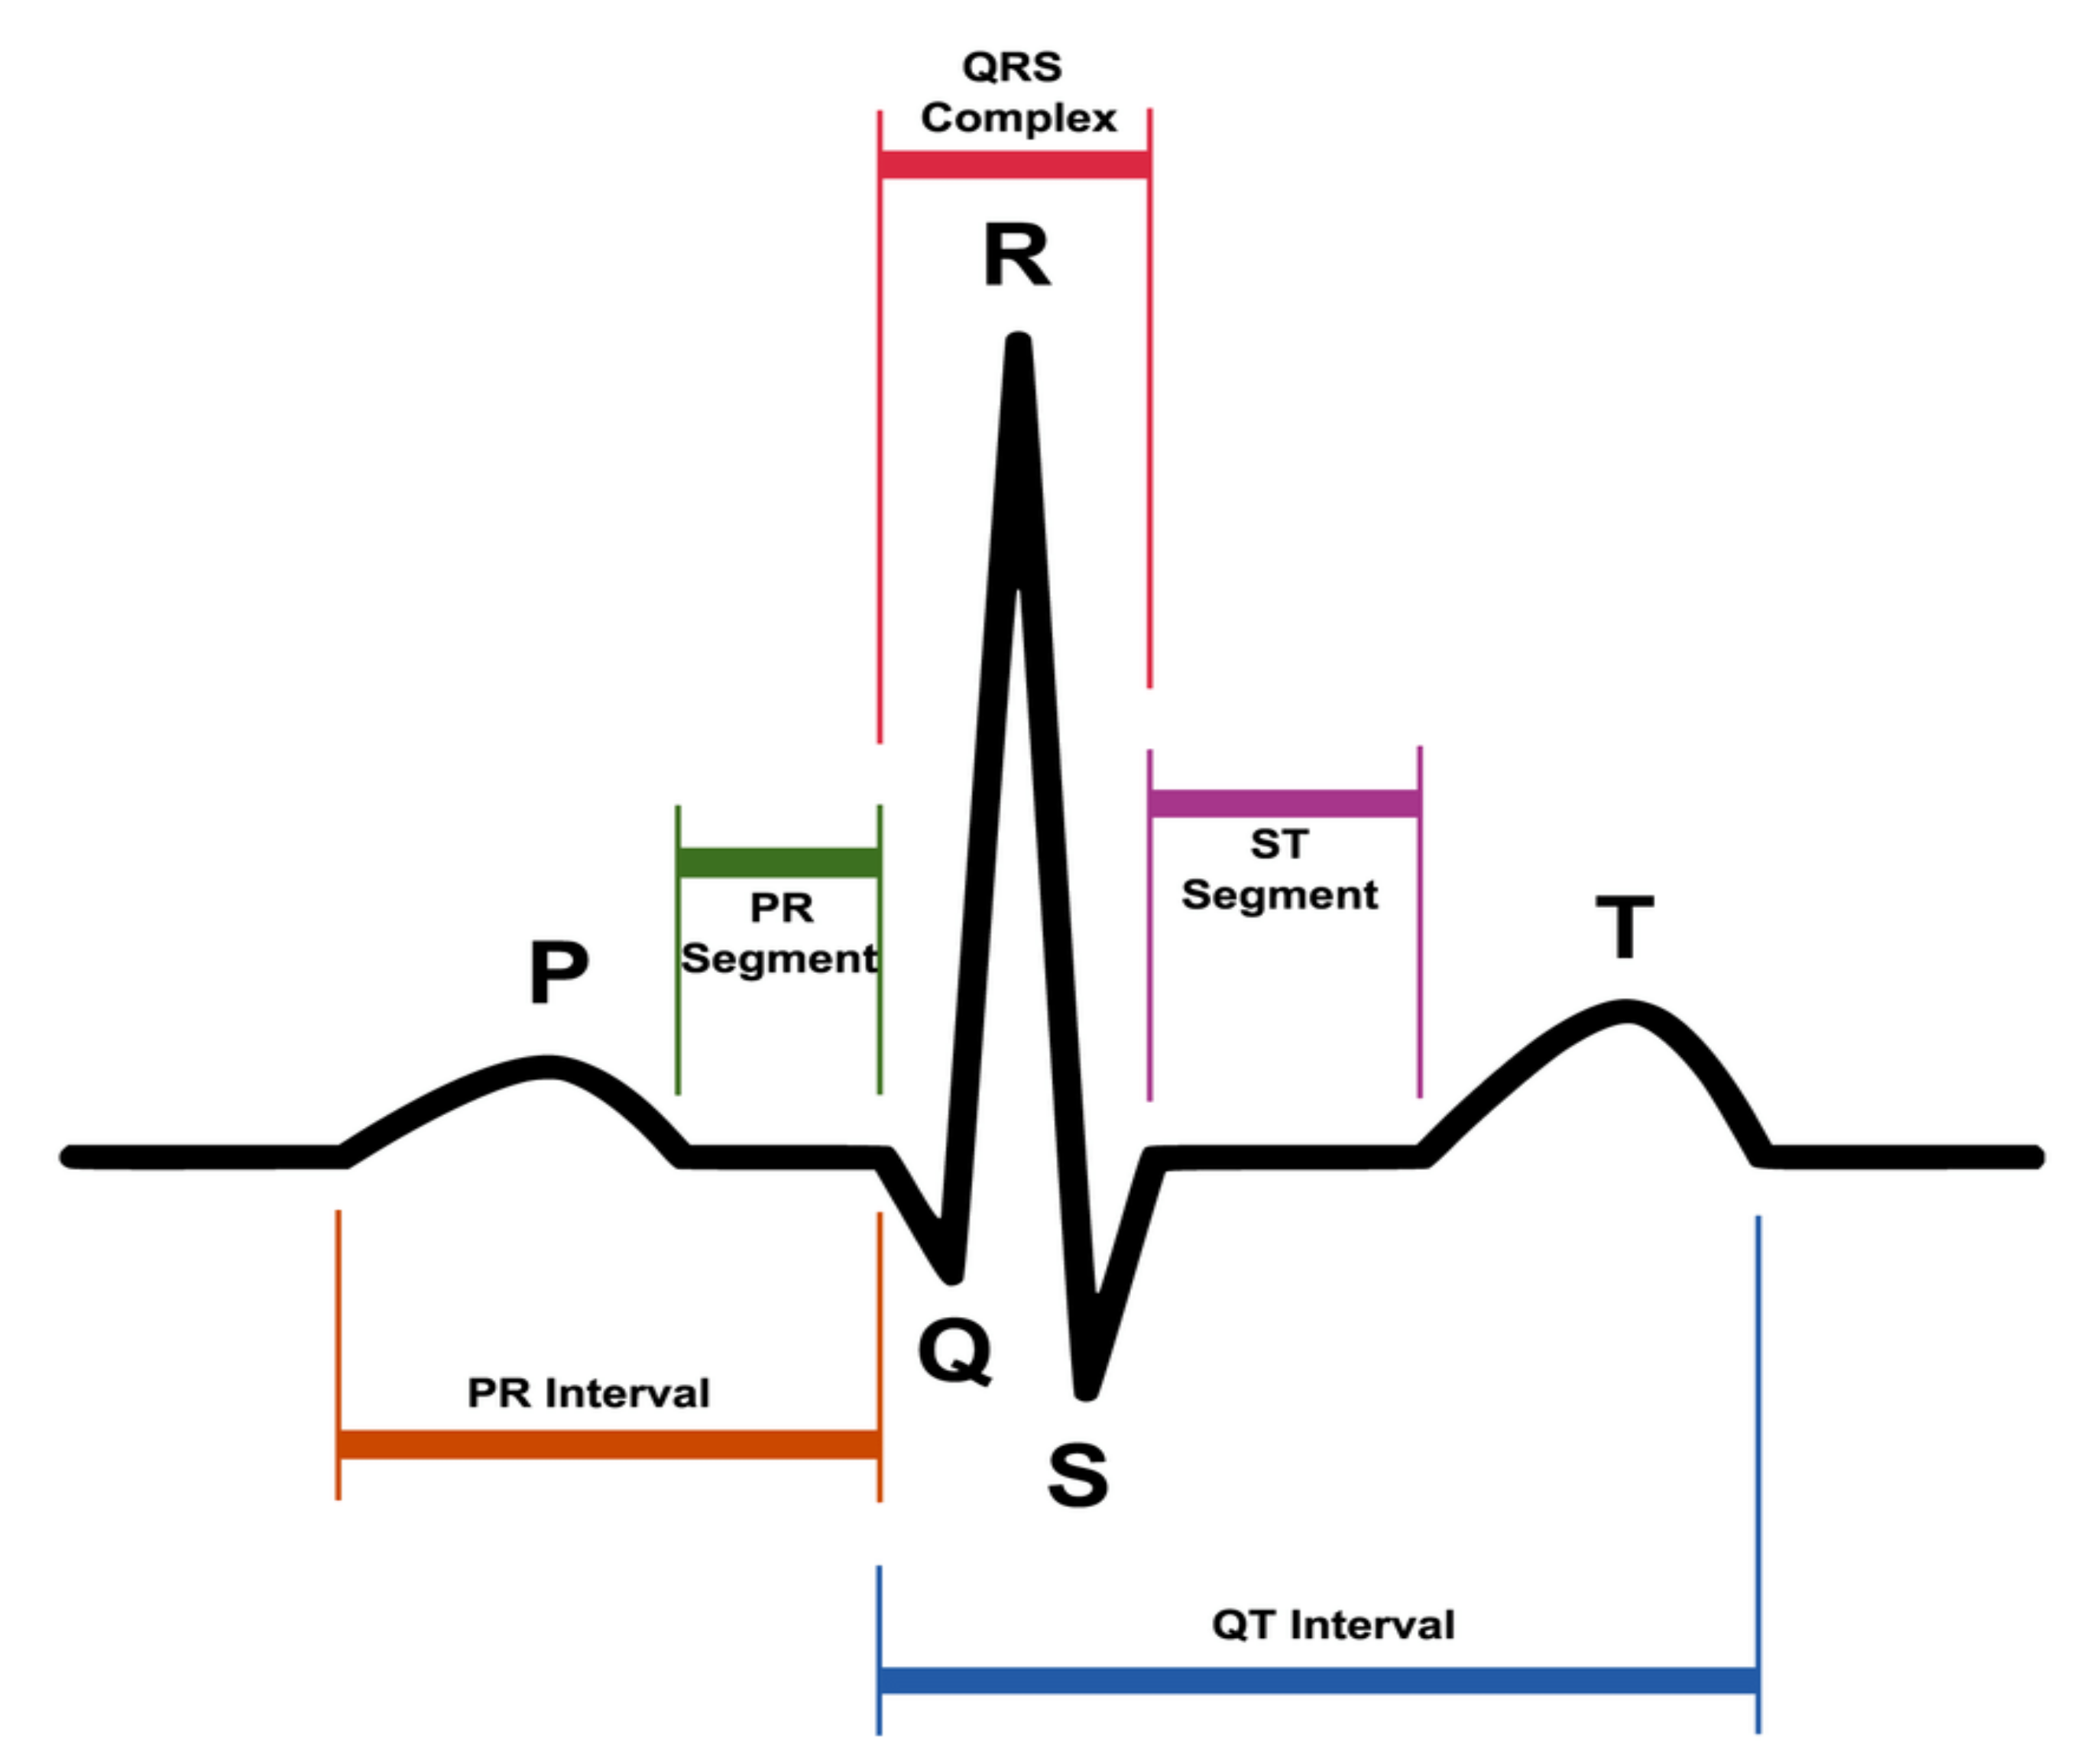
  • P wave: the first wave that occurs in the ECG cycle, a small deflection that represents atrial depolarization or most commonly called “atrial contraction”;
  • T wave: represents the depolarization of ventricles or most commonly called “ventricular relaxation”;
  • Q, R, and S waves: together, these waves form the so-called QRS complex. The QRS complex represents the contraction of the ventricles or, technically speaking, the depolarization complex of the ventricles. In particular, the Q wave represents the depolarization of the interventricular septum, the R wave reflects the depolarization of the main mass of the ventricles, and the S wave is the final depolarization of the ventricles at the base of the heart.
Taken together, the P, Q, R, S, and T waves make up the so-called PQRST complex. Cardiologists denote the interval between two PQRST complexes by the term “R-R interval”, which corresponds to a cardiac cycle.
Other parameters, which have been extensively used to make medical diagnoses using the ECG trace, are:
  • PR interval or PQ interval: the PR interval is a stretch formed by the P wave and the PR segment (rectilinear stretch) that begins with the P wave, that is, during the first deflection, and ends at the QRS complex. This interval indicates the time that the depolarization wave takes propagating from the atrial sinus node along the part of the electrical conduction system of the heart present on the myocardium;
  • ST segment, i.e., the time between the end of the QRS complex and the start of the T wave;
  • QT interval, i.e., the time between the beginning of the QRS complex and the end of the T wave, which is the electrocardiographic manifestation of ventricular depolarization and repolarization [23].
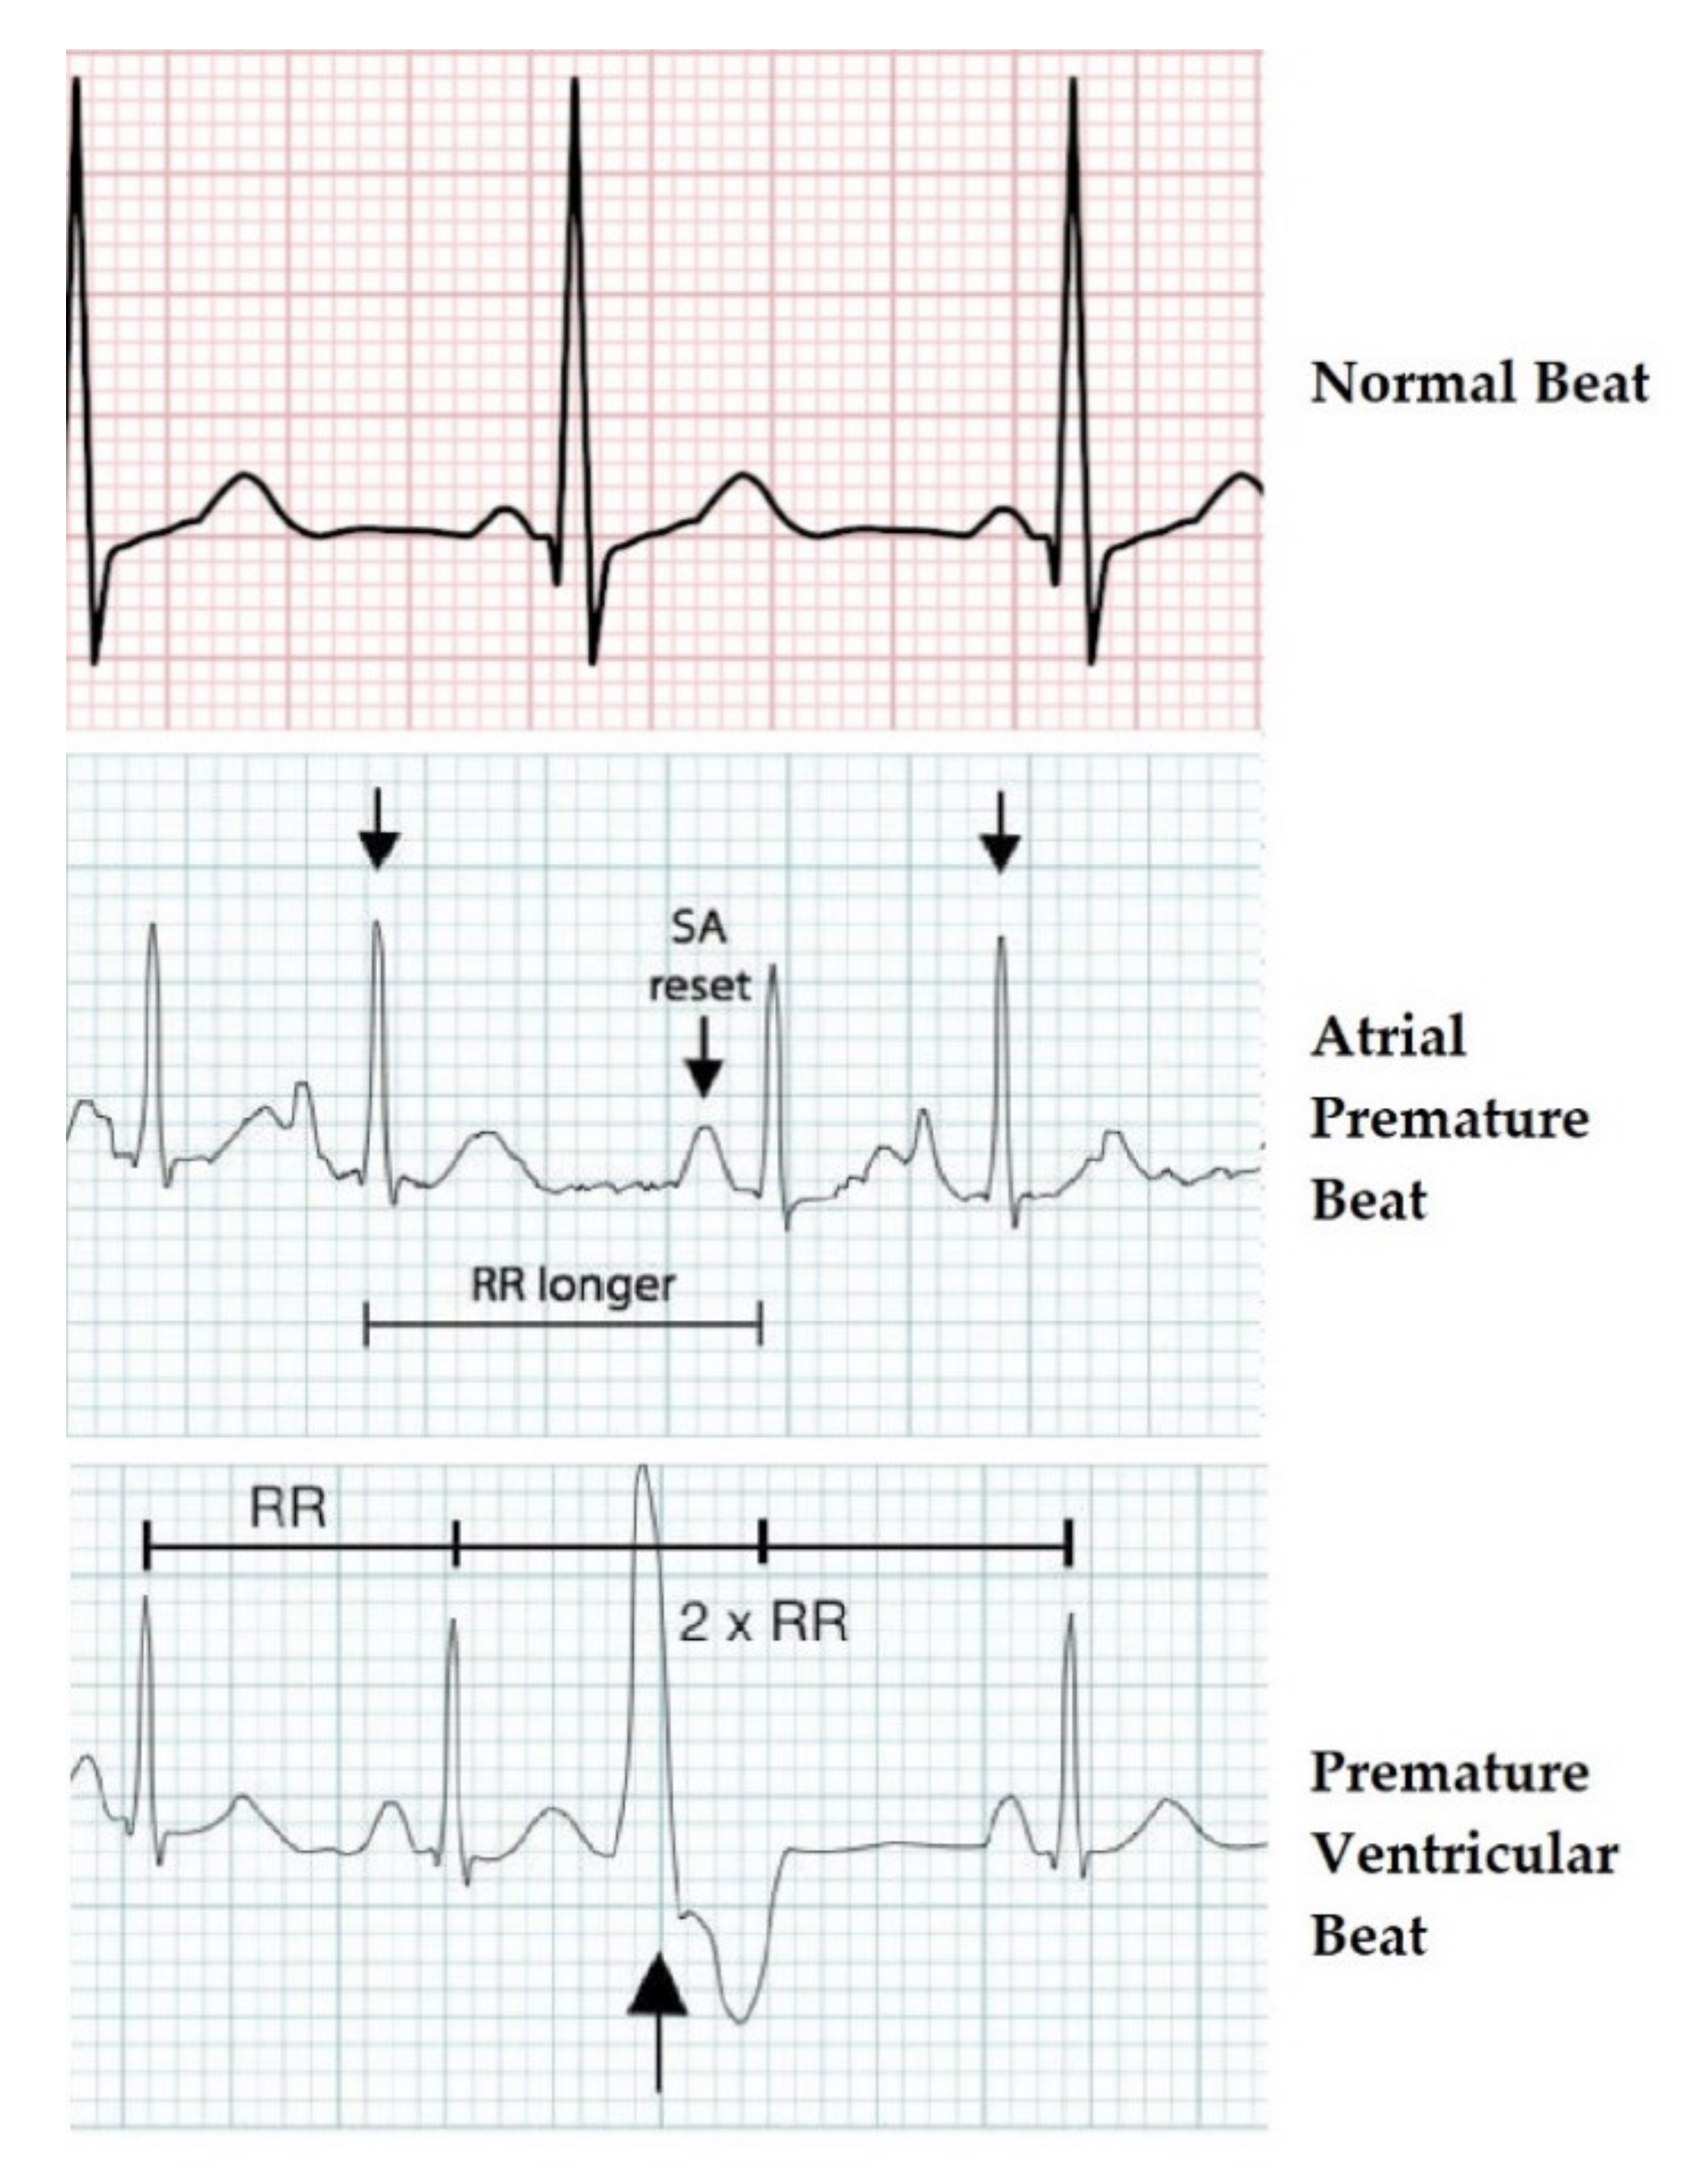
When an ECG is performed on a patient suffering from heart disease, the diagram outlines a different waveform from that shown in Figure 1. For example, the QT interval may be longer than normal, indicating that the patient may be suffering from a ventricular arrhythmia; the ST segment may have an elevation, which may be associated with myocardial infarction [24,25].
One of the most commonly used databases on the field is PhysioNet [26,27]; in particular, the MIT-BIH arrhythmia database was used in this study, as shown in Table 1. A large collection of recorded physiologic signals is available under the Open Data Commons—Public Domain Dedication & Licence v1.0 [28].
The PhysioNet database is composed of 48 ECG recordings of two-channel ambulatory, each 30 min long, associated with different clinical pathologies (e.g., ventricular and supraventricular arrhythmia, ventricular tachyarrhythmia, atrial fibrillation, etc.).
The database contained ECG recordings from 47 subjects: 25 males aged between 32 and 89 years and 22 females aged between 23 and 89 years. Twenty-three recordings were chosen at random from a set of 4000 24-h ambulatory ECG recordings collected from a mixed population of inpatients (about 60%) and outpatients (about 40%) at Boston’s Beth Israel Hospital; the remaining 25 recordings were selected from the same set to include less common but clinically significant arrhythmias that would not be well-represented in a small random sample. The recordings were digitized at 360 samples per second per channel with an 11-bit resolution over a 10 mV range.
Cardiologists independently annotated each recording; disagreements were resolved to obtain the computer-readable reference annotations for each beat (approximately 110,000 annotations in all) included in the database.
The database is made up of three classes:
  • Normal;
  • Atrial premature beat;
  • Premature ventricular contraction.
Figure 2 shows the differences in the ECG wave between the normal beat, the premature atrial beat, and the premature ventricular contraction. The first graph of Figure 2 shows the ECG wave of a normal beat, i.e., a heartbeat not affected by pathologies. This graph could be traced back to the “ideal” one in Figure 1. The second graph shows the ECG wave affected by a premature atrial beat or premature atrial contraction (PAC).
It was a common cardiac dysrhythmia characterized by premature heartbeats originating in the atria. While the sinoatrial node typically regulated the heartbeat during normal sinus rhythm, PACs occurred when another region of the atria depolarized before the sinoatrial node and thus triggered a premature heartbeat. Therefore, the difference from a normal ECG wave lied in the PR segment that was formed prematurely. In Figure 2, “RR longer” stands for the time between QRS complexes, while “SA reset” indicates the reformation of electrical impulse beginning in the sinoatrial (SA) node and propagating to the atrioventricular (AV) node.
The third graph shows an ECG wave affected by premature ventricular contraction (PVC).
It was a relatively common event where the heartbeat was initiated in the ventricles rather than by the sinoatrial node.
From what has been said, it is clear now how an automatic diagnosis system must perform in detecting these differences in duration and shape of the waves and segments that make up the PQRST complex.
The used dataset was not recorded by the authors but originated from a 2001 study by Moody et al. [26]. Therefore, the authors were not responsible for the applied data collection procedure. Original authors of the database stated that all ethical requirements had been followed. Moreover, the database is available online for an extended period now and has been used extensively in many recent publications (see Table 1). Finally, all records in the database have been anonymized.

3. ECG Diseases Classification Based on CNN

3.1. CNN General Characteristics and Architecture Adopted

Convolutional neural networks, or CNNs, are a specialized kind of neural network for processing data that has a known grid-like topology. Examples include time-series data, which may be considered as a 1-D grid taking samples at regular time intervals, and image data, which may be considered as a 2-D grid of pixels.
The general characteristics and architecture of this network are described in [29], where the only difference is the sample rate used. In this study and also in [30], the sample rate was 44.1 kHz instead of 8 kHz.
The deep convolutional neural network is mainly composed of:
  • 1D convolution layers;
  • Batch normalization layers;
  • ReLU (Rectified Linear Units) layers;
  • Pooling layers;
  • Softmax.
Only in the first convolution, a convolutional kernel composed of 80 elements was used, with respect to the subsequent convolution layers where it was set to 3, with the aim of reducing the computational cost.
After each convolution, Batch normalization was carried out to avoid the explosion of the parameters and the phenomenon of “vanishing gradients”. Batch normalization allowed training deep networks and was applied after each convolutional layer and before performing the ReLU (rectified linear activation function). The level of pooling in CNN, placed before RELU, reduced the problem of data overfitting by the network, taking the input size by half the actual input.
Unlike the classic CNN, which use fully connected neurons as their output layer, this network performed a single AvgPool and then a LogSofMax softmax, followed by a natural logarithm log (softmax (x)).
The structure of the proposed network is illustrated in Table 2 below.
Figure 3 shows the structure of the proposed convolutional neural network.
Deep neural networks could both extract and classify the representation of features, rather than perform these two functions separately. After being processed, the ECG recording was sent to the CNN network as an input for the classification of pathologies by means of the ECG signal in three classes: normal, atrial premature beat, and premature ventricular contraction, based on convolutional neural networks (CNN).

3.2. Training/Validation and Testing Dataset

Neural network input consists of 30-s segments where every second of ECG recording is equivalent to 360 samples, for a total of 10,800 samples.
So, dataset presents the following classes:
  • “Normal” class, containing 1421 ECG segments;
  • “Premature ventricular contraction” class, containing 335 ECG segments;
  • “Atrial premature beat” class, containing 133 ECG segments.
This dataset was subsequently divided into two different datasets, see Figure 4 below:
  • Training/validation set, consisting of 995 segments for the “normal” class, 234 segments for the “premature ventricular contraction” class, and 93 segments for the “atrial premature beat” class. The 70% of this set was used for the training, and the other 30% was used for the testing;
  • Testing set, consisting of 426 segments for the “normal” class, 101 segments for the “premature ventricular contraction” class, and 40 segments for the “atrial premature beat” class.
At first, the network was trained by entering the data relating to the “training set” as input, then it was validated using the “validation set”, in order to evaluate the performance of the neural network (the percentage of loss and accuracy). Finally, the “testing set” was applied to validate and verify, through the accuracy estimate, the robustness of the neural network to data external to the training/validation set.

4. Methods

As previously stated, for the purposes of performance evaluation, the proposed study used the PhysioNet database, typically employed as a reference database in the automatic classification of cardiac pathologies based on ECG signals. From this dataset, the data relating to learning and testing of the neural network was obtained for the assessment of classification accuracy. Accuracy indicated that the network performed great classification of the two classes related to heart disease (“atrial premature beat” and “premature ventricular contraction”) and the one relating to the state of good health. Based on the results obtained from the confusion matrix, it was possible to evaluate the proposed method, applying the statistical classification functions [31]: sensitivity, also known as a true positive ratio (TPR), specificity, also known as a true negative ratio (TNR), Fall - Out, also known as a false positive ratio (FPR), and the measure of the test accuracy.
Hence, it was possible to define the meaning of each statistical classification parameter described above: sensitivity indicated the percentage of ECG recordings belonging to a specific category and correctly classified in that category; specificity measured how often the classifier could classify the ECG recordings not belonging to that category; Fall–Out indicated that ECG recordings were considered to belong to a specific category, but, in reality, they were not part of it; false discovery ratio indicated that ECG recordings were not considered to belong to a specific category but that, in reality, they were part of it; F1 score took into account precision and recovery of the test, where precision was the number of true positives (TP) divided by the number of all positive results, i.e., true positives (TP) plus false positives (FP); while recovery was the number of true positives (TP) divided by the number of all tests that should have been positive, that is, true positives (TP) plus false negatives (FN).
The following equations relate to the classification functions previously described.
TPR   = TP TP + FN ,
TNR   = TN FP + TN ,
FPR   = 1 TNR ,
FDR   = FP FP + TP   ,
F 1 = 2 TP 2 TP + FP + FN .

5. Performance Analysis
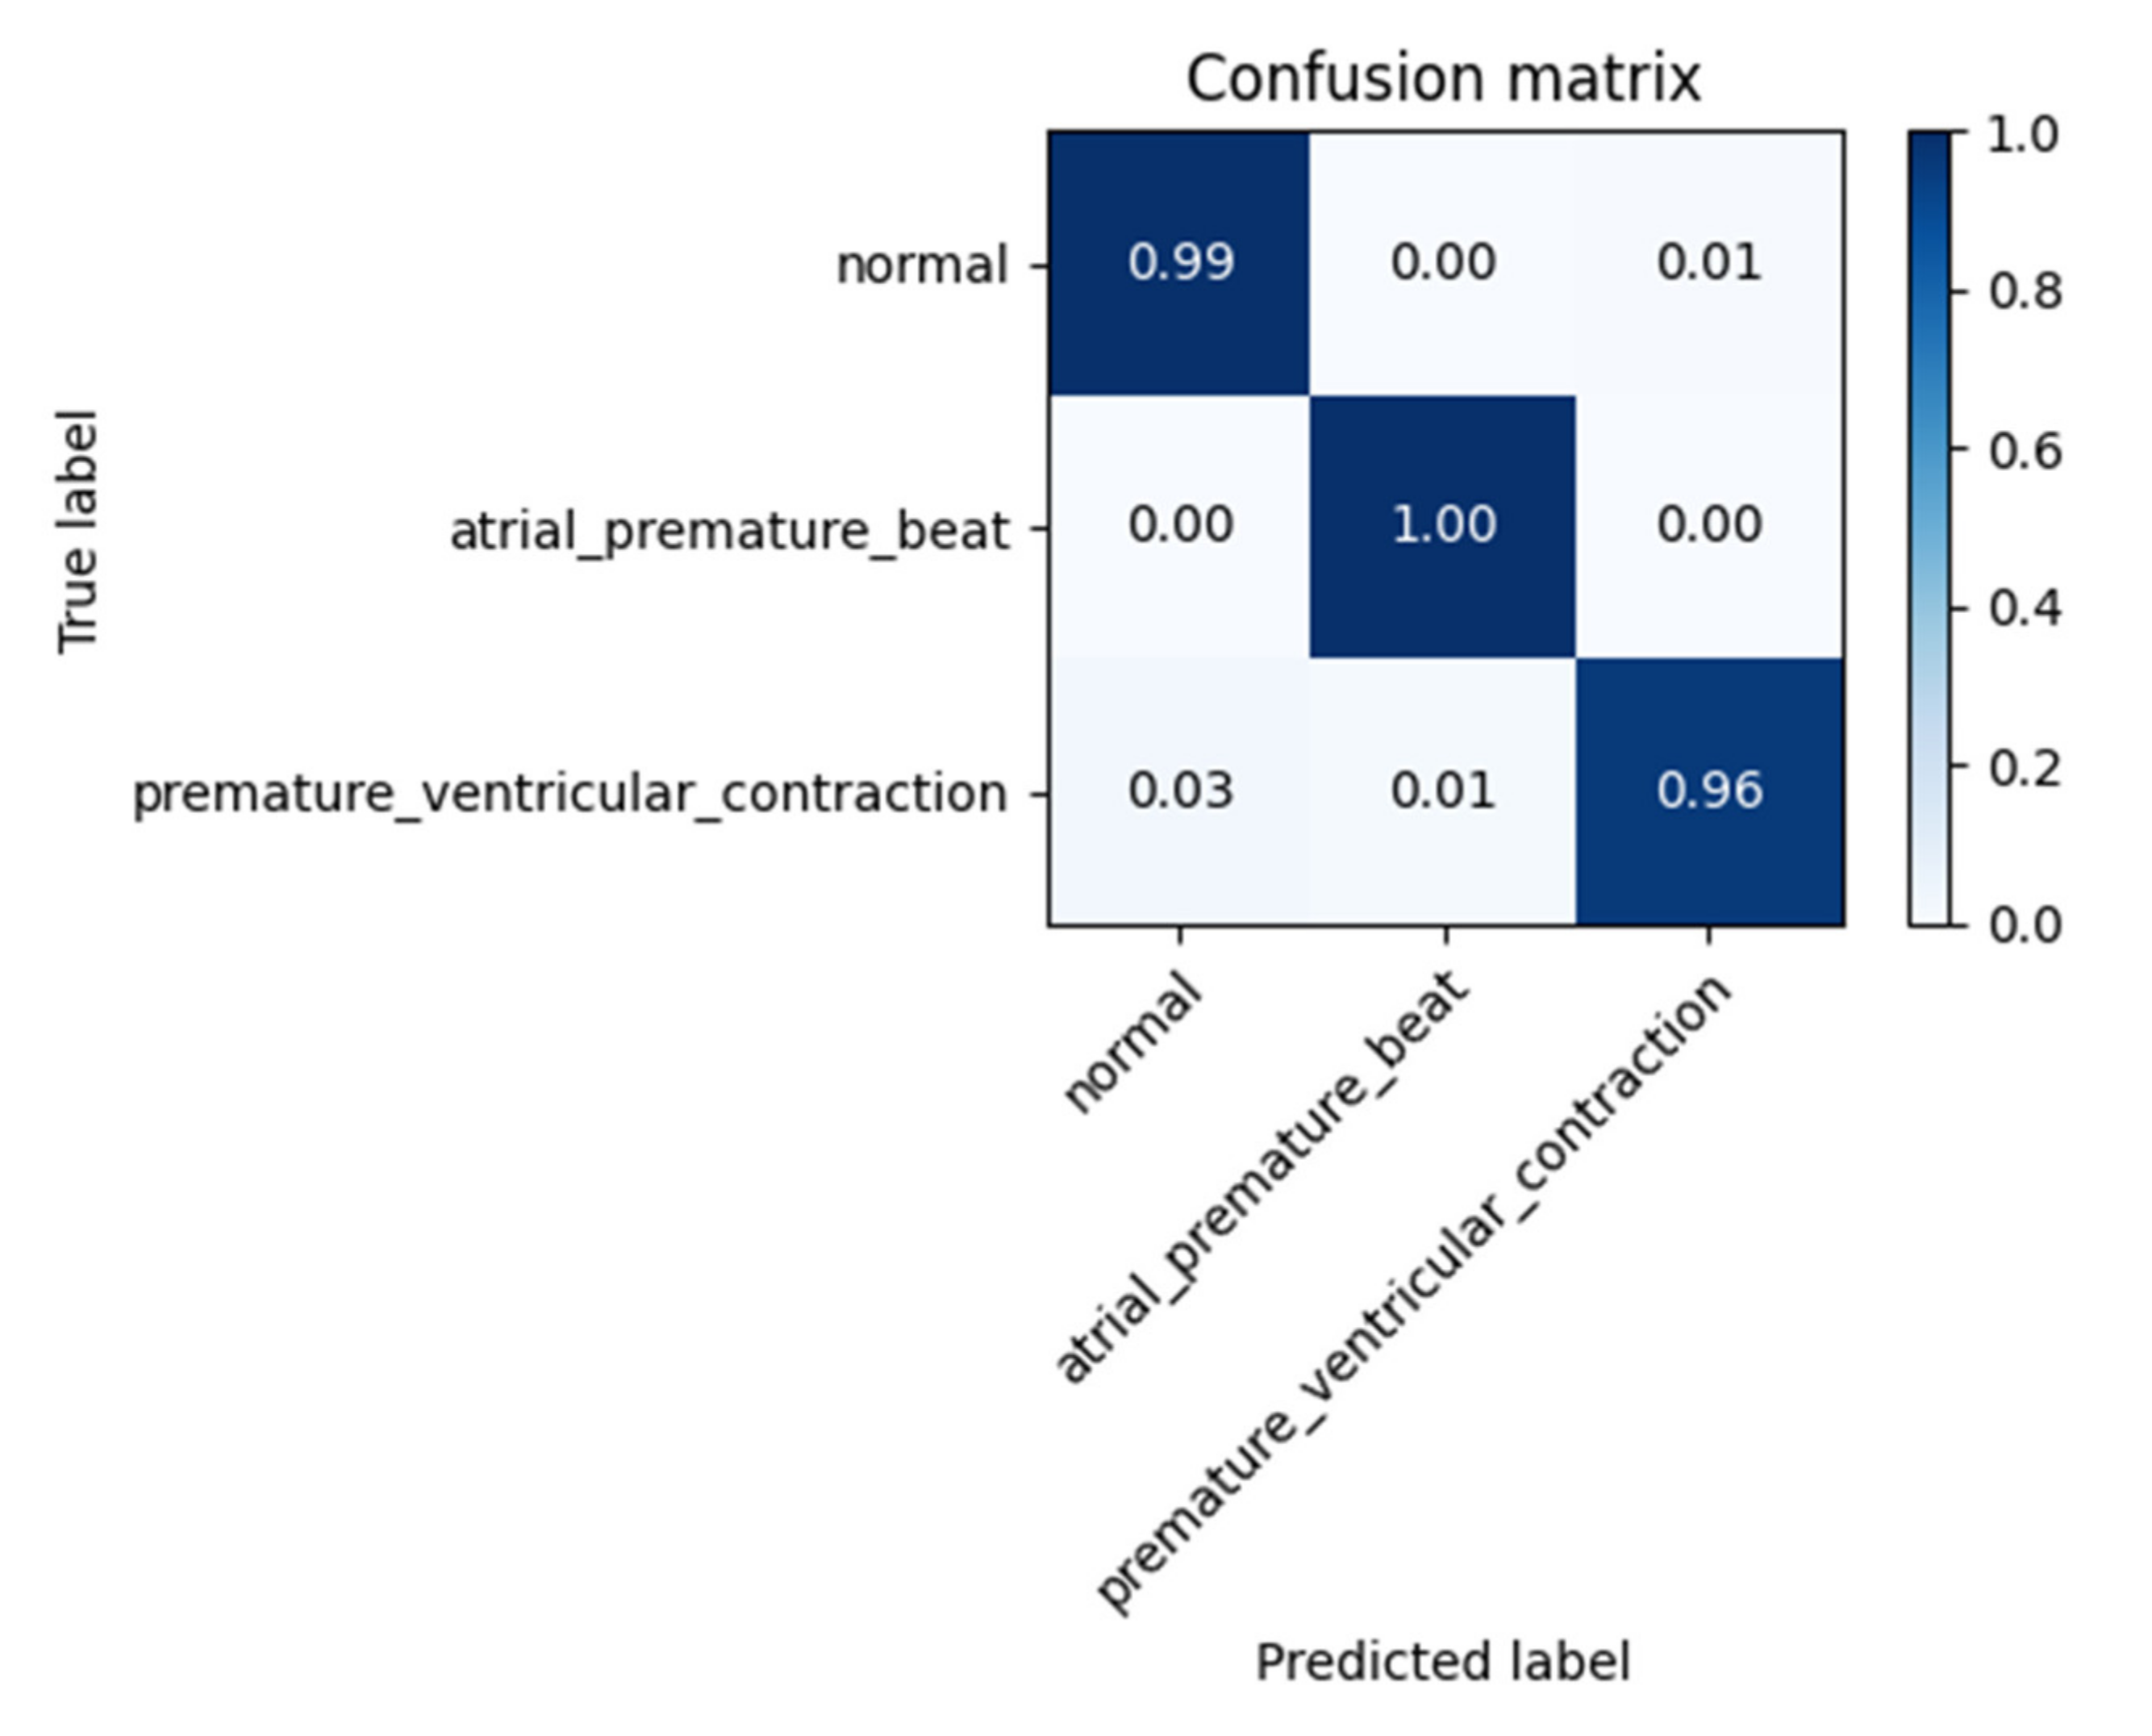
5.1. Test Results

In this section, the results of training and subsequent validation of the neural network are presented and discussed. Figure 5a,b represents the progress of the training and validation loss and the progress of the training and validation accuracy, respectively. As the graphs show, after 100 epochs, training and validation losses stabilized at a value close to zero (Figure 5a), while training and validation accuracy stabilized at 100%.
Such data were very encouraging, as it was understood that there was a good percentage of accuracy in the classification of the three classes described above.
In order to evaluate the performance of the CNN network with ECG sequences external to the training dataset, the accuracy obtained with the “testing set” was assessed. Figure 6 shows the relative confusion matrix.
The matrix highlighted an average classification accuracy level of 98.33%.
The results obtained in terms of the statistical parameters described in Section 5 are shown in Table 3.

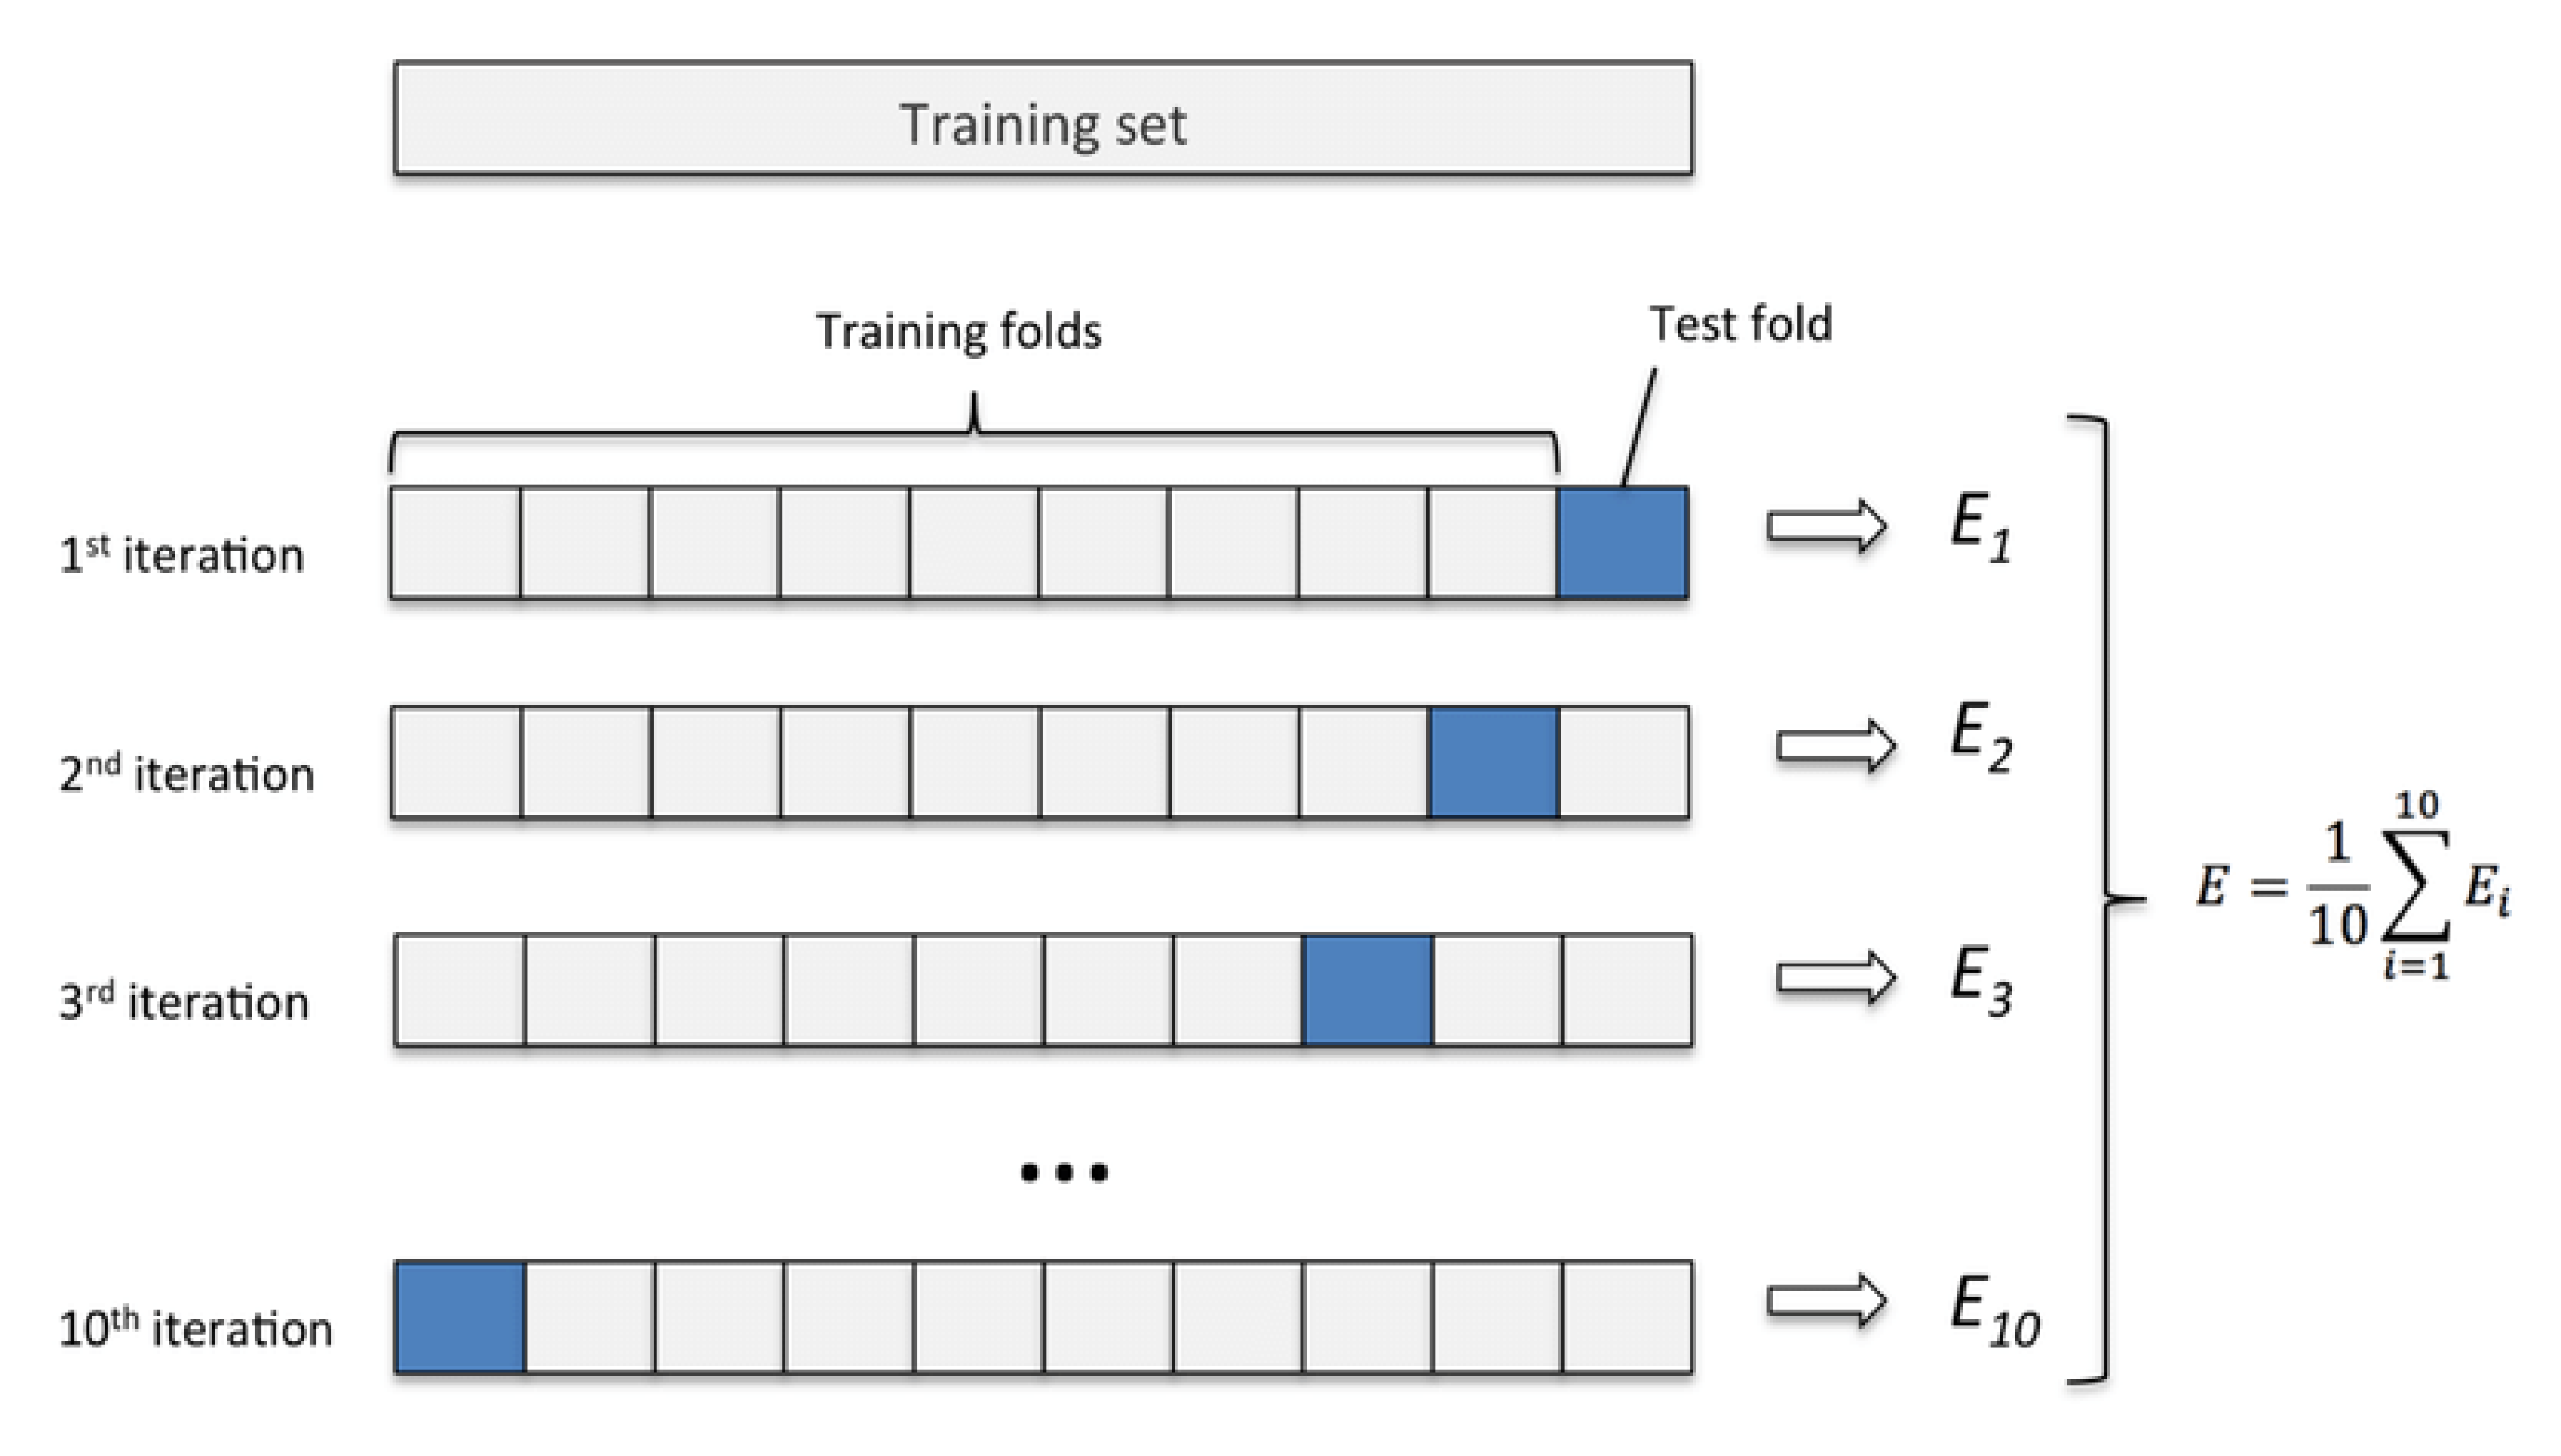
5.2. Cross-Validation Analysis

In this paragraph, we have described the method used for the cross-validation of data, which was used to obtain reliable estimates of the generalization error of the model, or how the CNN network behaves on data other than learning data.
In particular, K-fold [32] cross-validation was used in this study, which involved randomly dividing the training dataset into k parts without reintegration: the K-1 parts were used for training the model, and a part was used for testing. This procedure was repeated k times so as to obtain k models and performance estimates.
Subsequently, the average performance of the models was calculated on the basis of the different independent subdivisions to obtain an estimate of the performance that was less sensitive to the partitioning of the training data.
Since k-fold cross-validation is a resampling without reintegration technique, the advantage of this approach is that each sample point will be part of the training and test datasets only once, which provides a lower variance estimate of the template performance.
For this study, the training dataset was divided into ten parts, K = 10, and during the ten iterations, nine parts were used for training, and one part was used as a test set for model evaluation. In addition, the estimated performance Ei (for example, the accuracy of the classification) of each part was then used to calculate the average estimated performance E of the model. Figure 7 depicts the concept of the k-fold cross-validation technique. The average accuracy and standard deviation for the model used in this study were 96.8 ± 1.2%.

6. Discussion

Table 4 shows a comparison between our method and other methods in terms of feature extraction (FE), the model used, the system’s accuracy, and the statistical classification accuracy.
Hereinafter, the differences between this work and the state-of-the-art have been discussed. In [33,34], the authors used the extraction of the decision tree (DT) and R-peak (RP) as features and did not apply convolutional neural networks (CNN) but rather the discrete wavelet transformation (DWT) and the feed-forward neural network (FFNN). The authors claimed an average accuracy of 96.56% and 87.66%, respectively, while, in our study, the average accuracy was equal to 98.1%. This result was higher than the result proposed in [33,34].
Compared to the approaches proposed in [5,14,15,16,33,34], our method had higher classification performances. As far as the studies proposed in [17,18] are concerned, it is evident that they had quite comparable performances, but they used more hidden layers than our study, with a consequent increase in computation costs. In addition, they did a preprocessing of data using wavelet transformation, which implied an additional computational cost. From the point of view of the structure of the neural network, in [17], in particular, five layers (two convolution layers, two down sampling layers, and one full connection layer) plus the output layer formed by Softmax were used for classification; however, we used another structure (previously described), which was more robust to the “vanishing gradients” phenomenon.
In addition, to ensure that the model was correct, we applied the K-fold technique (previously described) for cross-validation, obtaining an average accuracy of 96.8% and a standard deviation of ±1.2%.
Usually, the processing unit implements the automatic disease classification algorithm described above, showing the result of the diagnosis on display. A possible alternative is to transmit in real-time ECG sequences via data cellular connection (4G dongle) [35,36] to a cloud platform, where an automatic ECG diagnosis is implemented in “as a service” mode. The robustness to the IP (Internet Protocol) packet loss, typical of a 4G data connection, was verified by sending the test database several times from a transmitter to a 4G data receiver. The classification results confirmed the same values obtained in the case of processing on the local board.

7. Conclusions

This paper proposed an automated heart disease recognition technique based on recent and innovative CNN networks. The proposed technique had high accuracy and had low complexity of implementation. This approach harnessed the potential of deep learning to capture the typical characteristics of given heart disease in the ECG signal domain.
Using the “validation set”, the proposed method yielded the following results:
  • 98.33% mean accuracy;
  • 98.33% sensitivity;
  • 98.35% specificity;
  • 1.65% false positive ratio;
  • 1.66% false negative ratio;
  • 98.33% F1 score.
By comparing and contrasting various methods in the “Discussion” section, we could affirm that the method applied in the present paper yielded considerably better performances than those of the state-of-the-art.

Author Contributions

Conceptualization, F.B.; methodology, F.B. and R.A.; software, R.A.; validation, F.B. and R.A.; formal analysis, F.B. and R.A.; investigation, F.B. and R.A.; resources, F.B.; data curation, R.A.; writing—original draft preparation, R.A.; writing—review and editing, F.B. and R.A.; visualization, R.A.; supervision, F.B.; project administration, F.B.; funding acquisition, F.B. All authors have read and agreed to the published version of the manuscript.

Funding

This research received no external funding.

Conflicts of Interest

The authors declare no conflict of interest.

References

  1. Benjamin, E.J.; Blaha, M.J.; Chiuve, S.E.; Cushman, M.; Das, S.R.; Deo, R.; de Ferranti, S.D.; Floyd, J.; Fornage, M.; Gillespie, C.; et al. Heart disease and stroke statistics 2017 update: A report from the american heart association. Circulation 2017, 135, 146–603. [Google Scholar] [CrossRef]
  2. Mitra, M.; Samanta, R. Cardiac arrhythmia classification using neural networks with selected features. Proc. Technol. 2013, 10, 76–84. [Google Scholar] [CrossRef] [Green Version]
  3. Salerno, S.M.; Alguire, P.C.; Waxman, H.S. Competency in interpretation of 12-lead electrocardiograms: A summary and appraisal of published evidence. Ann. Intern. Med. 2003, 138, 751–760. [Google Scholar] [CrossRef]
  4. Beritelli, F.; Capizzi, G.; Lo Sciuto, G.; Napoli, C.; Woźniak, M. A novel training method to preserve generalization of RBPNN classifiers applied to ECG signals diagnosis. Neural Netw. 2018, 108, 131–138. [Google Scholar] [CrossRef]
  5. Beritelli, F.; Capizzi, G.; Lo Sciuto, G.; Scaglione, F.; Połap, D.; Woźniak, M. A Neural Network Pattern Recognition Approach to Automatic Rainfall Classification by Using Signal Strength in LTE/4G Networks. In Proceedings of the International Joint Conference on Rough Sets, Olsztyn, Poland, 3–7 July 2017. [Google Scholar]
  6. Beritelli, F.; Capizzi, G.; Lo Sciuto, G.; Napoli, C.; Scaglione, F. Rainfall estimation based on the intensity of the received signal in a LTE/4G mobile terminal by using a probabilistic neural network. IEEE Access 2018, 6, 30865–30873. [Google Scholar] [CrossRef]
  7. Avanzato, R.; Beritelli, F.; Di Franco, F.; Puglisi, V.F. A Convolutional Neural Networks approach to Audio Classification for Rainfall Estimation. In Proceedings of the 10th IEEE International Conference on Intelligent Data Acquisition and Advanced Computing Systems: Technology and Applications, Metz, France, 18–21 September 2019. [Google Scholar]
  8. Beritelli, F.; Spadaccini, A. A Statistical Approach to Biometric Identity Verification based on Heart Sounds. In Proceedings of the Fourth International Conference on Emerging Security Information, Systems and Technologies, Venice, Italy, 18–25 July 2010. [Google Scholar]
  9. Beritelli, F.; Spadaccini, A. The Role of Voice Activity Detection in Forensic Speaker Verification. In Proceedings of the 17th IEEE International Conference on Digital Signal Processing (DSP 2011), Corfu Island, Greece, 6–9 July 2011. [Google Scholar]
  10. Rajpurkar, P.; Hannun, A.Y.; Haghpanahi, M.; Bourn, C.; Ng, A.Y. Cardiologist-level arrhythmia detection with convolutional neural networks. arXiv 2017, arXiv:1707.01836. Available online: https://arxiv.org/abs/1707.01836 (accessed on 5 June 2020).
  11. Acharya, U.R.; Fujita, H.; Lih, O.S.; Adam, M.; Tan, J.H.; Chua, C.K. Automated detection of coronary artery disease using different durations of ECG segments with convolutional neural network. Knowl. Based Syst. 2017, 132, 62–71. [Google Scholar] [CrossRef]
  12. Kiranyaz, S.; Ince, T.; Gabbouj, M. Real-time patient-specific ECG classification by 1-D convolutional neural networks. IEEE Trans. Biomed. Eng. 2016, 63, 664–675. [Google Scholar] [CrossRef]
  13. Taji, B.; Chan, A.D.; Shirmohammadi, S. Classifying measured electrocardiogram signal quality using deep belief networks. In Proceedings of the IEEE International Instrumentation and Measurement Technology Conference (I2MTC), Turin, Italy, 22–25 May 2017. [Google Scholar]
  14. Acharya, U.R.; Fujita, H.; Oh, S.L.; Hagiwara, Y.; Tan, J.H.; Adam, M. Application of deep convolutional neural network for automated detection of myocardial infarction using ECG signals. Inf. Sci. 2017, 415, 190–198. [Google Scholar] [CrossRef]
  15. Savalia, S.; Emamian, V. Cardiac Arrhythmia classification by multi-layer perceptron and convolution neural networks. Bioengineering 2018, 5, 35. [Google Scholar] [CrossRef] [Green Version]
  16. Zubair, M.; Kim, J.; Yoon, C. An Automated ECG beat classification system using convolutional neural networks. In Proceedings of the 6th International Conference on IT Convergence and Security (ICITCS), Prague, Czech Republic, 26 September 2016; pp. 1–5. [Google Scholar]
  17. Li, D.; Zhang, J.; Zhang, Q.; Wei, X. Classification of ECG signals based on 1D convolution neural network. In Proceedings of the IEEE 19th International Conference on e-Health Networking, Applications and Services (Healthcom), Dalian, China, 12–15 October 2017. [Google Scholar]
  18. Baloglu, U.B.; Talo, M.; Yildirim, O.; Tan, R.S.; Acharya, U.R. Classification of myocardial infarction with multi-lead ECG signals and deep CNN. Pattern Recognit. Lett. 2019, 122, 23–30. [Google Scholar] [CrossRef]
  19. Tang, X.; Shu, L. Classification of electrocardiogram signals with RS and quantum neural networks. Int. J. Multimedia Ubiquitous Eng. 2014, 9, 363–372. [Google Scholar] [CrossRef]
  20. Moavenian, M.; Khorrami, H. A qualitative comparison of artificial neural networks and support vector machines in ECG arrhythmias classification. Expert Syst. Appl. 2010, 37, 3088–3093. [Google Scholar] [CrossRef]
  21. Jambukia, S.H.; Dabhi, V.K.; Prajapati, H.B. Classification of ECG signals using machine learning techniques: A survey. In Proceedings of the International Conference on Advances in Computer Engineering and Applications (ICACEA), Ghaziabad, India, 19–20 March 2015. [Google Scholar]
  22. Vijayavanan, M.; Rathikarani, V.; Dhanalakshmi, P. Automatic classification of ECG signal for heart disease diagnosis using morphological features. Int. J. Comput. Sci. Eng. Technol. (IJCSET) 2014, 5, 449–455. [Google Scholar]
  23. Sansone, M.; Fusco, R.; Pepino, A.; Sansone, C. Electrocardiogram pattern recognition and analysis based on artificial neural networks and support vector machines: A review. J. Healthc. Eng. 2013, 4, 465–504. [Google Scholar] [CrossRef] [Green Version]
  24. Jollis, J.G.; Granger, C.B.; Henry, T.D.; Antman, E.M.; Berger, P.B.; Moyer, P.H.; Pratt, F.D.; Rokos, I.C.; Acuña, A.R.; Roettig, M.L.; et al. Systems of care for st-segment–levation myocardial infarction: A report from the American heart association’s mission: Lifeline. Circ. Cardiovas. Qual. Outcomes 2012, 5, 423–428. [Google Scholar] [CrossRef] [Green Version]
  25. Wang, D.; Taubel, J.; Arezina, R. Comparison of six commonly used qt correction models and their parameter estimation methods. J. Biopharm. Stat. 2012, 22, 1148–1161. [Google Scholar] [CrossRef]
  26. Moody, G.B.; Mark, R.G.; Goldberger, A.L. Physionet: A web-based resource for the study of physiologic signals. IEEE Eng. Med. Biol. 2001, 20, 70–75. [Google Scholar] [CrossRef]
  27. Moody, G.B.; Mark, R.G. The impact of the MIT-BIH arrhythmia database. IEEE Eng. Med. Biol. 2001, 20, 45–50. [Google Scholar] [CrossRef]
  28. Goldberger, A.L.; Amaral, L.A.; Glass, L.; Hausdorff, J.M.; Ivanov, P.C.; Mark, R.G.; Mietus, J.E.; Moody, G.B.; Peng, C.K.; Stanley, H.E. Physiobank, physiotoolkit, and physionet. Circulation 2000, 101, e215–e220. [Google Scholar] [CrossRef] [Green Version]
  29. Dai, W.; Dai, C.; Qu, S.; Li, J.; Das, S. Very deep convolutional neural network for raw waveforms. In Proceedings of the IEEE International Conference on Acoustics Speech and Signal Processing (ICASSP), New Orleans, LA, USA, 5–9 March 2017. [Google Scholar]
  30. Avanzato, R.; Beritelli, F. An innovative acoustic rain gauge based on convolutional neural networks. Information 2020, 11, 183. [Google Scholar] [CrossRef] [Green Version]
  31. Beleites, C.; Salzer, R.; Sergo, V. Validation of soft classification models using partial class memberships: An extended concept of sensitivity & co. applied to grading of astrocytoma tissues. Chemometr. Intell. Lab. Syst. 2013, 122, 12–22. [Google Scholar]
  32. Scikit Learn. Machine Learning in Python. Available online: https://scikit-learn.org/stable/ (accessed on 14 May 2020).
  33. Sridhar, C.; Acharya, U.R.; Fujita, H.; Bairy, G.M. Automated diagnosis of coronary artery disease using nonlinear features extracted from ECG signals. In Proceedings of the IEEE International Conference on Systems, Man, and Cybernetics, SMC, Budapest, Hungary, 9–12 October 2016. [Google Scholar]
  34. Ranjan, R.; Arya, R.; Fernandes, S.L.; Sravya, E.; Jain, V. A fuzzy neural network approach for automatic k-complex detection in sleep EEG signal. Pattern Recognit. Lett. 2018, 115, 74–83. [Google Scholar] [CrossRef]
  35. Bukhari, S.H.R.; Rehmani, M.H.; Siraj, S. A Survey of channel bonding for wireless networks and guidelines of channel bonding for futuristic cognitive radio sensor networks. IEEE Commun. Surv. Tutor. 2016, 18, 924–948. [Google Scholar] [CrossRef]
  36. Beritelli, F.; Gallotta, A.; Rametta, C. A Dual Streaming approach for speech quality enhancement of VoIP service over 3G networks. In Proceedings of the IEEE International Conference on Digital Signal Processing (DSP), Santorini, Greece, 1–3 July 2013. [Google Scholar]
Figure 1. A typical electrocardiogram (ECG) waveform and its characteristic patterns (P and T waves, PR and ST segments, PR and QT intervals, as well as the QRS complex).
Electronics 09 00951 g001
Figure 2. ECG waveforms of the three heartbeat classes.
Electronics 09 00951 g002
Figure 3. Convolutional neural network architecture.
Electronics 09 00951 g003
Figure 4. The distribution of ECG segments used for learning (70%) and testing (30%). Thirty percent of the learning dataset was used for the validation of the network.
Electronics 09 00951 g004
Figure 5. (a) Training and validation losses, (b) training and validation accuracy.
Electronics 09 00951 g005
Figure 6. Confusion Matrix for “testing set”.
Electronics 09 00951 g006
Figure 7. K-fold cross-validation method with subdivision of the training set into k = 10 parts.
Electronics 09 00951 g007
Table 1. Main techniques for classifying ECG signals based on the use of CNN networks.
ResearcherPreprocessingDatabaseClassesModelAccuracy
Acharya et al. [14]R-PeaksMIT-BIH arrhythmia21-D CNN, 11-layer95.22%
Savalia et al. [15]MIT-BIH arrhythmia and Keggar2 (MLP) 9 (CNN)1-D CNN, 5-layer88.7%
Zubair et al. [16]MIT-BIH arrhythmia51-D CNN, 4-layer92.7%
Li et al. [17]Wavelet transformMIT-BIH arrhythmia51-D CNN, 6-layer97.5%
Baloglu et al. [18]Wavelet transformMIT-BIH arrhythmia12 lead ECG1-D CNN, 10-layer99.8%
Proposed methodMIT-BIH arrhythmia31-D CNN, 5-layer98.33%
Table 2. The structure of the proposed network.
INPUTVectors of 10,800 ECG Samples
LAYER 1Conv1D (1, 128, 80, 4):
input 1 channels
output 128 channels
kernel_size 80
stride 4
BatchNorm1D (128):
N_features: 128
MaxPool1D:
kernel_size 4
LAYER 2Conv1D (128, 128, 3):
input 128 channels
output 128 channels
kernel_size 4
BatchNorm1D (128):
N_features: 128
MaxPool1D:
kernel_size 4
LAYER 3Conv1D (128, 256, 3):
input 128 channels
output 256 channels
kernel_size 4
BatchNorm1D (256):
N_features: 256
MaxPool1D:
kernel_size 4
LAYER 4Conv1D (256, 512, 3):
input 256 channels
output 512 channels
kernel_size 4
BatchNorm1D (512):
N_features: 512
MaxPool1D:
kernel_size 4
OUTPUT LAYERAvgPool1D (30):
kernel_size 30
Linear (512, num_classes):
input 1 × 512output num_classes: 3
Log Softmax
Table 3. The table reports the overall values of accuracy TPR, TNR, TPR, TDR, and F1 score.
αClassTPRTNRFPRFDRF1 Score
1Normal99.0%97.1%2.9%1%98.0%
2Atrial premature beat100%99.0%1.0%0%99.5%
3Premature ventricular contraction96.0%98.96%1.04%4%97.5%
Mean Accuracy98.33%98.33%98.35%1.65%1.66%98.33%
Table 4. Comparison between the proposed method and those previously studied.
MethodFEModelACCTPRTNRFPRFDR
Sridhar et al. [33]DTDWT96.56%90.87%98.45%9.13%1.55%
Ranjan et al. [34]RPFFNN87.66%94.04%76.21%5.96%23.79%
Acharya et al. [14]RP11-layer CNN95.22%95,49%94.19%
Beritelli et al. [4]PNN96.53%93.1%100%
Savalia et al. 1,2 [15]MLP/5-layer CNN88.7%/83.5%
Zubair et al. [16]4-layer CNN92.7%
Li et al. [17]Wavelet transform6-layer CNN97.5%
Baloglu et al. [18]Wavelet transform10-layer CNN99.8%99.5%
Proposed method5-layer CNN98.33%98.33%98.35%1.65%1.66%
1 Different dataset for training/validation and testing, 2 Use more cardiovascular disease classes.

