Article

A Photovoltaic-Based DC Microgrid System: Analysis, Design and Experimental Results

State Key Laboratory of Alternate Electrical Power System with Renewable Energy Sources, North China Electric Power University, Beijing 102206, China
*
Author to whom correspondence should be addressed.
Electronics 2020, 9(6), 941; https://doi.org/10.3390/electronics9060941
Submission received: 30 April 2020 / Revised: 19 May 2020 / Accepted: 2 June 2020 / Published: 5 June 2020
(This article belongs to the Special Issue Applications of Power Electronic Circuits and Systems for Future Grid)

Abstract

:
Due to the exhaustion of fossil energy, the utilization of renewable energy resources is developing quickly. Due to the intermittent nature of the renewable energy resources, the energy storage devices are usually adopted in renewable power generation system to enhance the system reliability. In this paper, the photovoltaic-based DC microgrid (PVDCM) system is designed, which is composed of a solar power system and a battery connected to the common bus via a boost converter and a bidirectional buck/boost converter, respectively. As the photovoltaic (PV) panels might operate in a maximum power point tracking (MPPT) mode or constant voltage mode, meanwhile, the power can flow between the battery and the load bidirectionally. Therefore, for the sake of optimizing power utilization in the PVDCM system, a control strategy making the system able to switch from one operating mode to another smoothly and automatically is proposed in this paper. Moreover, the small-signal modeling method based on averaged state-space is no more applicable in this study, thus the nonlinear analysis method with discrete-time mapping model is adopted for stability analysis. Based on the stability analysis, the closed-loop parameters are designed to make sure the whole system can operate properly in all operating modes. The control strategy and stability analysis based on the nonlinear analysis method in the closed-loop design are verified by experiment results.

1. Introduction

The non-renewable energy resources, including coal, petroleum, natural gas, etc., are gradually becoming exhausted, the development and proper utilization of the renewable energy resources is thus very urgent [1,2,3,4]. Therefore, due to the environmental and economic incentives, renewable energy generation is gaining lots of attention nowadays, such as solar power, wind power, fuel cell power, tidal power, etc. [5,6,7]. Among them, photovoltaic (PV) systems are now experiencing fast development. However, due to the intermittent feature of solar energy, which is closely related to the weather conditions and geographic locations, a PV system that is only composed of solar energy might be unreliable [1,3,8,9]. In order to solve this problem, an approach integrating the energy storage devices to the PV system i.e., the batteries and ultracapacitors, is usually employed [2]. The PV-based system can be connected to the main grid nearby as supplementary power to improve the reliability of the main grid. However, the extensive interconnection of the converter-based PV system to the main grid can lead to lots of dynamic interactions and may cause different kinds of unstable issues [10,11]. The PV system can also operate in standalone mode for local applications in remote non-electrified regions [10,12,13], such as in the desert, on mountains, etc. Constructing small-scale standalone PV-based system which can power the surrounding loads in those regions is much more cost-effective than extending the conventional main grid to those areas. The PV-based standalone microgrid is thus proposed to realize this kind of application, which has also gained growing attraction in recent years [5,8,9,14].
The microgrid (or minigrid) can integrate the PV panels, energy storage devices, and controllable loads effectively and economically [9,12,15]. By taking some reasonable control measures, the microgrid can implement the optimal use of energy. In practice, this system can be divided into two types: DC microgrid [16,17,18] and AC microgrid [19]. The former is widely used in modern applications, especially for electric ships, electric vehicles, E-mobility, and smart homes, etc. [20,21]. That is because of the inherent advantages of DC microgrids, such as that the control is simple, no need for synchronization, no reactive power, no low frequency harmonics and excellent compatibility with sources, storage devices and loads, etc. [10,12,16,17,18]. Meanwhile, as the PV panels and the storage devices work inherently in DC, this paper is thus designing a PVDCM system.
In recent years, many researchers have made contributions on the PVDCM system, mainly focusing on the energy management and control methods, as well as the stability issues. Firstly, the decentralized droop control, without communication lines or with few communication lines among different power generators, is a popular and efficient control method for proper power allocation of the system [11,12,15]. However, for the systems with batteries, not only power sharing is important, but also the state charge of the battery needs to be monitored and controlled. Such as the authors in [8,18] concentrate on the control of the battery charging and discharging process to protect the battery. Additionally, in order to make the operation of the system more reliable and comprehensive, multiple sophisticated energy management and control strategies are proposed in [1,5,22]. In the different control strategies, controlling the DC bus voltage properly is another important control issue, ref. [23] designs a nonlinear adaptive backstepping controller to maintain a constant voltage at the DC bus, [24] also proposes a method of stabilizing DC bus voltage based on a comprehensive control and power management system which also implements the power flow flexibly. Additionally, for the optimal operation of the system, a wind-PV-batteries hybrid DC microgrid system is designed in [25], which takes economic and ecological factors into consideration to implement the system optimal operation. However, the computing burden increases rapidly with the rising of the complexity of the control method, leading to all of these complicated control methods and algorithms should be implemented in a microprocessor, at least a digital signal processor, which is costly and also brings more stability problems due to the time delay results from the digital control methods. On the other hand, many publications focus on the stability issues in the PVDCM system. In order to analyze the influence of the controller parameters and constant power load, the most common used method is the small signal model based on the state space averaging method [21,26,27].
Specifically, in this paper, a simple PVDCM system, which is composed of a solar power system connected to the common bus via a boost converter and a battery connected to the common bus via a bidirectional buck/boost converter, respectively, is studied and designed in detail. In this system, the solar energy is the main source and the battery is a backup source, which can absorb the extra power from the PV panels and can also supply the insufficient power to the load. Thus, the corresponding energy management strategy and the implementation are necessary to be proposed, so as to use the solar energy preferentially. In the meanwhile, when the solar energy exceeds the load, the extra energy needs to be stored in the battery. Then, it’s necessary to control the charging and discharging procedures for the battery. In practice, the PV panels might work in two modes: maximum power point tracking (MPPT) mode and off-MPPT mode. The PV converter with proper control switches between the two modes, can either make maximum utilization of the solar energy or regulate the DC bus voltage. Meanwhile, the battery converter may either take care of the DC bus voltage or control the charging and discharging procedures of the battery. Consequently, the control system for PVDCM needs to be able to operate in multiple operating modes stably [28], which is a challenging work.
The first challenge is that the control method needs to be realized for two functions: (1) optimized power utilization, such as using the solar energy as much as possible, protecting the battery, regulating the DC bus voltage and rationalizing power allocation; (2) making sure that the system is capable of switching between the different operating modes smoothly and automatically. A control strategy for a dual-input buck and buck-boost converter with two input sources was proposed in [29], which is also applicable to multiple dual-input converters [30]. However, two control loops will interact with each other all the time when two input sources power the loads simultaneously. To solve this problem, an improved control strategy is proposed in [1]. However, that cannot handle the bidirectional power for the battery here as there are no energy storage devices in those systems.
Another challenge is the stability issue of the closed-loops, which is much more complicated for the system with multiple operating modes than the system with a single operating mode because the multiple control loops are always coupled with each other, and it’s necessary to consider the stability conditions for all possible operating modes. The often used small-signal modeling method based on the state-space averaging method [26,28] is no longer applicable in the PVDCM system. The reason is that the multiple control loops are coupled with each other in each operating mode. The authors in [29] gave a method that designed the regulators in one operating mode first, in which there were no control loops coupling effects, then substituted the designed parameters into other operating modes and checked if the system was stable or not. If the system was stable, the estimating procedure was ended, but if not, the controller parameters of regulators were adjusted until the stability requirements were satisfied. This method may fail many times before finding a correct solution and it needs to be designed again when the operating condition is changed. Despite this, this method is no longer applicable when the control loops are coupled in all operating modes. In [30], a decoupling matrix is introduced to design the regulators of the coupled control loops, but this method becomes invalid in a system with multiple operating modes, because the decoupling matrixes might be different for each operating mode. Then, it’s difficult for closed-loop designing-oriented. Alternatively, the small signal method with the eigenvalues analysis is performed in [21,26,27]. However, this small-signal modeling method based on the averaged state-space can only capture and analyze the low-frequency instability of the system, i.e., below half of the switching frequency [31], but cannot be used to analyze high frequency stability issues, such as subharmonic oscillation [32]. Then, a proper dynamic model for stability analysis of the PVDCM system is demanded.
In general, the PVDCM system based on the switched power converters with the closed-loop control is a nonlinear time-discontinuous system, then many modeling methods for the DC converters can also be used here. To summarize that, one way to model the dynamics of this kind of system is by applying the averaging theory to transform the converter system into a time-continuous system, as in [31,32], which includes the simplest state-space averaging method. Despite that, more general averaging methods, such as Krylov–Bogoliubov–Mitropolsky [33] and multi-frequency averaging [34] are also developed to consider the switching ripple effects. However, it is still questionable at a high frequency range because it loses the high frequency information by averaging. Many strange phenomena cannot be explained with these models, such as the phase delay of the loop gain [35] and the subharmonic oscillation in the peak current control loop [32]. The former one is explained later by the multi-frequency small signal models [35], and [32] studies of the subharmonic oscillation by adding the sample-and-hold effect to the modified averaged model. However, this method fails to predict the beat frequency instability between different converters [36]. To solve this problem, the harmonic state-space (HSS) models with multi-input-multi-output forms are proposed based on the linear time period theory [37]. The HSS model succeeds in analyzing the beat frequency oscillation and it can predict high frequency oscillations. The main disadvantages of the HSS models are that the matrix model order is very high to achieve an accurate prediction and the general Nyquist criteria are inevitably used. All of these modeling methods are based on linearized systems, and analyze the stability issues in the frequency domain.
Another way to model the dynamics of the switched-converters based system is the nonlinear analysis method in the time domain, including the averaging model and discrete-time model [38]. This nonlinear analysis method is mainly used to investigate the nonlinear phenomena in power electronic circuits, such as the bifurcation and chaos phenomena. The averaging model in time domain, by averaging the state variables over one switching period, can only analyze the low frequency bifurcation [38,39]. The discrete-time model can give almost complete information about the system’s dynamics, which is capable of predicting the instability in a wide range of frequencies, even amongst the chaos [38,40]. This paper is going to design and make sure PVDCM system is stable in a wide range of frequency, the nonlinear analysis method based on a discrete-time mapping model is thus adopted.
This paper is organized as follows: Section 2 will first describe the PVDCM system with multiple operating modes, and then the energy management strategy is proposed; Section 3 presents the nonlinear stability analysis with a discrete-time mapping model, based on which the stability boundaries under different combination of compensation parameters are graphically derived in Section 4; in Section 5, the experiment results are given to verify the effectiveness of the energy management strategy and the nonlinear stability analysis method for designing the closed-loop parameters; lastly, conclusions are given in Section 6.

2. PVDCM System

2.1. PVDCM System Description

Figure 1 shows the main topology of the studied PVDCM system, which is composed of the PV panels and the battery. The PV panels power the DC load on the DC bus via a boost converter and the battery is connected to the DC bus through a bidirectional buck/boost converter. The boost converter regulates the power of the PV panels, while the bidirectional buck/boost converter controls the charging and discharging procedures of the battery. When the maximum power of the PV panels is insufficient for the load, then the PV panels operate in MPPT mode and the battery provides the complementary power to the load, which also needs to control the bus voltage. If the power of the PV panels become larger than the load, the excessive power will be provided to the battery. Under this condition, if the charge current or charge voltage of the battery achieves the maximum value recommended by the manufacturers, the charging procedure of the battery requires to be controlled. Meanwhile, the PV panels need to quit MPPT control and start to take care of the DC bus voltage. Therefore, according to the power supplied by the PV panels, the battery states and the load conditions, the PVDCM is able to operate in multiple operating modes, as shown in Table 1. Here, Pm is the maximum output power of the PV panels, Po is the load requirement power, vbat and ibat are the battery voltage and current, respectively. Ibmax is the recommended maximum charge current for the battery, while Vbmin and Vbmax are the allowed minimum and maximum battery voltage, respectively.
From Table 1, it can be seen that if Pm < Po and the battery is over-discharged, the whole system will be shut down. Despite this, the PVDCM has three normal operating modes as follows:
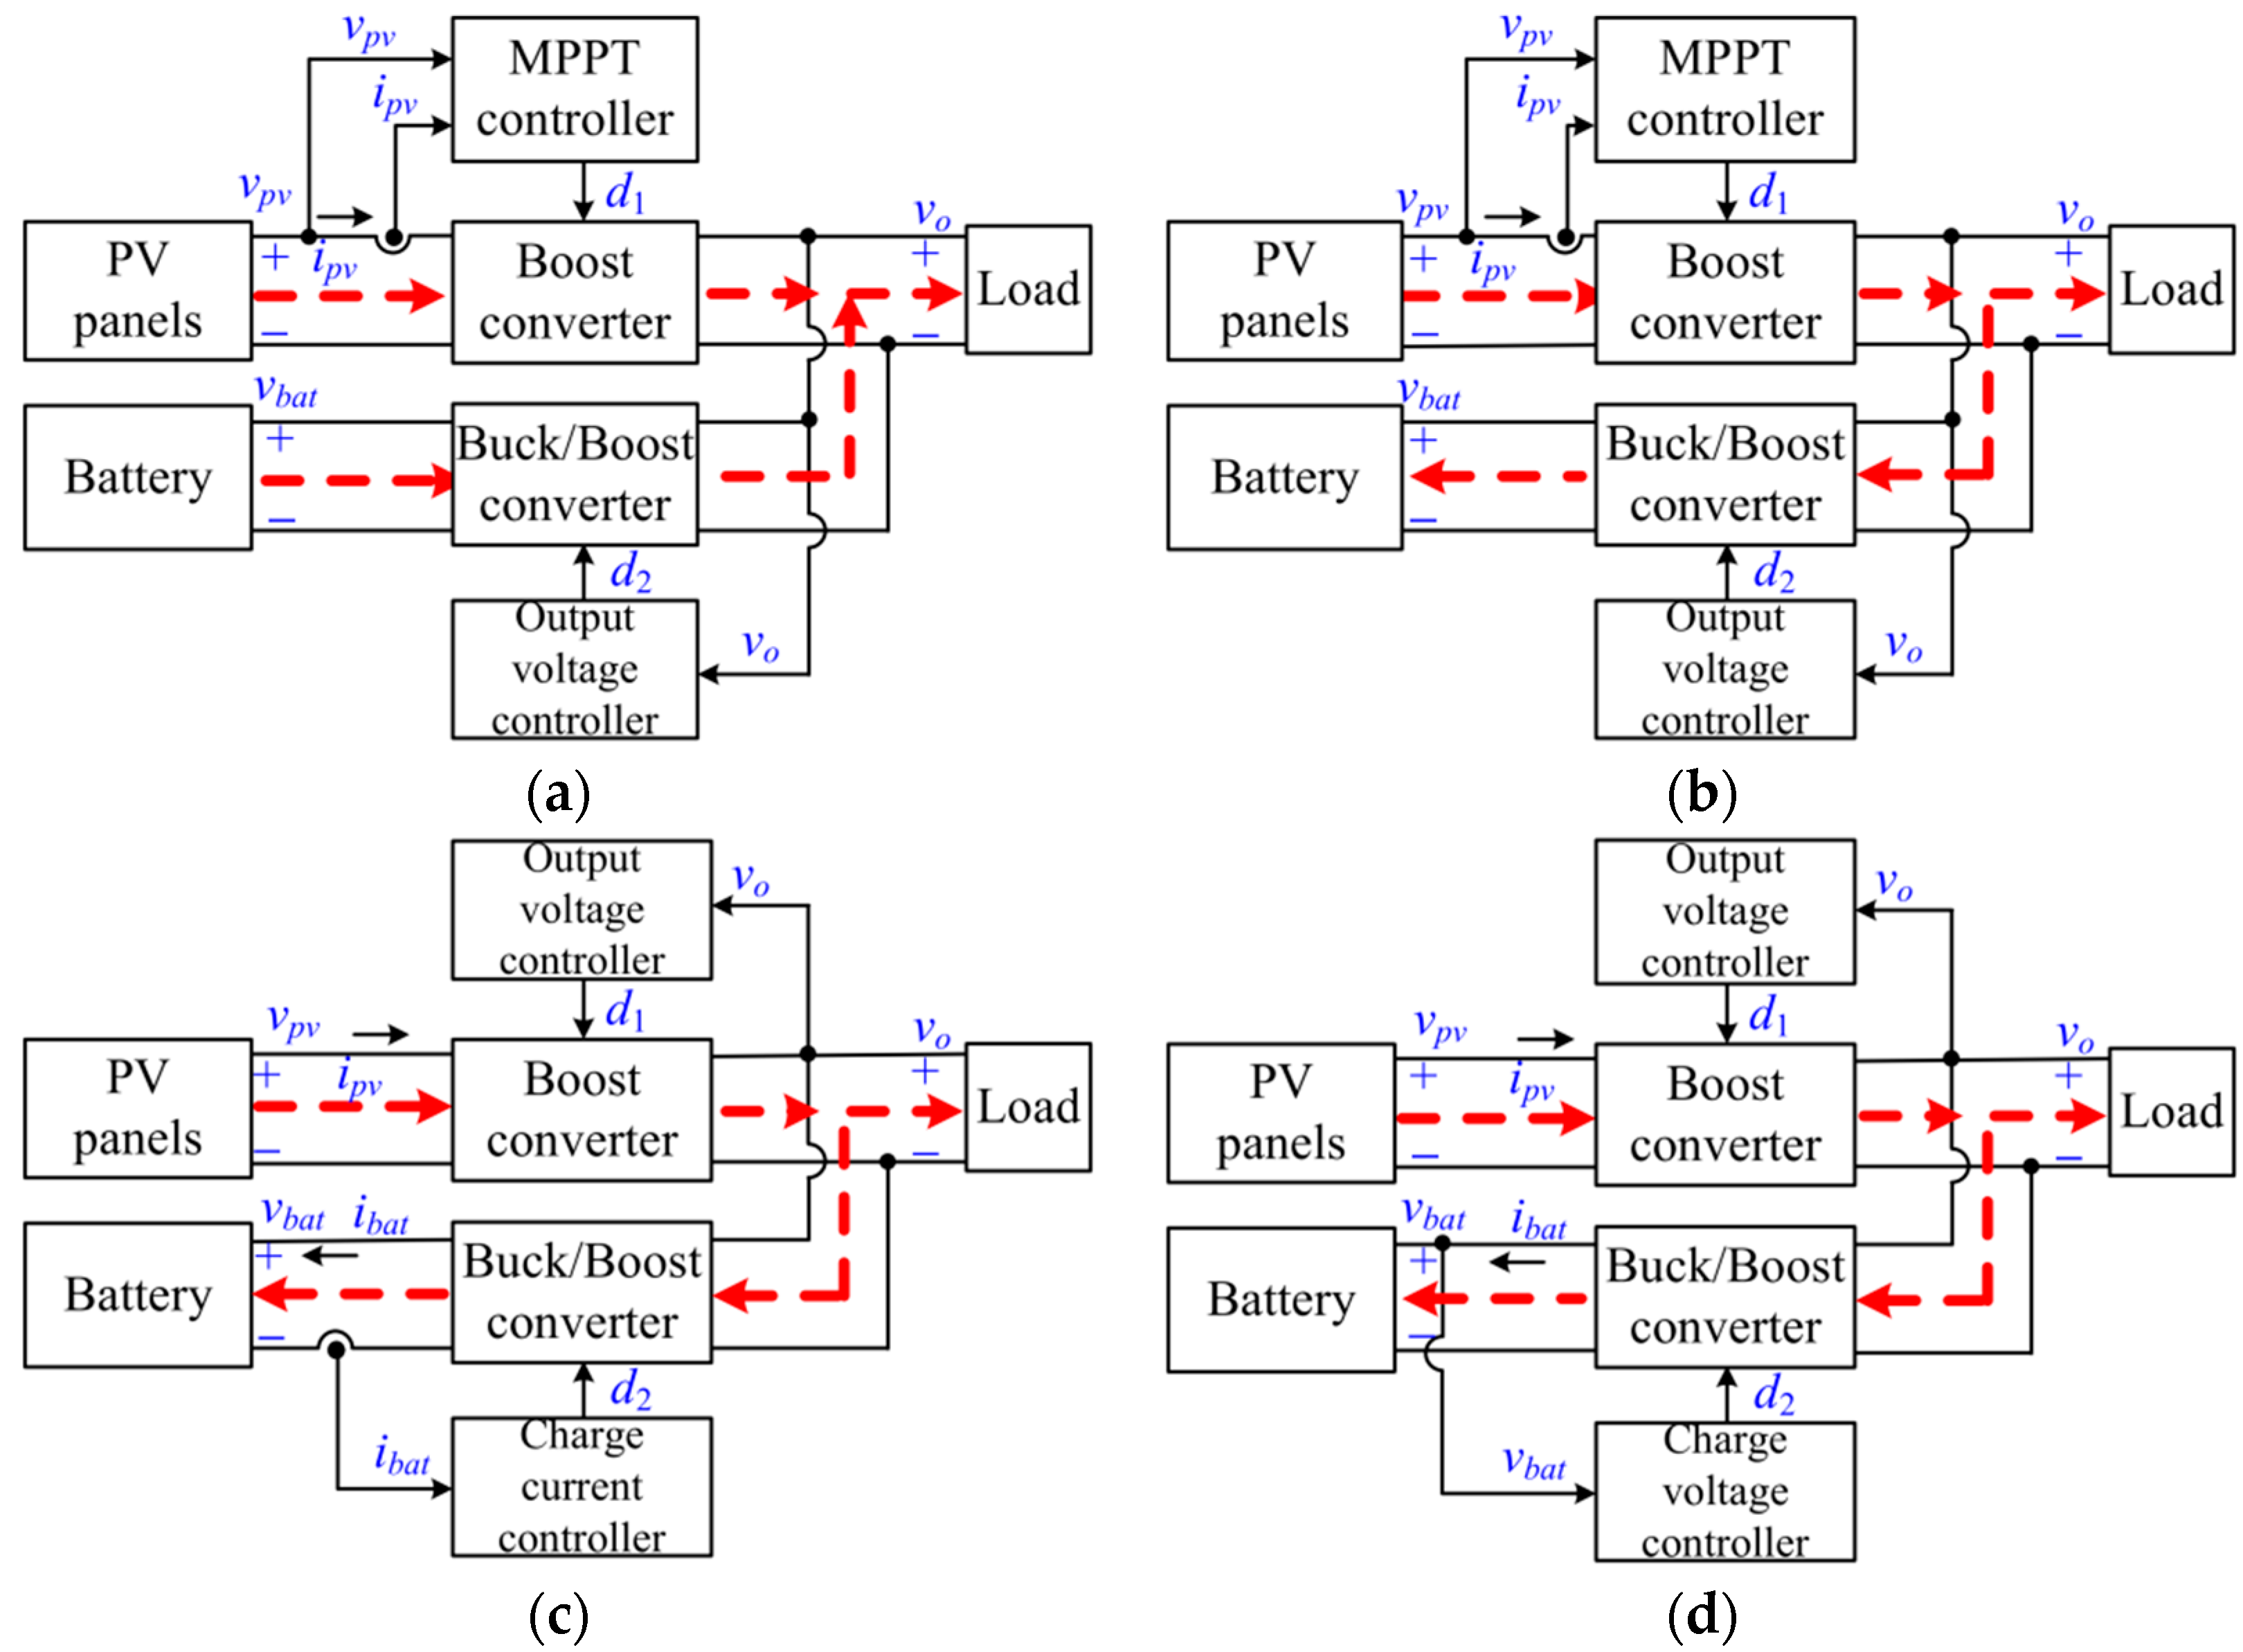
  • Operating Mode M1—when Pm < Po, the solar power is insufficient, the PV panels are thus operating in MPPT mode controlled by the boost converter, while the battery supplies the complementary power via the bidirectional buck/boost converter working in boost mode to regulate the DC bus voltage vo, the inductor current iLb2 is positive (the reference direction is shown as in Figure 1). Figure 2a shows the energy flow and the corresponding control requirements of M1, in which d1 and d2 are the duty cycles of Q1 and Q2, respectively, Q3 is always complementary to Q2. When Pm > Po, the excessive power will be stored in the battery. Under this condition, if ibat < Ibmax, it is unnecessary to control ibat, so the control system is the same as that in Figure 2a. The corresponding power flow is described in Figure 2b, which compared to Figure 2a, only the direction of iLb2 is reversed.
  • Operating Mode M2—when Pm > Po and ibat reaches the maximum charge current limit Ibmax, ibat is required to be controlled so as to protect the battery. Thus, the bidirectional buck/boost converter operates in buck mode to control ibat. Meanwhile, the PV panels have to quit MPPT control mode and to regulate the dc bus voltage, as shown in Figure 2c.
  • Operating Mode M3—when Pm > Po and vbat achieves the maximum battery voltage limit Vbmax, the bidirectional converter will operate in buck mode to control vbat. At the same time, the boost converter still regulates vo, as shown in Figure 2d.

2.2. Proposed PVDCM Control Strategy

First, the PV converters are required to be able to realize the MPPT algorithm for the sake of making full use of solar energy. A schematic diagram of the MPPT control for the PV panels is shown in Figure 3, which regulates PV output voltage vpv or output current ipv to be equal to the voltage or current reference corresponding to the maximum power point. Here, ipv is chosen to be adjusted. Therefore, when the system reaches a steady state, the PV panels current reference Ipvref will respond to the maximum power point through an MPPT algorithm. In this paper, the Perturb and Observe Algorithm (POA) [7,9] is adopted. The fundamental idea of this algorithm is to impose a small step to Ipvref at a fixed interval, and calculate the output power of the PV panels to check whether it becomes larger or not, then to determine altering directions of the small step for Ipvref, so that Ipvref is capable of changing toward the maximum power point.
On the other hand, the DC voltage needs to be controlled all the time, the charge current and charge voltage for the battery should be controlled properly. By combining the analysis and control requirements in Section 2.1, for the sake of ensuring the PVDCM can operate in multiple modes stably and switch between different modes smoothly, an energy management control system is designed in this paper, and demonstrated in Figure 4. Here, Ks is the sampling coefficient for inductor current iLb1, vof is the feedback output voltage and vof = Hof vo, while vbatf = Hbf vbat is the feedback battery voltage, and where Hof and Hbf are the sampling coefficients for vo and vbat, respectively.
The compensation ramp, Vp, which is further explicitly shown in Figure 5, is applied to extend the stability region of the peak current control method. Besides, with an additional diode Dc and a resistor R connected to the ground, the boost converter control loop can switch from the current control method realizing the MPPT algorithm to a dual control loop to regulate vo. Then, the boost converter switching between MPPT mode and constant voltage mode is achieved by turning Dc on and off automatically. For the bidirectional converter, whether it operates in boost mode or buck mode, Q2 is always the primarily controlled switch. Meanwhile, diode D1, D2, and D3 are introduced as selecting switches. By comparing the error signals, ve1, ve2, and ve3, the corresponding diode with the highest voltage is on while the other two diodes are off. Here, when the bidirectional converter works in buck mode, for instance, vbat is controlled, the controlled relationship will be vbat = vo (1 − d2). Hence, a negative logic is inserted to both the charge voltage and charge current control loops.
Based on the proposed energy management control method, the operating principle of PVDCM is described as follows:
  • Operating mode M1—when the PVDCM operates in M1, ipv (here also denotes as iLb1) is controlled by a peak current control loop to implement the MPPT algorithm. Meanwhile, the bidirectional converter operates in boost mode to regulate vo through a voltage control loop. Here, ve1 > 0, and ve2 < 0, ve3 < 0 due to the charge current and charge voltage not reaching the limited value. Accordingly, D1 is on, and D2 and D3 are off, the modulation signal vc of the “PWM Comparator2” is vc = ve1. Under this condition, since ve1 > 0, the diode Dc is thus turned off, and Iref = Ipvref. When Pm becomes larger than Po, the excessive energy will charge the battery automatically due to the dc voltage is controlled by the bidirectional converter.
  • Operating Mode M2—when Pm is much larger than Po, the excessive energy from the PV panels makes ibat reach Ibmax, the charge current loop is thus triggered and ve2 increases until it is larger than ve1, then D2 is turned on and D1 is turned off, and the bidirectional converter switches from boost mode to buck mode to control the charge current. Therefore, the DC voltage is not controlled during this transient interval. However, at the same time, the power delivered to the battery is controlled to a limit level so that much more power will be delivered to the load, which will lead to an increase in vo, and ve1 will decrease via the output voltage regulator. When ve1 falls below 0, diode Dc is turned on, then Iref = ve1 + Ipvref. With the adjustment of the MPPT algorithm, Ipvref will continue to increase, and ve1 will continue to decrease. In order to end this process, an upper limit Imax needs to be set for Ipvref in the MPPT algorithm, which should be slightly larger than the output current of the maximum power point for the PV panels in all conditions. During the execution process, if Ipvref exceeds Imax, Ipvref = Imax will be kept fixed, the MPPT algorithm is then disabled. Therefore, when the above adjustment process reaches steady state again, the PV panels exit the MPPT mode, and the boost converter controls vo through an outer voltage control loop and an inner current control loop. According to the analysis, the system can switch from M1 to M2 smoothly. If Pm decreases or Po increases, the system will switch from M2 to M1, which is the reverse process of the above analysis.
  • Operating Mode M3—whenever Pm > Po, as long as vbat reaches Vbmax, the charge voltage control loop is triggered, as vbatf increases, then ve3 increases. During the period ve3 < ve2, the battery is charged with the constant charge current Ibmax through charge current control loop, so vbatf still increases, ve3 increases until ve3 > ve2, D3 is on and D2 is off, and the charge voltage control loop begins to take care of the battery and control it to operate at a constant voltage. Then the system switches to M3 automatically.
From the above description, it can be known that the output voltage control loop and the MPPT control share the same inner control part, and meanwhile the output voltage control loop and the charge control loop share the same “PWM Comparator2”, these control loops don’t work at the same time but can switch smoothly with the chosen devices, i.e., Dc, D1, D2, and D3. Therefore, this control system is smart and flexible as it can switch between different operating modes smoothly. It should be noting that, to make sure the system can start correctly, the soft start circuits should be used, which can make the duty cycle of the main controlled switches increase slowly until the steady state is achieved.

3. The Discrete-Time Model

The discrete-time model for the operating mode M1 is established as an example in this section, and the analysis and modeling procedure are similar for the other two operating modes, which is thus ignored here. In our study, we assume that the switching frequency of the two converters is the same and the trailing edge modulation is applied to “PWM Comparator2” in Figure 4. Suppose the two converters operate in continuous current mode, the states of diode Dpv and switch Q3 are thus in complementary to the states of switches Q1 and Q2 all the time. Consequently, during one switching period, the system alters among three switch states and the sequence takes as follows: (1) Q1 and Q2 both are turned on; (2) Q1 is on while Q2 is off (when d1d2) or Q1 is off while Q2 is on (when d1d2); (3) Q1 and Q2 both are turned off. Here, according to the system parameters in Table 2, d1d2 is adopted. Then, the state equations of the main circuit, as shown in Figure 1, are derived as
{ d v o d t = 1 R L C f v o + 1 q 1 C f i L b 1 + 1 q 2 C f i L b 2 d i L b 1 d t = q 1 1 L b 1 v o + 1 L b 1 V p v d i L b 2 d t = q 2 1 L b 2 v o + 1 L b 2 v b a t d v b a t d t = 1 C b a t i L b 2 1 r b a t C b a t v b a t + 1 r b a t C b a t V o c b a t ,
where q1 and q2 are the switching functions of Q1 and Q2, respectively, which are given as
q i = { 1   , Q i   O N 0   , Q i   O F F .
The proportional integral (PI) regulators are used for output voltage controller, charge current controller, and charge voltage controllers, and the transfer function is given by
G P I ( s ) = k p ( 1 + 1 s τ i ) ,
here, kp is the proportional gain and τi is the integral time constant. Besides, kpj and τij (j = 1, 2, 3) are the parameters for “Regulator1”, “Regulator2”, and “Regulator3” in Figure 4, respectively.
In M1, the boost converter works with MPPT control scheme, Iref = Ipvref. Nevertheless, the bidirectional converter operates in boost mode to control vo. Accordingly, vc = ve1, so vc fulfills
d v c d t = k p 1 H o f d v o d t k p 1 H o f τ i 1 v o + k p 1 τ i 1 V o r e f .
Consequently, the state variable vector of M1 is x = [ v o   i L b 1   i L b 2   v b a t   v c ] T . The corresponding state equations for the three switch states are described by
x ˙ = A n x + B n E 1 ,
where n = 1, 2, 3 are corresponding to switch state (1)–(3), respectively. The voltage vector E1 is given as E 1 = [ V p v   V o c b a t   V o r e f ] T , and An and Bn are expressed as
A n = [ 1 R L C f 1 q 1 C f 1 q 2 C f 0 0 q 1 1 L b 1 0 0 0 0 q 2 1 L b 2 0 0 1 L b 2 0 0 0 1 C b a t 1 r b a t C b a t 0 k p 1 H o f R L C f k p 1 H o f τ i 1 ( q 1 1 ) k p 1 H o f C f ( q 2 1 ) k p 1 H o f C f 0 0 ] ,
B n = [ 0 0 0 1 / L b 1 0 0 0 0 0 0 1 / r b a t C b a t 0 0 0 k p 1 / τ i 1 ] = B .
The sampled state variables at the starting and ending instants of the nth switching period are denoted as xn = x(nTs) and xn + 1 = x((n + 1)Ts), respectively. Then, the solution can be derived for each state equation in (5), i.e.,
x ( d 2 T s ) = Φ 1 ( d 2 T s ) x n + ( Φ 1 ( d 2 T s ) I ) A 1 1 B E 1 ,
x ( d 1 T s ) = Φ 2 ( ( d 1 d 2 ) T s ) x ( d 2 T s ) + ( Φ 2 ( ( d 1 d 2 ) T s ) I ) A 2 1 B E 1 ,
x n + 1 = Φ 3 ( ( 1 d 1 ) T s ) x ( d 1 T s ) + ( Φ 3 ( ( 1 d 1 ) T s ) I ) A 3 1 B E 1 ,
where I represents the unity matrix, ϕj(ξ) is the transfer matrix, which is expressed as
Φ j ( ξ ) = e A j ξ = I + k = 1 1 k ! A j k ξ k .
In order to complete the discrete-time map, the relationship between the duty cycles and the state variables should be found. During the period of Q1 being on, iLb1 increases, when it reaches Iref, Q1 will be turned off. Therefore, the switching function for Q1 can be derived as
s 1 ( ) = I p v r e f m c d 1 T s + C 1 x ( d 1 T s ) ,
where C1 = [0 − Ks 0 0 0]. As demonstrated in Figure 5, the compensation slope mc can be calculated with mc = Vp/Ts.
In the output voltage control loop, vc is compared with the ramp signal, which is given by
v r a m p = V L + m r a m p ( t   mod   T s ) ,
where VL and mramp are the lower threshold and rising slope of the ramp signal, respectively. Essentially, Q2 is turned on if vc > vramp, and otherwise it is turned off. Therefore, the switching function for Q2 is obtained as
s 2 ( ) = C 2 x ( d 2 T s ) ( m r a m p d 2 T s + V L ) ,
here C2 = [0 0 0 0 1].
Now, an accurate discrete-time model can be derived by combining Equations (10), (12) and (14). Assuming the equilibrium point is denoted as xe. By taking xn + 1 = xn = xe, s1 = 0 and s2 = 0, the equilibrium point xe and stable-state duty cycles D1 and D2 can be obtained. Then, the Jacobian of the equilibrium point for the discrete-time model is evaluated as
J ( x e ) = x n + 1 x n x n + 1 d 2 ( s 2 d 2 ) 1 s 2 x n x n + 1 d 1 ( s 1 d 1 ) 1 ( s 1 x n + s 1 d 2 ( s 2 d 2 ) 1 s 2 x n ) x n = x e .
All the eigenvalues of the Jacobian can be got according to solve the characteristic equation as follows
| λ I J ( x e ) | = 0 .
If all the eigenvalues are inside the unit circle, the system is stable. But if any eigenvalue is outside the unit circle or on the unit circle, then the system will become unstable.
It should be noted that usually the PV microgrids also provide power to the constant power load, not only the pure impedance load as in this paper. If a constant power load is adopted, the dc bus voltage is also required to be controlled for many applications, so the control strategies can be the same as those in this paper. But, the discrete-time model needs to be changed. For example, the load resistor RL is changed to a constant power load Pcpl, then the first state equation in (1) should be changed to
d v o d t = P c p l C f v o + 1 q 1 C f i L b 1 + 1 q 2 C f i L b 2 ,
and the corresponding An in (6) is changed to
A n = [ P c p l C f V o e 2 1 q 1 C f 1 q 2 C f 0 0 q 1 1 L b 1 0 0 0 0 q 2 1 L b 2 0 0 1 L b 2 0 0 0 1 C b a t 1 r b a t C b a t 0 k p 1 H o f R L C f k p 1 H o f τ i 1 ( q 1 1 ) k p 1 H o f C f ( q 2 1 ) k p 1 H o f C f 0 0 ] ,
here, Voe2 is the steady state DC voltage, which will be calculated later at the equilibrium point. The other procedures are similar.

4. The Stability Boundaries of PVDCM

In this study, the system parameters of PVDCM are specified as shown in Table 2, based on which the system stability boundaries are found with the discrete-time model.
Generally speaking, the parameters of the PI controllers and slope compensation Vp are significant parameters to be determined. As we know, kp is required to be large enough to reduce the steady-state error, while τi should be small enough to improve the system dynamic response. However, if kp is too large or τi is too small, instability will occur. Therefore, we need to find the stability boundaries for these controller parameters under the worst operating conditions, with Vpv, Ipvref, Io, and Vocbat serving as space parameters. Here, the operating modes M1 and M2 are taken as an illustration at the most time, to help us find the worst operating condition firstly, then the stable region of the controller parameters are derived.
In order to find the worst operating condition of the output voltage control loop for the bidirectional converter, kp2 = 1, τi2 = 50 μs, and Vp = 0.1 are kept constant to make sure the charge current control loop and the peak current control loop are stable. Corresponding to the parameters specified in Table 2, the explicit stability boundaries demonstrated in Figure 6 are obtained by the discrete-time model established in Section 3, where B12 is operating mode boundary between M1 and M2.
By observing Figure 6, some conclusions can be drawn as follows:
  • The system will become unstable with the PI parameters change. As kp1 gets larger or τi1 gets smaller, it’s much easier for the output voltage control loop to lose its stability.
  • As the output voltage regulator is shared in M1, M2, and M3, the system stability is always affected by the parameters kp1 and τi1 (in mode M2 and M3 are similar), which have narrower stable regions in M1 than that in the other two operating modes. Consequently, they need to be designed in operating mode M1.
  • Vpv and Ipvref are related to the PV panels, which also have influence on the stability and also determine the worst operating condition for the voltage control loop in operating mode M1. The parameters Vpv and Ipvref become the smaller in M1, the system operating condition will become worse.
For the sake of length constraint, some stability boundaries are ignored here. With the similar analysis, it can be known that Vocbat is smaller, which also makes the the output voltage control loop become unstable more readily. What is worse, when Vpv decreases, the stable region of the peak current control loop will also shrink.
At present, when the system works in the worst operating conditions in the operating mode M1, the stability boundaries of “Regulator1” and slope compensation Vp are derived in Figure 7. From Figure 7a, it can be seen that if Vp > 0.08 V, the stability of the peak current control loop can be guaranteed all the time. It can be found that, from Figure 7b, τi1 should be larger than 1.1 ms to maintain the output voltage control loop stable when kp1 = 1 (In this paper, τi1 is selected as 1.2 ms).
In order to simplify the discussion, the derivation processes of the stability boundaries for “Regulator2” and “Regulator3” are omitted here, as they are similar to the above analysis. The final results of parameters are given as kp2 = 1, τi2 = 10 μs, kp3 = 10, τi3 = 22 μs.

5. Experimental Validation

In order to verify the effectiveness of the energy management strategy and the nonlinear analysis method based on the discrete-time model, a 240 W prototype is established in the laboratory, as shown in Figure 8. The specifications of the PVDCM system are the same as that in Table 2, where the normal battery voltage Vbat is 36 V, which is composed of three 12 V battery modules, and the IRFP4668PbFs are adopted as the switches Q1 ~ Q3, and the 60APU02PbF is used as power diode D.
When Vpv = 31 V with different Ipvref and Vocbat, the stable-state experiment waveforms at full load in three operating modes are exhibited in Figure 9a–d. In Figure 9a–c, the waveforms from the top to the bottom are the DC bus voltage vo, the drive signals for Q1 and Q2, VGS1 and VGS2, the two inductor currents iLb1 and iLb2, respectively. In Figure 9d, the waveforms from the top to the bottom are vo, vbat, iLb1, and iLb2, respectively. From Figure 9a, when Ipvref = 0.53 A (current sampling coefficient Ks = 0.1), the equivalent PV panels’ power is smaller than the load, i.e., ppv < Po, thus the battery provides the complementary power to the load, here, iLb2 > 0, corresponding to the power flow in M1 as in Figure 2a. In Figure 9b, when Ipvref = 1.1 A, ppv > Po, excessive power is provided to the battery, and the measured average value ILb2 is −2.5 A, so ILb2 < 0, corresponding to the power flow in M1 as shown in Figure 2b (only the inductor current is reversed compared to the previous mode in M1). It can be seen from Figure 9c, when Ipvref = 2 A, theoretically the average value of iLb1 can reach 20 A, but the actual average value is measured to be 12.2 A. This is because the charge current is controlled and ILb2 = −3 A, the PV panels change from the MPPT mode to the constant voltage mode, corresponding to the power flow in M2 as shown in Figure 2c. Under the same condition, if Vbat reaches 40 V, the charge voltage control loop will be triggered and the charge current will decrease, as demonstrated in Figure 9d, corresponding to the power flow in M3 as shown in Figure 2d. Based on the above analysis, it can be concluded that the PVDCM system can operate stably in all three operating modes.
To further examine the dynamic responses and the operating mode switching procedures, the load stepping up from 10% load to full load and then stepping down to 10% load are implemented, the experimental results are shown in Figure 10, where vo and vbat are only given the AC components. From Figure 10a, it can be observed that when the PV panels’ maximum power Pm = 105 W, which is not enough to power the full load but is much larger than 10% load, then excessive power will be provided to the battery and the charge current is smaller than Ibmax. Therefore, the PVDCM is working in M1 before and after the load changes, only the battery exits from providing power to the load and is charged. Here, the PV panels are operating in MPPT mode with ILb1 kept constant, and the output power is almost constant, which agrees with the theoretical design. In Figure 10b, Pm = 600 W, the PVDCM are always working in M2 with an ILb2 which doesn’t change, the power provided by the PV panels varies to keep power balanced, while the battery is always in a constant current charging mode with charge current of 3 A. In Figure 10c, Pm = 600 W, the battery is basically full-charged at this time, so the PVDCM is working in M3 all the time, the power provided by the PV panels varies to supply the load before and after the load changes, while the battery is in a constant voltage charging mode and the charge current is relatively small. When the load changes, the operating mode also switches, the corresponding experimental waveforms are shown in Figure 10d,e. In Figure 10d, when the load steps up to full load and then steps down to 10% load, the system will switch from M2 to M1 automatically, and then switch back to M2 again. From it, it can be seen that both ILb1 and ILb2 varies to keep power balanced when the load changes. Figure 10e shows that the system will switch from mode M3 to M1 automatically, and then switch back to M3 again when the load steps up and steps down.
The above experimental results come from the stable system which is designed based on the stability boundaries in Section 5. To further verify the stability analysis, the controller parameters are chosen in the unstable region are tested. Such as τi1 should be larger than 1.1 ms to maintain the output voltage control loop stable from Figure 7, and τi3 > 8.7 μs and Vp > 0.08 V should be guaranteed in M3 to keep the system stable. Here, τi1 = 0.8 ms in M1 and τi3 = 4.7 μs, Vp = 0 V in M3 are performed in Figure 11, the other controller parameters are kept the same as the stable operation in Figure 9; Figure 10. From Figure 11a, it can be clearly seen that a low frequency oscillation occurs as τi1 is too small and in the unstable region in Figure 7. Figure 11b exhibits the coexistence of a low frequency oscillation and subharmonic oscillation, as a small τi3 mainly affects the low frequency stability and Vp has a great influence on the high frequency stability.
All the above experiment results demonstrate that when the power supplied by the PV panels and the load have variations, the PVDCM system is capable of switching among the three operating modes smoothly, and indicating that the energy management strategy proposed in this paper and the nonlinear analysis method in the closed-loop design are effective.

6. Conclusions

In order to make sure the PVDCM system can switch between different modes smoothly and automatically, a control strategy with optimized power utilization is proposed in this paper, and the principle of this strategy is explicitly described. Then, in order to guarantee the system stable under all required conditions, the stability analysis based on the nonlinear analysis method with a discrete-time mapping model is adopted to design the closed loop parameters. With the discrete-time model, the stability boundaries of different parameters are derived, which first is used to find the worst operating condition for each control loop and then the stable region can be derived under the worst operating conditions. The controller parameters then can be chosen in the stable region to ensure the PVDCM system can operate stably in all operating modes. Finally, a prototype is built in the laboratory, the experimental results verify the effectiveness of the proposed energy management strategy and the stability analysis based on the nonlinear analysis method used in the closed-loop design.
In the future, more works need to be completed. First, the critical and quantitative comparison between the proposed method in this paper and the other presented methods are worth studying. Second, more complicated DC microgrids need to be covered. Such as the system multiple integrated renewable energy resources simultaneously, the system with multiple energy storage devices and so on. Second, the control strategy for the complicated system will be studied and try to provide a unified control method for the standalone application and grid-connected application. Third, the stability issue should be further addressed and compared with different modeling methods.

Author Contributions

Conceptualization, methodology, software, validation, formal analysis, investigation, resources, data curation, writing—original draft preparation, visualization, supervision, project administration, and funding acquisition, X.X.; writing—review and editing, Y.Y., X.X. All authors have read and agree to the published version of the manuscript.

Funding

This research was funded by the National Natural Science Foundation of China under Grant 51707065.

Conflicts of Interest

The authors declare no conflict of interest.

References

  1. Xu, M.; Ruan, X.B.; Liu, F.X.; Yang, D.S. Energy Management for hybrid photovoltaic-fuel cell power system. Trans. China Electrotech. Soc. 2010, 25, 166–175. [Google Scholar]
  2. Zhou, H.H.; Bhattacharya, T.; Duong, T.; Siew, T.S.T.; Khambadkone, A.M. Composite Energy Storage System Involving Battery and Ultracapacitor with Dynamic Energy Management in Microgrid Applications. IEEE Trans. Power Electron. 2011, 26, 923–930. [Google Scholar] [CrossRef]
  3. Liao, Z.L.; Xu, Y.J.; Shi, W.D. Wind-Photovoltaic Hybrid Double-Input Buck-Boost DC/DC Converter. IEEE Trans. Ind. Electron. 2014, 51, 63–66. [Google Scholar]
  4. Umuhoza, J.; Zhang, Y.Z.; Zhao, S.; Mantooth, H.A. An adaptive control strategy for power balance and the intermittency mitigation in battery-PV energy system at residential DC microgrid level. In Proceedings of the 2017 IEEE Applied Power Electronics Conference and Exposition (APEC), Tampa, FL, USA, 26–30 March 2017. [Google Scholar]
  5. Das, S.; Akella, A.K. A Control Strategy for Power Management of an Isolated Micro Hydro-PV-Battery Hybrid Energy System. In Proceedings of the ICEES, Chennai, India, 7–9 February 2018. [Google Scholar]
  6. Xu, Q.; Hu, X.; Wang, P. A Decentralized Dynamic Power Sharing Strategy for Hybrid Energy Storage System in Autonomous DC Microgrid. IEEE Trans. Ind. Electron. 2017, 64, 5930–5941. [Google Scholar] [CrossRef]
  7. Jia, Y.H.; Liu, T.; Wu, H.F. A SiC-Based Dual-Input Buck-Boost Converter with Independent MPPT for Photovoltaic Power Systems. In Proceedings of the IECON, Washington, DC, USA, 21–23 October 2018. [Google Scholar]
  8. Qin, W.P.; Liu, X.S.; Han, X.Q.; Liu, J.Y.; Zhu, X.; Mi, X.D. An Improved Control Strategy of Automatic Charging/Discharging of Energy Storage System in DC Microgrid. Power Syst. Technol. 2014, 38, 1827–1834. [Google Scholar]
  9. Anounce, K.; Bouya, M.; Ghazouani, M. Hybrid renewable energy system to maximize the electrical power production. In Proceedings of the IRSEC, Marrakech, Morocco, 14–17 November 2016. [Google Scholar]
  10. Kwon, M.H.; Choi, S.W. Control Scheme for Autonomous and Smooth Mode Switching of Bidirectional DC-DC Converters in a DC Microgrid. IEEE Trans. Power Electron. 2018, 33, 7094–7104. [Google Scholar] [CrossRef]
  11. Mobarrez, M.; Fregosi, D.; Jalali, G.; Bhattacharya, S.; Bahmani, M.A. A Novel Control Method for Preventing the PV and Load Fluctuations in a DC Microgrid from Transferring to the AC Power Grid. In Proceedings of the 2017 IEEE Second International Conference on DC Microgrids (ICDCM), Nuremburg, Germany, 27–29 June 2017. [Google Scholar]
  12. Mi, Y.; Wu, Y.W.; Zhu, Y.Z.; Fu, Y.; Wang, C.S. Coordinated Control for Autonomous DC Microgrid with Dynamic Load Power Sharing. Power Syst. Technol. 2017, 41, 440–447. [Google Scholar]
  13. Lu, X.N.; Sun, K.; Guerrero, J.M.; Vasquez, J.C.; Huang, L.P. State-of-Charge Balance Using Adaptive Droop Control for Distributed Energy Storage Systems in DC Microgrid Applications. IEEE Trans. Ind. Electron. 2014, 61, 2804–2815. [Google Scholar] [CrossRef] [Green Version]
  14. Sharma, R.K.; Mishra, S. Dynamic Power Management and Control of a PV PEM Fuel-Cell-Based Standalone ac/dc Microgrid Using Hybrid Energy Storage. IEEE Trans. Ind. Appl. 2018, 54, 526–538. [Google Scholar] [CrossRef]
  15. Guo, L.; Feng, Y.B.; Li, X.L.; Wang, C.S.; Li, Y.W. Stability Analysis and Research of Active Damping Method for DC Microgrids. Proc. CSEE 2016, 36, 927–936. [Google Scholar]
  16. Gu, Y.J.; Li, W.H.; He, X.N. Frequency-Coordinating Virtual Impedance for Autonomous Power Management of DC Microgrid. IEEE Trans. Power Electron. 2015, 30, 2328–2337. [Google Scholar] [CrossRef]
  17. Gu, Y.J.; Xiang, X.; Li, W.H.; He, X.N. Mode-Adaptive Decentralized Control for Renewable DC Microgrid with Enhanced Reliability and Flexibility. IEEE Trans. Power Electron. 2014, 29, 5072–5080. [Google Scholar] [CrossRef]
  18. Khorsandi, A.; Ashourloo, M.; Mokhtari, H. A Decentralized Control Method for a Low-Voltage DC Microgrid. IEEE Trans. Energy Convers. 2014, 29, 793–801. [Google Scholar] [CrossRef]
  19. Xie, Y.; Jia, R.; Dong, K.S.; Shen, W.C.; Li, Z.; Yang, N. Modeling and Simulation of an AC Microgrid. High Volt. Appar. 2015, 51, 101–107. [Google Scholar]
  20. Li, X.L.; Guo, L.; Wang, C.S.; Li, Y.W. Key Technologies of DC Microgrids: An overview. Proc. CSEE 2016, 36, 2–17. [Google Scholar]
  21. Su, M.; Liu, Z.J.; Sun, Y.; Han, H.; Hou, X.C. Stability Analysis and Stabilization Methods of DC Microgrid with Multiple Parallel-Connected DC-DC Converters Loaded by CPLs. IEEE Trans. Smart Grid 2018, 9, 132–142. [Google Scholar] [CrossRef]
  22. Merabet, A.; Ahmed, K.; Ibrahim, H.; Beguenane, R.; Ghias, A. Energy Management and Control System for Laboratory Scale Microgrid based Wind-Pv-Battery. IEEE Trans. Sustain. Energy 2017, 8, 145–154. [Google Scholar] [CrossRef]
  23. Xu, Q.; Zhang, C.; Wen, C.; Wang, P. A novel composite nonlinear controller for stabilization of constant power load in dc microgrid. IEEE Trans. Smart Grid 2019, 10, 752–761. [Google Scholar] [CrossRef]
  24. Yi, Z.H.; Dong, W.X.; Etemadi, A.H. A Unifified Control and Power Management Scheme for PV-Battery-Based Hybrid Microgrids for Both Grid-Connected and Islanded Modes. IEEE Trans. Smart Grid 2018, 9, 5975–5985. [Google Scholar] [CrossRef]
  25. Abbes, D.; Martinez, A.; Champenois, G. Eco-design optimisation of an autonomous hybrid wind-photovoltaic system with battery storage. IET Renew. Power Gener. 2012, 6, 358–371. [Google Scholar] [CrossRef]
  26. Shi, J.; Zheng, Z.H.; Ai, Q. Modeling of DC microgrid and stability analysis. Electr. Power Autom. Equip. 2010, 30, 86–90. [Google Scholar]
  27. Radwan, A.A.A.; Mohamed, Y.A.-R.I. Linear active stabilization of converter-dominated DC microgrids. IEEE Trans. Smart Grid 2012, 3, 203–216. [Google Scholar] [CrossRef]
  28. Dragicevic, T.; Lu, X.; Vasquez, J.C.; Guerrero, J.M. DC microgrids—Part Ⅰ: A review of control strategies and stabilization techniques. IEEE Trans. Power Electron. 2016, 31, 4876–4891. [Google Scholar] [CrossRef] [Green Version]
  29. Li, Y.; Ruan, X.B.; Yang, D.S. Modeling, analysis and design for hybrid power systems with dual-input dc-dc converter. In Proceedings of the IEEE Energy Conversion Congress and Exposition (ECCE), San Jose, CA, USA, 20–24 September 2009. [Google Scholar]
  30. Liu, D.W.; Li, H.; Marlino, L.D. Design of a 6 kW multiple-input bi-directional dc/dc converter with decoupled current sharing control for hybrid energy storage elements. In Proceedings of the IEEE Applied Power Electronics Conference and Exposition (APEC), Anaheim, CA, USA, 25 February–1 March 2007. [Google Scholar]
  31. Middlebrook, R.D. Small-signal modeling of pulse-width modulated switched-mode power converters. Proc. IEEE 1988, 76, 343–354. [Google Scholar] [CrossRef]
  32. Middlebrook, R.D. Modeling current-programmed buck and boost regulators. IEEE Trans. Power Electron. 1989, 4, 36–52. [Google Scholar] [CrossRef] [Green Version]
  33. Lehman, B.; Bass, R.M. Switching frequency dependent averaged models for PWM DC-DC converters. IEEE Trans. Power Electron. 1996, 11, 89–98. [Google Scholar] [CrossRef] [Green Version]
  34. Li, X.; Ruan, X.B.; Xiong, X.L.; Jin, Q.; Tse, C.K. Stability Issue of Cascaded Systems with Consideration of Switching Ripple Interaction. IEEE Trans. Power Electron. 2019, 34, 7040–7052. [Google Scholar] [CrossRef]
  35. Qiu, Y.; Xu, M.; Sun, J.; Lee, F.C. A generic high-frequency model for the nonlinearities in buck converters. IEEE Trans. Power Electron. 2007, 22, 1970–1977. [Google Scholar] [CrossRef]
  36. Yue, X.; Zhuo, F.; Yang, S.; Pei, Y.; Yi, H. A matrix-based multifrequency output impedance model for beat frequency oscillation analysis in distributed power systems. IEEE J. Emerg. Sel. Top. Power Electron. 2016, 4, 80–92. [Google Scholar] [CrossRef]
  37. Wereley, N.M. Analysis and Control of Linear Periodically Time Varying Systems. Ph.D. Thesis, Department Aeronaut, Astronaut, Massachusetts Institute of Technology, Cambridge, MA, USA, 1990. [Google Scholar]
  38. Tse, C.K. Complex Behavior of Switching Power Converters; CRC Press: Boca Raton, FL, USA, 2003. [Google Scholar]
  39. Xiong, X.L.; Tse, C.K.; Ruan, X.B. Bifurcation analysis of standalone photovoltaic-battery hybrid power system. IEEE Trans. Circuits Syst. I Regul. Pap. 2013, 60, 1354–1365. [Google Scholar] [CrossRef]
  40. Tse, C.K. Flip bifurcation and chaos in three-state boost switching regulators. IEEE Trans. Circuits Syst. I Fundam. Theory Appl. 1994, 41, 16–23. [Google Scholar] [CrossRef]
Figure 1. Main topology of the studied photovoltaic-based DC microgrid (PVDCM).
Electronics 09 00941 g001
Figure 2. Power flow schematics and corresponding control requirements of PVDCM, which operates in: (a) M1 with Pm < Po; (b) M1 with Pm > Po; (c) M2; (d) M3.
Electronics 09 00941 g002
Figure 3. Schematic diagram of maximum power point tracking (MPPT) control for photovoltaic (PV) panels.
Electronics 09 00941 g003
Figure 4. The control system of PVDCM.
Electronics 09 00941 g004
Figure 5. Typical waveforms for peak current control loop.
Electronics 09 00941 g005
Figure 6. The stability boundaries of output voltage control loop: (a) Stability boundaries in M1; (b) Stability boundaries in M2.
Electronics 09 00941 g006
Figure 7. The parameter space of control parameters at the worst operating condition in M1: (a) The parameter space of Vpv and Vp; (b) The parameter space of “Regulator1”.
Electronics 09 00941 g007
Figure 8. Picture of the prototype.
Electronics 09 00941 g008
Figure 9. Steady experiment waveforms in three operating modes: (a) M1 with Ipvref = 0.53 A, and Vocbat = 39 V; (b) M1 with Ipvref = 1.1 A, Vocbat = 39 V; (c) M2 with Ipvref = 2.5 A, and Vocbat = 39 V; (d) M3 with Ipvref = 2.5 A, and Vocbat ≈ 40 V.
Electronics 09 00941 g009
Figure 10. Experiment waveforms of load stepping up and load stepping down: (a) M1 with Ipvref = 0.35 A (Pm = 105 W), Vocbat = 39 V; (b) M2 with Ipvref = 2 A (Pm = 600 W), Vocbat = 39 V; (c) M3 with Ipvref = 2 A (Pm = 600 W), Vocbat ≈ 40 V; (d) Ipvref = 0.93 A (Pm = 280 W), Vocbat = 39 V; (e) Ipvref = 0.93 A (Pm = 280 W), Vocbat ≈ 40 V.
Electronics 09 00941 g010
Figure 11. Experiment waveforms in operating mode M1 and M3: (a) M1 with Ipvref = 0.3 A, Vocbat = 38 V, Vpv = 26 V, Ipv_ref = 0.3 A, Io = 3.3 A and τi1 = 0.8 ms; (b) M3 with Vpv = 24.5 V, Ipvref = 2 A, Io = 1 A, τi3 = 4.7 μs, Vp = 0 V.
Electronics 09 00941 g011
Table 1. The multiple operating modes of PVDCM.
Pm < PoPm ≥ Po
ibat < Ibmaxibat ≥ Ibmax
vbat ≤ VbminOFFM1M2
Vbmin < vbat < VbmaxM1M1M2
vbat ≥ VbmaxM1M3M3
Table 2. The parameters of PVDCM.
ParametersDescriptionValues
VpvPV output voltage20~34 V
IpvrefPV current reference from MPPT0~3 A
VocbatEquivalent battery voltage34~40 V
rbatEquivalent battery resistor8 mΩ
VbmaxMaximum battery voltage limit40 V
IbmaxMaximum battery current limit3 A
VoDC bus voltage48 V
IoLoad current0~5 A
Lb1Inductance for the inductor Lb148 μH
Lb2Inductance for the inductor Lb248 μH
CfCapacitance of output capacitor1.88 mF
CbatEquivalent battery capacitance400 μF
KsCurrent sampling coefficient0.1
fsSwitching frequency100 kHz

