Categorization of Green Spaces for a Sustainable Environment and Smart City Architecture by Utilizing Big Data


 , , ,
, , ,
Abstract
1. Introduction
2. Literature Review
3. Materials
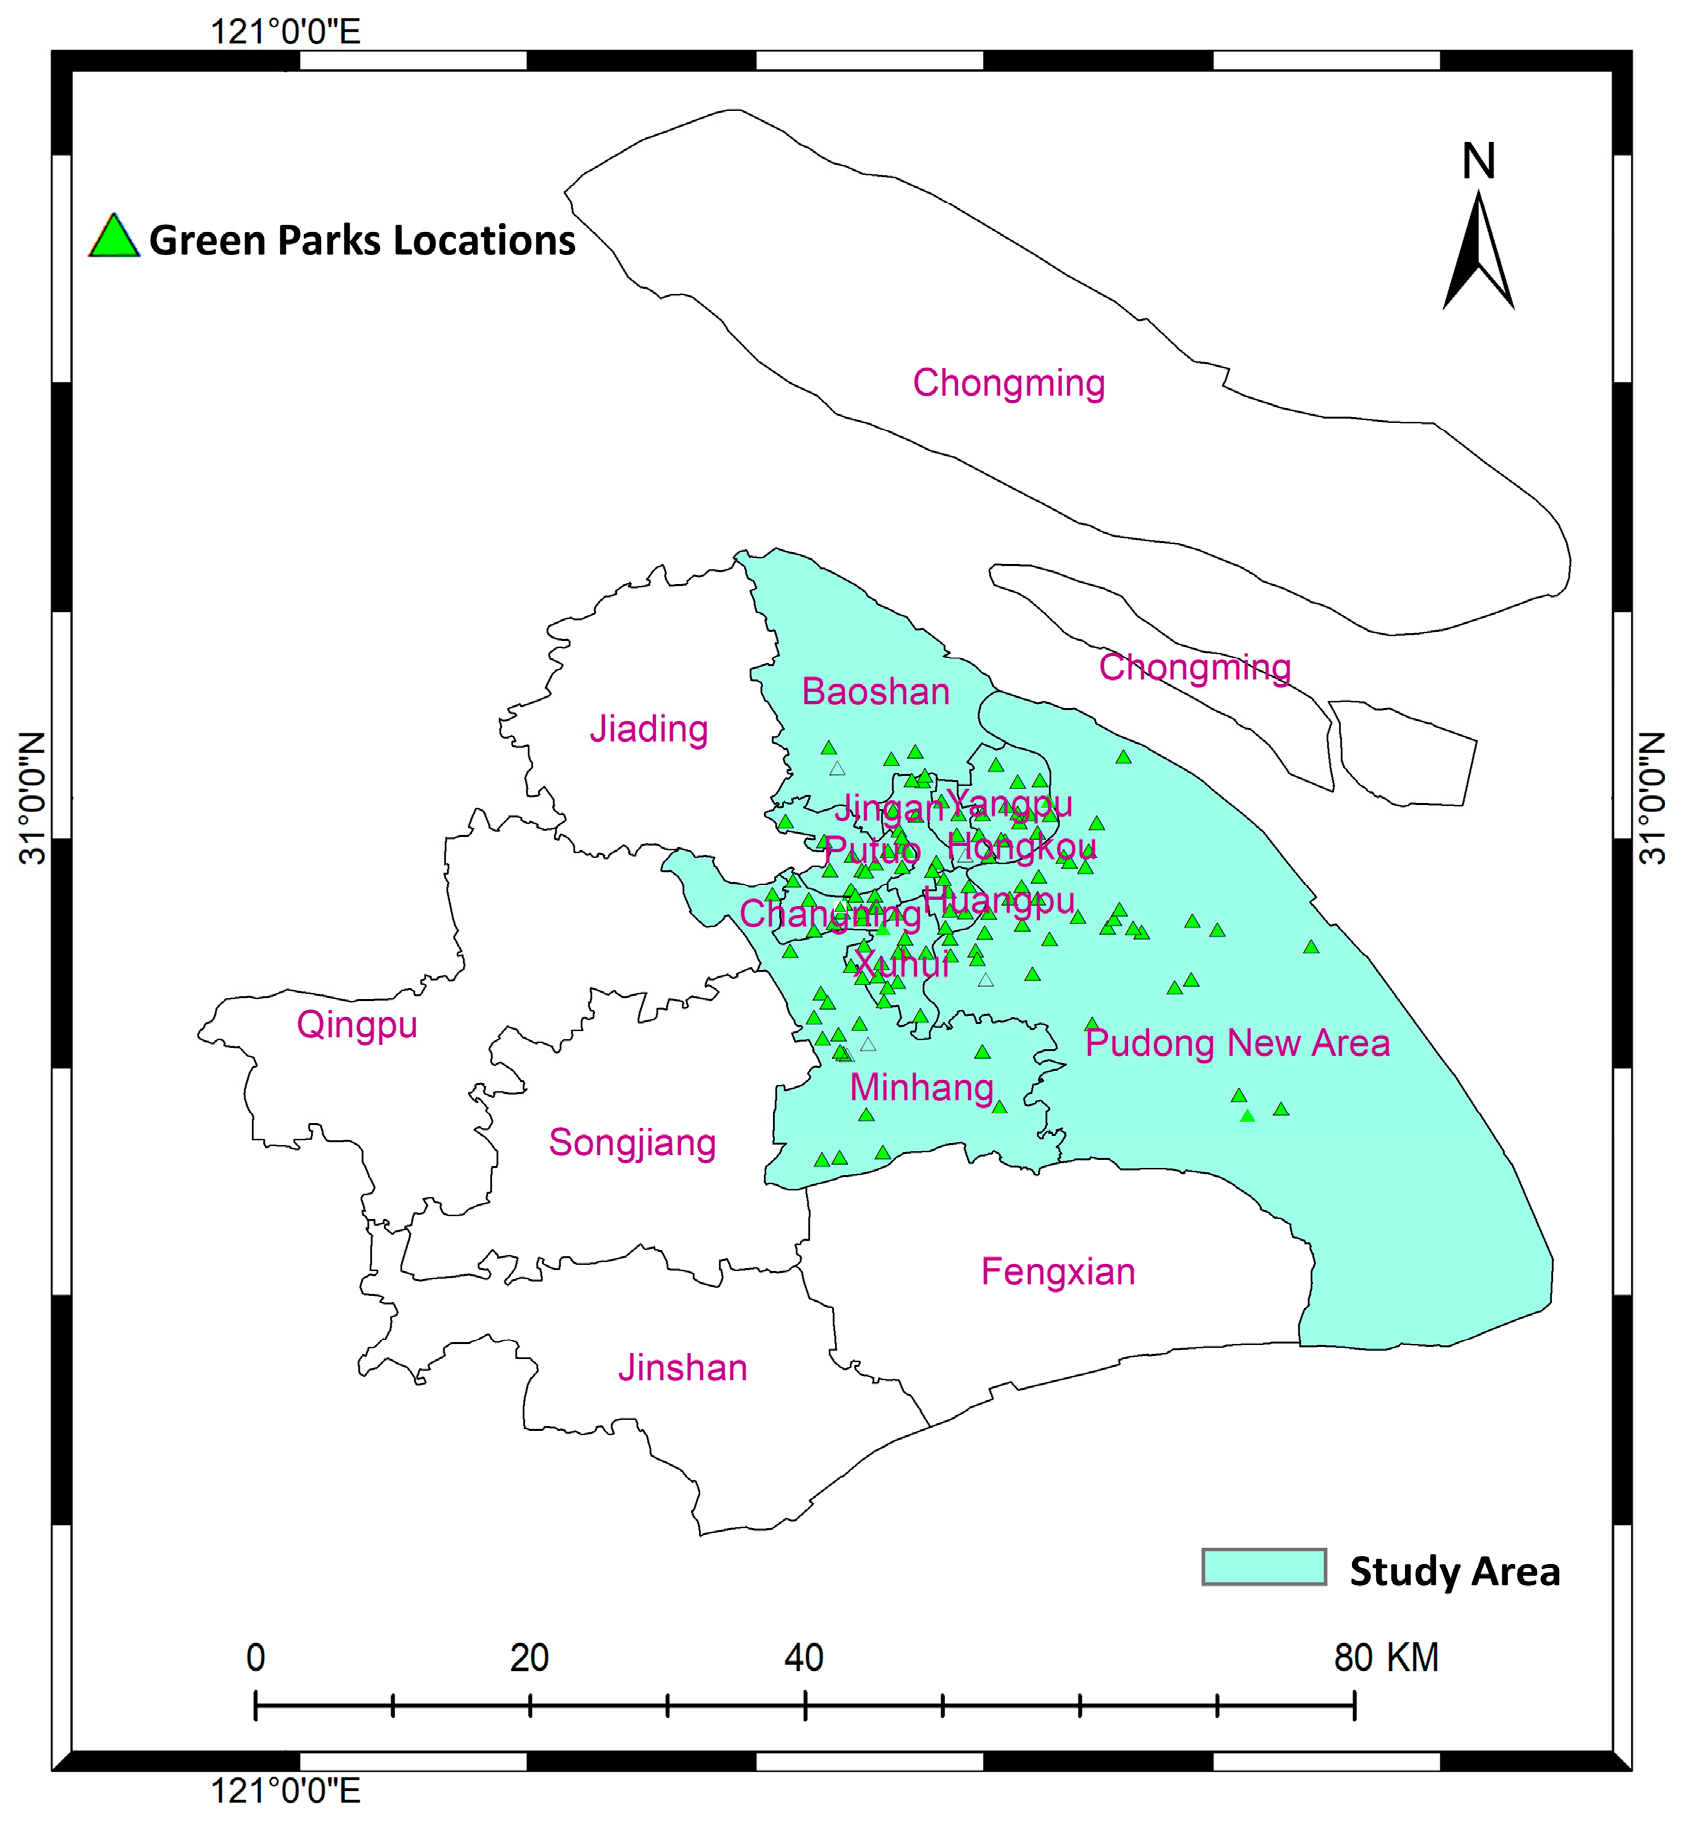
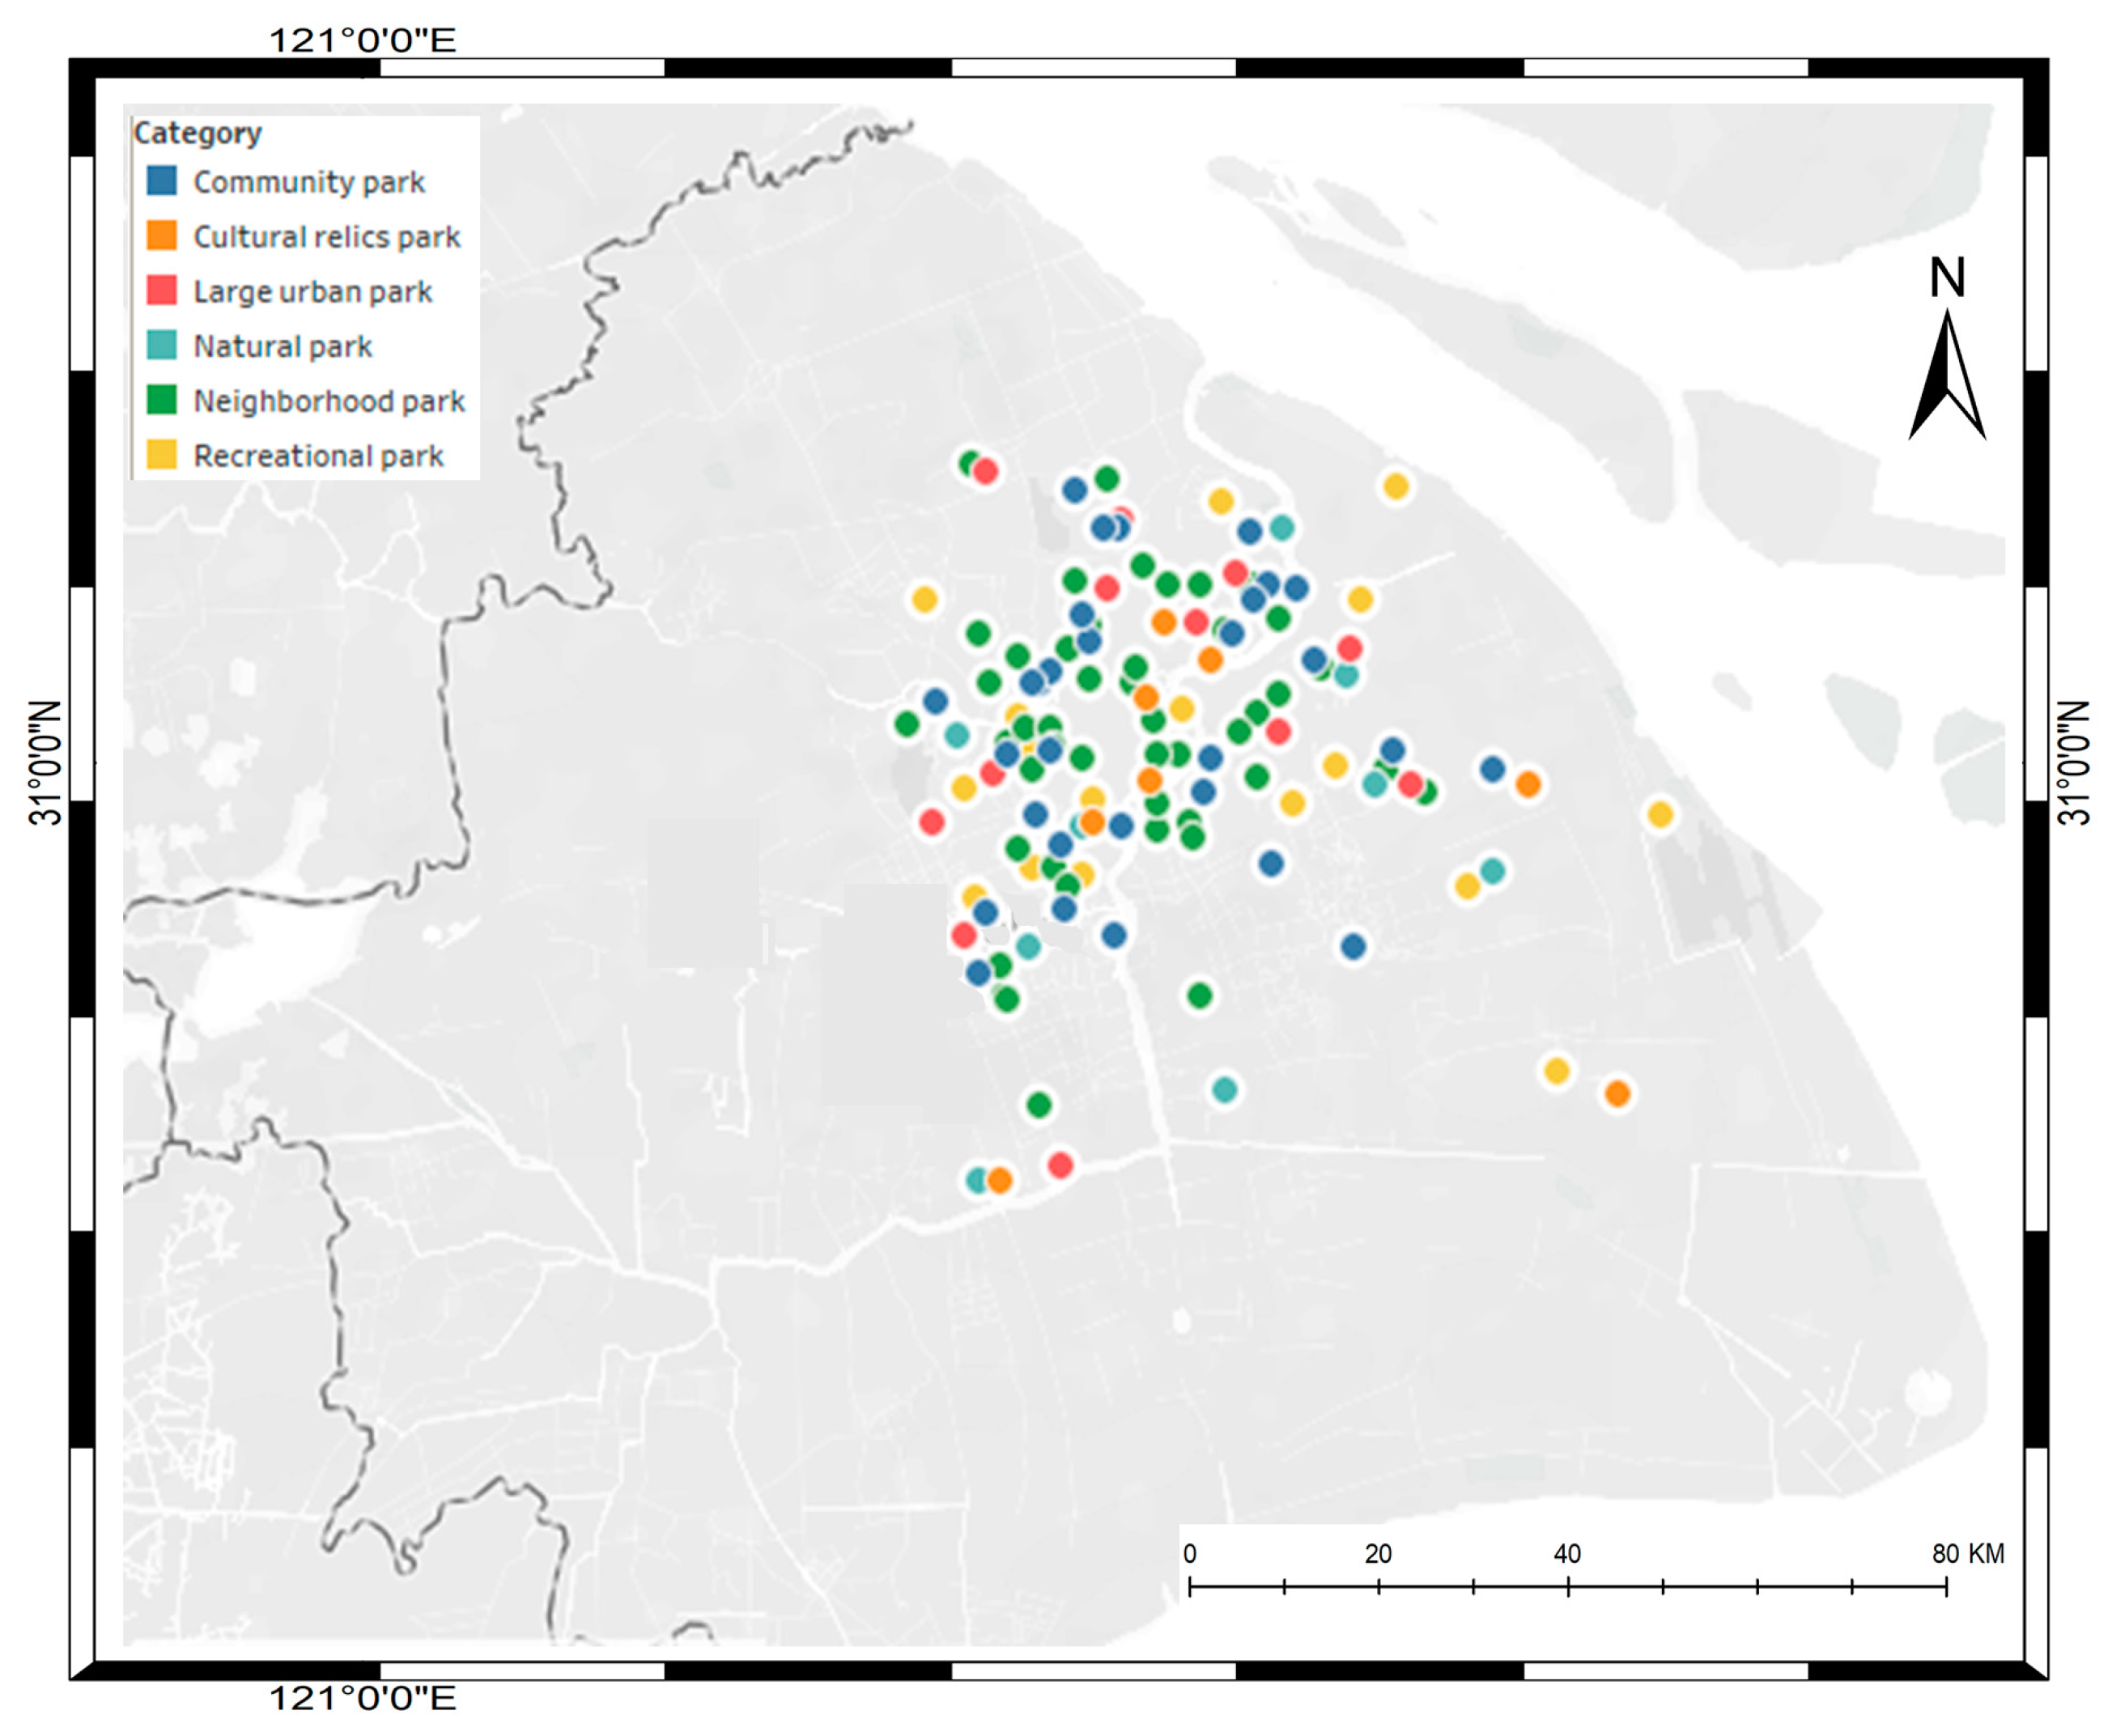
3.1. Study Area
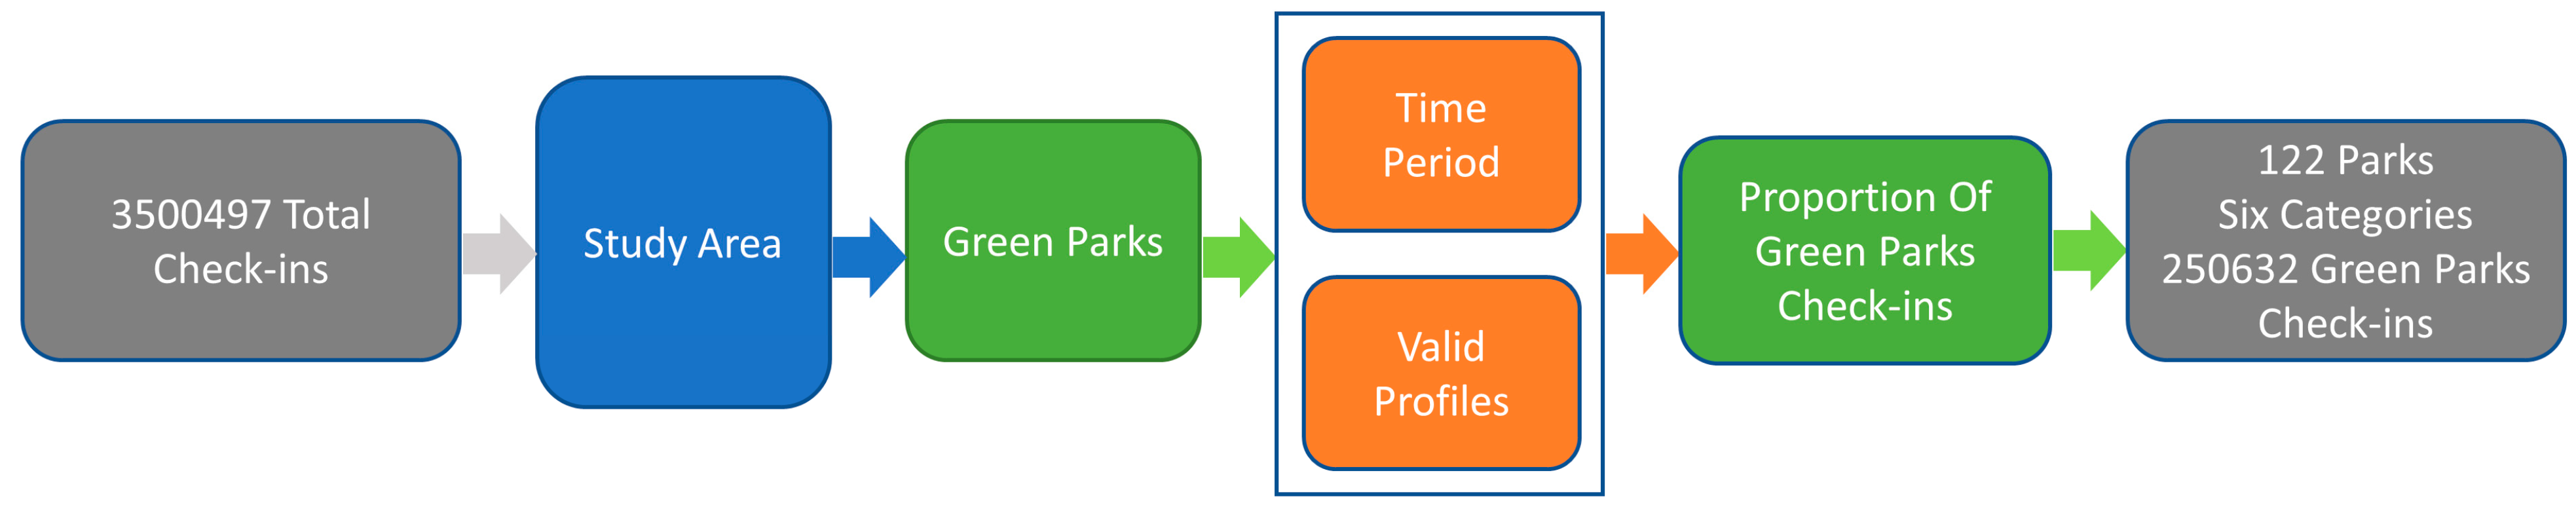
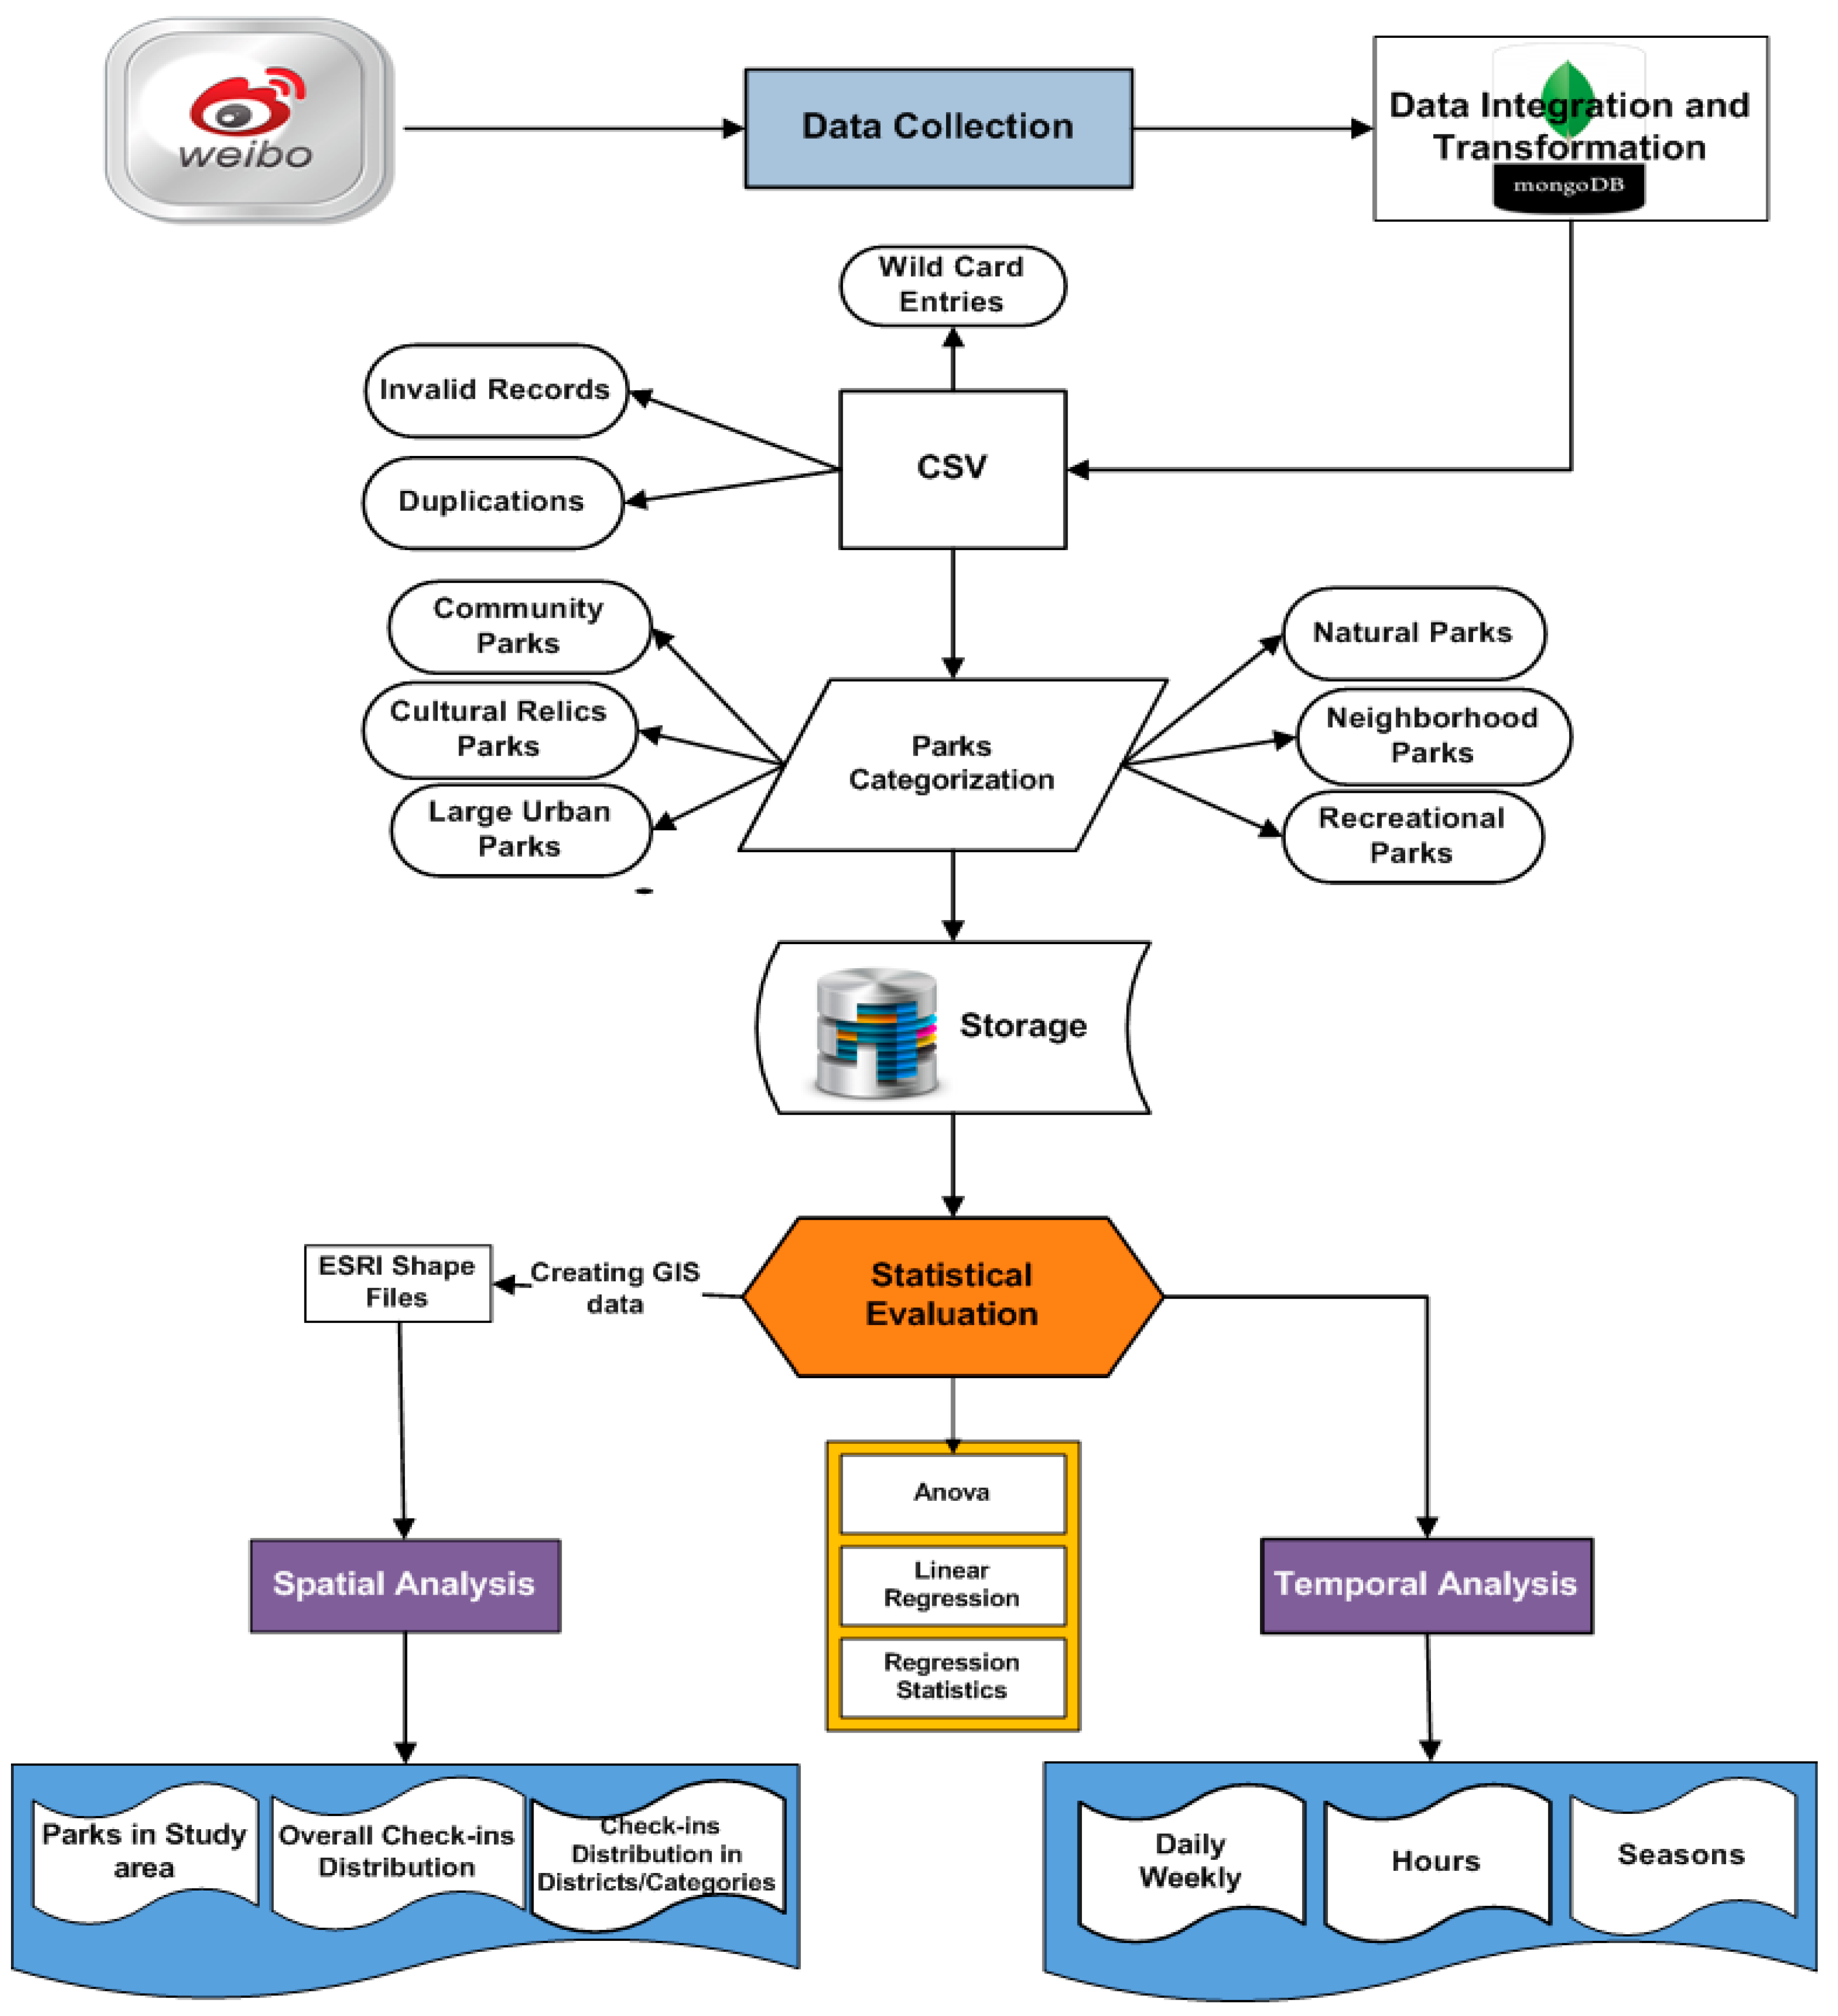
3.2. Dataset
- The geographical location of data should exist only in Shanghai;
- The lowest number of check-ins per green park should be 100 within the time period of the study;
- Every record should have a geo-location (latitude and longitude), user id, time, gender, day, month and year;
- Parks that are separated into several geo-locations inside the green spaces were combined into one geo-location.
3.3. Park Type Classification
4. Methodology
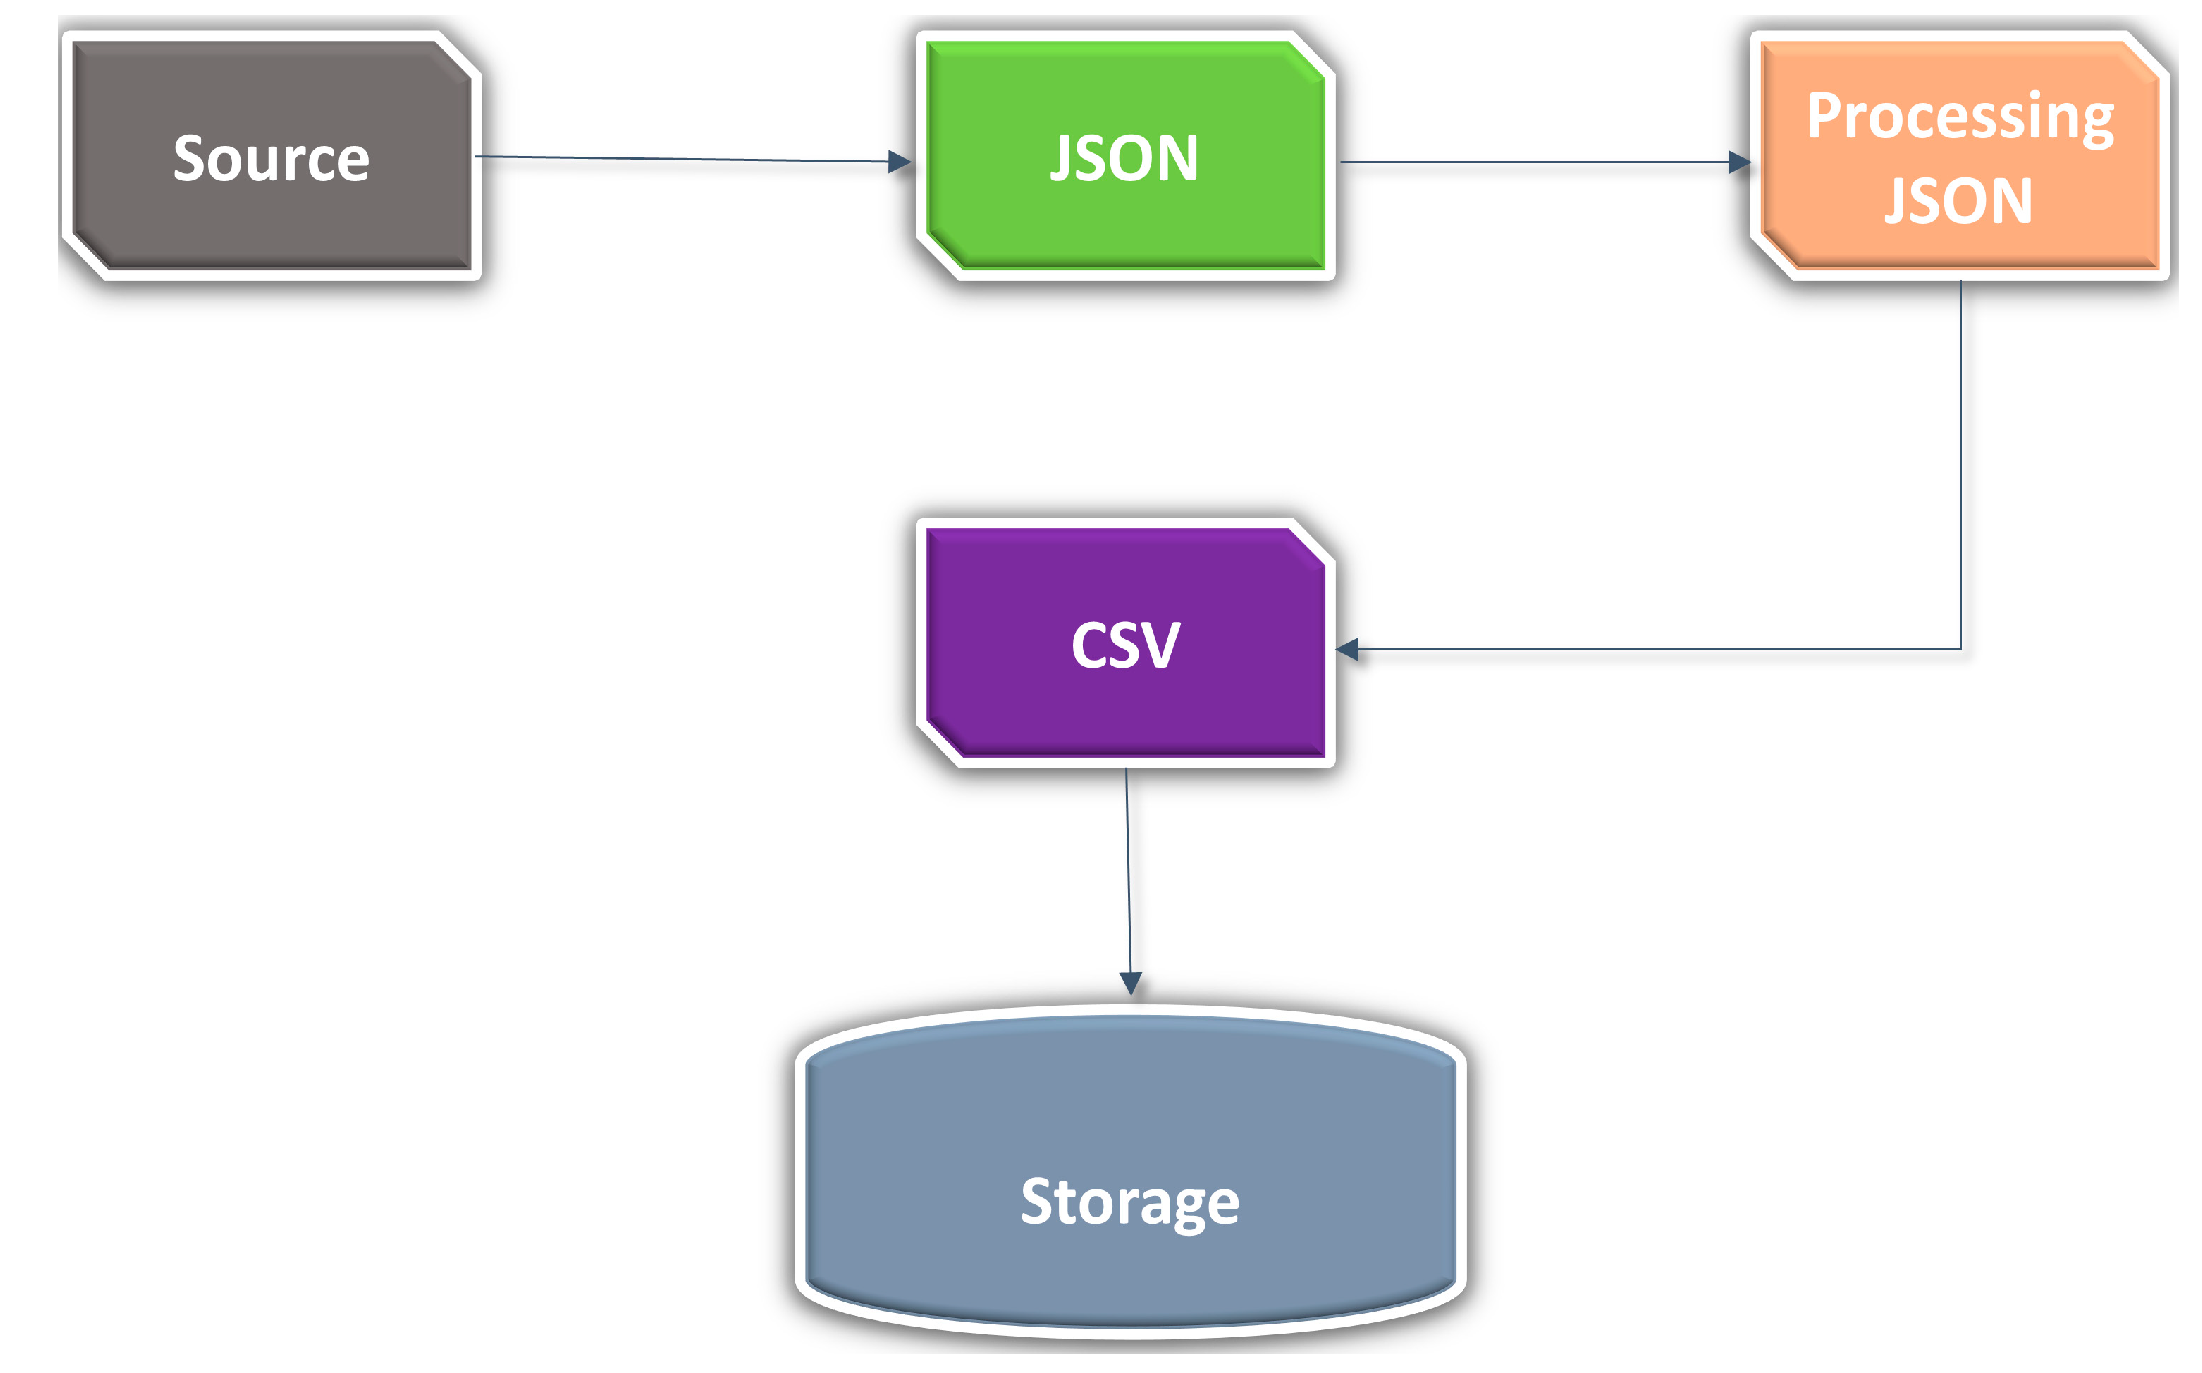
4.1. Data Preparation
4.2. Social Media Data Analytics
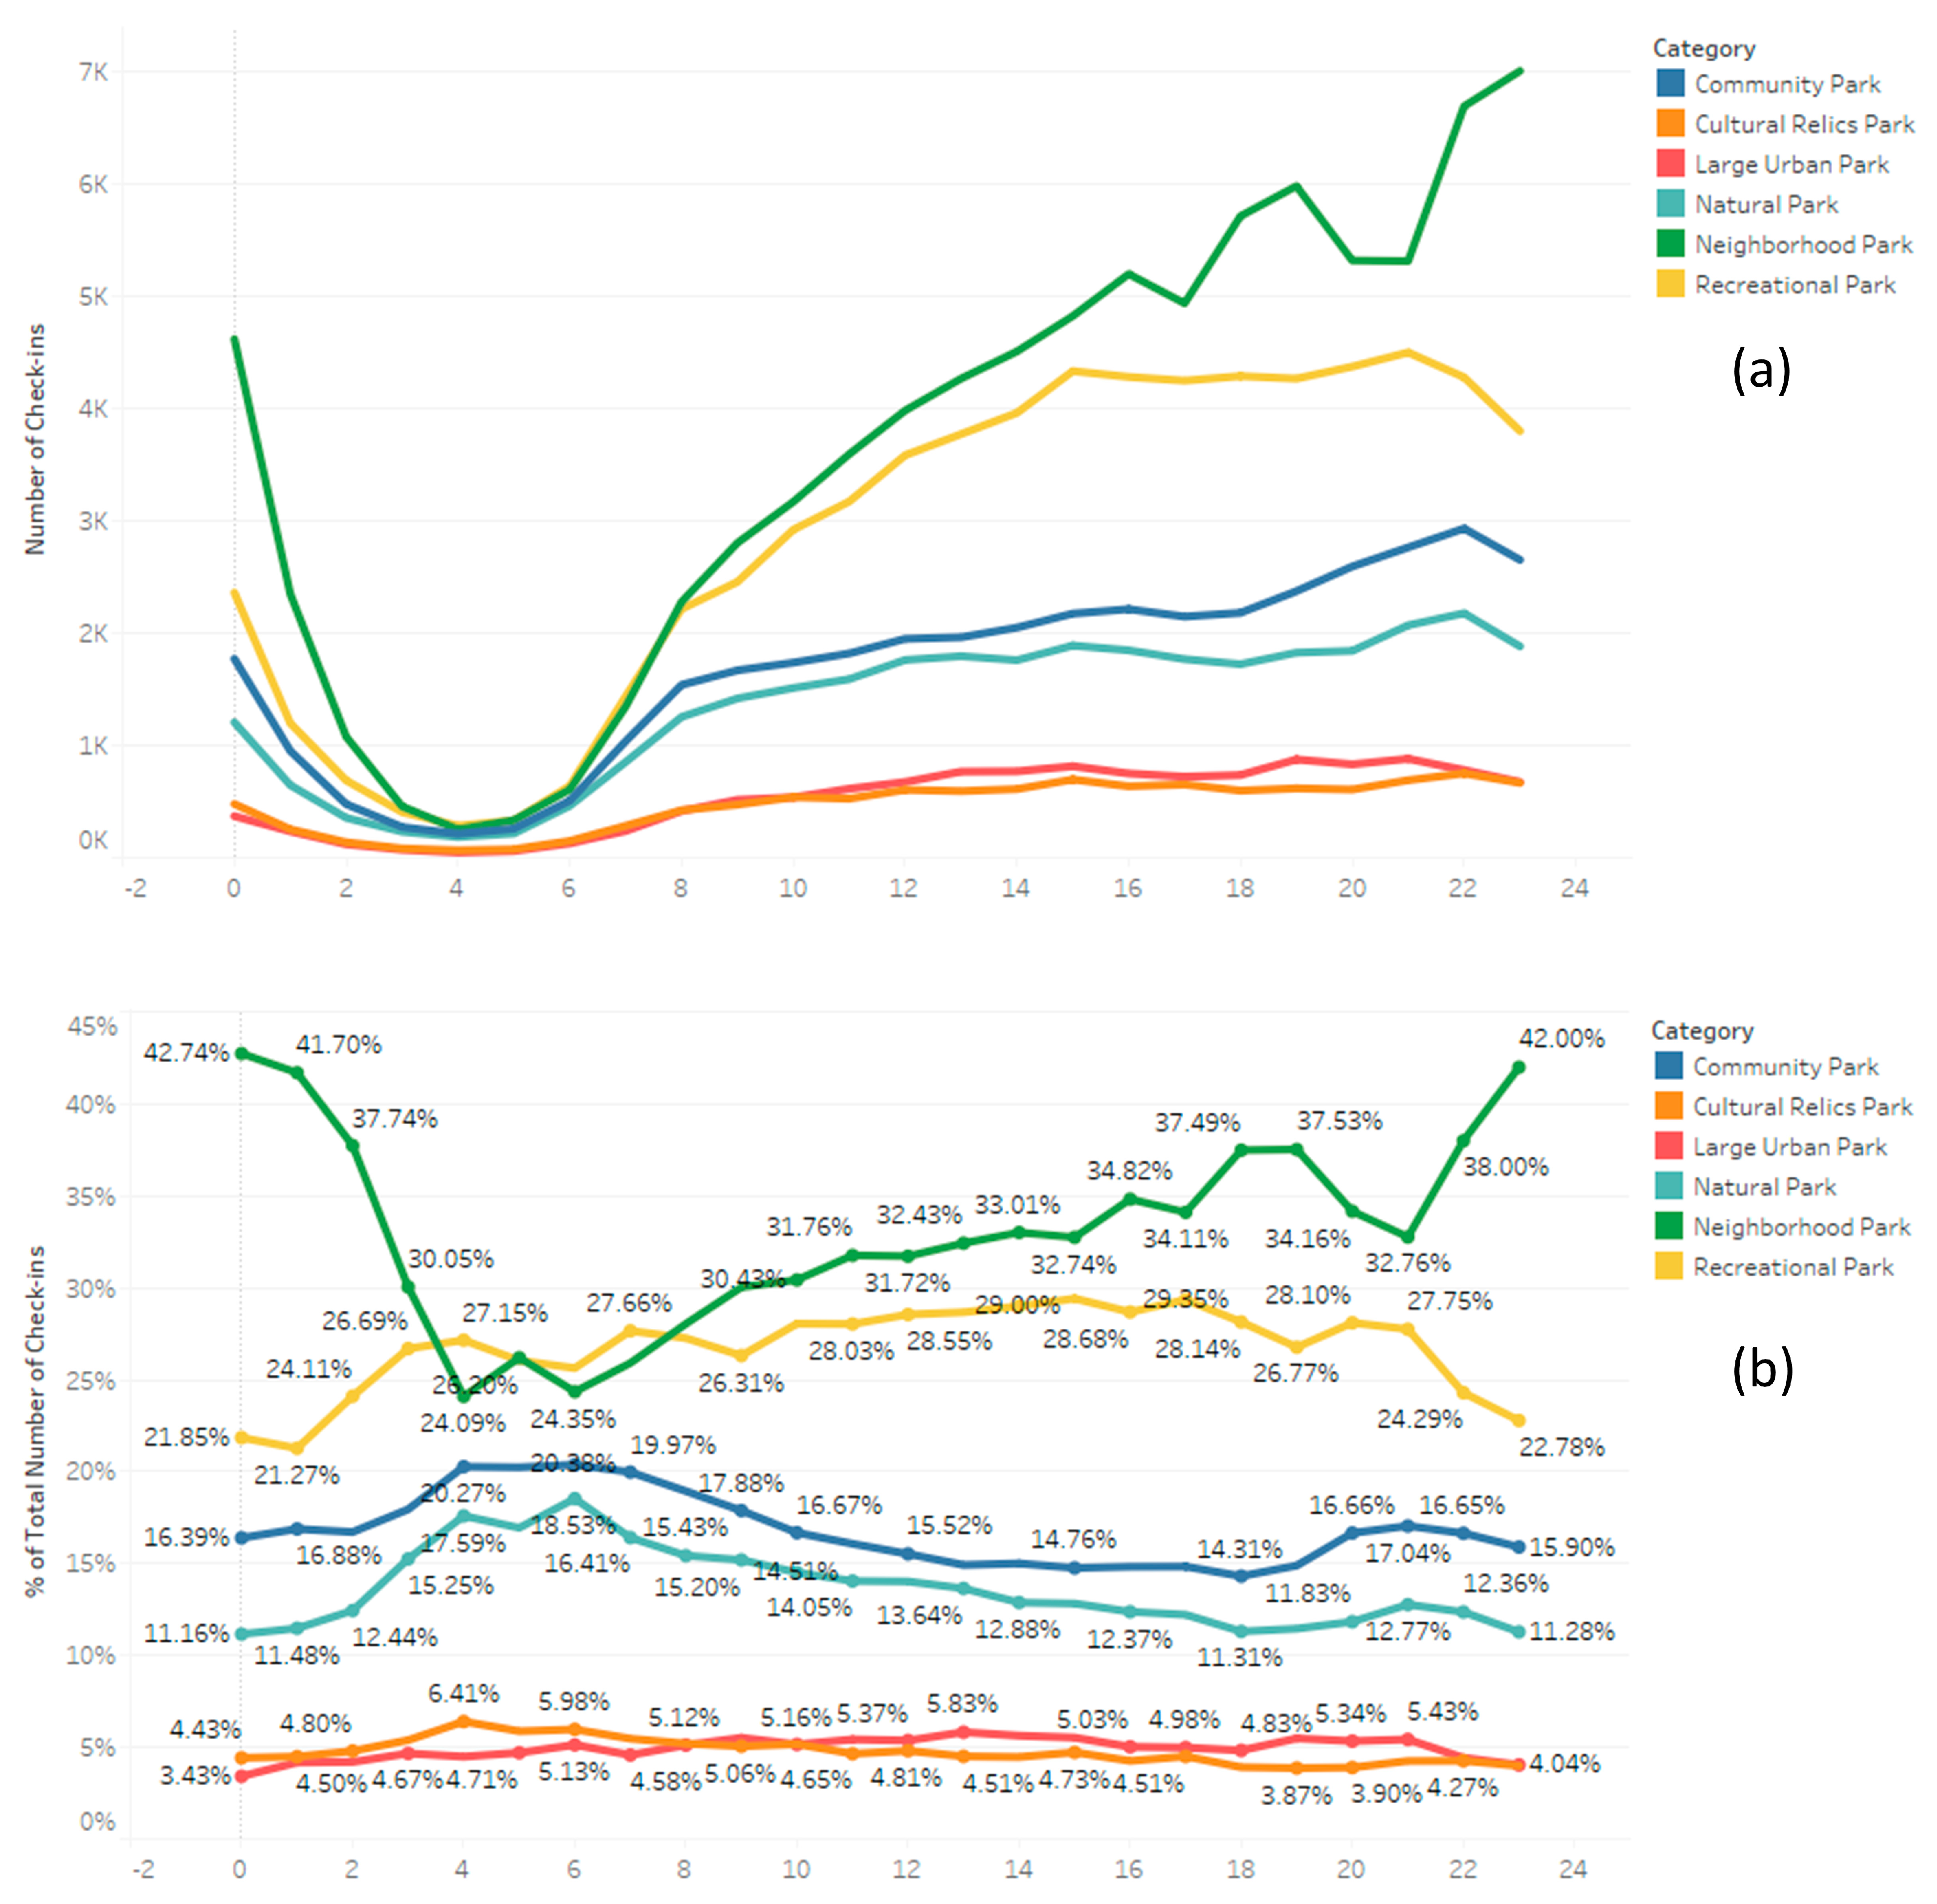
4.3. Temporal Analysis
4.4. Statistical Analysis
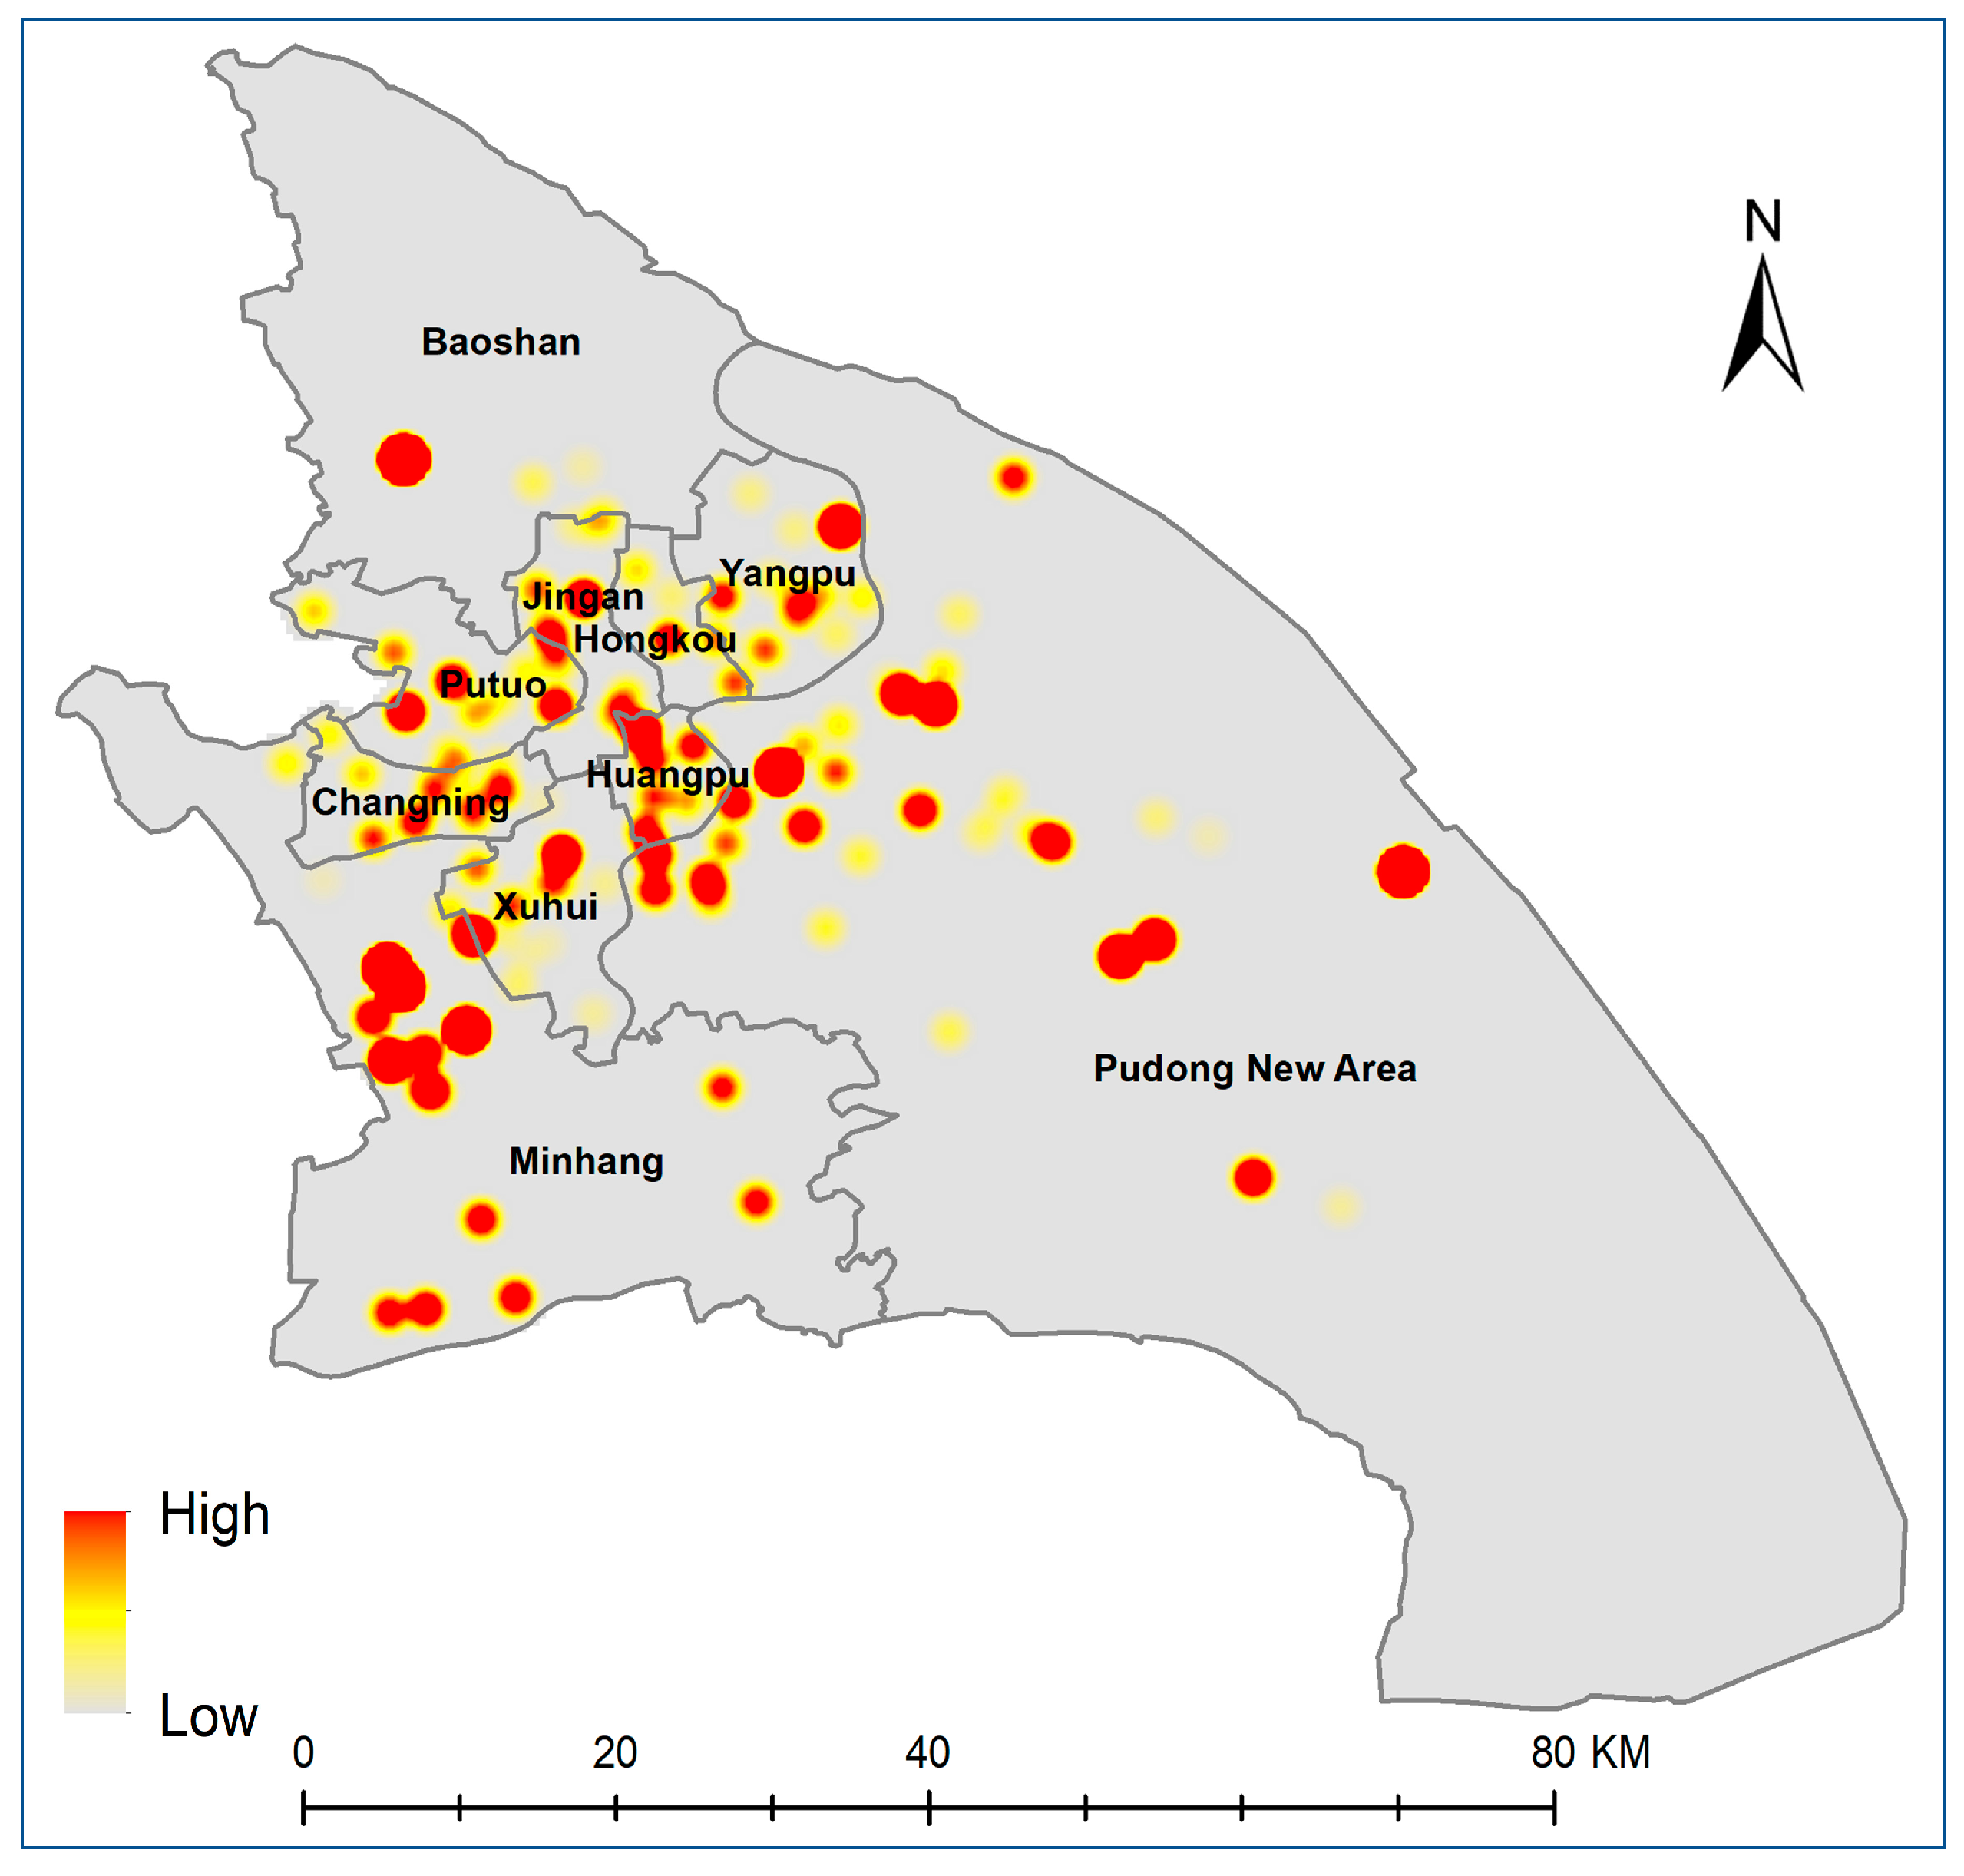
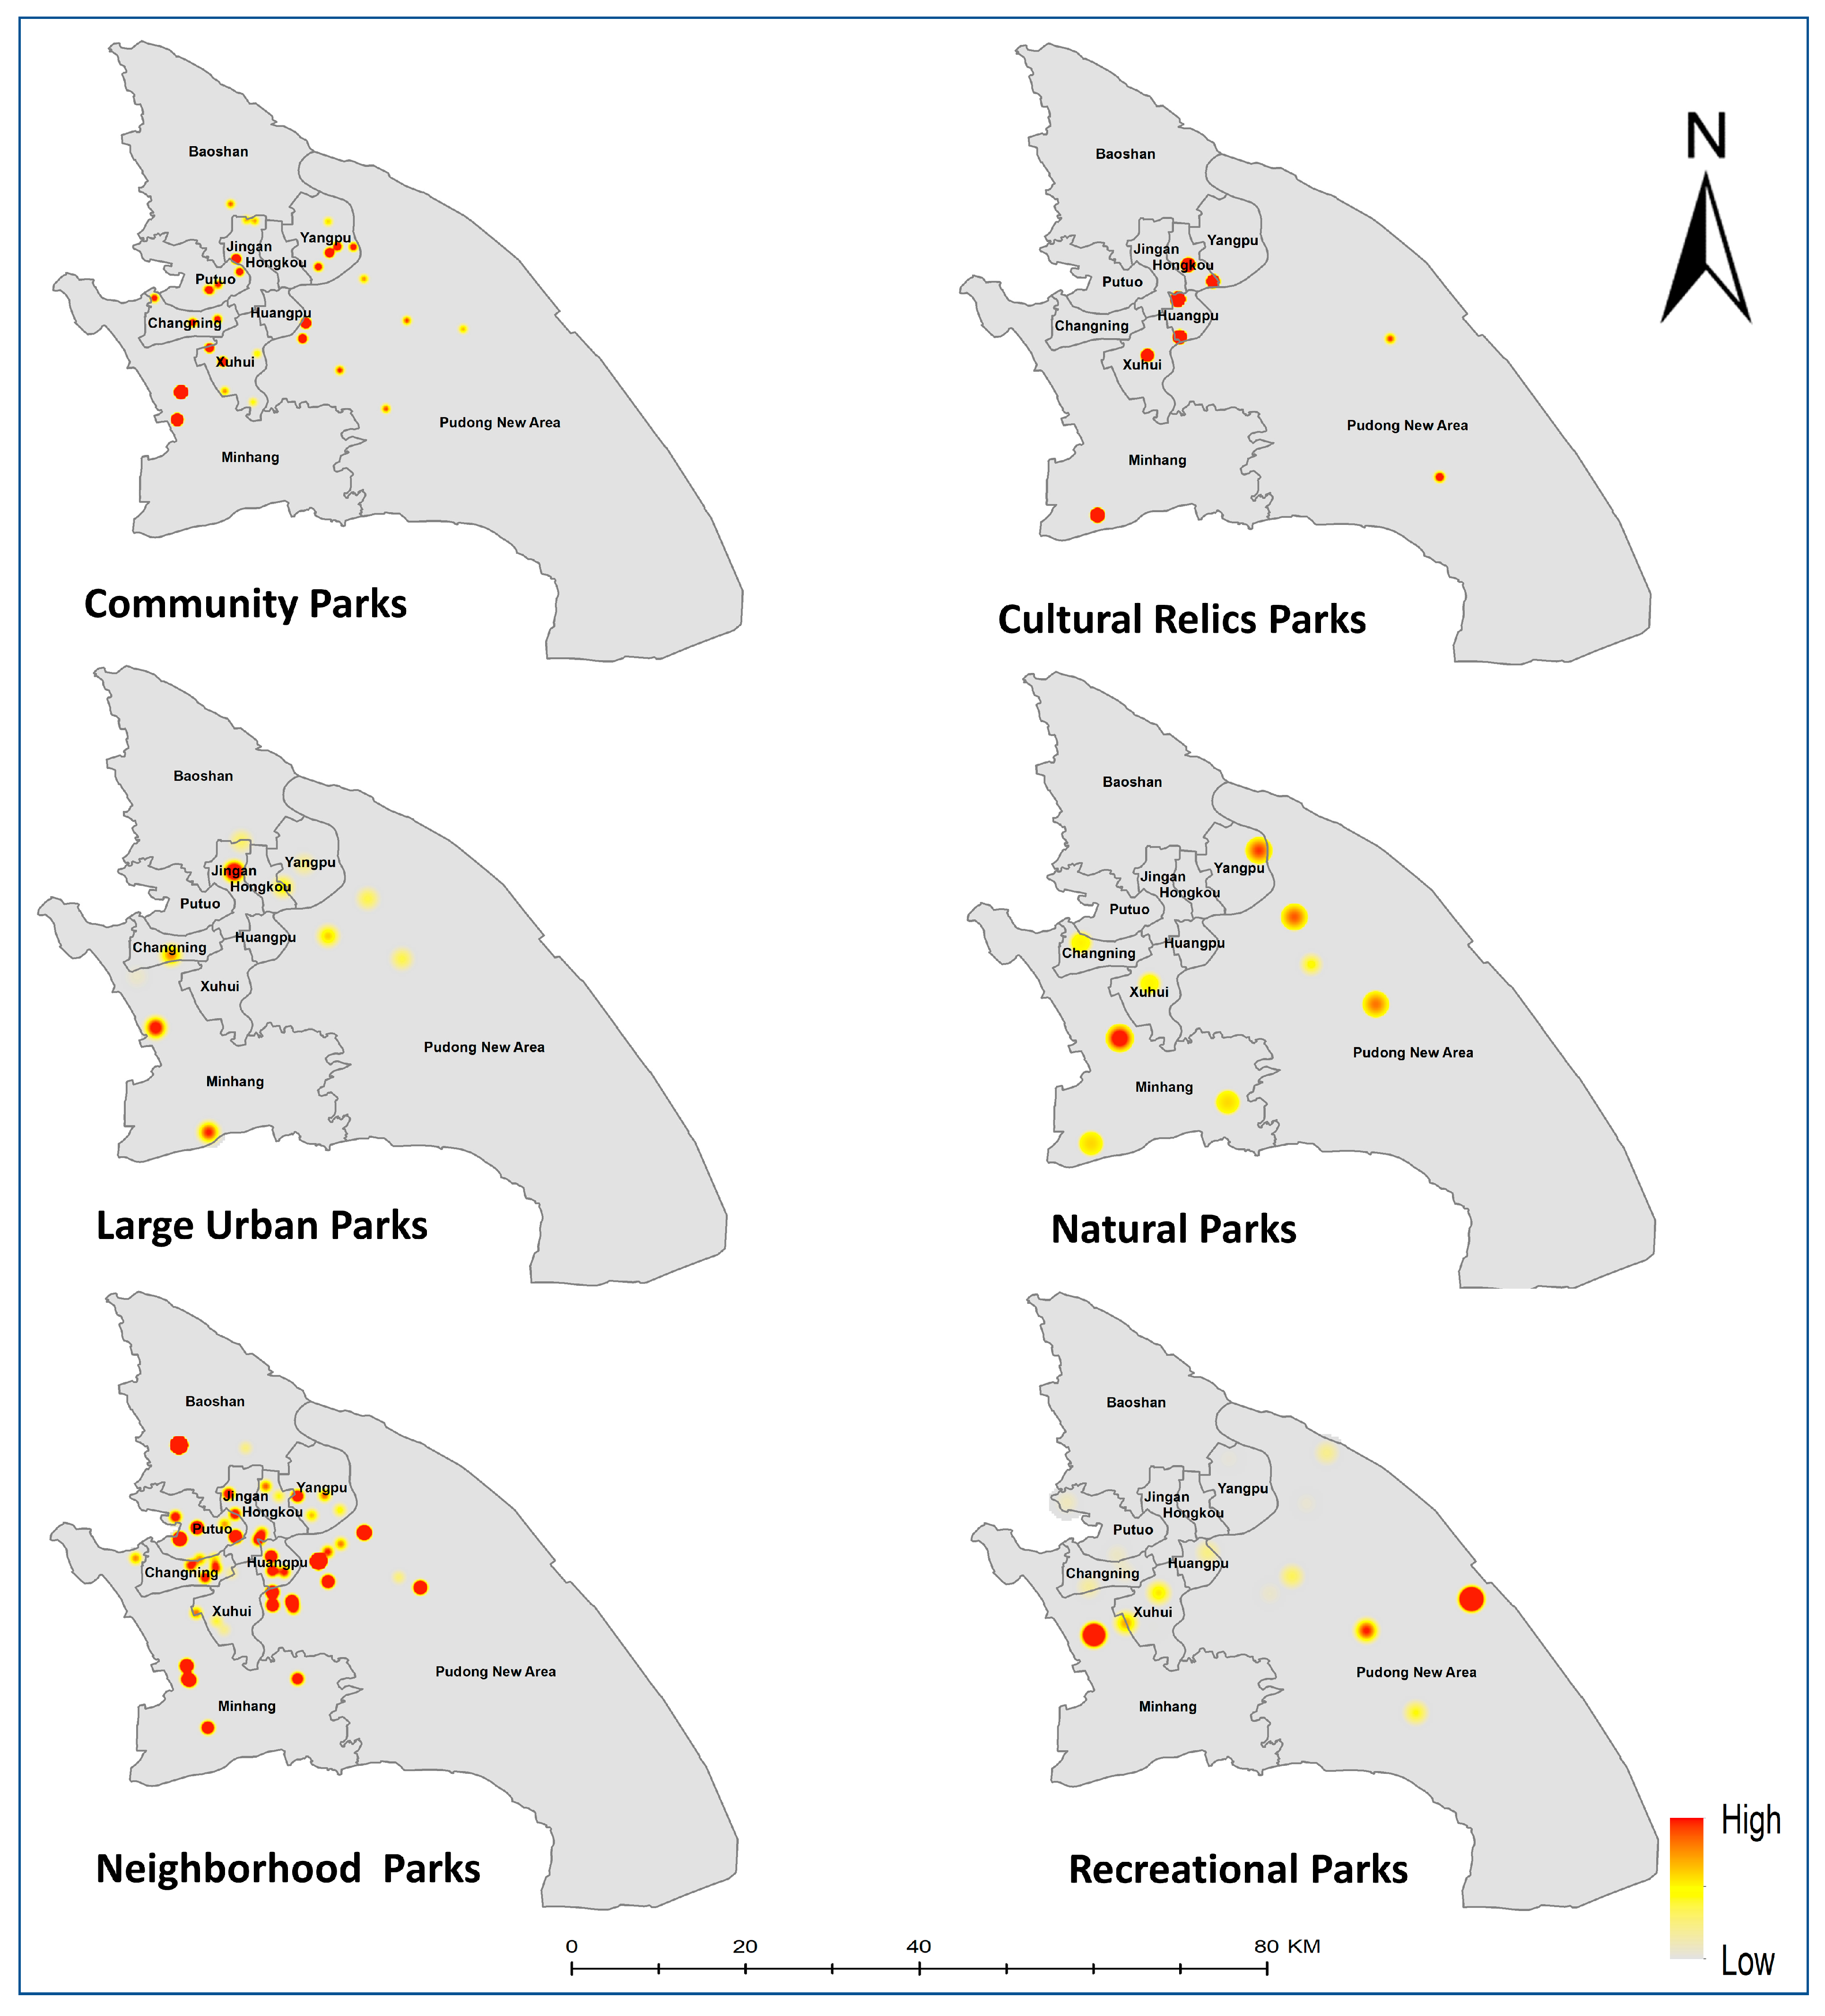
4.5. Spatial Analysis
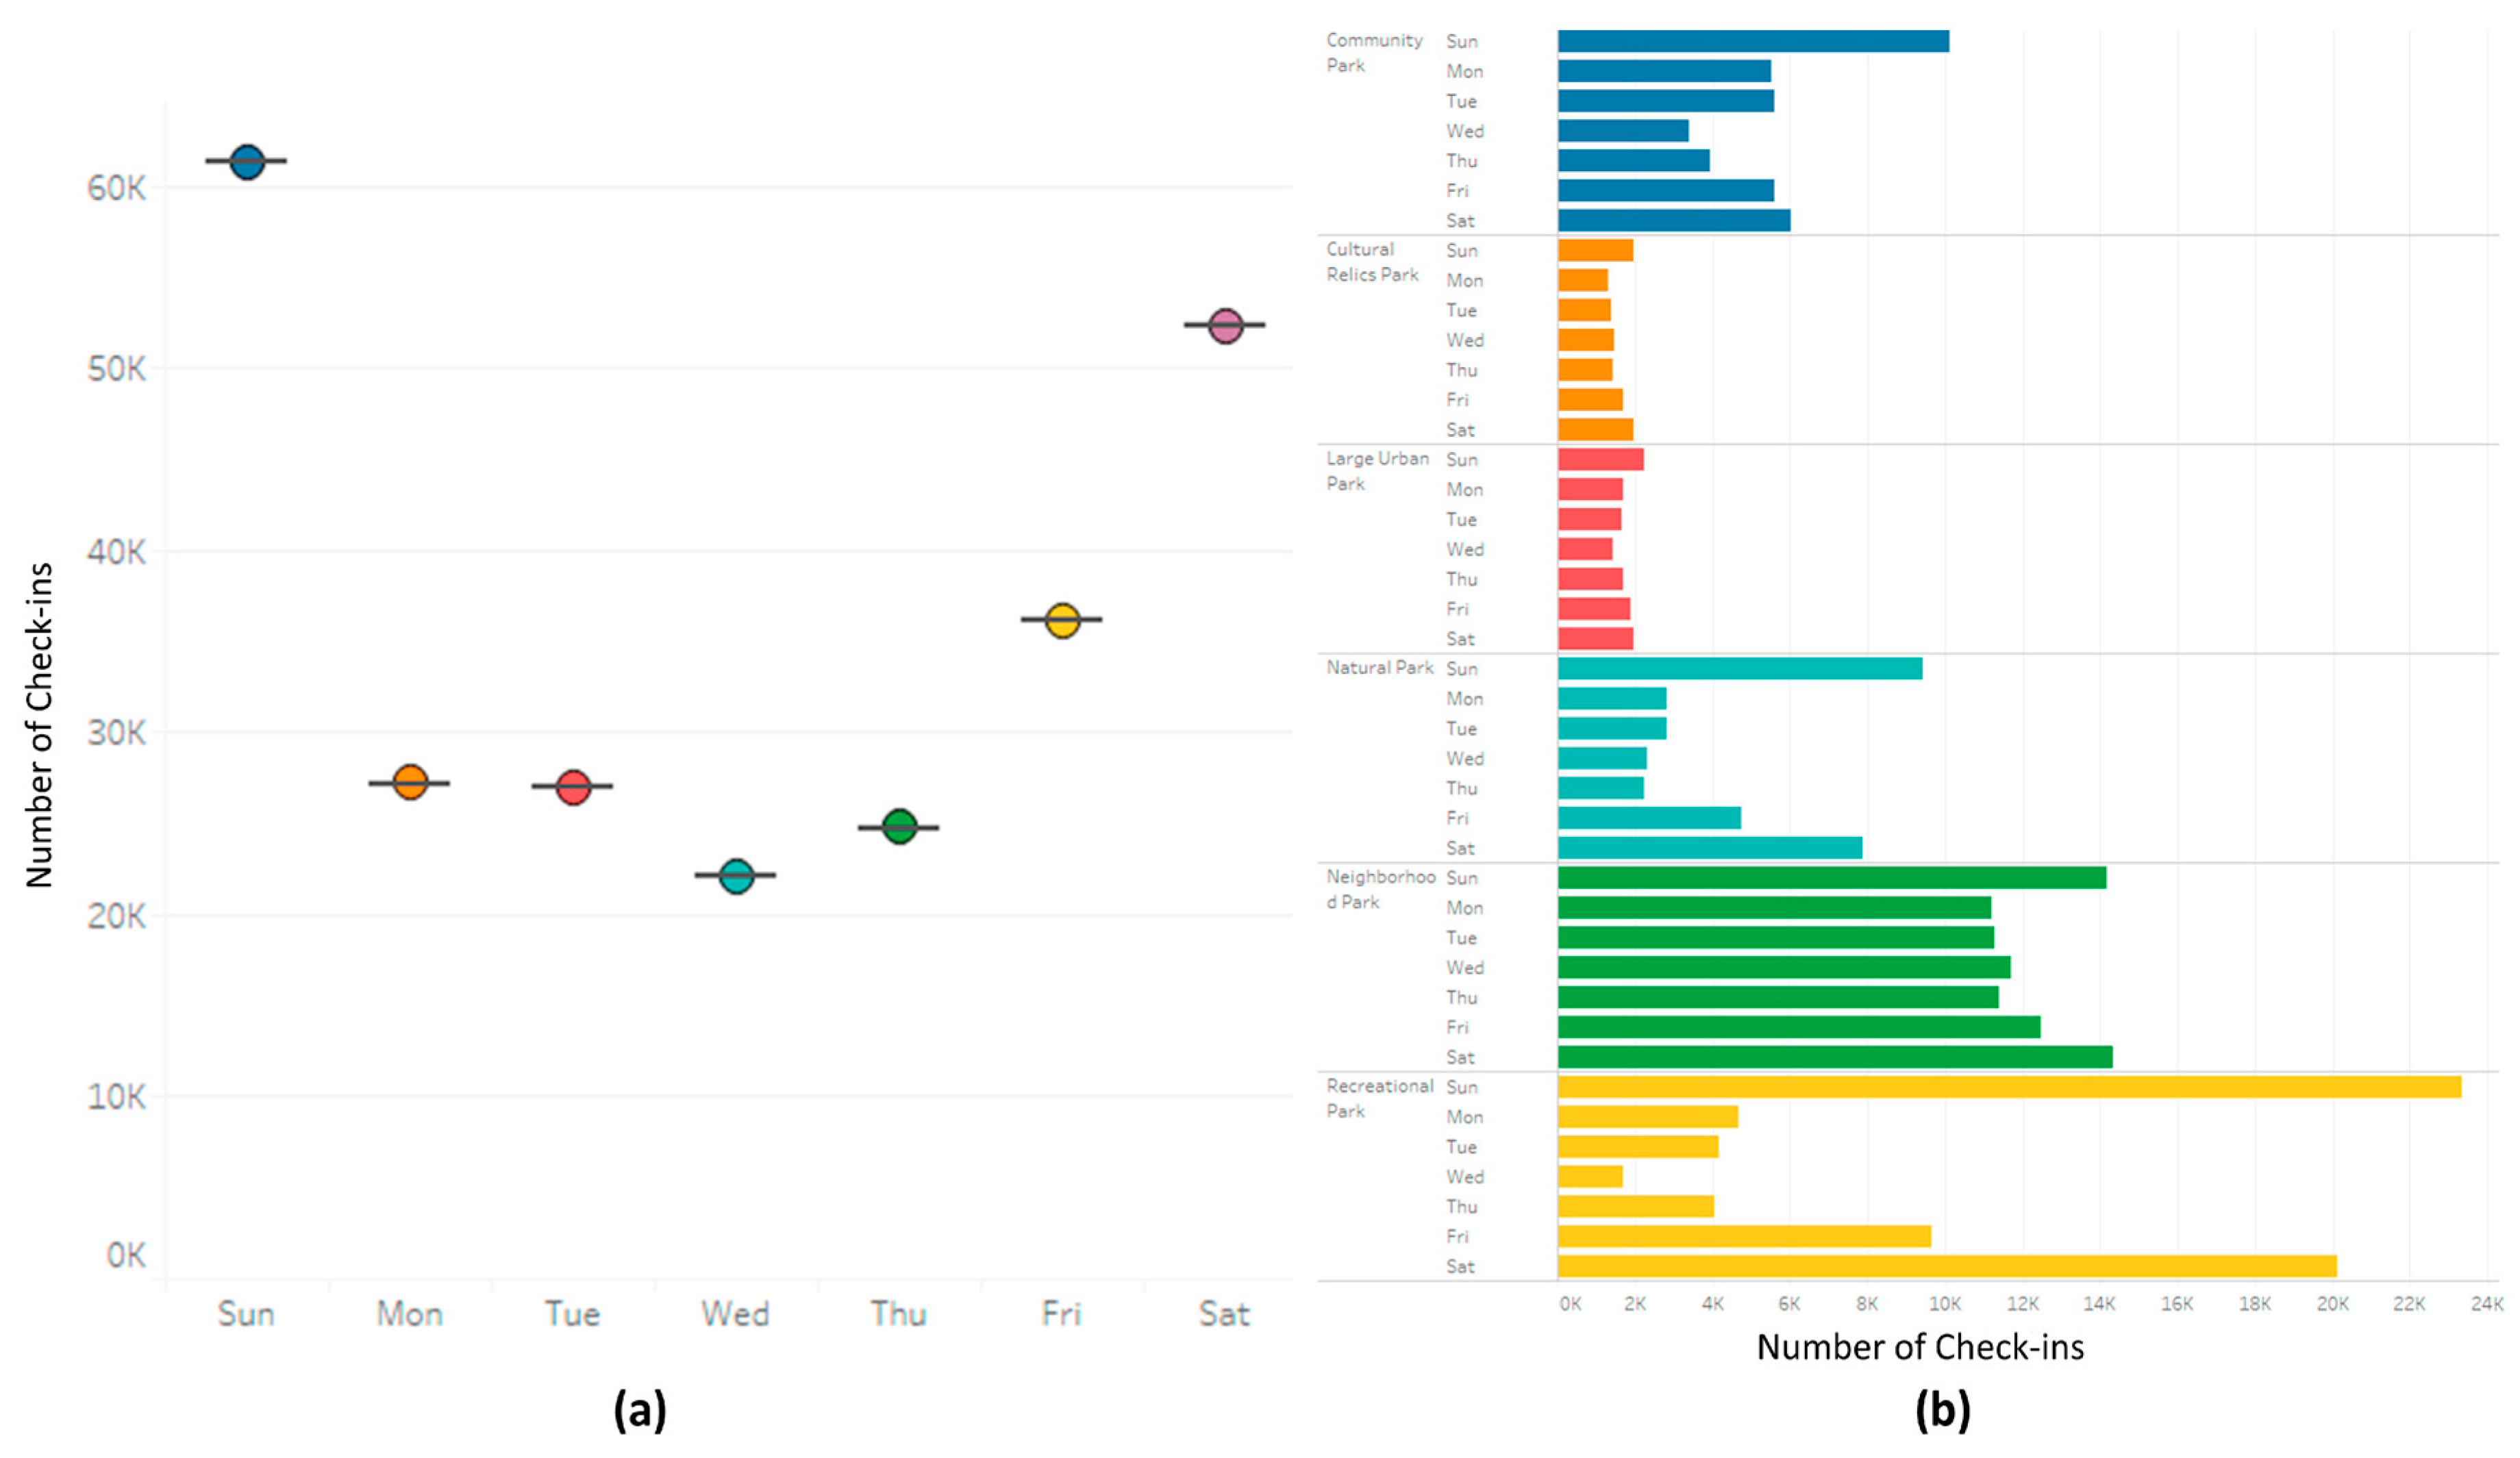
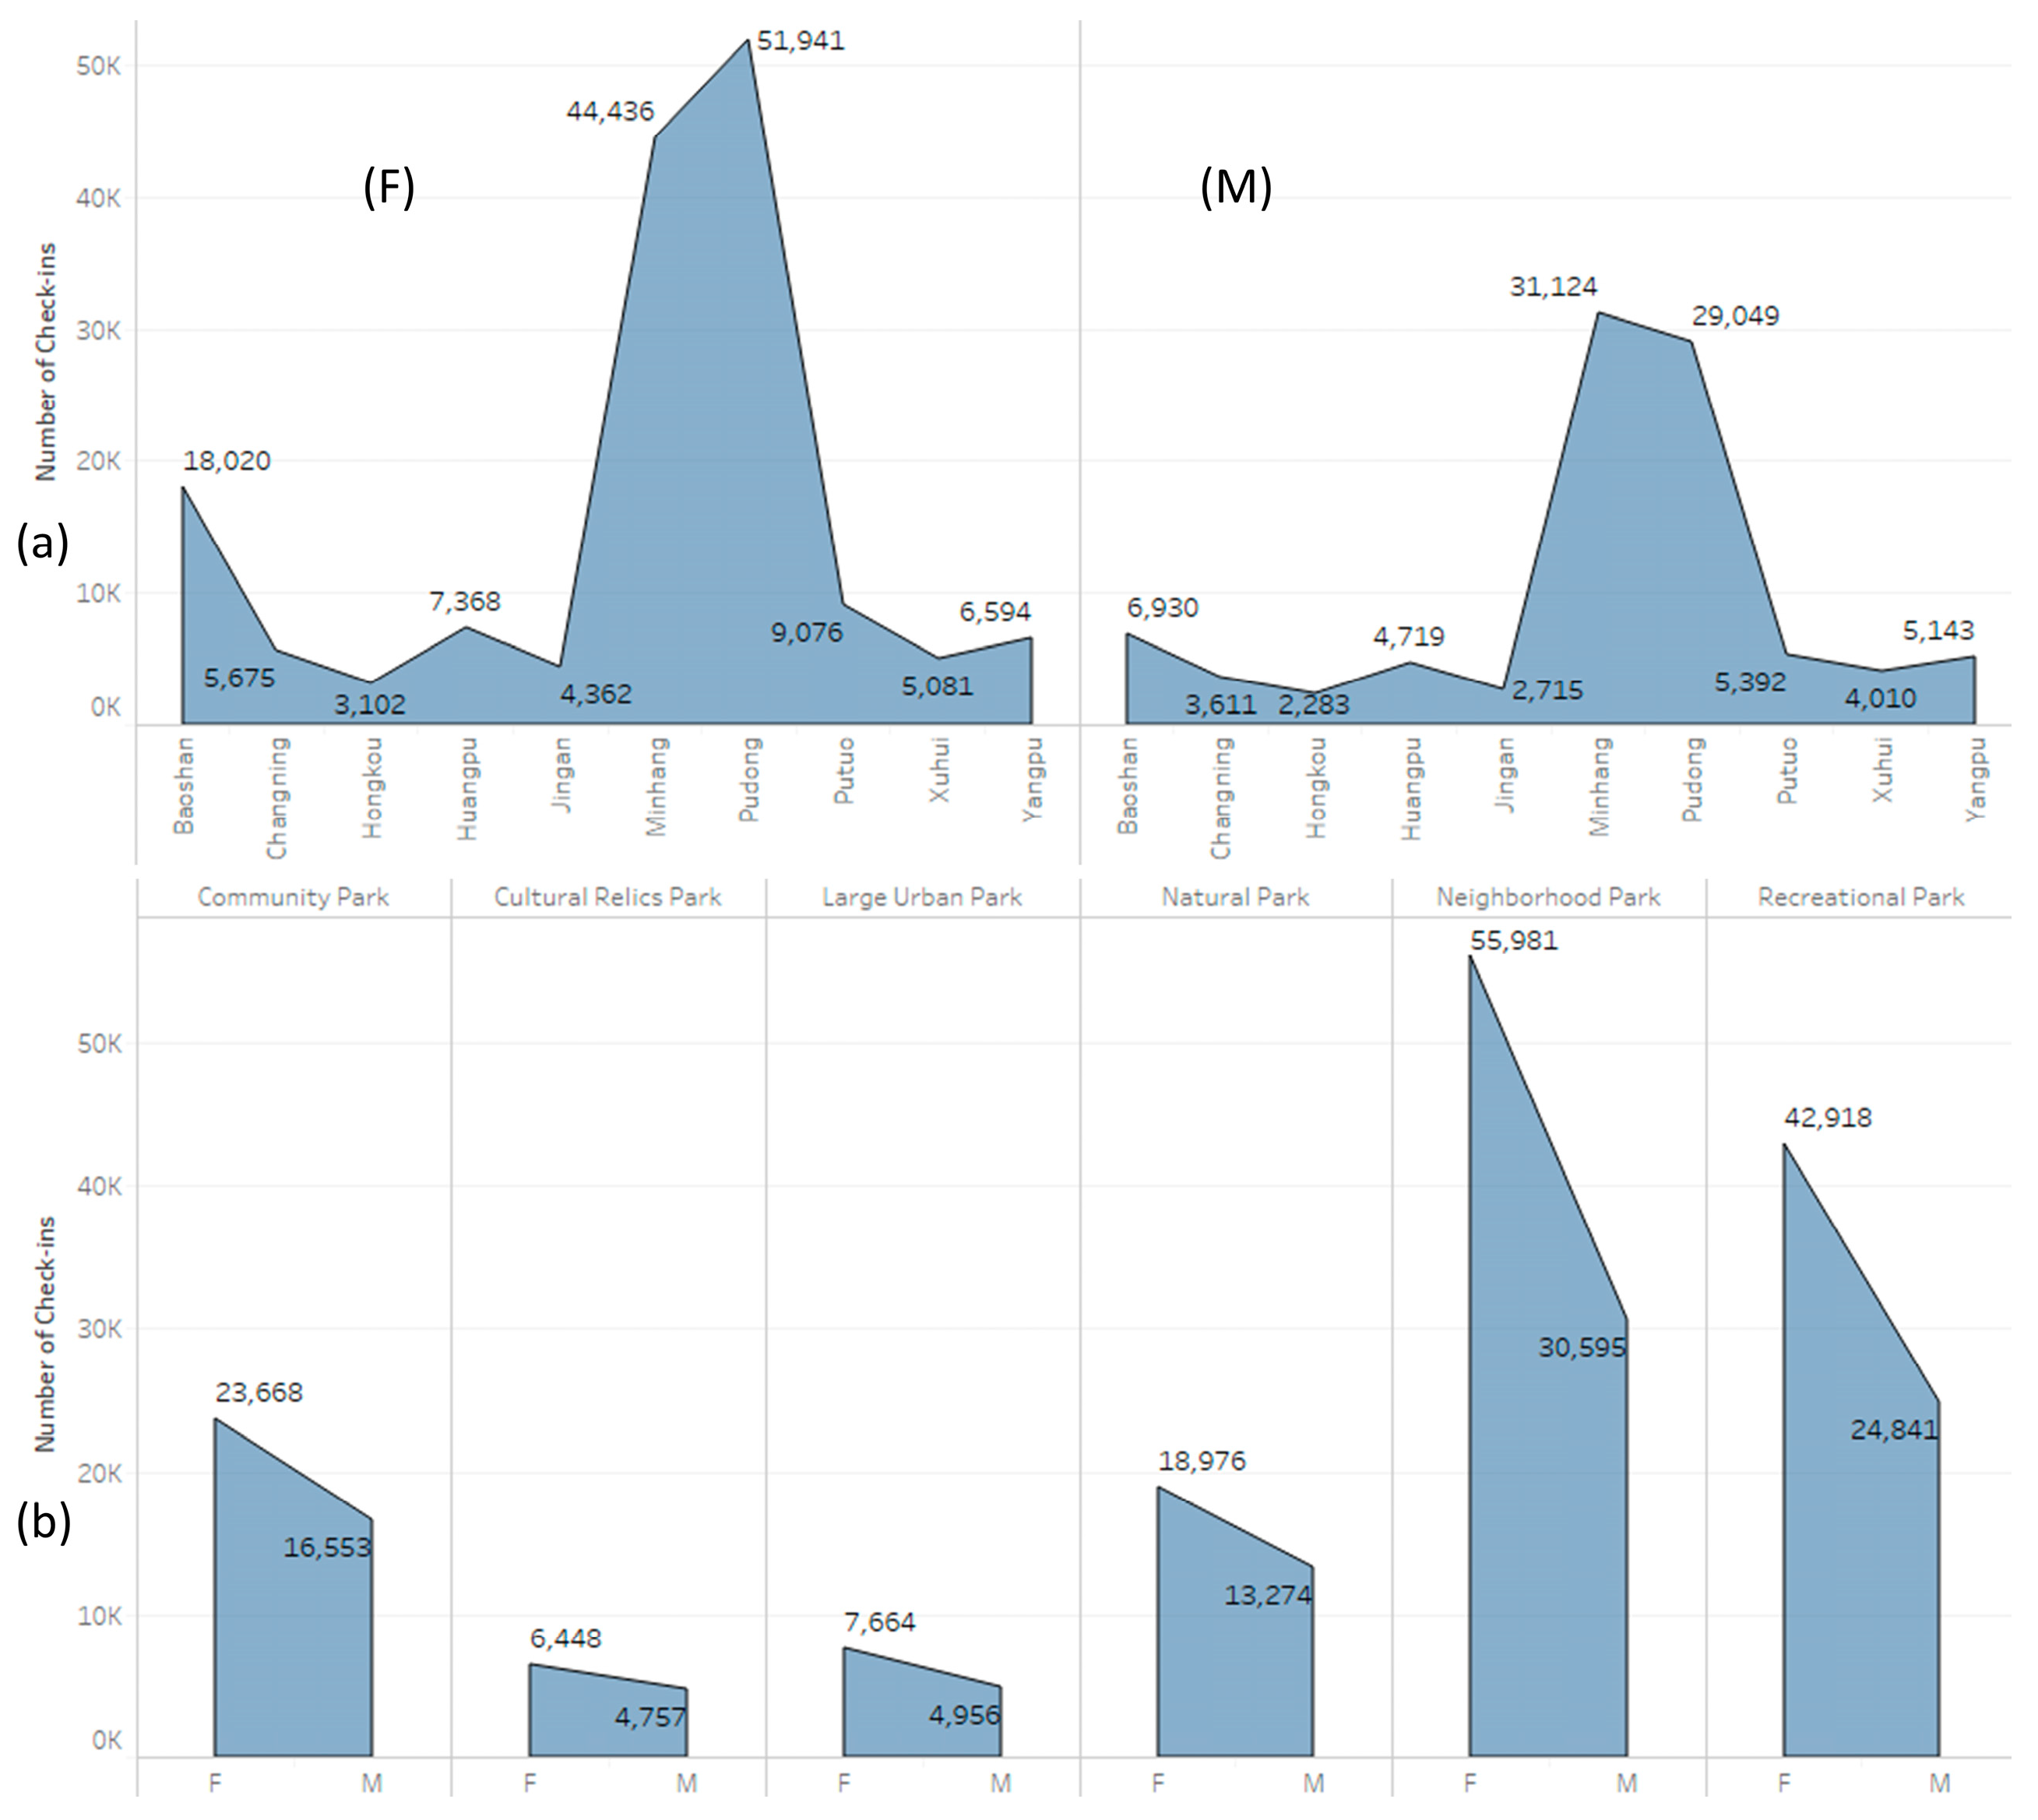
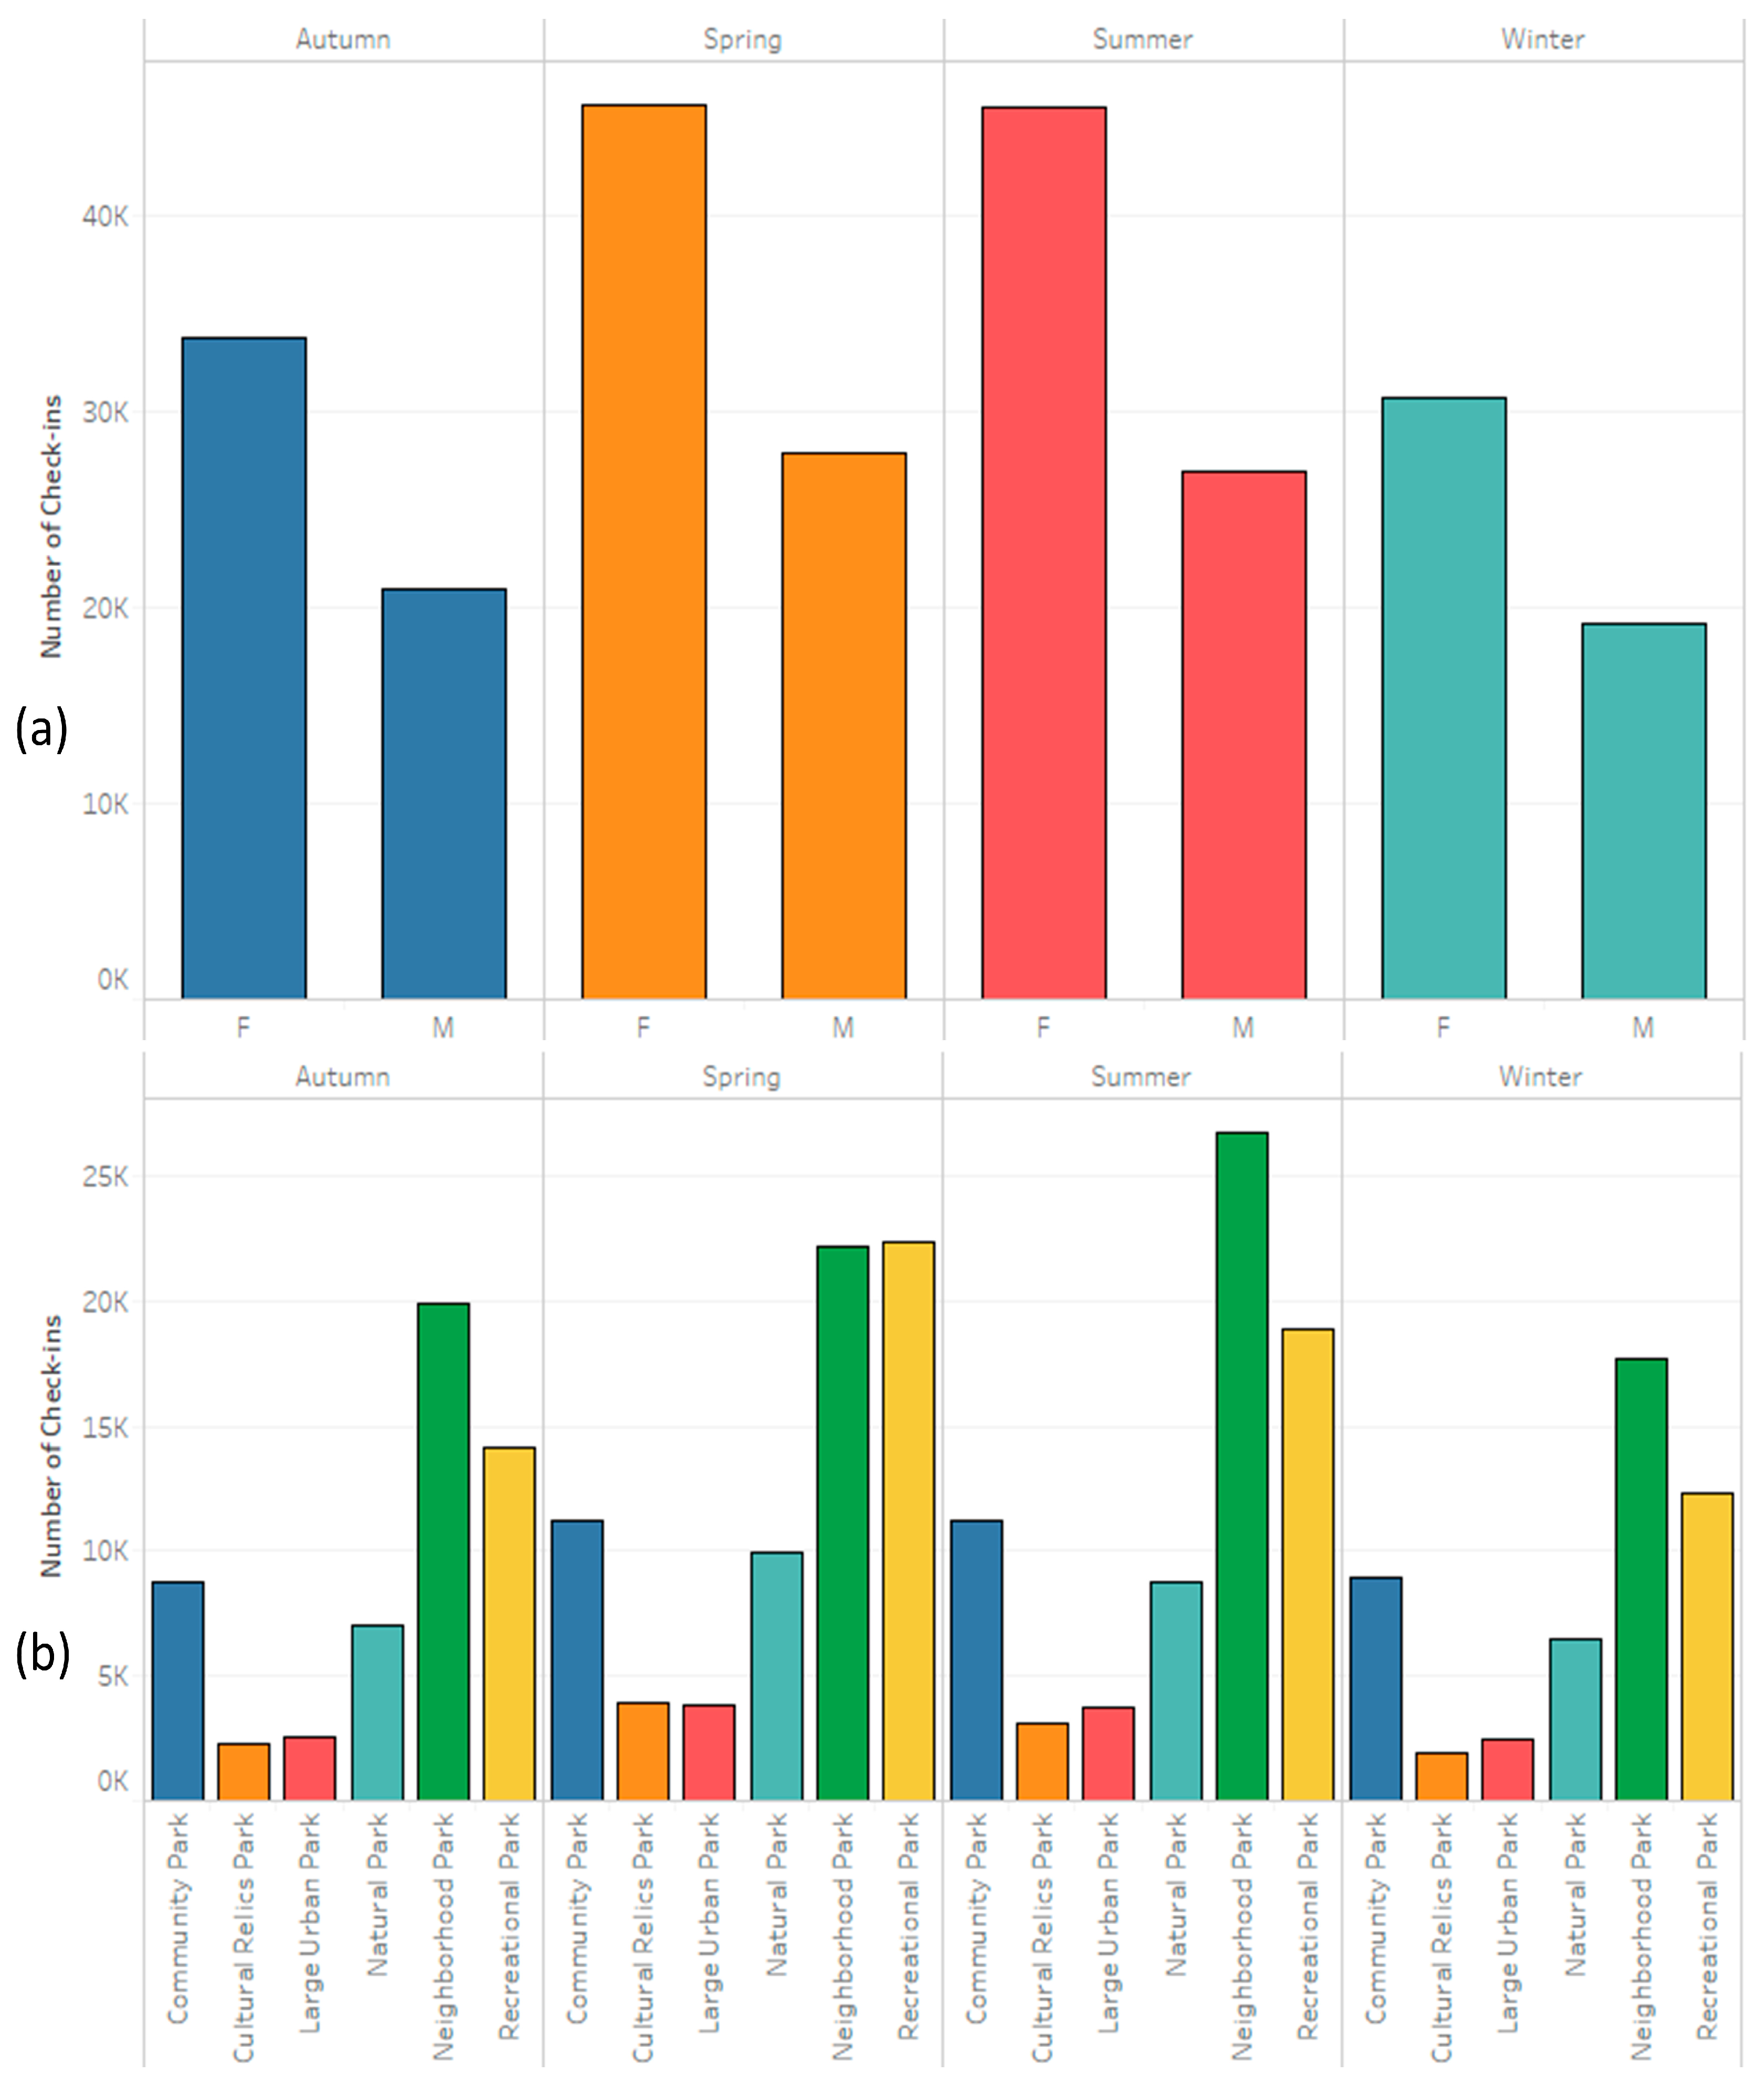
5. Results
6. Conclusions and Recommendations
7. Limitations and Future Work
Author Contributions
Funding
Conflicts of Interest
References
- Hand, K.L.; Freeman, C.; Seddon, P.J.; Recio, M.R.; Stein, A.; van Heezik, Y. The importance of urban gardens in supporting children’s biophilia. Proc. Natl. Acad. Sci. USA 2017, 114, 274–279. [Google Scholar] [CrossRef] [PubMed]
- Richardson, E.A.; Pearce, J.; Mitchell, R.; Kingham, S. Role of physical activity in the relationship between urban green space and health. Public Health 2013, 127, 318–324. [Google Scholar] [CrossRef] [PubMed]
- Zhou, W.; Wang, J.; Cadenasso, M.L. Effects of the spatial configuration of trees on urban heat mitigation: A comparative study. Remote Sens. Environ. 2017, 195, 1–12. [Google Scholar] [CrossRef]
- Cohen, D.A.; Marsh, T.; Williamson, S.; Derose, K.P.; Martinez, H.; Setodji, C.; McKenzie, T.L. Parks and physical activity: Why are some parks used more than others? Prev. Med. 2010, 50, S9–S12. [Google Scholar] [CrossRef] [PubMed]
- Wendel, H.E.W.; Zarger, R.K.; Mihelcic, J.R. Accessibility and usability: Green space preferences, perceptions, and barriers in a rapidly urbanizing city in Latin America. Landsc. Urban Plan. 2012, 107, 272–282. [Google Scholar] [CrossRef]
- Tenkanen, H.; Di Minin, E.; Heikinheimo, V.; Hausmann, A.; Herbst, M.; Kajala, L.; Toivonen, T. Instagram, flickr, or twitter: Assessing the usability of social media data for visitor monitoring in protected areas. Sci. Rep. 2017, 7, 17615. [Google Scholar] [CrossRef]
- Wood, S.A.; Guerry, A.D.; Silver, J.M.; Lacayo, M. Using social media to quantify nature-based tourism and recreation. Sci. Rep. 2013, 3, 2976. [Google Scholar] [CrossRef]
- Weibo. Available online: https://www.weibo.com (accessed on 25 June 2019).
- Zhen, F.; Cao, Y.; Qin, X.; Wang, B. Delineation of an urban agglomeration boundary based on Sina Weibo microblog ‘check-in’data: A case study of the Yangtze River Delta. Cities 2017, 60, 180–191. [Google Scholar] [CrossRef]
- Cetin, M. Determining the bioclimatic comfort in Kastamonu City. Environ. Monit. Assess. 2015, 187, 640. [Google Scholar] [CrossRef]
- Lee, A.C.; Maheswaran, R. The health benefits of urban green spaces: A review of the evidence. J. Public Health 2011, 33, 212–222. [Google Scholar] [CrossRef]
- Haq, S.M.A. Urban green spaces and an integrative approach to sustainable environment. J. Environ. Prot. 2011, 2, 601. [Google Scholar] [CrossRef]
- Amoly, E.; Dadvand, P.; Forns, J.; López-Vicente, M.; Basagaña, X.; Julvez, J.; Alvarez-Pedrerol, M.; Nieuwenhuijsen, M.J.; Sunyer, J. Green and blue spaces and behavioral development in Barcelona schoolchildren: The BREATHE project. Environ. Health Perspect. 2014, 122, 1351–1358. [Google Scholar] [CrossRef] [PubMed]
- Klaufus, C.; Van Lindert, P.; Van Noorloos, F.; Steel, G. All-inclusiveness versus exclusion: Urban project development in Latin America and Africa. Sustainability 2017, 9, 2038. [Google Scholar] [CrossRef]
- Kothencz, G.; Kolcsár, R.; Cabrera-Barona, P.; Szilassi, P. Urban green space perception and its contribution to well-being. Int. J. Environ. Res. Public Health 2017, 14, 766. [Google Scholar] [CrossRef] [PubMed]
- Bowler, D.E.; Buyung-Ali, L.M.; Knight, T.M.; Pullin, A.S. A systematic review of evidence for the added benefits to health of exposure to natural environments. BMC Public Health 2010, 10, 456. [Google Scholar] [CrossRef] [PubMed]
- Escobedo, F.J.; Kroeger, T.; Wagner, J.E. Urban forests and pollution mitigation: Analyzing ecosystem services and disservices. Environ. Pollut. 2011, 159, 2078–2087. [Google Scholar] [CrossRef]
- Hasan, S.; Ukkusuri, S.V. Urban activity pattern classification using topic models from online geo-location data. Transp. Res. Part C Emerg. Technol. 2014, 44, 363–381. [Google Scholar] [CrossRef]
- Longley, P.A.; Adnan, M. Geo-temporal twitter demographics. Int. J. Geogr. Inf. Sci. 2016, 30, 369–389. [Google Scholar] [CrossRef]
- Frank, M.R.; Mitchell, L.; Dodds, P.S.; Danforth, C.M. Happiness and the patterns of life: A study of geolocated tweets. Sci. Rep. 2013, 3, 2625. [Google Scholar] [CrossRef]
- Campagna, M. The geographic turn in social media: Opportunities for spatial planning and geodesign. In Proceedings of the International Conference on Computational Science and Its Applications, Guimarães, Portugal, 30 June–3 July 2014; pp. 598–610. [Google Scholar]
- Sagl, G.; Resch, B.; Hawelka, B.; Beinat, E. From social sensor data to collective human behaviour patterns: Analysing and visualising spatio-temporal dynamics in urban environments. In Proceedings of the GI-Forum, Berlin, Germany, 36 July 2012; pp. 54–63. [Google Scholar]
- Ghani, A.; Zubair, M.; Saeed, M.I.; Singh, D. SOS: Socially Omitting Selfishness in IoT for smart and connected communities. arXiv 2020, arXiv:08948. [Google Scholar]
- Nouh, R.M.; Singh, D. Introducing blockchain for smart city technologies and applications. In Blockchain Technology for Smart Cities; Springer: Seoul, Korea, 2020; pp. 1–17. [Google Scholar]
- Agrahari, A.; Singh, D. Smart city transportation technologies: Automatic no-helmet penalizing system. In Blockchain Technology for Smart Cities; Springer: Seoul, Korea, 2020; pp. 115–132. [Google Scholar]
- Smiley, M.J.; Roux, A.V.D.; Brines, S.J.; Brown, D.G.; Evenson, K.R.; Rodriguez, D.A. A spatial analysis of health-related resources in three diverse metropolitan areas. Health Place 2010, 16, 885–892. [Google Scholar] [CrossRef]
- Thornton, L.E.; Pearce, J.R.; Macdonald, L.; Lamb, K.E.; Ellaway, A. Does the choice of neighbourhood supermarket access measure influence associations with individual-level fruit and vegetable consumption? A case study from Glasgow. Int. J. Health Geogr. 2012, 11, 29. [Google Scholar] [CrossRef] [PubMed]
- Thornton, L.E.; Pearce, J.R.; Kavanagh, A.M. Using Geographic Information Systems (GIS) to assess the role of the built environment in influencing obesity: A glossary. Int. J. Behav. Nutr. Phys. Act. 2011, 8, 71. [Google Scholar] [CrossRef] [PubMed]
- King, T.L.; Thornton, L.E.; Bentley, R.J.; Kavanagh, A.M. The use of kernel density estimation to examine associations between neighborhood destination intensity and walking and physical activity. PLoS ONE 2015, 10, e0137402. [Google Scholar] [CrossRef] [PubMed]
- Buck, C.; Börnhorst, C.; Pohlabeln, H.; Huybrechts, I.; Pala, V.; Reisch, L.; Pigeot, I. Clustering of unhealthy food around German schools and its influence on dietary behavior in school children: A pilot study. Int. J. Behav. Nutr. Phys. Act. 2013, 10, 65. [Google Scholar] [CrossRef] [PubMed][Green Version]
- Li, F.; Zhang, F.; Li, X.; Wang, P.; Liang, J.; Mei, Y.; Cheng, W.; Qian, Y. Spatiotemporal patterns of the use of urban green spaces and external factors contributing to their use in central Beijing. Int. J. Environ. Res. Public Health 2017, 14, 237. [Google Scholar] [CrossRef]
- Kovacs-Gyori, A.; Ristea, A.; Havas, C.; Resch, B.; Cabrera-Barona, P. London2012: Towards citizen-contributed urban planning through sentiment analysis of twitter data. Urban Plan. 2018, 3, 75–99. [Google Scholar] [CrossRef]
- Haidery, S.A.; Ullah, H.; Khan, N.U.; Fatima, K.; Rizvi, S.S.; Kwon, S.J. Role of big data in the development of smart city by analyzing the density of residents in shanghai. Electronics 2020, 9, 837. [Google Scholar] [CrossRef]
- Department of Economic and Social Affairs. World Urbanization Prospects the 2014 Revision; United Nations: New York, NY, USA, 2014. [Google Scholar]
- Xiong, X.; Jin, C.; Chen, H.; Luo, L. Using the fusion proximal area method and gravity method to identify areas with physician shortages. PLoS ONE 2016, 11, e0163504. [Google Scholar] [CrossRef]
- Shen, J.; Kee, G. Development and Planning in Seven Major Coastal Cities in Southern and Eastern China; Springer: Shanghai, China, 2017. [Google Scholar]
- Weibo Statistics. Available online: http://ir.weibo.com/news-releases/news-release-details/weibo-corporation-report-fourth-quarter-and-fiscal-year-2018 (accessed on 10 June 2019).
- Shen, Y.; Sun, F.; Che, Y. Public green spaces and human wellbeing: Mapping the spatial inequity and mismatching status of public green space in the central city of shanghai. Urban For. Urban Green. 2017, 27, 59–68. [Google Scholar] [CrossRef]
- Ebrahimpour, Z.W.; Wanggen, W.; Cervantes, O.; Luo, T.; Ullah, T. Comparison of Main Approaches for Extracting Behavior Features from Crowd Flow Analysis. ISPRS Int. J. Geo-Inf. 2019, 8, 440. [Google Scholar] [CrossRef]
- Shen, Y.; Karimi, K. Urban function connectivity: Characterisation of functional urban streets with social media check-in data. Cities 2016, 55, 9–21. [Google Scholar] [CrossRef]
- Keeler, B.L.; Wood, S.A.; Polasky, S.; Kling, C.; Filstrup, C.T.; Downing, J.A. Recreational demand for clean water: Evidence from geotagged photographs by visitors to lakes. Front. Ecol. Environ. 2015, 13, 76–81. [Google Scholar] [CrossRef]
- Ullah, H.; Wan, W.; Haidery, S.A.; Khan, N.U.; Ebrahimpour, Z.; Muzahid, A.A.M. Spatiotemporal patterns of visitors in urban green parks by mining social media big data based upon WHO reports. IEEE Access 2020, 8, 39197–39211. [Google Scholar] [CrossRef]
- Xiaoli, T.; Mingxing, C.; Wenzhong, Z.; Yongping, B. Classification and its relationship with the functional analysis of urban parks: Taking Beijing as an example. Geogr. Res. 2013, 32, 1964–1976. [Google Scholar]
- Zhang, S.; Zhou, W. Recreational visits to urban parks and factors affecting park visits: Evidence from geotagged social media data. Landsc. Urban Plan. 2018, 180, 27–35. [Google Scholar] [CrossRef]
- Wang, Y.; Wang, T.; Ye, X.; Zhu, J.; Lee, J. Using social media for emergency response and urban sustainability: A case study of the 2012 Beijing rainstorm. Sustainability 2016, 8, 25. [Google Scholar] [CrossRef]
- Xie, Z.; Yan, J. Kernel density estimation of traffic accidents in a network space. Comput. Environ. Urban Syst. 2008, 32, 396–406. [Google Scholar] [CrossRef]
- Abidi, S.; Hussain, M.; Xu, Y.; Zhang, W. Prediction of confusion attempting algebra homework in an intelligent tutoring system through machine learning techniques for educational sustainable development. Sustainability 2019, 11, 105. [Google Scholar] [CrossRef]
- Language, R. Available online: https://cran.rproject.org/ (accessed on 12 May 2019).
- Studio, R. Available online: https://www.rstudio.com (accessed on 12 May 2019).
- Silverman, B.W. Density Estimation for Statistics and Data Analysis; Routledge: London, UK, 2018. [Google Scholar]
- Maroko, A.R.; Maantay, J.A.; Sohler, N.L.; Grady, K.L.; Arno, P.S. The complexities of measuring access to parks and physical activity sites in New York City: A quantitative and qualitative approach. Int. J. Health Geogr. 2009, 8, 34. [Google Scholar] [CrossRef]
- Yu, W.; Ai, T.; Shao, S. The analysis and delimitation of Central Business District using network kernel density estimation. J. Transp. Geogr. 2015, 45, 32–47. [Google Scholar] [CrossRef]
- Yu, W.; Ai, T.; He, Y.; Shao, S. Spatial co-location pattern mining of facility points-of-interest improved by network neighborhood and distance decay effects. Int. J. Geogr. Inf. Sci. 2017, 31, 280–296. [Google Scholar] [CrossRef]
- Ying, L.; Shen, Z.; Chen, J.; Fang, R.; Chen, X.; Jiang, R. Spatiotemporal patterns of road network and road development priority in three parallel rivers region in Yunnan, China: An evaluation based on modified kernel distance estimate. Chin. Geogr. Sci. 2014, 24, 39–49. [Google Scholar] [CrossRef]
- Wu, C.; Ye, X.; Ren, F.; Wan, Y.; Ning, P.; Du, Q. Spatial and social media data analytics of housing prices in Shenzhen, China. PLoS ONE 2016, 11, e0164553. [Google Scholar] [CrossRef]
- King, T.L.; Bentley, R.J.; Thornton, L.E.; Kavanagh, A.M. Using kernel density estimation to understand the influence of neighbourhood destinations on BMI. BMJ Open 2016, 6, e008878. [Google Scholar] [CrossRef] [PubMed]
- Hasan, S.; Zhan, X.; Ukkusuri, S.V. Understanding urban human activity and mobility patterns using large-scale location-based data from online social media. In Proceedings of the 2nd ACM SIGKDD International Workshop on Urban Computing, Chicago, IL, USA, 11–14 August 2013; p. 6. [Google Scholar]
- Li, L.; Goodchild, M.F.; Xu, B. Spatial, temporal, and socioeconomic patterns in the use of Twitter and Flickr. Cartogr. Geogr. Inf. Sci. 2013, 40, 61–77. [Google Scholar] [CrossRef]
- Sun, Y.; Fan, H.; Li, M.; Zipf, A. Identifying the city center using human travel flows generated from location-based social networking data. Environ. Plan. B Plan. Des. 2016, 43, 480–498. [Google Scholar] [CrossRef]
- Yuan, N.J.; Zheng, Y.; Xie, X.; Wang, Y.; Zheng, K.; Xiong, H. Discovering urban functional zones using latent activity trajectories. IEEE Trans. Knowl. Data Eng. 2014, 27, 712–725. [Google Scholar] [CrossRef]
- Li, H.; Ge, Y.; Hong, R.; Zhu, H. Point-of-interest recommendations: Learning potential check-ins from friends. In Proceedings of the 22nd ACM SIGKDD International Conference on Knowledge Discovery and Data Mining, San Francisco, CA, USA, 13–17 August 2016; pp. 975–984. [Google Scholar]
- Ullah, H.; Wan, W.; Haidery, S.A.; Khan, N.U.; Ebrahimpour, Z.; Luo, T. Analyzing the spatiotemporal patterns in green spaces for urban studies using location-based social media data. ISPRS Int. J. Geo Inf. 2019, 8, 506. [Google Scholar] [CrossRef]
- Liu, Q.; Ullah, H.; Wan, W.; Peng, Z.; Hou, L.; Qu, T.; Haidery, S.A. Analysis of green spaces by utilizing big data to support smart cities and environment: A case study about the city center of shanghai. ISPRS Int. J. Geo-Inf. 2020, 9, 360. [Google Scholar] [CrossRef]
- Maia, M.; Almeida, J.; Almeida, V. Identifying user behavior in online social networks. In Proceedings of the 1st Workshop on Social Network Systems, Glasgow, UK, 1–4 April 2008; pp. 1–6. [Google Scholar]
- Demographia World Urban Area. 2019. Available online: http://www.demographia.com/db-worldua (accessed on 14 June 2019).
- Xiao, Y.; Wang, Z.; Li, Z.; Tang, Z. An assessment of urban park access in Shanghai–implications for the social equity in urban China. Landsc. Urban Plan. 2017, 157, 383–393. [Google Scholar] [CrossRef]
- Roberts, H.; Sadler, J.; Chapman, L. Using twitter to investigate seasonal variation in physical activity in urban green space. Geo Geogr. Environ. 2017, 4, e00041. [Google Scholar] [CrossRef]


| Park Type (N = 122) | Description |
|---|---|
| Recreational park (n = 17) | Recreational green parks consist of botanical gardens, children’s parks, zoos and sports fields, categorized by variable locations and sizes. |
| Cultural relic park (n = 8) | Cultural relic green parks are home to ancient valuable relics and are places that are situated in urbanized areas, which are of value in terms of education and tourism. |
| Large urban park (n = 12) | Large urban green parks are community spaces that serve a wide range of inhabitants, categorized by adequate services, various activities and large sizes. |
| Natural park (n = 9) | Natural green parks are categorized by a natural background and have environmental value, situated in suburban areas. |
| Community park (n = 30) | Community green parks are spaces that are situated in residential areas for local inhabitants’ recreational purposes. |
| Neighborhood park (n = 46) | Neighborhood green parks are tiny or small residential urban green spaces that are situated in a certain residential district, serving a much smaller population in comparison to community parks. |
| Building_id | User_id | Month | Date | Day | Time | Year | Gender | Lon | Lat | Address |
|---|---|---|---|---|---|---|---|---|---|---|
| B2094554D064ABF4429 | ###* | 08 | 24 | Wed. | 0:00:03 | 2016 | F | 121.6650 | 31.14363 | ZhaoHang_Park |
| B2094757D06FA0F8409D | ###* | 11 | 11 | Fri. | 1:24:45 | 2016 | F | 121.5244 | 31.265614 | Jiangpu_Park |
| B2094757D06FA6FB409B | ###* | 05 | 29 | Mon. | 3:02:19 | 2017 | M | 121.3787 | 31.34228 | Gucun_Park |
| Min. | 1Q | Median | 3Q | Max. | |
|---|---|---|---|---|---|
| −15.489 | −2.308 | 0.325 | 2.184 | 183.555 | - |
| Coefficients: | Estimate | Std. Error | t-Value | Pr (>|t|) | - |
| (Intercept) | 0.545664 | 0.389241 | 1.402 | 0.161213 | - |
| Baoshan | 0.802558 | 0.438164 | 1.832 | 0.067252 | . |
| Changning | 2.739148 | 0.283543 | 9.66 | <2E−16 | *** |
| Huangpu | 1.847305 | 0.260773 | 7.084 | 2.38E−12 | *** |
| Jingan | 1.384735 | 0.340477 | 4.067 | 5.07E−05 | *** |
| Yangpu | 1.666539 | 0.145104 | 11.485 | <2E−16 | *** |
| Mon. | −0.17896 | 0.078598 | −2.277 | 0.022966 | * |
| Tue. | −0.185066 | 0.06221 | −2.975 | 0.00299 | ** |
| Wed. | −0.182712 | 0.094293 | −1.938 | 0.052891 | . |
| Fri. | −0.083539 | 0.063926 | −1.307 | 0.191526 | - |
| Sat. | 0.003532 | 0.059012 | 0.06 | 0.952281 | - |
| July | 0.871949 | 0.22472 | 3.88 | 0.00011 | *** |
| Aug. | 0.837961 | 0.202606 | 4.136 | 3.78E−05 | *** |
| Feb. | 1.866674 | 0.177615 | 10.51 | <2E−16 | *** |
| Mar. | 0.612028 | 0.166562 | 3.674 | 0.000249 | *** |
| Apr. | 0.940388 | 0.126142 | 7.455 | 1.71E−13 | *** |
| May | 0.35173 | 0.140485 | 2.504 | 0.012422 | * |
| Jun. | 0.829923 | 0.137177 | 6.05 | 1.93E−09 | *** |
| July 2014–June 2015 | 0.061276 | 0.077947 | 0.786 | 0.431952 | - |
| July 2015–June 2016 | 0.320808 | 0.082899 | 3.87 | 0.000115 | *** |
| Residual Standard Error | Degrees of Freedom | Multiple R-Squared | Adjusted R-Squared | F-Statistic | p-Value |
|---|---|---|---|---|---|
| 6.512 | 1205 | 0.4873 | 0.4792 | 60.28 | <2.2E−16 |
| Df | Sum Sq | Mean Sq | F-Value | Pr (>F) | ||
|---|---|---|---|---|---|---|
| Baoshan | 1 | 379 | 378.7 | 8.93 | 0.002861 | ** |
| Changning | 1 | 14,815 | 14,814.7 | 349.3 | <2.2E−16 | *** |
| Huangpu | 1 | 8031 | 8030.6 | 189.4 | <2.2E−16 | *** |
| Jingan | 1 | 2060 | 2059.6 | 48.56 | 5.25E−12 | *** |
| Yangpu | 1 | 10,885 | 10,884.8 | 256.7 | <2.2E−16 | *** |
| Mon. | 1 | 45 | 44.8 | 1.057 | 0.3042 | |
| Tue. | 1 | 216 | 215.7 | 5.087 | 0.024288 | * |
| Wed. | 1 | 95 | 94.8 | 2.235 | 0.135139 | |
| Fri. | 1 | 77 | 76.9 | 1.814 | 0.178312 | |
| Sat. | 1 | 1 | 1.5 | 0.034 | 0.853309 | |
| July | 1 | 639 | 638.5 | 15.06 | 0.00011 | *** |
| Aug. | 1 | 814 | 814.4 | 19.2 | 1.28E−05 | *** |
| Feb. | 1 | 4674 | 4674 | 110.2 | <2.2E−16 | *** |
| Mar. | 1 | 339 | 338.6 | 7.985 | 0.004795 | ** |
| Apr. | 1 | 2959 | 2958.8 | 69.77 | <2.2E−16 | *** |
| May | 1 | 143 | 142.5 | 3.361 | 0.067015 | . |
| Jun. | 1 | 1162 | 1162.4 | 27.41 | 1.94E−07 | *** |
| July 2014–June 2015 | 1 | 138 | 138.2 | 3.258 | 0.071333 | . |
| July 2015–June 2016 | 1 | 1106 | 1105.9 | 26.08 | 3.81E−07 | *** |
| Residuals | 1205 | 51,105 | 42.4 | - | - | - |
| Gender | Season | Baoshan | Changning | Hongkou | Huangpu | Jingan | Minhang | Pudong | Putuo | Xuhui | Yangpu |
|---|---|---|---|---|---|---|---|---|---|---|---|
| F | Autumn | 1.94% | 0.50% | 0.27% | 0.61% | 0.32% | 3.92% | 4.09% | 0.75% | 0.47% | 0.58% |
| Spring | 1.59% | 0.66% | 0.37% | 1.01% | 0.54% | 5.25% | 6.36% | 1.06% | 0.58% | 0.78% | |
| Summer | 2.10% | 0.67% | 0.34% | 0.77% | 0.56% | 5.00% | 6.40% | 1.02% | 0.56% | 0.75% | |
| Winter | 1.55% | 0.43% | 0.25% | 0.55% | 0.32% | 3.56% | 3.87% | 0.80% | 0.42% | 0.52% | |
| M | Autumn | 0.90% | 0.35% | 0.18% | 0.42% | 0.20% | 2.71% | 2.32% | 0.45% | 0.39% | 0.44% |
| Spring | 0.55% | 0.42% | 0.27% | 0.54% | 0.33% | 3.78% | 3.52% | 0.65% | 0.44% | 0.61% | |
| Summer | 0.76% | 0.39% | 0.26% | 0.52% | 0.34% | 3.34% | 3.51% | 0.61% | 0.44% | 0.55% | |
| Winter | 0.55% | 0.28% | 0.20% | 0.40% | 0.22% | 2.58% | 2.24% | 0.44% | 0.32% | 0.44% |
| Gender | Day | Community Parks | Cultural Relic Parks | Large Urban Parks | Natural Parks | Neighborhood Parks | Recreational Parks |
|---|---|---|---|---|---|---|---|
| F | Sun. | 2.34% | 0.43% | 0.57% | 2.21% | 3.62% | 5.82% |
| Mon. | 1.29% | 0.30% | 0.42% | 0.66% | 2.89% | 1.18% | |
| Tue. | 1.32% | 0.32% | 0.39% | 0.67% | 2.90% | 1.06% | |
| Wed. | 0.84% | 0.35% | 0.35% | 0.57% | 2.99% | 0.47% | |
| Thu. | 0.95% | 0.33% | 0.41% | 0.53% | 2.93% | 1.02% | |
| Fri. | 1.30% | 0.39% | 0.45% | 1.12% | 3.26% | 2.47% | |
| Sat. | 1.42% | 0.44% | 0.49% | 1.83% | 3.74% | 5.11% | |
| M | Sun. | 1.71% | 0.35% | 0.33% | 1.56% | 2.03% | 3.49% |
| Mon. | 0.91% | 0.22% | 0.26% | 0.46% | 1.58% | 0.69% | |
| Tue. | 0.92% | 0.23% | 0.27% | 0.45% | 1.60% | 0.61% | |
| Wed. | 0.52% | 0.24% | 0.23% | 0.36% | 1.68% | 0.21% | |
| Thu. | 0.61% | 0.23% | 0.28% | 0.37% | 1.62% | 0.60% | |
| Fri. | 0.94% | 0.28% | 0.31% | 0.78% | 1.72% | 1.39% | |
| Sat. | 0.98% | 0.34% | 0.30% | 1.32% | 1.97% | 2.92% |
| Season | District | Sun. | Mon. | Tue. | Wed. | Thu. | Fri. | Sat. |
|---|---|---|---|---|---|---|---|---|
| Autumn | Baoshan | 0.44% | 0.38% | 0.39% | 0.40% | 0.39% | 0.40% | 0.44% |
| Changning | 0.11% | 0.12% | 0.13% | 0.12% | 0.12% | 0.14% | 0.11% | |
| Hongkou | 0.09% | 0.04% | 0.04% | 0.05% | 0.05% | 0.08% | 0.09% | |
| Huangpu | 0.16% | 0.14% | 0.14% | 0.16% | 0.14% | 0.15% | 0.15% | |
| Jingan | 0.08% | 0.08% | 0.07% | 0.08% | 0.07% | 0.07% | 0.08% | |
| Minhang | 1.73% | 0.88% | 0.82% | 0.41% | 0.75% | 0.95% | 1.10% | |
| Pudong | 1.94% | 0.45% | 0.45% | 0.41% | 0.40% | 0.95% | 1.83% | |
| Putuo | 0.22% | 0.14% | 0.14% | 0.16% | 0.15% | 0.17% | 0.21% | |
| Xuhui | 0.23% | 0.05% | 0.07% | 0.07% | 0.07% | 0.14% | 0.23% | |
| Yangpu | 0.31% | 0.06% | 0.05% | 0.07% | 0.07% | 0.15% | 0.31% | |
| Spring | Baoshan | 0.33% | 0.30% | 0.30% | 0.29% | 0.30% | 0.30% | 0.33% |
| Changning | 0.16% | 0.15% | 0.16% | 0.15% | 0.15% | 0.15% | 0.17% | |
| Hongkou | 0.13% | 0.07% | 0.07% | 0.07% | 0.08% | 0.10% | 0.12% | |
| Huangpu | 0.24% | 0.21% | 0.21% | 0.24% | 0.20% | 0.23% | 0.22% | |
| Jingan | 0.12% | 0.12% | 0.13% | 0.12% | 0.13% | 0.13% | 0.12% | |
| Minhang | 2.37% | 1.20% | 1.14% | 0.60% | 0.95% | 1.29% | 1.47% | |
| Pudong | 3.03% | 0.71% | 0.72% | 0.59% | 0.59% | 1.40% | 2.83% | |
| Putuo | 0.30% | 0.21% | 0.20% | 0.23% | 0.21% | 0.25% | 0.31% | |
| Xuhui | 0.26% | 0.09% | 0.10% | 0.10% | 0.10% | 0.14% | 0.24% | |
| Yangpu | 0.42% | 0.11% | 0.09% | 0.11% | 0.09% | 0.19% | 0.39% | |
| Summer | Baoshan | 0.45% | 0.38% | 0.39% | 0.39% | 0.37% | 0.41% | 0.46% |
| Changning | 0.15% | 0.14% | 0.15% | 0.16% | 0.15% | 0.15% | 0.15% | |
| Hongkou | 0.12% | 0.06% | 0.07% | 0.06% | 0.06% | 0.09% | 0.14% | |
| Huangpu | 0.19% | 0.17% | 0.19% | 0.18% | 0.18% | 0.19% | 0.19% | |
| Jingan | 0.13% | 0.13% | 0.13% | 0.12% | 0.13% | 0.12% | 0.13% | |
| Minhang | 2.17% | 1.11% | 1.10% | 0.55% | 0.84% | 1.21% | 1.37% | |
| Pudong | 2.87% | 0.77% | 0.77% | 0.73% | 0.70% | 1.44% | 2.63% | |
| Putuo | 0.28% | 0.22% | 0.20% | 0.22% | 0.20% | 0.23% | 0.29% | |
| Xuhui | 0.23% | 0.09% | 0.10% | 0.11% | 0.10% | 0.15% | 0.22% | |
| Yangpu | 0.39% | 0.08% | 0.09% | 0.10% | 0.08% | 0.19% | 0.37% | |
| Winter | Baoshan | 0.31% | 0.30% | 0.27% | 0.29% | 0.31% | 0.30% | 0.32% |
| Changning | 0.11% | 0.10% | 0.09% | 0.10% | 0.10% | 0.10% | 0.10% | |
| Hongkou | 0.09% | 0.06% | 0.04% | 0.05% | 0.05% | 0.08% | 0.08% | |
| huangpu | 0.11% | 0.13% | 0.13% | 0.14% | 0.14% | 0.14% | 0.16% | |
| Jingan | 0.08% | 0.08% | 0.08% | 0.08% | 0.07% | 0.08% | 0.07% | |
| Minhang | 1.57% | 0.83% | 0.79% | 0.42% | 0.68% | 0.84% | 1.01% | |
| Pudong | 1.86% | 0.41% | 0.43% | 0.39% | 0.39% | 0.87% | 1.74% | |
| Putuo | 0.21% | 0.16% | 0.17% | 0.15% | 0.16% | 0.17% | 0.21% | |
| Xuhui | 0.18% | 0.07% | 0.06% | 0.07% | 0.07% | 0.12% | 0.19% | |
| Yangpu | 0.28% | 0.07% | 0.06% | 0.06% | 0.07% | 0.14% | 0.28% |
© 2020 by the authors. Licensee MDPI, Basel, Switzerland. This article is an open access article distributed under the terms and conditions of the Creative Commons Attribution (CC BY) license (http://creativecommons.org/licenses/by/4.0/).
Share and Cite
Liu, Q.; Ullah, H.; Wan, W.; Peng, Z.; Hou, L.; Rizvi, S.S.; Ali Haidery, S.; Qu, T.; Muzahid, A.A.M. Categorization of Green Spaces for a Sustainable Environment and Smart City Architecture by Utilizing Big Data. Electronics 2020, 9, 1028. https://doi.org/10.3390/electronics9061028
Liu Q, Ullah H, Wan W, Peng Z, Hou L, Rizvi SS, Ali Haidery S, Qu T, Muzahid AAM. Categorization of Green Spaces for a Sustainable Environment and Smart City Architecture by Utilizing Big Data. Electronics. 2020; 9(6):1028. https://doi.org/10.3390/electronics9061028
Chicago/Turabian StyleLiu, Qi, Hidayat Ullah, Wanggen Wan, Zhangyou Peng, Li Hou, Sanam Shahla Rizvi, Saqib Ali Haidery, Tong Qu, and A. A. M. Muzahid. 2020. "Categorization of Green Spaces for a Sustainable Environment and Smart City Architecture by Utilizing Big Data" Electronics 9, no. 6: 1028. https://doi.org/10.3390/electronics9061028
APA StyleLiu, Q., Ullah, H., Wan, W., Peng, Z., Hou, L., Rizvi, S. S., Ali Haidery, S., Qu, T., & Muzahid, A. A. M. (2020). Categorization of Green Spaces for a Sustainable Environment and Smart City Architecture by Utilizing Big Data. Electronics, 9(6), 1028. https://doi.org/10.3390/electronics9061028