1. Introduction
In the related research on apple orchards’ yield measurements or mechanical harvesting of apples [
1,
2,
3], this is the key to recognizing and localizing apple targets. The yield measurement and harvesting robot system’s real-time and reliability mainly depends on the speed and accuracy of the vision system. For the identification and location of a target fruit, a lot of research has been carried out, and gratifying achievements have been made [
4,
5,
6,
7]. However, they are mainly devoted to the research of static or non-vibrating single shadow fruits. The speed and accuracy of this type of target recognition and positioning have reached a higher level. Under natural conditions, due to the influence of the apple’s growth posture and camera position, the captured apple images have various forms, such as overlapped apples, shaded by leaves, shaded by stems, and so on. Especially for overlapped apples, it is difficult to pinpoint them. They will affect the localization and recognition accuracy, which in turn will affect the harvesting efficiency of the apple harvesting robot or the production accuracy of the orchard yield measurement.
At present, the research on overlapped fruit recognition algorithms mainly focuses on slightly overlapped fruits, which has achieved good results [
8,
9,
10]. However, there are serious overlaps or shadows in the fruit, which is a great challenge to the accuracy of recognition or positioning. However, many scholars have been attracted by research into overlapped target recognition. For example, in the field of biomedicine, Petros [
11] proposed a method which combines watershed algorithms and gradient range overlapped chromosomes segmentation algorithms to analyze some chromosomes that are occluded from each other. The recognition rate of overlapped chromosome can reach 80.4%. Yu [
12] has proposed a cell adhesion cell image segmentation and reconstruction algorithm based on mathematical morphology. It is used for automatic analysis of molecular images. These two cases are the recognition of overlapped targets. They can provide valuable inspiration for recognizing overlapped apples. At the same time, some research has been carried out on the overlapped targets of other fruits. For example, according to a statistical method, Xie [
13] used hue separation background and a Freeman chain code algorithm to extract one-pixel fruit outline, and took use of concave points search to optimize the circular Hough transform to locate the central coordinates and radii of several overlapped peaches. Xu [
14] used a directional gradient histogram (HOG) operator based on support vector machine (SVM) to recognize overlapped strawberries with an accuracy of 87%. In both cases, overlapped peaches or strawberries could be recognized. Some recognition algorithms will be converted to recognize overlapped apples. These methods provide new ideas to solve the recognition problem of overlapped apples. In addition, some achievements in other fields can also provide innovative ideas for our future research.
There is no doubt that some scholars have put a lot of effort into identifying overlapping apples and have made some achievements. For example, Shen [
15] studied fast tracking and recognition of overlapping fruits. For the fitting and prediction of robot paths, a fast-normalized cross-correlation matching method was used, and the recognition time was reduced by 28.1%. Xun [
16] used back propagation (BP) neural networks for segmentation and fitted the center radius of the circle according to the change in contour curvature. Li [
17] first performed color difference segmentation on the image, then performed some morphological processing on the apple to obtain the contour, and finally fitted the circle by least squares analysis. Xu [
18] proposed a combination method of Snake model and corner detection to segment overlapped targets which greatly reduced the segmentation error of overlapped apples. Wang [
19] first used the K-means cluster segmentation method to extract the target fruit region and then used the Ncut algorithm to extract the outline of the target fruit. Finally, the contour was reconstructed by the Spline interpolation method. Experiments were performed on 20 overlapped fruit images to calculate the segmentation error, and the mean value of coincidence was 5.24% and 93.81%. Zhao [
20] used an extremum method to achieve an overlapped fruit positioning algorithm. Firstly, the target fruit area was segmented by a color difference method or the K-means method and then hole filling and contour extraction were performed. Finally, the minimum distance from the inner point to the outline edge was calculated, determining the maximum value to determine the center and radius of the circle to complete the identification and positioning of the target fruit. All these cases achieved good effect to some extent, but there was room for improvement in the real-time performance or recognition accuracy of recognition and positioning algorithms.
Generally, the recognition algorithm of overlapped apples is complex, which will lead to poor real-time performance or recognition accuracy of the system, and the effect of recognition or localization is not ideal. The color and shape of the fruit changes greatly during the growth process, and most existing algorithms are unable to recognize overlapped apples. In this paper, a new recognition algorithm based on maxima of the overlapped circles fit is presented. First, convert the overlapped image to Lab color space, which is devoted to reflect the uniformity of color. Then, the overlapped apple images are segmented by the K-means algorithm, and the contour of the target apple is extracted by some morphological processing. This method is simple and easy to implement. For massive data, the time complexity tends to be linear. Finally, in order to improve the localization speed, and recognition accuracy, a fast algorithm for calculating the minimum distance is applied to find the center coordinates of the apple, the radii are obtained by calculating the minimum distance between the center and the edge.
The robot harvesting operation process is as follows: the robot approaches the plant through the walking device, the vision system recognizes and locates the target fruit, the robotic arm guides the end effector to avoid the obstacle and approaches the harvesting target, the end effector harvests the target fruit, and the robot arm and the end effector store the harvested fruit. In the whole process of harvesting, the accuracy and speed of the target fruit recognition and positioning become the bottleneck restricting the harvesting efficiency of the robot. In this paper, a fast localization method of overlapping apples based on K-means and extremum algorithms was studied, and its performance was verified through many experiments. Experimental results show that the new method can accurately and quickly locate the overlapped apples, the contours of the apples were complete.
2. Images Acquisition and Preprocessing
In the study of apple-harvesting robots’ visioning systems, the most important thing is to accurately recognize the target fruit. However, in the process apple image capture, due to the diversity of apple growth postures in the natural environment and the different positions of the camera, it is easy for branches or leaves to block and overlap each other. So, the captured apple images show a variety of gestures, such as single fruit without shade, a fruit covered by branches or leaves, overlapped fruit, etc. Moreover, to some extent, the posture and degree of overlapped or shaded apples are a complicated variable. These unfavorable factors will cause interference to target the accurate recognition of the fruit.
Compared with shaded fruit images, the recognition of the overlapped images is more difficult.
Figure 1 shows some shaded and overlapped apple images. In this study, the focus is on the localization and recognition of overlapped images.
In this study, a total of 150 apple images were captured from apple images captured from two different locations in Feng County and Penglai County. The specific information of image acquisition is as follows.
Image acquisition location: The apple images came from two places—the apple demonstration base in Dashahe Town, Fengxian County, Jiangsu Province, and the apple production area in Penglai County, Yantai City, Shandong Province.
Image acquisition information: All images were collected under natural light, including sunny and cloudy days, and smooth and backlighting. All the images in the collection were from between 8:00 am to 5:00 pm.
Image acquisition device: The camera was connected to the computer, AFT-0814MP (Vision Electronics Co., Ltd. Lanzhou, China), focal length 8 mm, field of view angle 54°, closest object distance 0.15 m, to ensure that the image acquisition distance was between 50–200 cm.
The variety of the apples was Fuji series, and 150 apple images were collected in the experiment. Compared with shaded fruit image, the recognition of overlapped images was more difficult.
Figure 1 shows some shaded and overlapped apple images. In this study, the focus was on the localization and recognition of overlapped images.
Color Space Selected
To a large extent, the choice of color space limits the image segmentation effect. The commonly used color spaces include the following: Red–green–blue (RGB), Lab, hue–saturation–intensity (HSI), XYZ, and so on. The RGB color space is defined based on three primary colors. It can represent almost colors, but due to the high correlation among the components, it cannot be used to directly segment images. The lab is a color standard model assigned by the International Commission on Lighting (CIE). It has higher uniformity than XYZ and forms a 3D space based on chroma and brightness. Therefore, in this paper, Lab color space is selected for overlapping image segmentation. Therefore, in this paper, the Lab color space is selected for overlapped images segmentation.
In the color space Lab, L represents luminosity, and the value is 0–100 (black to white). a represents the range is from red to green, the value is −128–+127 (green to red); b represents the range is from yellow to blue, the range is −128–+127 (blue to yellow). A Lab color space diagram is shown in
Figure 2.
Since the Lab color space is based on the XYZ color space, it is necessary to transform the color space to XYZ first. Therefore, the image color space can be realized from RGB to Lab space. The transformational relation of from RGB color space to XYZ color space is:
The transformational relation of from XYZ color space to Lab color space is:
where the function:
Equation (1) shows the transformation from RGB color space to XYZ color space; Equation (2) shows the transformation from XYZ color space to Lab color space, that is, the XYZ color space as a bridge.
The lab color space is dedicated to reflecting the uniformity of colors. The visual perception range of the Lab model is better than computer screens, printers, even humans. It is a hardware-independent color system that can make up for the lack of RGB models that depend on hardware facilities. So, after the transformation, the next step is image segmentation.
Two overlapped apple images in
Figure 1 are transformed to Lab color space; the results are shown in
Figure 3.
3. Overlapped Apple Images Segmentation
Generally, the recognition of target fruit depends on image segmentation, so the quality of image segmentation is directly related to the recognition effect. The K-means algorithm is based on a distance similarity clustering algorithm. By comparing the similarity between samples, the closer the distance between two points, the greater the similarity. Clustering segmentation [
21,
22,
23] is a classification tool that the image data are divided into several classes according to an algorithm. The similarity between each category is as small as possible, and the similarity within the category is high.
3.1. K-Means Segmentation
In the apple image, the color difference of apples, branches, and leaves can be better obtained by K-means segmentation. This is an algorithm that classifies objects into K clusters based on color features, where K is a positive integer. The K-means algorithm is simple and easy to implement. The main adjustment parameter is K. For massive data, the time complexity tends to be linear. The K-means segmentation algorithm aims to minimize an objective function, in this case the sum of squared error functions. The larger the value, the greater the error. The advantage is that the information provided by the measurement data can be fully utilized. Similarly, the larger the error, the worse the segmentation effect.
The objective function is:
where
is the guess centroid of the same class,
is a chosen distance measure between the data
and the cluster centroid
. In this paper, the selected distance metric is Euclidean distance as shown in Equation (4). Euclidean distance is a method of distance calculation that is the easiest to understand. It is derived from the formula for the distance between two points in the Euclidean space. In
dimensional space, it represents the true distance between two points, or natural length of vector (the point of distance from the origin).
Each pixel in the image serves as a sample. The detail steps of the K-means segmentation algorithm are as follows:
- Step 1:
Choose the number of clusters: K, according to the different color of apple fruit, leaves, sky, the K value is 3;
- Step 2:
Randomly generate K points as initial cluster centers: , , , …;
- Step 3:
Assign the distance from each sample to each cluster center and classify each sample to the nearest cluster center;
- Step 4:
For each cluster, the mean value of all samples is taken as the new cluster center;
- Step 5:
Repeat the Steps 2 to 4 until the centroids no longer change.
The segmentation image of the target fruit is obtained, and then the contour is extracted by morphological methods.
It can be seen from
Figure 4 that the K-means clustering algorithm had a good effect on the segmentation of the apple. Among the apples, sky, branches, and leaves, apples include red components the most, so images of the components can be used for the subsequent processing.
3.2. Contour Extraction
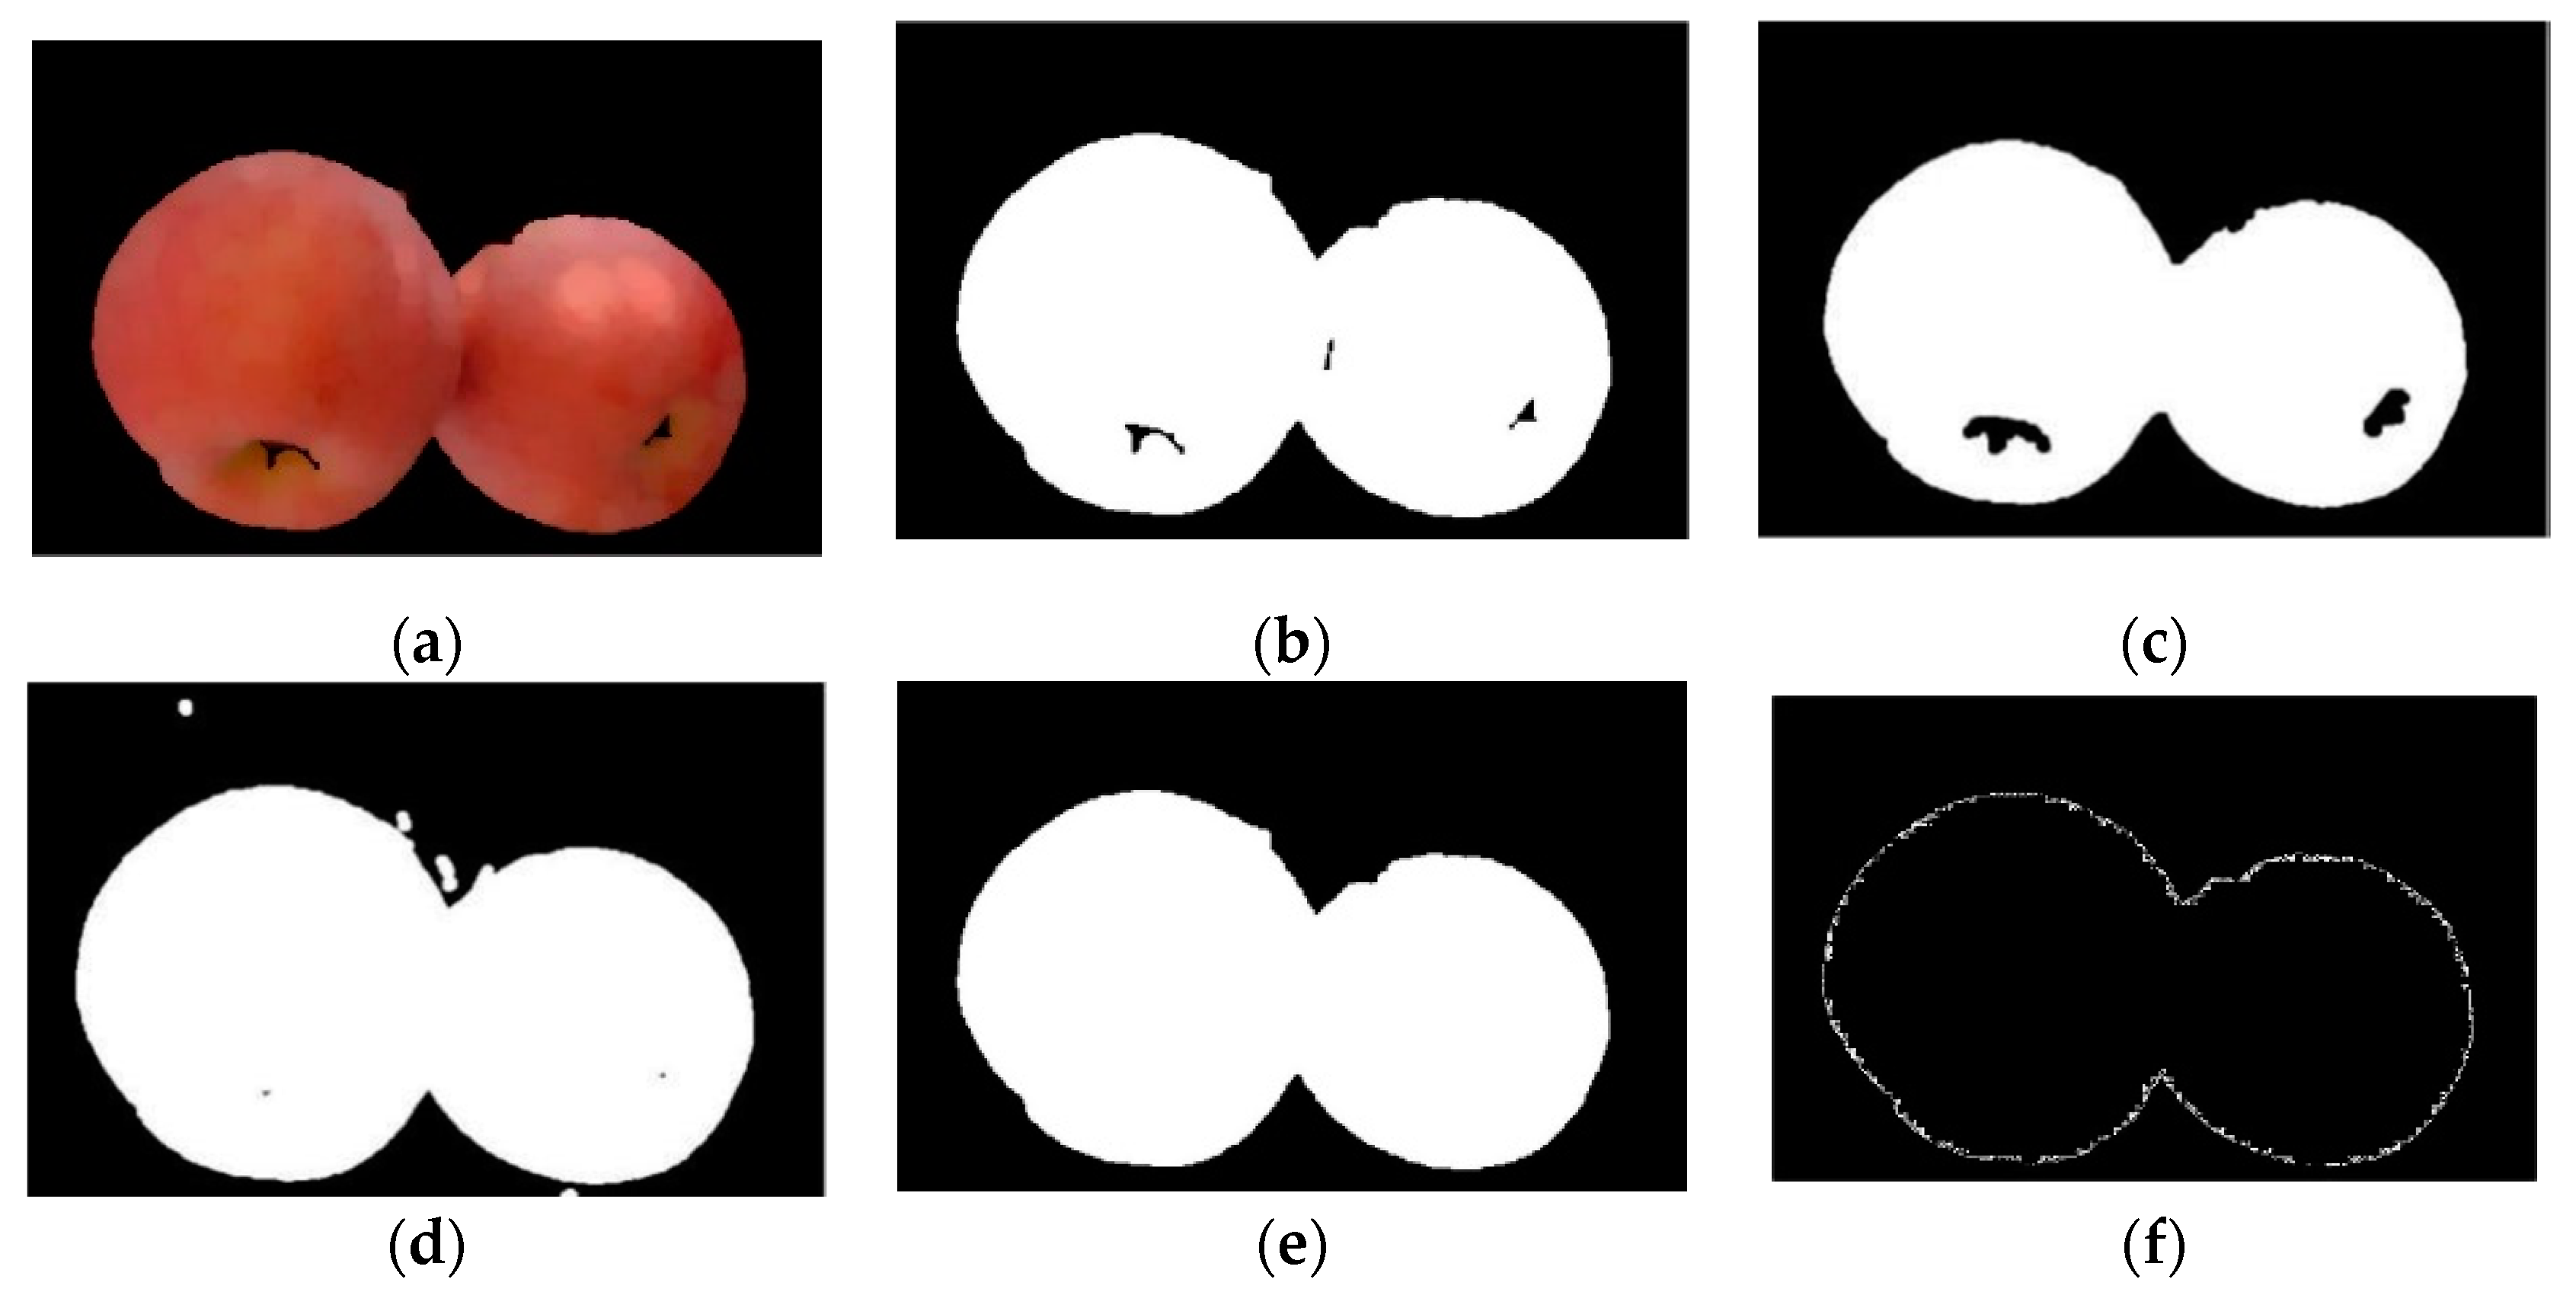
The segmented target area will be disturbed by glitches and holes. Therefore, the image needs to be processed by performing image smoothing, hole-filling, binary progress, etc. Morphological processing is a setting operation for obtaining the shape of the corresponding target. Usually, the object of the processing is a binary image. Corrosion causes the edges of the target to shrink inward, so it needs to set the form and radius of the structural elements, and then remove the smaller objects. Expansion causes the edge to expand, and the edge expands outward. The hole-filling can make the outline of the apple more complete, which is conducive to the subsequent circle fitting. For example, in
Figure 4(Ib), the effect after processing is as follows.
Figure 5a shows the effect of the opening operation, almost all burrs have been removed. This removal achieves the purpose of smoothing the contour edges. The effect of the binary processing after the opening operation is shown in
Figure 5b. Corrosion can eliminate burrs on the edge of the apple, but it increases the number of internal holes, as shown in
Figure 5c. Dilation can reduce the number of internal holes, but it increases the burrs as shown in
Figure 5d. However, there are some holes within the contour. Since the holes influence the center detection, the next step of filling holes is essential.
Figure 5e shows the effect after filling. It can be clearly seen from this picture that an integrated contour is obtained as shown in
Figure 5f.
4. Overlapped Circles Localization
Since the outline of the apple can be regarded as a quasi-circular edge, the apple can be effectively positioned with some circle fitting methods. To the problem of overlapped circles, there are many solutions, such as curvature, Hough transform, and least square method, etc. But each method has flaws. This paper presents a method based on extremum. Namely, obtain a distance function which shows the minimum distance from each internal contour point to the edge, and then obtain the center by finding the maxima of the distance function. Finally, by means of rotating vectors, the radii can be got.
4.1. Centers Detection
The outline of the apple can be regarded as a quasi-circular, so the circle fitting method can be used to recognize and locate the apple target. For circle fitting, it needs to find the two most basic elements: the center and radius of the circle. The minimum distances from the point in the apple contour to the edge of contour, the maximum value corresponding to this point in these minimum distances is the center of the circle, that is to find the local maximum value of the minimum distance function to find the center of the circle. The key is to get the above function. If the distance is calculated directly, it will generate a large amount of data, thus affecting the real-time capability of the system. Therefore, the fast generating distance function method is used to solve this problem. The program will perform four scanning processes for the pixels within the outline, and then the minimum distance of all inner pixels will be found accurately and quickly.
Four scanning directions should be defined first:
(x+, y+): from left to right, from top to bottom; (x-, y+): right → left, top → bottom; (x+, y-): left → right, bottom → top; (x-, y-): right → left, bottom → top.
The whole process is as follows:
Initialization: The distance value between the outer and edge points is defined as “0” and marked as “Visited”. While the distance value of the internal point is defined as ‘’ and marked as “Unvisited”.
Scanning: Scan the outline of the apple in four defined directions. For each time, the distance value of each pixel E will be updated. The updating method is as follows:
a. (x+, y+) direction: For each internal pixel E(i, j), compare the distance values of its left pixel E (i-1, j), and top pixel E (i, j-1), and then add 1 to the smaller value (definition For ‘min’ ). If min +1 is less than the distance value of E (i, j), update min + 1 to this value. Otherwise, the value remains unchanged.
Otherwise, the value remains unchanged. Similarly, the three directions of (x-, y+), (x+, y-), (x-, y-) are scanned separately.
After the scanning process, each internal point is compared with its four neighboring pixels and the distance value reaches the minimum value. Then, the distance value of each pixel is combined into a matrix. The 3D map of this matrix is shown in
Figure 6.
It is obvious that there are two local maxima pixels, which correspond to the two circle centers in the overlapped apple images. Take these two coordinates, and they are the center of the circle of the overlapped apples’ contour. The numerical value in the corresponding distance function matrix of coordinates is the requested radius, so the apple positioning has been achieved.
4.2. Radii Detection
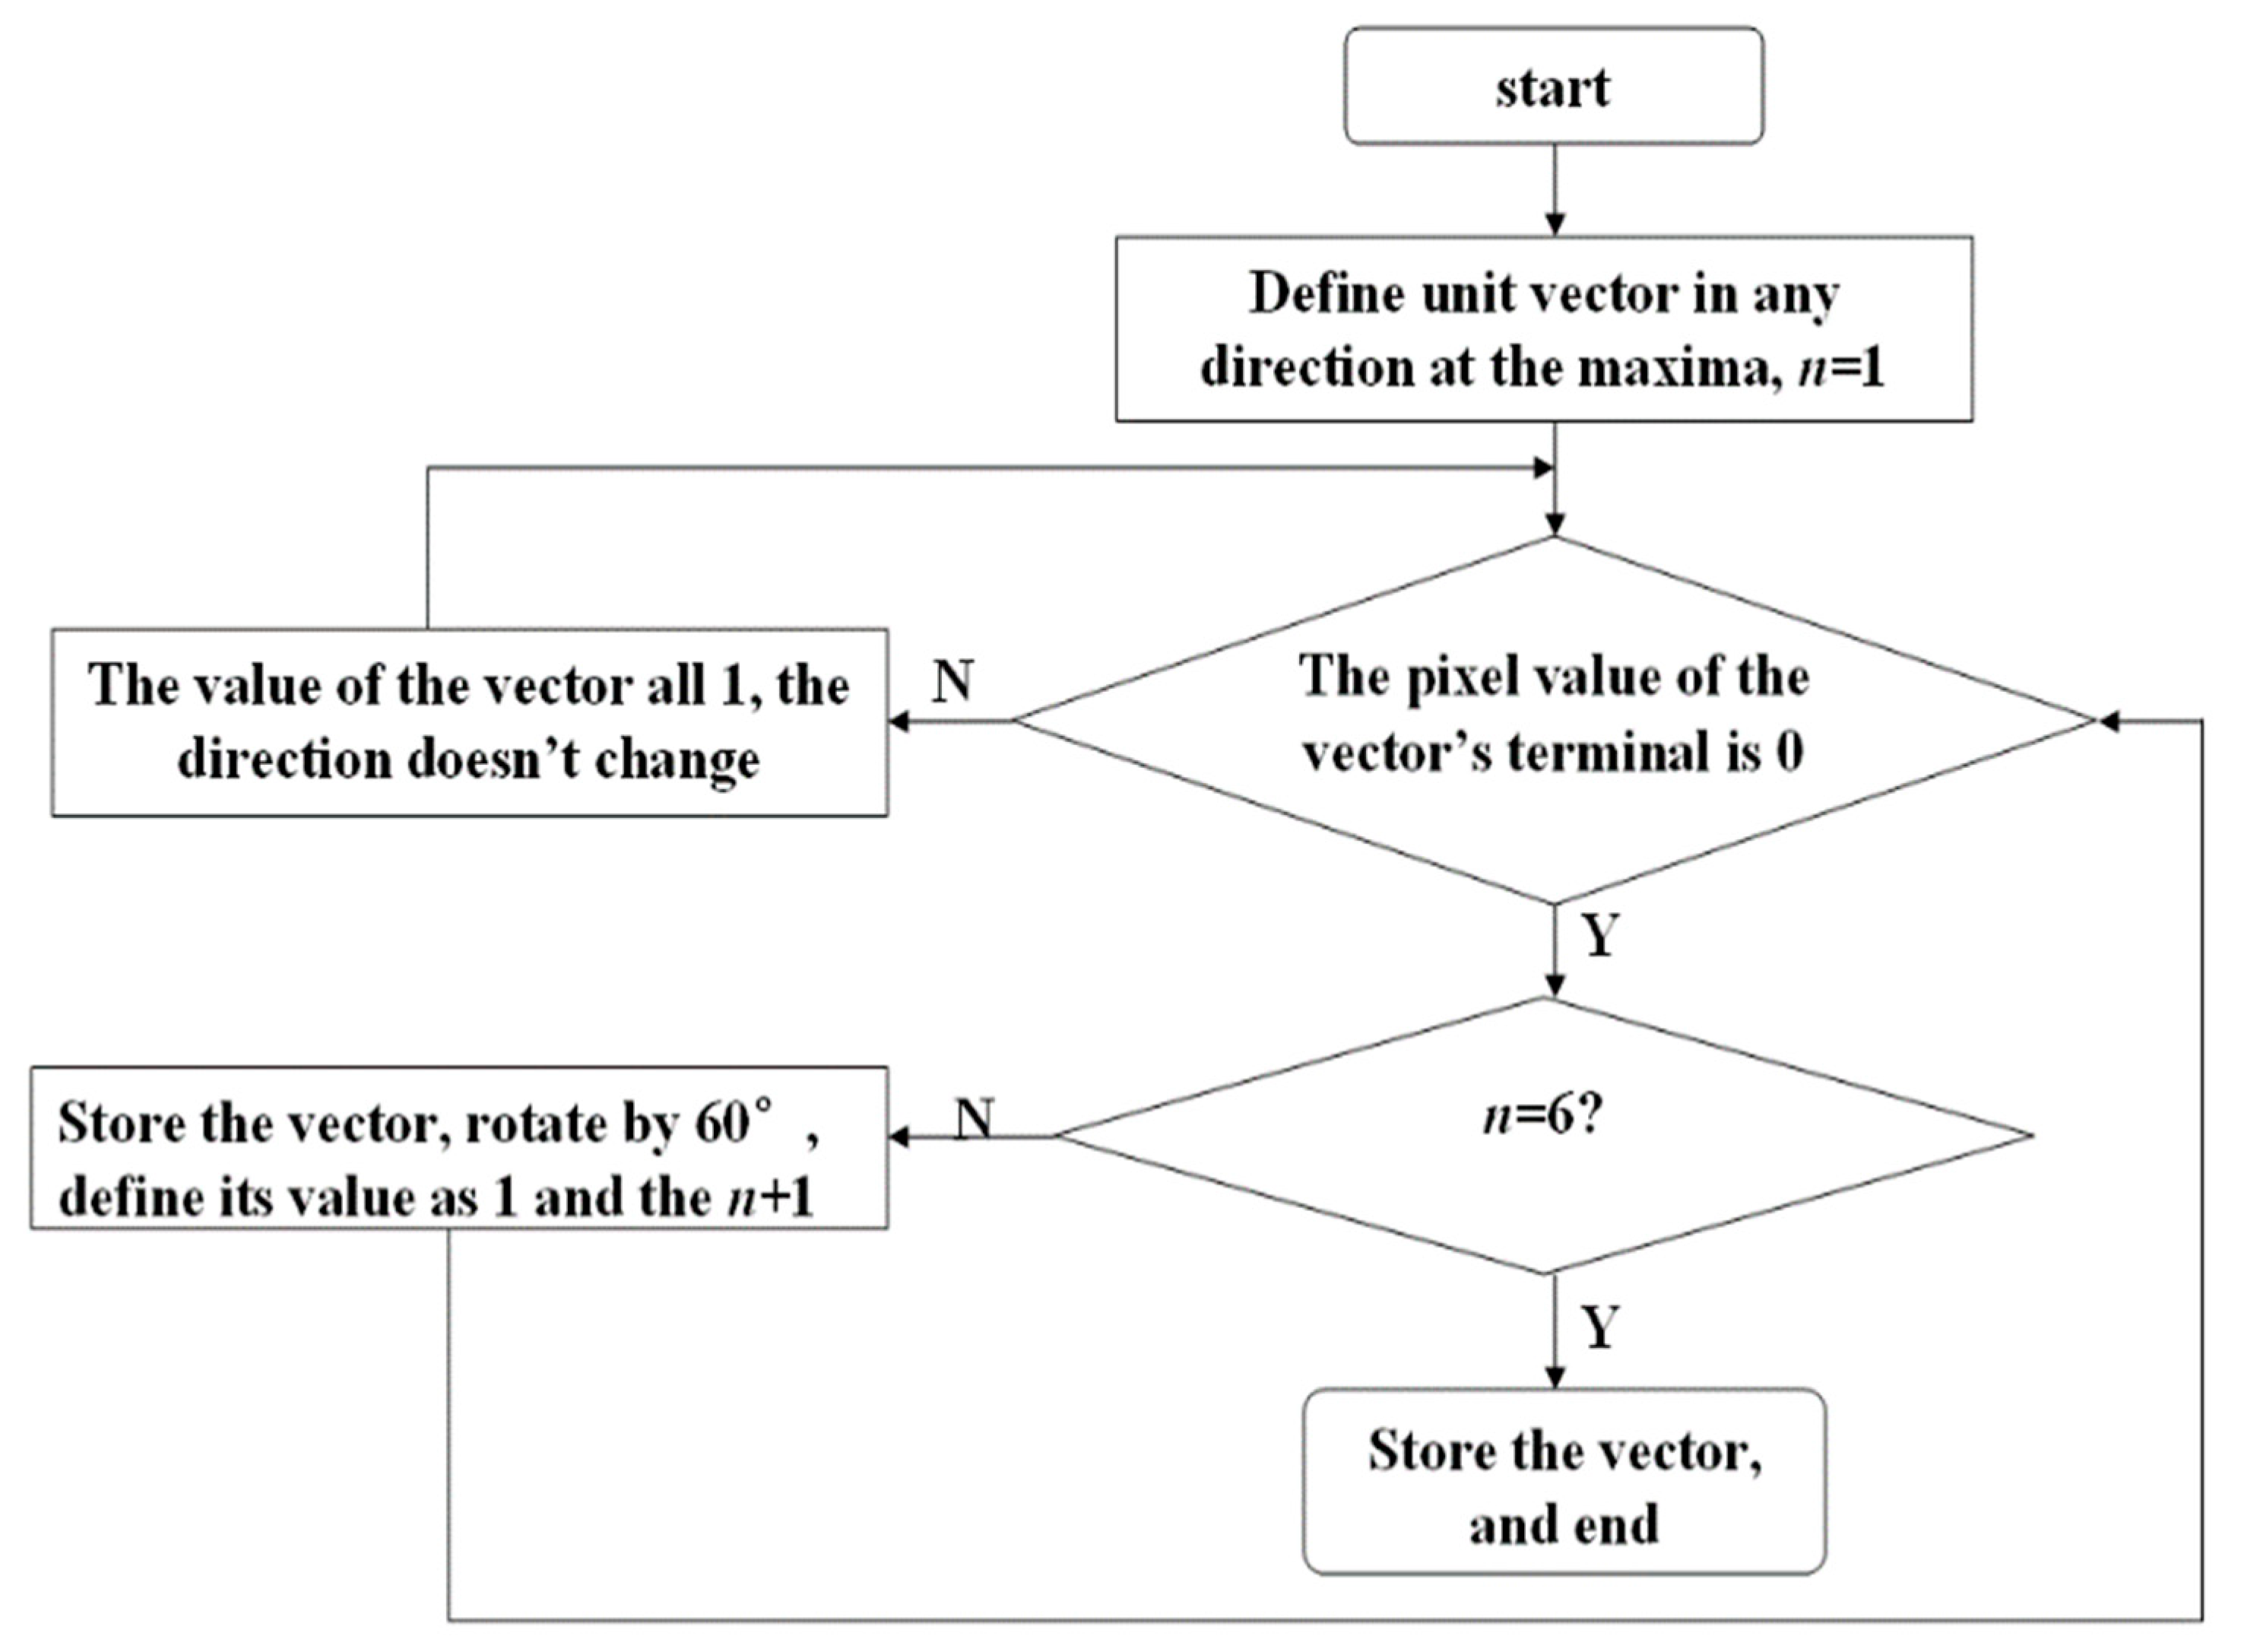
The next step after finding the center is to calculate the radius of each circle. In fact, the radius cannot be simply selected by the minimum distance from the center of the circle to the edge, because the minimum distance may reach the edge of another circle. Therefore, in this study, the minimum rotation vector method is used to find the radius, it is a fast search algorithm, the search range includes local and global search, so the results can be obtained accurately and quickly. The flow chart is shown in
Figure 7.
After six vectors are obtained, the shortest vector length is the radius to be found. The basic steps are as follows:
- Step 1:
set the number of vectors = 1, at the maximum value, take the unit vector in any direction;
- Step 2:
to judge whether the vector end reaches the edge, if so, turn to Step 3; if not, the direction no change, length + 1, repeat this step;
- Step 3:
to judge the vector number = 6, if so, store them and turn to Step 5, otherwise turn to step 4;
- Step 4:
store the vector and rotate it 60 degree, reset length = 1, number +1, return to Step 2;
- Step 5:
the minimum value of these six vectors is the radius.
5. Experiments
5.1. Experiment Design
In this study, a new fast positioning method has been proposed for overlapped apples. To further illustrate the effectiveness and real-time performance of the new algorithm, the following experiments have been arranged. To verify the largest method for identifying overlapping apples, this study compared the corrosion method and the Hough transform method. In contrast, through three sets of experiments, many repeated tests. Five representative experimental images are presented in this paper, capturing five overlapping apple images from different apple varieties. At last, the experiment was repeated using 150 images to verify the performance of the new method.
When the two circles overlap, the information will interfere with each other, and the corrosion method will separate the centers of two circles. The idea of corrosion method is to etch the image continuously, so that two circles are separated gradually until the outline becomes a single pixel, which is the center of the circle. The basic idea of standard Hough transform method is to map the edge points of the image space to the parameter space. All coordinates point to the position in the parameter space corresponding to the cumulative value, according to which the size of the circle and the position of the center can be determined.
The experiment platform, CPU: Intel Core2 Duo E7300 2.66 GHz, RAM: 1.99GB, VGA card: Intel® G33/G31 ECF, operating environment: 64-bit Windows 7, MATLABB R2018a.
5.2. Evaluation Criterion
5.2.1. Area Relative Error
The size of the apple’s area can guide the robot’s harvesting sequence. It is proportional to the distance to the camera. The larger the area and the closer the distance, priority is given to harvesting, otherwise, the farther the farther the apple is, the harder it is to harvest; therefore, at this time, the robot needs to adjust its position. Therefore, the relative error of the area is small, indicating that the positioning and recognition accuracy is high.
The area of target apple is defined as the total number of pixels in the contour of apple. The area difference between the actual apple and the fitting-out circle is defined as the absolute error
, and the ratio of the absolute error and the area of actual apple is defined as the relative error
.
where,
is the number of pixels in actual apple,
is the number of pixels in the apple contour.
5.2.2. Center Error
The key to successful harvest is to determine the center of the target apple. Finding the center of apple and guide the actuator to accurately capture the apple. Due to the apple belongs to the quasi-circular rather than the standard round, there is usually a deviation in the determination of the center. The center is a 2D coordinate, so the center deviation can be defined as the distance between two points. The smaller distance represents, the better effect of fitting method, otherwise the worse. In other words, the center error was small, indicating high positioning and recognition accuracy.
Assume that the actual coordinates of apple center are
, the coordinates of fitting out center
, the center error is defined as
5.2.3. Recognition Time
The real-time performance is one of the important factors that restrict the development of apple harvesting robots. How to effectively improve the real-time performance has aroused great interest in research, so this is an effective measure to evaluate algorithms. In this study, it was very time-consuming to read the image from the computer to output the fitted contour, and the shorter the time, the better the real-time performance.
5.3. Experimental Results
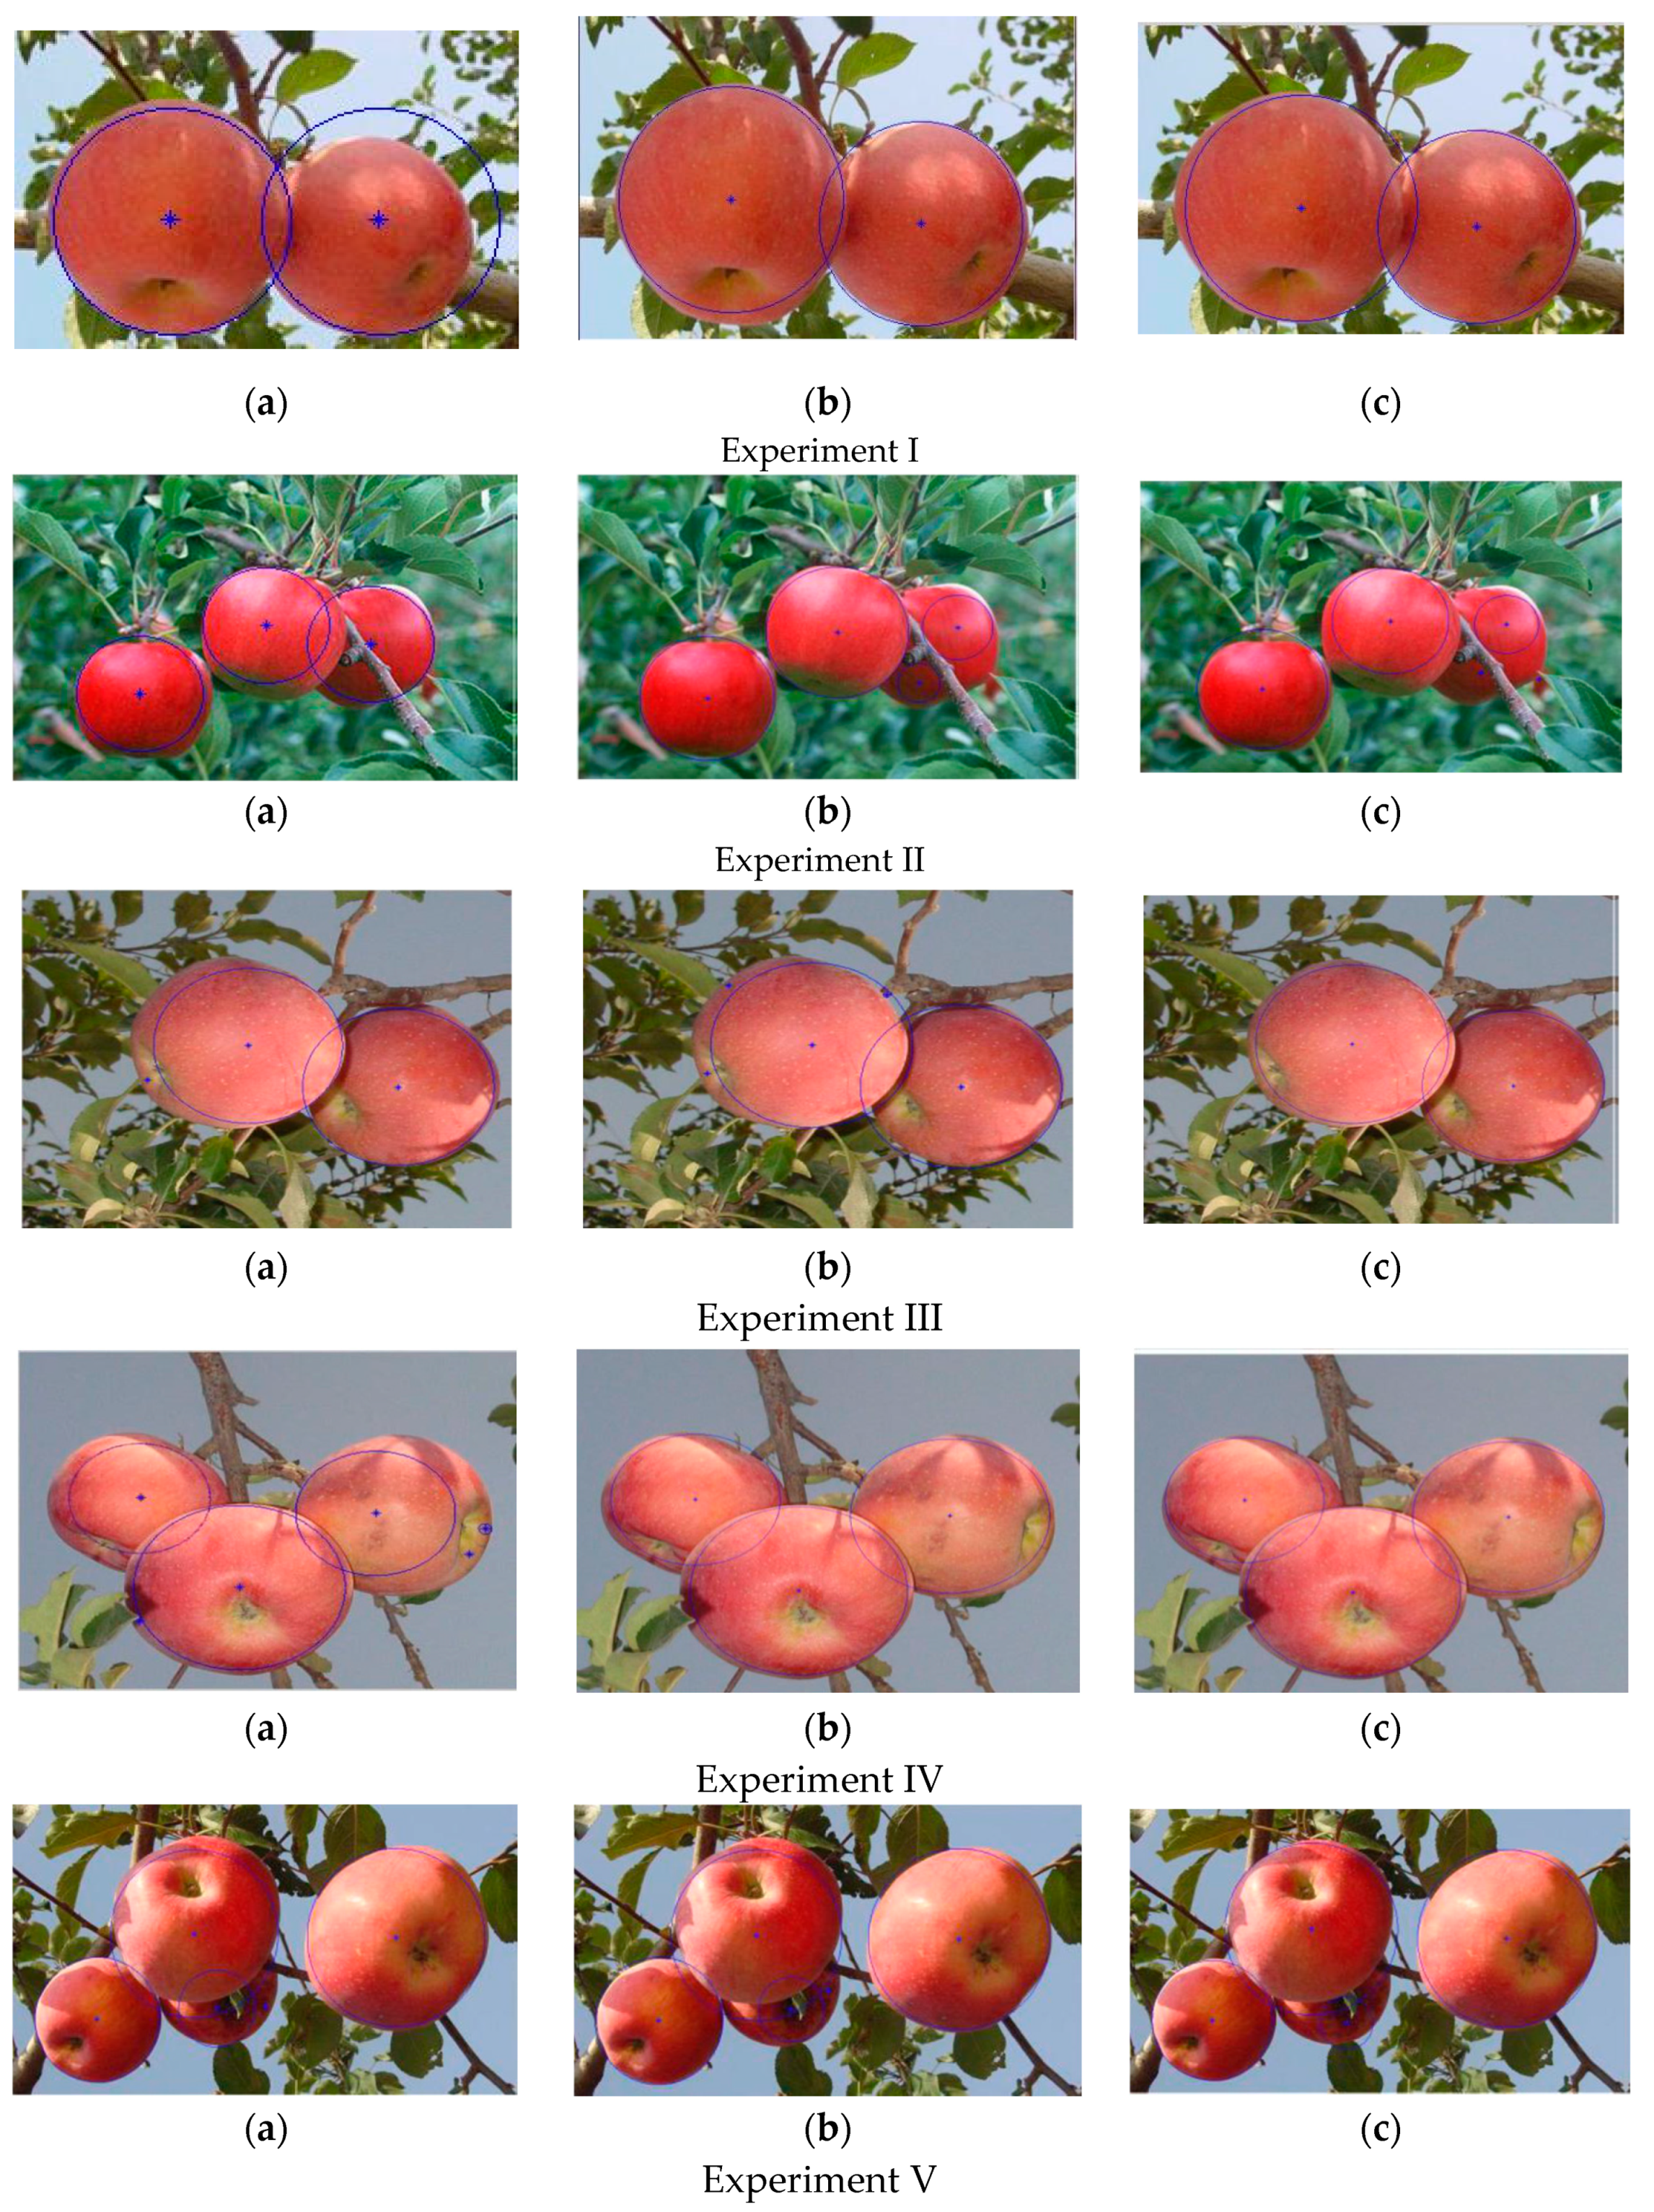
Respectively, the Hough transform method, the corrosion method, and the maximum method were used to locate overlapping apples. The effect pictures are shown in
Figure 8.
From
Figure 8, the circles fitted by the maximum method are closest to the target fruit, so the recognition precision of the maximum method was higher than that of the Hough transform and the corrosion method.
However, the visual evaluation had some subjective factors, and it was difficult to evaluate the actual effect of maximum method fairly and objectively. Therefore, we further used numerical methods for evaluation to calculate the regional relative errors, center errors, and recognition time lists in
Table 1,
Table 2 and
Table 3. In the table, at the end, we used 150 acquired images for comparative experiments. The experimental results are shown in
Table 4, and the results are averaged values.
From
Table 1;
Table 2 the results of experiment II show that the recognition precision of the Hough transform is higher than the maximum method. In other experiments, the maximum method is the one that works best. From
Table 3, compared with the Hough transform method and the corrosion method, the speed of the maximum method has obvious advantages for realizing the real-time requirements of the harvesting robot. From
Table 4, the results of repeated experiments show that the performance of the new method is the best in all aspects.
5.4. Discussion
This paper presents a localization method of overlapped apples based on maxima. First, convert the color space to Lab color space, and then perform K-means segmentation. Second, apple contours were obtained after some morphological processing. Third, a fast algorithm to calculate distance between two points was used to find the center. Finally, the corresponding radii were obtained by rotating vectors. Such positioning can be achieved. The experimental results show that this method can accurately and quickly locate apples. Therefore, it has certain practicality for the sorting robot system.
Under the Lab color space, the overlapped apple targets can be effectively segmented by K-means clustering. After performing a series of morphological processing on the obtained divided overlapping apples, the extracted overlapping apple contours are completed. In this study, there was a large difference between apple fruit, leaves, sky, so can be determined. The selection of and the initial clustering center will influence the segmentation results. However, in the practical application, is difficult to estimate. If an inappropriate initial clustering center is selected, the results will be difficult to achieve. K-means clustering segmentation algorithm updates the clustering center by iterative operations, when it encounters big data, the calculation cost will be very large.
When the overlapping round shadows are moderate and the edges are relatively complete, the process effect of maximum method is good, and it is superior to the Hough transform and the corrosion method in terms of accuracy and time consumption. So, the maximum method can satisfy the accuracy and real-time requirements of the harvesting robot. Although maximum method has obvious advantages, there are some defects. In the case of incomplete apple edges or large holes in the apple, it may lead to large errors and deviations, which may affect the incorrect positioning. Therefore, the image needs to be repaired and preprocessed, and then fitted.


