Abstract
Photo-identification is a widely used non-invasive technique in biological studies for understanding if a specimen has been seen multiple times only relying on specific unique visual characteristics. This information is essential to infer knowledge about the spatial distribution, site fidelity, abundance or habitat use of a species. Today there is a large demand for algorithms that can help domain experts in the analysis of large image datasets. For this reason, it is straightforward that the problem of identify and crop the relevant portion of an image is not negligible in any photo-identification pipeline. This paper approaches the problem of automatically cropping cetaceans images with a hybrid technique based on domain analysis and deep learning. Domain knowledge is applied for proposing relevant regions with the aim of highlighting the dorsal fins, then a binary classification of fin vs. no-fin is performed by a convolutional neural network. Results obtained on real images demonstrate the feasibility of the proposed approach in the automated process of large datasets of Risso’s dolphins photos, enabling its use on more complex large scale studies. Moreover, the results of this study suggest to extend this methodology to biological investigations of different species.
1. Introduction
Nowadays the study of cetaceans is of vital importance as an attempt to understand how marine ecosystems are alterating over current years and what are the main effects of these changes. Species monitoring is performed through the collection and the evaluation of meaningful bio-ecological parameters aimed to estimate, for example, their spatial distribution, site fidelity, abundance and migration as well as habitat use [1,2,3,4,5,6,7,8,9,10,11,12,13]. The estimation of these parameters can be greatly facilitated through the use of a non-invasive technique based on automated algorithms and a large data availability: the automatic photo-identification of specimens (photo-ID). Photo-ID is based on the general hypothesis that each individual is unique within its population, showing several specific physical characteristics useful for its identification. Photo-ID is especially encouraged because of its non-invasiveness and its high efficiency. However, given the widespread diffusion of mobile devices and digital cameras able to capture an extremely high number of high quality images, the photo-ID of large amounts of data must be performed with the aid of automated or semi-automated approaches.
In literature, in the specific case of Risso’s dolphins [14,15], the algorithm SPIR has been presented [16,17,18,19] to perform the photo-ID of this species in a fully automated way. The main drawbacks even of state of the art methodologies, not only related to cetaceans but also to the study of other species, are the dependency on the manual intervention of an expert operator [20,21,22] as well as the unavailability of large datasets to be processed [23,24,25]. Moreover, even in the case of [16], where the photo-ID can be automatically performed using SPIR, a great concern regards the problem of fin cropping, considering the fact that pictures are captured generally from boats in real life settings. To that regard, Ref. [26] addresses the problem of enhancing the assistance in the processing of massive amounts of biological iconic data. The authors assert that: “the main bottleneck in processing data from photographic capture-recapture surveys is in object detection for cropping or delineating an area of interest so that matching algorithms can identify the individual”. This concept can be easily extended to other species large scale studies. The work described in this paper addresses the problem of automatically cropping a dorsal fin starting from a full frame image using deep learning models. In recent years, deep learning models have become a powerful standard resource in the resolution of classification and regression problems throughout many applications [27,28,29,30,31], and are well suited to model the building blocks of a photo-ID automated pipeline. Their strength is the capability of automatically learn complex patterns in multi-dimensional signals (e.g., in images) if trained with a sufficiently high number of samples. Particular attention is being payed to the selection of specific Convolutional Neural Network (CNN) architectures (e.g., U-NET [32] for biomedical image segmentation) or focusing the study on the effect of using specific activation layers as in [33], but, as the authors claim, one of the main difficulty of handling complex CNN architectures is the huge number of resources needed to perform the computations. Examples of applications to the marine biology area can be found in [34,35,36,37,38,39,40]. In more details, in [34] a deep learning approach is employed to discriminate if an image pixel is part of the trailing edge of a fin by predicting its expected belonging probability to the fin, whilst [38] addresses cetaceans identification in images proposing the use of a Mask R-CNN to solve the problem of automatically detecting a region of interest that represents a fin in marine mammals images. However, the authors highlight the difficulties in obtaining good quality images labeled by domain experts, justifying their choice of applying transfer learning starting from a pre-trained complex model. In addition, it is worth highlighting that in full frame images taken from survey boats, even if captured by professionals, the interesting image portion that depicts a cetacean is relatively small and can be also searched introducing domain knowledge in a preliminary image pre-processing step as an alternative to a Mask R-CNN approach.
For this reason, in this paper a combination of an image pre-processing algorithm coupled with a Convolutional Neural Network classifier is presented, with the aim of approaching the automated crop of dorsal fins from a different point of view. This approach is an alternative to the Mask R-CNN based one, sharing its underlying idea. In fact, the generation of the proposals regions (i.e., the areas where it is likely to find the interesting object) here is demanded to an image pre-processing step, whilst the classification of fin vs. no-fin is performed by a CNN.
2. Materials and Methods
2.1. Study Areas and Dataset
The Gulf of Taranto situated in the Northern Ionian Sea (Central-eastern Mediterranean Sea) extends from Santa Maria di Leuca to Punta Alice covering an area of approximately 14,000 km (see Figure 1). A complex morphology characterizes the basin. A narrow continental shelf cut by several channels identifies the western sector while descending terraces delineate the eastern one, both declining towards the Taranto Valley, a NW-SE submarine canyon system with no clear bathymetric connection to a major river system [41,42,43,44]. This singular morphology involves a complex distribution of water masses with a mixing of surface and dense bottom waters [45] and the occurrence of upwelling currents with high seasonal variability [46,47,48,49].
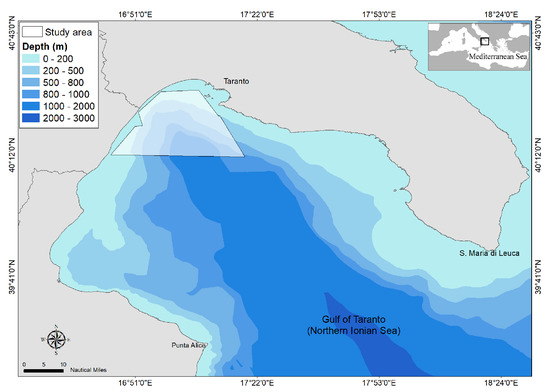
Figure 1.
Map of the Gulf of Taranto (Northern Ionian Sea, Central-Eastern Mediterranean Sea) with indication of the survey area investigated from 2013 to 2018.
The second study area took place off Pico Island, one of the nine islands belonging to the Archipelago of the Azores (Portugal) (see Figure 2). The islands are separated by deep waters (ca. 2000 m) with scattered seamounts [50], stretching-out over 480 km, overlapping the Mid-Atlantic Ridge. The Gulf Stream, the North Atlantic and Azores currents (and their branches) are responsible for the complex pattern of ocean circulation that characterizes the Azores, and result in the high salinity, high temperature and low nutrient regime waters [51]. Due to the upwelling of nutrient-rich deep water currents, the runoff from land and the complex and dynamic oceanic circulation patterns, the area constitutes a food-rich oasis in the oligotrophic central North Atlantic. It concerns a coastal marine habitat where coastal, pelagic and deep-water ecosystems can be found in close vicinity of each other, resulting in a species-rich and highly diverse marine ecosystem [52]. Due to the absence of a continental shelf and the steep marine walls, over 25 cetacean species, including Risso’s dolphins can be often found close to shore [53,54].
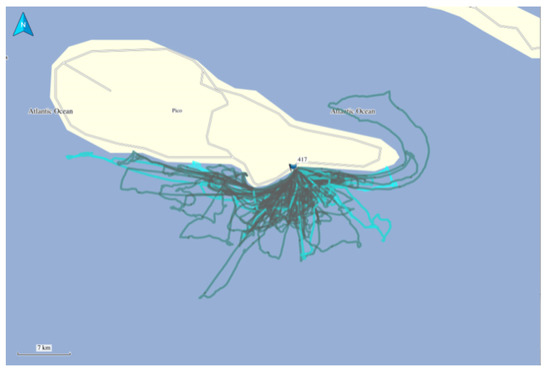
Figure 2.
Map of the Azores study area with indication of the survey area investigated.
The data collection used in this work contains full frame images acquired by our research in the study areas described before. More specifically, the dataset is composed of:
- ∼10,000 pictures taken in the Gulf of Taranto (Jonian Sea) between 2013 and 2018
- ∼14,000 pictures taken near Azores islands (Atlantic Ocean) in 2018
Pictures collected at item number 1 have been taken on board a catamaran during standardized the surveys. In fact, random equally spaced transects have been daily generated, covering about 35 nautical miles in 5 h (with a speed of about 7 knots) only in favorable weather conditions [55] (see Figure 1). All the images have been taken by marine mammals observers on the boat with a Nikon D3300 camera with Nikon AF-P Nikkor 70–300 mm, G ED lens. The photos have a spatial resolution of pixels and their memory occupation is about 90 GB.
Pictures collected at item number 2 have been obtained off Pico island, covering approximately 540 km during 2018. Risso’s dolphins were first located from a land based look out (38.4078 N and 28.1880 W) using binoculars (Steiner observer) [56] and encountered during ocean based surveys, using a 5.8 m long zodiac, equipped with a 50 HP outboard engine. Examples of the images are shown in Figure 3.
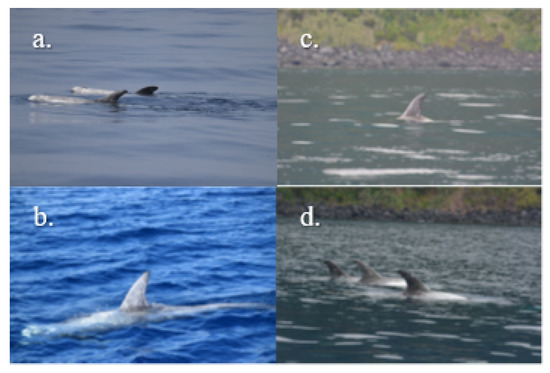
Figure 3.
Images taken from the dataset. (a,b) Images have been captured in the Gulf of Taranto, (c,d) in the Azores islands.
2.2. Methodology
Before carrying on photo-ID investigations, the crop of the interesting image portions that depict a dorsal fin must be done [26]. Figure 4 shows the block diagram of the proposed two-stage solution where it is immediate to see that a full frame image needs to be pre-processed and cropped in order to be subsequently used in an effective way. The two steps involved are the following:
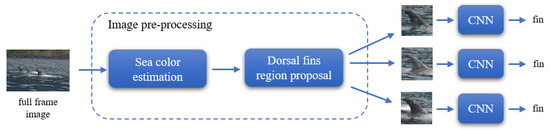
Figure 4.
High level block diagram of the proposed approach. A full frame input image is first pre-processed in order to extract regions of interest that may contain a dorsal fin. Then, the classification of fin vs. no-fin is performed using a Convolutional Neural Network (CNN) specifically designed to this end. The CNN block refers to the same Convolutional Neural Network that is used to classify each cropped image.
- image pre-processing using 3D polyhedron-based color segmentation;
- classification based on CNN.
3D Polyhedron-Based Color Segmentation
The hypothesis behind this approach is straightforward and was inspired by the specific domain of the problem: assuming that images are generally composed by two main elements, sea and cetaceans, dorsal fins can be located by considering only pixels which assume a specific set of a priori fixed colors. The proposed method is based on the identification of different models consisting of color clusters in the CIE L*a*b* color space, each one representing a specific shooting condition. Each model , is a key-value pair , where the key is a descriptor of the sea and the corresponding value is a descriptor of the dorsal fins. In more details, each sea descriptor defines a lower bound and an upper bound for each channel of the Lab color space with the aim of filter the pixels belonging to the sea. is a set of Lab color triplets that define a 3D polyhedron in the Lab color space and can be used to mask image regions belonging to dorsal fins.
Whenever a full frame image I needs to be segmented to identify the candidate fins the following steps are performed, as qualitatively shown in Figure 5:
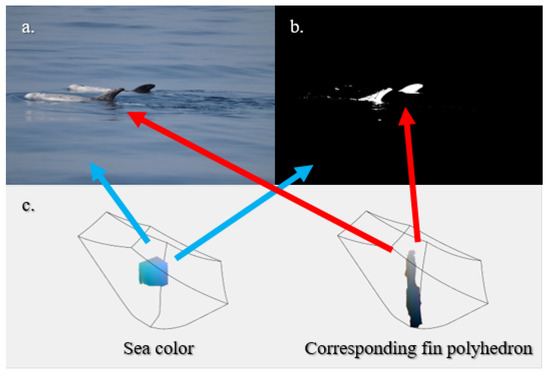
Figure 5.
Example of segmentation: (a) original image, (b) binary mask obtained. White areas are candidate to be fins. (c) Qualitative visualization of a model in terms of sea color and fin polyhedron. The blue arrows refer to the masked background, the red ones highlight the polyhedron responsible for masking the candidate fins.
- Sea color estimation to identify the best model among the with a major voting approach, i.e., the model that masks the highest number of sea pixels:where denotes the indicator function, denotes the pixel of image I at position and is the set of Lab color triplets where the three channel values simultaneously lie within the intervals defined in ;
- Dorsal fins region proposal: a binary mask is computed by filtering the image I with the corresponding 3D polyhedron . Each of the resulting connected components—e.g., according to 8-connectivity—likely contains a dorsal fin.
Further processing steps are also considered with the aim of improving the results of the segmentation:
- median filtering (for salt and pepper noise reduction), holes fill and selection of connected regions based on their area;
- aspect ratio (width/height) dimension analysis to discard regions with high aspect ratio, due to their low probability of representing a dorsal fin useful for photo-ID purposes;
- size refinement of single regions based on their centroids and extreme points in order to include only relevant portions of the fins.
At the end of the procedure, a certain number of proposed regions is available for the initial image I and each of them needs to be classified as fin or no-fin by the deep learning model.
The key hypothesis of the method is that, given the limited domain of the problem, colors are treated as carrying precise semantic information. However, it is possible to show that color semantics is not uniquely determined among pictures: depending on the amount and the type of light characterizing the scene (based, in turn, on weather conditions, time of the shot and presence of other elements) same colors can represent sea in some pictures and fins in other pictures. Overcoming this limitation, hereafter referred as color semantic ambiguity, is crucial for the development of an efficient segmentation method based on colors. Here, multiple models are considered to properly handle ambiguous cases.
Color Models Update
For each sea color set , a semi-automated iterative procedure has been established for the creation of the corresponding polyhedra as well as their subsequent update. The steps are detailed in Algorithm 1.
| Algorithm 1: Color models update |
 |
Convolutional Neural Network
A binary classification problem is defined in order to fulfill the need for filtering the segmentation phase results. The images obtained are labeled as fin if they actually contain a dorsal fin, no fin otherwise.
The classifier proposed is a Convolutional Neural Network built from scratch (Figure 6), whose structure is inspired by the one implemented in [57] for a binary classification task applied to another domain. The input size of the images is . The architecture is composed of three blocks of convolutional layers which preserve the input size and extract local features through filters coupled with the ReLU activation function. Information from such features are then merged in later stages of processing in order to detect higher-order features and ultimately to yield information about the image as whole. Each block halves the output size by applying a max pooling downsampling with the aim of learning invariant representations with respect to rotations and translations [58]. The last three blocks are fully connected layers aimed at using extracted features to obtain a final binary prediction through a Softmax activation function.
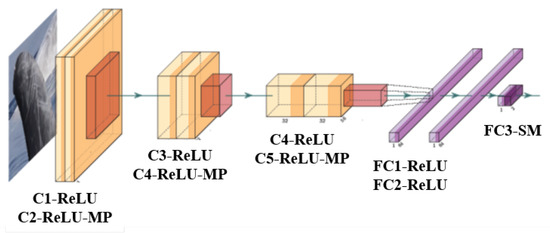
Figure 6.
CNN architecture and processing stages of a single image. The yellow-orange blocks represent the convolution and pooling layers, while the purple blocks represent the final classification layers. C is used for Convolutional Layers, ReLU for Rectified Linear Units, MP for Max Pooling, FC for Fully Connected Layers and SM for SoftMax.
The CNN architecture has been designed with the criterion of maximizing the clearness of its structure and minimizing the number of parameters, whilst keeping high efficiency in the classification task. The proposed classifier consists of ∼1.7 millions parameters, requiring ∼6.4 MB for the net to be stored and ∼7 MB to store all the intermediate processing steps needed to classify an unknown input (forward pass). These measurements are significantly low if compared to state-of-the-art architectures available as off-the-shelf models, for instance GoogleNet, AlexNet, VGGNet or ResNet.
Moreover, it is worth noting that use of filters causes the receptive field of the third convolutional layer to be of size with respect to the input layer, which is considered to be a reasonable dimension for the extraction of meaningful features. Using several filters instead of a single filter makes this result possible with fewer parameters. Supposing that all the volumes have C channels, then the single convolutional layer would contain parameters, while the three 3×3 convolutional layers would only contain parameters, thus reducing by half the number of parameters involved.
3. Experiments and Results
With reference to Figure 4, the first experiment conducted is devoted to the image pre-processing step evaluation. different models, whose name reflect the appearance of the sea (Azure, Blue-Gray, Dark Blue, Light Blue-Green and Gray) have been defined using Algorithm 1 using a small subset of images sampled from the dataset with the aim to avoid bias.
Table 1 shows the details of the five sea color sets that have been identified in the experiment. It is immediate to notice the variability of the data that reflects the need of defining multiple sea models. As pointed out before, these thresholds are highly dependent on the experimental setup used to capture the images as well as on the weather conditions during the acquisition campaigns. It is worth noting at this point that the choice of is a way of ensuring the convergence of the Algorithm 1 with respect to the dataset considered and to the supervised evaluation procedure described in the section Color models update. The fin color sets obtained are reported in Table 2 in terms of median values and median absolute distances of L, a and b coordinates. The corresponding boxplot, shown for each model in Figure 7, show a slight but clear difference in the appearance of the fin for the five models, with different ranges for the three components, especially the b one, that is largest in the case of . Moreover, the statistics highlight the presence of outliers for a and b components in all the models except for , that correspond to large polyhedra in the Lab space, as shown in Figure 8.

Table 1.
Sea color sets specification.
Table 2.
Fin color sets specification.
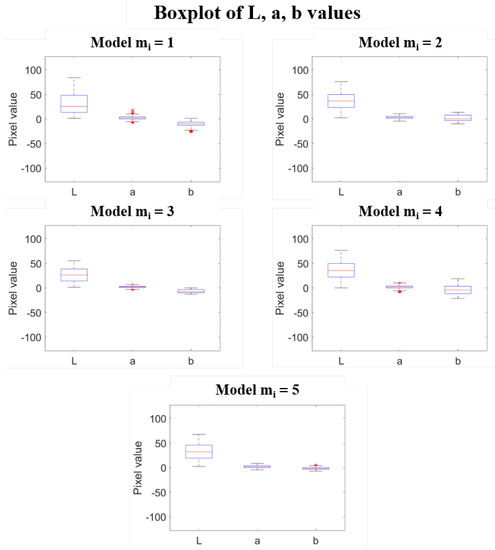
Figure 7.
Boxplot of L, a and b values used to define the 3D polyhedra for each model.

Figure 8.
3D plot of the five polyhedra in the Lab color space defined in this work. Different sea colors are used to represent each polyhedron.
The difference in the shapes of the polyhedra suggests how the color semantic ambiguity affects the solution.
Figure 9 reports a qualitative comparison of the proposed approach with respect to the well known Otsu’s based segmentation of background and foreground, where it is straightforward to notice that the the 3D polyhedron based segmentation clearly outperforms the Otsu’s based one. A more detailed comparison of the two methods is given. The Otsu’s based approach works as follows: given an image I and two thresholds maximizing inter-class variance on the histograms of the channels L and b, the segmented image is computed filtering out the pixels of I at position
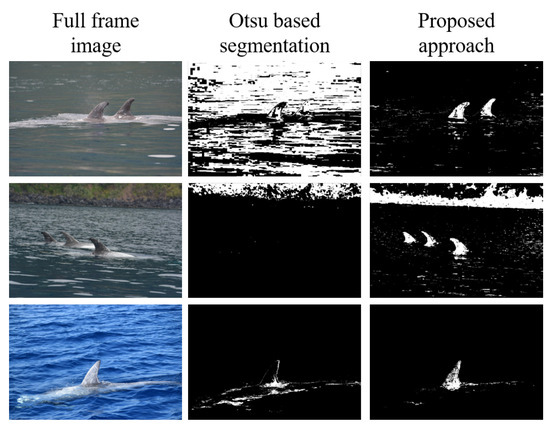
Figure 9.
Qualitative comparison of the proposed segmentation approach with the Otsu based segmentation.
Otsu’s segmentation was successfully applied to segment the dorsal fin from the sea in [17]. However, the results of applying this technique on a small subset of the dataset shown that more than 50% of images have been discarded, thus making unfeasible the automatic crop. This is due to the fact that the two binary thresholds on L and b channels are not enough to fulfill the requirement of clearly identify the region of interest that depicts a dorsal fin. Figure 10 shows examples of unusable images obtained with Otsu’s algorithm.
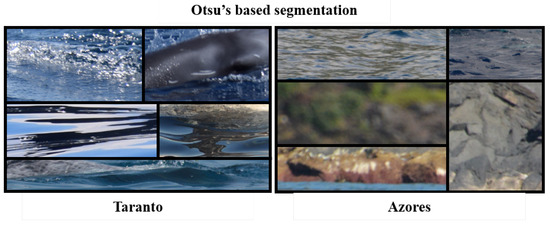
Figure 10.
Examples of cropped images returned by the Otsu’s algorithm on the Taranto dataset (on the left) and the Azores one (on the right).
To overcome this issue, the proposed 3D polyhedron-based color segmentation is based on the creation of fine-tuned models. The Otsu’s based method, instead, has neither models nor parameters to tune and its effectiveness is limited by a more restrictive hypothesis related to color semantics: for any image I the histograms of L and b channels are assumed to show a bimodal distribution that can be exploited to effectively segment the sea and the fin. For this reason, the methodology proposed in this paper can achieve good generalization being able to overcome the color semantic ambiguity, whilst Otsu’s segmentation can be effectively used only for a specific subset of the images.
Experiment number 2 is focused on the CNN training and validation that has been performed using the first part of the dataset, i.e., pictures taken in the Gulf of Taranto (Jonian Sea) between 2013 and 2018. Starting from the images, a total number of 15,228 crops have been identified, sub-divided in 4033 fin and 11195 no-fin, as shown in Figure 11. Data have been manually labeled and full frame images showing more than one fin have been used to produce multiple cropped fins.
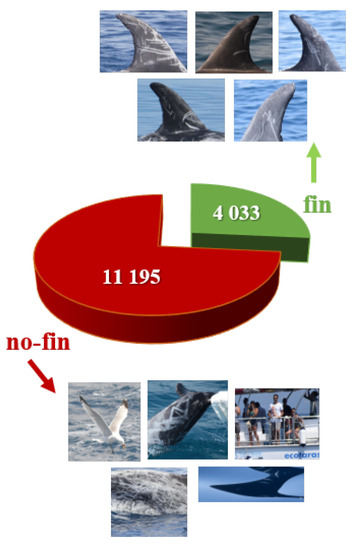
Figure 11.
CNN training data along with examples of input images belonging to the two categories fin and no-fin.
A total of 80% of the data has been used as training set, whilst the remaining 20% as validation set. Data in the training set have been augmented following these rules: (a) randomly rotating an image of an angle in the range degrees; (b) randomly translating the input image of p pixels in the range pixels; (c) randomly applying an horizontal flip, with the aim of increasing the number of samples as well as virtually balance the two classes. The CNN has been trained using the Stochastic Gradient Descent with Momentum method, with minibatch dimension of 20, number of epochs 30 and initial learning rate of 0.0003. Moreover, the model has been trained five times to implement a k-fold cross validation strategy. The CNN training took about 3 h and 20 min for a single network on workstation equipped with a Intel Core i5-6400T CPU operating at 2.20 GHz, 8 GB RAM and Nvidia GeForce 930M with 2 GB memory as graphics card, confirming the capability of the proposed model to be trained without the need of using extremely powerful hardware. The quantitative results of this experiment are reported in Table 3 as the mean value of the three metrics achieved by the five CNNs. The metrics are evaluated per fins.
Table 3.
CNN results for experiment number 2 in terms of Accuracy, Sensitivity and Specificity. The metrics are evaluated on the Taranto dataset, averaging the scores obtained by the 5 CNNs (trained for the k-fold cross validation strategy) on the 20% portion of the dataset left for the validation.
The last experiment has been designed to further validate the performance of the CNN classifier using a total number of 20,888 crops processed starting from the pictures taken near Azores islands (Atlantic Ocean) during 2018. The aim of this experiment is to understand the generalization capabilities of the CNN developed in this work. For this reason, we have computed the Perception based Image Quality Evaluator (PIQE) index [59] on the validation dataset in order to give an overview of the variability of the images with an objective score reference. Figure 12 shows the boxplot of the PIQE scores computed on the validation dataset. The scores vary in the range 11.6928–89.5572, with a median value of 42.3608. The box (first and third quartile) ranges from 35.5100 to 50.2020. According to the quality scale associated to the PIQE, the images have a median fair quality and range from excellent to bad. The quantitative scores of the CNN in terms of Accuracy, Sensitivity and Specificity are reported in Table 4, where the score decrease is clear, if compared to the previous experiment, but even acceptable as it demonstrates the generalization capability of the CNN. A remark should be given on how we decided if an input crop was actually a fin or a no-fin image. In fact, we trained 5 different CNNs for cross validation purposes, and we queried them with the following strategy: the prediction is considered robust if four CNNs out of five give the same output. This approach guarantees more robustness in the evaluation of the metrics. The decrease is expected since the test set contains lots of images with completely new shooting conditions (due to different experimental setup, geographical area) with respect to the dataset used to train and validate the classifier.
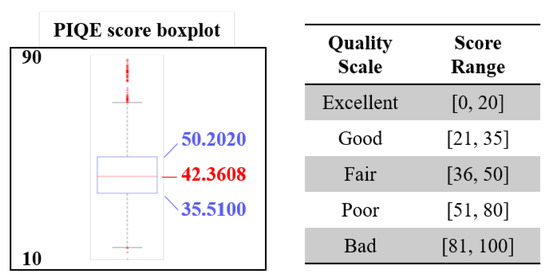
Figure 12.
Perception based Image Quality Evaluator (PIQE) score boxplot (lower is better) computed on the Azores validation dataset. The quality of the cropped images that are used to validate the CNN proposed in this work range from 11.6928 (excellent) to 89.5572 (bad). The median value is shown in red 42.3608 (fair).
Table 4.
CNN results for experiment number 3 in terms of Accuracy, Sensitivity and Specificity. The metrics are evaluated on the Azores dataset (never shown during the training). The predictions have been robustly computed considering that an unknown image is classified as fin or no-fin only if 4 CNNs out of 5 give the same output.
4. Conclusions and Future Works
In this paper, an approach for the automated image crop of cetaceans dorsal fins in huge datasets has been presented. The methodology is defined as a deep hybrid model because it is inspired by region proposal networks but with the main characteristic of clearly splitting the region proposal task (pre-processing) from the classification task demanded to a CNN. The main advantages of this approach are the flexibility in introducing domain knowledge in the processing pipeline (i.e., the definition of the color clusters for a specific dataset) coupled with a lightweight deep learning model trainable and deployable on general purpose workstations. In fact, scaling the problem to a binary classification task enables a drastic reduction of the trained model parameters, enabling its widespread applicability and adaptability to multiple operative settings, even without expensive and high-performance hardware. Experiments on a high number of images acquired in a real context demonstrate the high capabilities of the proposed approach towards the automated photo-identification of individuals on a large scale. The algorithms presented and discussed are part of a more complex and ambitious photo-identification process that involves scientists with different backgrounds and expertise. Finally, a positive consequence of the approach described in this paper is the effective automation of the CNN training, because the cropped images are automatically extracted from a dataset independently from the number of images involved. This is a not negligible feature that must be taken into account for effectively enabling large scale studies. The future direction of this research will regard the test of the deep hybrid approach to other dataset acquired by different operators (even professionals or not) in different operating conditions, with the aim of understanding if and when a new training of the CNN will be needed.
Author Contributions
Conceptualization, V.R. and R.M.; methodology, V.R. and R.M.; software, G.L. and F.F.; formal analysis, G.L. and F.F.; resources, C.F., K.H. and R.C.; writing—original draft preparation, all the authors contributed; writing—review and editing, all the authors contributed; All authors have read and agreed to the published version of the manuscript.
Funding
This research received no external funding.
Acknowledgments
The authors would like to thank the author of [60], whose work has been useful to plot the CNN in Figure 6.
Conflicts of Interest
The authors declare no conflict of interest.
References
- Carlucci, R.; Fanizza, C.; Cipriano, G.; Paoli, C.; Russo, T.; Vassallo, P. Modeling the spatial distribution of the striped dolphin (Stenella coeruleoalba) and common bottlenose dolphin (Tursiops truncatus) in the Gulf of Taranto (Northern Ionian Sea, Central-eastern Mediterranean Sea). Ecol. Indicat. 2016, 69, 707–721. [Google Scholar] [CrossRef]
- Carlucci, R.; Cipriano, G.; Paoli, C.; Ricci, P.; Fanizza, C.; Capezzuto, F.; Vassallo, P. Random Forest population modelling of striped and common-bottlenose dolphins in the Gulf of Taranto (Northern Ionian Sea, Central-eastern Mediterranean Sea). Estuarine Coastal Shelf Sci. 2018, 204, 177–192. [Google Scholar] [CrossRef]
- Carlucci, R.; Ricci, P.; Cipriano, G.; Fanizza, C. Abundance, activity and critical habitat of the striped dolphin Stenella coeruleoalba in the Gulf of Taranto (Northern Ionian Sea, Central Mediterranean Sea). Aquatic Conserv. Mar. Freshw. Ecosyst. 2018, 28, 324–336. [Google Scholar] [CrossRef]
- Carlucci, R.; Bandelj, V.; Ricci, P.; Capezzuto, F.; Sion, L.; Maiorano, P.; Tursi, A.; Solidoro, C.; Libralato, S. Exploring spatio-temporal changes in the demersal and benthopelagic assemblages of the north-western Ionian Sea (central Mediterranean Sea). Mar. Ecol. Progress Ser. 2018, 598, 1–19. [Google Scholar] [CrossRef]
- Ciccarese, S.; Carlucci, R.; Ciani, E.; Corcella, E.; Cosentino, A.; Fanizza, C.; Linguiti, G.; Antonacci, R. Cytochrome b marker reveals an independent lineage of Stenella coeruleoalba in the Gulf of Taranto. PLoS ONE 2019, 14, e0213826. [Google Scholar] [CrossRef] [PubMed]
- Ricci, P.; Libralato, S.; Capezzuto, F.; D’Onghia, G.; Maiorano, P.; Sion, L.; Tursi, A.; Solidoro, C.; Carlucci, R. Ecosystem functioning of two marine food webs in the North-Western Ionian Sea (Central Mediterranean Sea). Ecol. Evol. 2019, 9, 10198–10212. [Google Scholar] [CrossRef]
- Carlucci, R.; Baş, A.A.; Liebig, P.; Renò, V.; Santacesaria, F.C.; Bellomo, S.; Fanizza, C.; Maglietta, R.; Cipriano, G. Residency patterns and site fidelity of Grampus griseus (Cuvier, 1812) in the Gulf of Taranto (Northern Ionian Sea, Central-Eastern Mediterranean Sea). Mammal Res. 2020, 1–11. [Google Scholar] [CrossRef]
- Azzolin, M.; Arcangeli, A.; Cipriano, G.; Crosti, R.; Maglietta, R.; Pietroluongo, G.; Saintingan, S.; Zampollo, A.; Fanizza, C.; Carlucci, R. Spatial distribution modelling of striped dolphin (Stenella coeruleoalba) at different geographical scales within the EU Adriatic and Ionian Sea Region, central-eastern Mediterranean Sea. Aquatic Conserv. Mar. Freshw. Ecosyst. 2020. [Google Scholar] [CrossRef]
- Azzellino, A.; Fossi, M.C.; Gaspari, S.; Lanfredi, C.; Lauriano, G.; Marsili, L.; Panigada, S.; Podesta, M. An index based on the biodiversity of cetacean species to assess the environmental status of marine ecosystems. Mar. Environ. Res. 2014, 100, 94–111. [Google Scholar] [CrossRef]
- Pace, D.; Tizzi, R.; Mussi, B. Cetaceans value and conservation in the Mediterranean Sea. J. Biodiv. Endang. Spec. 2015, 2015. [Google Scholar] [CrossRef]
- Arcangeli, A.; Campana, I.; Bologna, M.A. Influence of seasonality on cetacean diversity, abundance, distribution and habitat use in the western Mediterranean Sea: Implications for conservation. Aquatic Conserv. Mar. Freshw. Ecosyst. 2017, 27, 995–1010. [Google Scholar] [CrossRef]
- Nowacek, D.P.; Christiansen, F.; Bejder, L.; Goldbogen, J.A.; Friedlaender, A.S. Studying cetacean behaviour: New technological approaches and conservation applications. Anim. Behav. 2016, 120, 235–244. [Google Scholar] [CrossRef]
- Baş, A.A.; Öztürk, B.; Öztürk, A.A. Encounter rate, residency pattern and site fidelity of bottlenose dolphins (Tursiops truncatus) within the Istanbul Strait, Turkey. J. Mar. Biol. Assoc. UK 2019, 99, 1009–1016. [Google Scholar]
- Hartman, K.L.; Wittich, A.; Cai, J.J.; van der Meulen, F.H.; Azevedo, J.M. Estimating the age of Risso’s dolphins (Grampus griseus) based on skin appearance. J. Mammal. 2016, 97, 490–502. [Google Scholar] [CrossRef]
- Hartman, K.L. Risso’s Dolphin: Grampus griseus. In Encyclopedia of Marine Mammals; Academic Press: Cambridge, MA, USA, 2018; pp. 824–827. [Google Scholar]
- Maglietta, R.; Renò, V.; Cipriano, G.; Fanizza, C.; Milella, A.; Stella, E.; Carlucci, R. DolFin: An innovative digital platform for studying Risso’s dolphins in the Northern Ionian Sea (North-eastern Central Mediterranean). Sci. Rep. 2018, 8, 17185. [Google Scholar] [CrossRef]
- Renò, V.; Dimauro, G.; Labate, G.; Stella, E.; Fanizza, C.; Cipriano, G.; Carlucci, R.; Maglietta, R. A SIFT-based software system for the photo-identification of the Risso’s dolphin. Ecol. Inform. 2019, 50, 95–101. [Google Scholar] [CrossRef]
- Maglietta, R.; Bruno, A.; Renò, V.; Dimauro, G.; Stella, E.; Fanizza, C.; Bellomo, S.; Cipriano, G.; Tursi, A.; Carlucci, R. The promise of machine learning in the Risso’s dolphin Grampus griseus photo-identification. In Proceedings of the 2018 IEEE International Workshop on Metrology for the Sea; Learning to Measure Sea Health Parameters (MetroSea), Bari, Italy, 8–10 October 2018; pp. 183–187. [Google Scholar] [CrossRef]
- Renò, V.; Dimauro, G.; Labate, G.; Stella, E.; Fanizza, C.; Capezzuto, F.; Cipriano, G.; Carlucci, R.; Maglietta, R. Exploiting species-distinctive visual cues towards the automated photo-identification of the Risso’s dolphin Grampus griseus. In Proceedings of the 2018 IEEE International Workshop on Metrology for the Sea; Learning to Measure Sea Health Parameters (MetroSea), Bari, Italy, 8–10 October 2018; pp. 125–128. [Google Scholar] [CrossRef]
- Van Tienhoven, A.; Den Hartog, J.; Reijns, R.; Peddemors, V. A computer-aided program for pattern-matching of natural marks on the spotted raggedtooth shark Carcharias taurus. J. Appl. Ecol. 2007, 44, 273–280. [Google Scholar] [CrossRef]
- Arzoumanian, Z.; Holmberg, J.; Norman, B. An astronomical pattern-matching algorithm for computer-aided identification of whale sharks Rhincodon typus. J. Appl. Ecol. 2005, 42, 999–1011. [Google Scholar] [CrossRef]
- Abdeldaim, A.M.; Houssein, E.H.; Hassanien, A.E. Color image segmentation of fishes with complex background in water. In Proceedings of the International Conference on Advanced Machine Learning Technologies and Applications (AMLTA 2018), Cairo, Egypt, 22–24 February 2018; pp. 634–643. [Google Scholar]
- Coleman, T.; Moon, J. A biometric for shark dorsal fins based on boundary descriptor matching. In Proceedings of the 32nd International Conference on Computer Applications in Industry and Engineering, San Diego, CA, USA, 30 September–2 October 2019; pp. 63–71. [Google Scholar]
- Gilman, A.; Hupman, K.; Stockin, K.A.; Pawley, M.D. Computer-assisted recognition of dolphin individuals using dorsal fin pigmentations. In Proceedings of the IEEE 2016 International Conference on Image and Vision Computing New Zealand (IVCNZ), Palmerston North, New Zealand, 21–22 November 2016; pp. 1–6. [Google Scholar]
- Carvajal-Gámez, B.E.; Trejo-Salazar, D.B.; Gendron, D.; Gallegos-Funes, F.J. Photo-id of blue whale by means of the dorsal fin using clustering algorithms and color local complexity estimation for mobile devices. EURASIP J. Image Video Process. 2017, 2017, 6. [Google Scholar] [CrossRef]
- Buehler, P.; Carroll, B.; Bhatia, A.; Gupta, V.; Lee, D.E. An automated program to find animals and crop photographs for individual recognition. Ecol. Inform. 2019, 50, 191–196. [Google Scholar] [CrossRef]
- Dimauro, G.; Caivano, D.; Bevilacqua, V.; Girardi, F.; Napoletano, V. VoxTester, software for digital evaluation of speech changes in Parkinson disease. In Proceedings of the 2016 IEEE International Symposium on Medical Measurements and Applications (MeMeA), Benevento, Italy, 15–18 May 2016; pp. 1–6. [Google Scholar] [CrossRef]
- Dimauro, G.; Caivano, D.; Girardi, F. A new method and a non-invasive device to estimate anemia based on digital images of the conjunctiva. IEEE Access 2018, 6, 46968–46975. [Google Scholar] [CrossRef]
- Dimauro, G.; Baldari, L.; Caivano, D.; Colucci, G.; Girardi, F. Automatic segmentation of relevant sections of the conjunctiva for non-invasive anemia detection. In Proceedings of the IEEE 2018 3rd International Conference on Smart and Sustainable Technologies (SpliTech), Split, Croatia, 26–29 June 2018; pp. 1–5, ISBN 978-953290083-5. [Google Scholar]
- Dimauro, G.; Girardi, F.; Gelardi, M.; Bevilacqua, V.; Caivano, D. Rhino-Cyt: A system for supporting the rhinologist in the analysis of nasal cytology. In Proceedings of the International Conference on Intelligent Computing (ICIC 2018), Wuhan, China, 15–18 August 2018; pp. 619–630. [Google Scholar]
- Dimauro, G.; Ciprandi, G.; Deperte, F.; Girardi, F.; Ladisa, E.; Latrofa, S.; Gelardi, M. Nasal cytology with deep learning techniques. Int. J. Med. Inform. 2019, 122, 13–19. [Google Scholar] [CrossRef] [PubMed]
- Ronneberger, O.; Fischer, P.; Brox, T. U-net: Convolutional networks for biomedical image segmentation. In Proceedings of the International Conference on Medical Image Computing And Computer-Assisted Intervention (MICCAI 2015), Munich, Germany, 5–9 October 2015; pp. 234–241. [Google Scholar]
- Nanni, L.; Lumini, A.; Ghidoni, S.; Maguolo, G. Stochastic Selection of Activation Layers for Convolutional Neural Networks. Sensors 2020, 20, 1626. [Google Scholar] [CrossRef] [PubMed]
- Weideman, H.J.; Jablons, Z.M.; Holmberg, J.; Flynn, K.; Calambokidis, J.; Tyson, R.B.; Allen, J.B.; Wells, R.S.; Hupman, K.; Urian, K.; et al. Integral curvature representation and matching algorithms for identification of dolphins and whales. In Proceedings of the IEEE International Conference on Computer Vision (ICCV), Venice, Italy, 22–29 October 2017; pp. 2831–2839. [Google Scholar]
- Mahmood, A.; Bennamoun, M.; An, S.; Sohel, F.; Boussaid, F.; Hovey, R.; Kendrick, G.; Fisher, R.B. Deep learning for coral classification. In Handbook of Neural Computation; Academic Press: Cambridge, MA, USA, 2017; pp. 383–401. [Google Scholar]
- Lumini, A.; Nanni, L.; Maguolo, G. Deep learning for plankton and coral classification. Appl. Comput. Inform. 2019, in press. [Google Scholar] [CrossRef]
- Bouma, S.; Pawley, M.D.; Hupman, K.; Gilman, A. Individual common dolphin identification via metric embedding learning. In Proceedings of the 2018 International Conference on Image and Vision Computing New Zealand (IVCNZ), Auckland, New Zealand, 19–21 November 2018; pp. 1–6. [Google Scholar]
- Pollicelli, D.; Coscarella, M.; Delrieux, C. RoI detection and segmentation algorithms for marine mammals photo-identification. Ecol. Inform. 2020, 56, 101038. [Google Scholar] [CrossRef]
- Renò, V.; Fanizza, C.; Dimauro, G.; Telesca, V.; Dibari, P.; Gala, G.; Mosca, N.; Cipriano, G.; Carlucci, R.; Maglietta, R. Predictive models for abundance estimation and distribution maps of the striped dolphin Stenella coeruleoalba and the bottlenose dolphin Tursiops truncatus in the Northern Ionian Sea (North-eastern Central Mediterranean). In Multimodal Sensing: Technologies and Applications. International Society for Optics and Photonics; SPIE Optical Metrology: Munich, Germany, 2019; Volume 11059, p. 1105917. [Google Scholar]
- Maglietta, R.; Renò, V.; Caccioppoli, R.; Seller, E.; Bellomo, S.; Santacesaria, F.C.; Colella, R.; Cipriano, G.; Stella, E.; Hartman, K.; et al. Convolutional Neural Networks for Risso’s dolphins identification. IEEE Access 2020. [Google Scholar] [CrossRef]
- Capezzuto, F.; Carlucci, R.; Maiorano, P.; Sion, L.; Battista, D.; Giove, A.; Indennidate, A.; Tursi, A.; D’Onghia, G. The bathyal benthopelagic fauna in the north-western Ionian Sea: Structure, patterns and interactions. Chem. Ecol. 2010, 26, 199–217. [Google Scholar] [CrossRef]
- Harris, P.T.; Whiteway, T. Global distribution of large submarine canyons: Geomorphic differences between active and passive continental margins. Mar. Geol. 2011, 285, 69–86. [Google Scholar] [CrossRef]
- Senatore, T.; Pescatore, M.R. A comparison between a present-day (Taranto Gulf) and a Miocene (Irpinian Basin) foredeep of the Southern Apennines (Italy). Forel. Basins (Spec. Publ. 8 IAS) 2009, 36, 169. [Google Scholar]
- Rossi, S.; Gabbianelli, G. Geomorfologia del golfo di Taranto. Boll. Della Soc. Geol. Ital. 1978, 97, 423–437. [Google Scholar]
- Sellschopp, J.; Álvarez, A. Dense low-salinity outflow from the Adriatic Sea under mild (2001) and strong (1999) winter conditions. J. Geophys. Res. Oceans 2003, 108, PBE5-1. [Google Scholar] [CrossRef]
- Bakun, A.; Agostini, V.N. Seasonal patterns of wind-induced upwelling/downwelling in the Mediterranean Sea. Sci. Mar. 2001, 65, 243–257. [Google Scholar] [CrossRef]
- Milligan, T.G.; Cattaneo, A. Sediment dynamics in the western Adriatic Sea: From transport to stratigraphy. Cont. Shelf Res. 2007, 3, 287–295. [Google Scholar] [CrossRef]
- Matarrese, R.; Chiaradia, M.T.; Tijani, K.; Morea, A.; Carlucci, R. ‘Chlorophyll a’multi-temporal analysis in coastal waters with MODIS data. Ital. J. Remote Sens./Riv. Ital. Telerilev. 2011. [Google Scholar] [CrossRef]
- Carlucci, R.; Battista, D.; Capezzuto, F.; Serena, F.; Sion, L. Occurrence of the basking shark Cetorhinus maximus (Gunnerus, 1765) (Lamniformes: Cetorhinidae) in the central-eastern Mediterranean Sea. Ital. J. Zool. 2014, 81, 280–286. [Google Scholar] [CrossRef]
- Santos, R.S.; Hawkins, S.; Monteiro, L.R.; Alves, M.; Isidro, E.J. Marine research, resources and conservation in the Azores. Aquatic Conserv. Mar. Freshw. Ecosyst. 1995, 5, 311–354. [Google Scholar] [CrossRef]
- Johnson, J.; Stevens, I. A fine resolution model of the eastern North Atlantic between the Azores, the Canary Islands and the Gibraltar Strait. Deep Sea Res. Part I Oceanogr. Res. Papers 2000, 47, 875–899. [Google Scholar] [CrossRef]
- Morton, B.; Britton, J.; Frias Martins, A. Coastal Ecology Of the Azores; Sociedade Afonso Chaves: Ponta Delgada, Portugal, 1998. [Google Scholar]
- Hartman, K.L.; Fernandez, M.; Wittich, A.; Azevedo, J.M.N. Sex differences in residency patterns of Risso’s dolphins (Grampus griseus) in the Azores: Causes and management implications. Mar. Mammal Sci. 2015, 31, 1153–1167. [Google Scholar] [CrossRef]
- Hartman, K.L.; Fernandez, M.; Azevedo, J.M. Spatial segregation of calving and nursing Risso’s dolphins (Grampus griseus) in the Azores, and its conservation implications. Mar. Biol. 2014, 161, 1419–1428. [Google Scholar] [CrossRef]
- Buckland, S.T.; Anderson, D.R.; Burnham, K.P.; Laake, J.L.; Borchers, D.L.; Thomas, L. Introduction to Distance Sampling Estimating Abundance of Biological Populations; Oxford University Press: Oxford, UK, 2001. [Google Scholar]
- Hartman, K.L.; Visser, F.; Hendriks, A.J. Social structure of Risso’s dolphins (Grampus griseus) at the Azores: A stratified community based on highly associated social units. Can. J. Zool. 2008, 86, 294–306. [Google Scholar] [CrossRef]
- Renò, V.; Mosca, N.; Marani, R.; Nitti, M.; D’Orazio, T.; Stella, E. Convolutional neural networks based ball detection in tennis games. In Proceedings of the IEEE Conference on Computer Vision and Pattern Recognition Workshops, Salt Lake City, UT, USA, 18–22 June 2018; pp. 1758–1764. [Google Scholar] [CrossRef]
- Goodfellow, I.; Bengio, Y.; Courville, A. Deep Learning. Available online: http://www.deeplearningbook.org (accessed on 10 April 2020).
- Venkatanath, N.; Praneeth, D.; Bh, M.C.; Channappayya, S.S.; Medasani, S.S. Blind image quality evaluation using perception based features. In Proceedings of the IEEE 2015 Twenty First National Conference on Communications (NCC), Mumbai, India, 27 February–1 March 2015; pp. 1–6. [Google Scholar]
- Iqbal, H. HarisIqbal88/PlotNeuralNet v1.0.0. 2018. Available online: https://zenodo.org/record/2526396#.XrD0ciPdNPY (accessed on 10 April 2020).
© 2020 by the authors. Licensee MDPI, Basel, Switzerland. This article is an open access article distributed under the terms and conditions of the Creative Commons Attribution (CC BY) license (http://creativecommons.org/licenses/by/4.0/).