1. Introduction
The Internet of Things (IoT) represents a set of technologies which refer to the interconnection and data exchange between sensors and electronic devices. The IoT has a high impact on several aspects of every-day life and behavior of potential users. From the point of view of a private user, the most important effects of the IoT will be visible in both working and domestic fields, with assisted living, smart homes and offices, e-health and enhanced learning [
1]. Similarly, from the perspective of business users, the most apparent consequences will be equally visible in automation and industrial manufacturing, logistics, business process management and intelligent transportation of people [
1].
As regards the primary sector, thanks to these recent research progresses, it was found that the old farming methods are unable to meet the needs of social development [
2]. Consequently, an upgrade and transformation of the traditional agricultural techniques has been necessary. Agriculture 4.0 represents the coming agricultural revolution, which aims to improve and address the real needs of consumers and reengineer the value chain, using technological research [
3]. Thanks to this, modern farms and agricultural operations will work in a different way, primarily because of improvement in technology such as devices, sensors, machines and other sophisticated technologies, such as robots, which will let business be more profitable, efficient, safer and environmentally friendly. Agriculture 4.0 will no longer have to depend on applying water, fertilizers and pesticides across entire fields. On the contrary, farmers will use the minimum quantities or even completely remove them from the supply chain, thanks to the analysis of information collected by the use of technology [
3].
The greenhouse agriculture has become a major trend in the development of high-tech agriculture in the Agriculture 4.0 point of view. In particular, it needs to control the environmental factors for obtaining the optimum growth conditions for the crop and extend the production season to get the optimum yield [
2]. Artificial management, for detecting and controlling environment factors (i.e., air temperature, humidity, solar radiation, air velocity and CO
2 concentration), wastes lots of manpower and relatively large of monitoring error, which affect the growth of crops. Measurements of meteorological parameters are important for adjusting the environmental conditions and a computerized system is necessary for controlling greenhouse environment efficiently. In the modern greenhouses, several measurement points are required to trace down the local climate parameters in different parts of the big greenhouse to make the greenhouse automation system work properly. Cabling would make the measurement system expensive and vulnerable. Moreover, the cabled measurement points are difficult to relocate once they are installed. Thus, a wireless sensor network (WSN) consisting of small-size wireless sensor nodes is an attractive and cost-efficient solution to build the required measurement system. For providing suitable environment for the growth of crops, many systems were studied and developed by researchers worldwide. An embedded systems approach to monitor and control greenhouse systems has become quite important nowadays. Considering this approach, Rangan et al. proposed a system to measure the main greenhouse environmental parameters, and to send measured, processed, controlled and updated data to owner through Short Message Service (SMS) communication technology [
4]. Candido et al. described the development of an embedded real time system, based on hierarchical state machines extended with timing constraints, devoted to microclimate control in a complex greenhouse. This system is directed by parameters entered at configuration time through a user-friendly graphical interface, which depends on the use of Java technologies and on a specific methodology suited to the development of real time systems [
5]. Another system was developed such as a multi-platform application based on Android technology and using a wireless mesh network to monitor and control intensive agriculture [
6]. In order to overcome the possible disadvantages of wired and wireless constraints, such as complicated wiring, difficult maintenance and distance, to monitor and control the applications, Kumar implemented a system based on embedded systems where the threshold levels of the sensors are set manually with the help of push button keys or remotely via Global System for Mobile Communications (GSM) communication mode [
7]. Yuquan et al. proposed a master-slave distributed measurement and control system composed by personal computer, soil moisture measurement, temperature, humidity and CO
2 monitoring and control module, in which personal computer is taken as the host [
8]. Ahonen et al. developed a wireless sensor node for greenhouse monitoring by integrating a sensor platform with three commercial sensors capable to measure four climate variables, with the goal to collect data to evaluate the network reliability and its ability to detect the microclimate layers, which typically exist in the greenhouse between lower and upper flora [
9]. Pahuja et al. developed, using a WSN, an online microclimate monitoring and control system for greenhouses [
10]. Somov et al. presented an IoT system in a tomato greenhouse in Russia, based on WSN, cloud computing, and artificial intelligence. This system helps in monitoring and controlling of both plants and greenhouse conditions as well as predicting the growth rate of tomatoes [
11].
The study of the state of the art showed that in many WSNs the ZigBee technology that works on IEEE standard 802.15.4 is used. This technology, with its low cost, low power and long communication distance, is an efficient wireless communication device widely used in home-network. Qiu et al. designed an intelligent greenhouse environment monitoring system based on ZigBee and embedded technology, adopting the idea of intelligent home, achieving intelligent control for the greenhouse fans, lights and irrigation equipment [
2]. Dan et al. reported the design and implementation of an agriculture greenhouse environment monitoring system based on ZigBee technology, which was made up of front-end data acquisition, data processing, data transmission and data reception. In synthesis, processed data was send to the intermediate node through a wireless network, which aggregates all data and sends them to the computer through a serial port. In this way, there was the possibility to view, analyze and storage the data by the computer, in real time mode [
12]. Chen et al. proposed a system for greenhouse environmental monitoring based on WSN that works within the China-specific 780 MHz frequency band and fully complies with the IEEE802.15.4c standard (extension of ZigBee technology) [
13]. Li et al. presented a low-cost system for easy temperature control and modulation in this type of environment, with simple structure, convenient installation and using [
14]. Tsai et al. designed and reported a simple ZigBee-based sensor network for the campus greenhouse monitoring with mobile device. The system consists of three modules, a mesh structure network, data processing center, and mobile application program [
15].
In addition to the devices and the systems already described, there are other systems that used also commercial electronic platforms. As an example, Geng et al. developed a system, based on embedded system approach and using wireless sensors, which combines the Raspberry Pi and the Arduino chip, which was integrated into a mobile system for shorting the physical distance between the on-site data collection and the data processing backend, in order to improve the data transmission reliability [
16]. Vimal et al. developed a simple, low cost, Arduino based system to monitor the values of environmental parameters and that are continuously updated and controlled in order to achieve optimum plant growth and yield [
17].
Other important aspects could be measured in a greenhouse environment using electronic system based on embedded systems technology. As an example, the collection of accurate information concerning the spatial variability within fields are necessary for precision farming of so-called specialty crops. This variability is affected by a variety of factors, which can be measured using various types of sensing technologies. Lee et al. presented a review of these technologies and discussed how they are used for precision agriculture and crop management, especially for specialty crops [
18]. Another interesting aspect regards dew condensation on the leaf surface of greenhouse crops, that can promote diseases caused by fungus and bacteria, affecting the growth of the crops, Park et al. presented a WSN-based automatic monitoring system to prevent dew condensation in a greenhouse environment [
19].
In this paper, a prototype of a low-cost electronic platform for greenhouse environment monitoring has been designed, developed and built. The system is an Agriculture 4.0 perspective that has the aim to permit elaboration and sending data, collected by external sensors, to external devices as laptop, smartphone and internet gateway, and on-line databases. The prototype has been developed with the purpose of firmware and software prototyping, in order to make the most of device performances. Since from the state of the art there are available non-flexible works that respect their project requirements only for specific scenario [
4,
5,
6,
7,
8,
9,
10,
11,
12,
13,
14,
15,
16,
17,
18,
19], we have chosen a flexible modular approach, for the design of our prototype, in order to test the best solution case by case basis. The electronic board is composed by a Green House Core, a Wi-Fi Module, a RS485 Module, an Analog-to-Digital Converter Module and a USB Module, all hosted on a Main Board. The hardware has been developed in modular way with the goal to test several combinations with optimized dedicated firmware and software, based on the scenario where the device may be involved. For example, in certain applications there might be the necessity to have only Ethernet interface for connection with external devices, and the requirement to work with only digital sensors (RS485 module). Consequently, thanks to our modular prototype, it is possible to develop the best firmware and software solution considering only the modules involved in this particular scenario (GHC module and RS485 module), and to develop, at a later time, a compact board that includes only these chips. The same reasoning can be made for other modules based on application needs. Accordingly, starting from our electronic prototype that guarantees maximum flexibility in terms of applicable scenarios, it is possible to develop an integrated, compact and robust board that includes only desired modules.
We have chosen each component of our electronic platform in order to respect requirements considering low-cost solution. Since the electronic board is developed with the purpose of firmware and software prototyping, we have decided to implement a device with wired and wireless network interfaces. In particular, the installation of Ethernet and Wi-Fi module on the board permits to develop and study the best solution of firmware and software for wired and wireless connections, making the prototype useful for several scenarios. The collected data concern to main greenhouse environmental parameters, such as air temperature, humidity, solar radiation, air velocity and CO2 concentration. Thanks to the connectivity features of our board, these datasets are immediately available, for example, to the other IoT devices that could work in the greenhouse. In this way, the agricultural production process of the greenhouse could be executed by automation system that increases productivity by reducing the need for human workforce, guaranteeing a smart management of the greenhouse. On the other hand, we have implemented a Web application in order to allow also users a consultation of greenhouse environmental state, through a user-friendly graphical interface, in a simple and fast way.
2. Sensors Selection in Respect of Measurement Accuracy of Physical Parameters
We have developed our prototype with the aim to use it in a traditional naturally ventilated single-sloped greenhouse, considering the environmental conditions data collected by Hua et. al [
20] in a measurement campaign in order to validate their deterministic and stochastic model for estimation of greenhouse microclimate. In particular, in this kind of greenhouse there is a daily variation temperature in the range between 10 °C to 40 °C and a daily relative humidity (RH) from 10% to about 90%. As a matter of facts, our electronic platform has been designed to guarantee best performances in these environmental conditions. The board permits to collect a set of measurements of the main greenhouse environment parameters, with an accuracy reported in
Table 1, according to data collected by Hua et. al. On the basis of these specifications, for each physical parameter can be chosen a sensor for performing measurements, from the analysis of the state of art.
The choice of the air temperature sensor should be dictate by the necessity to have an overtime reliability maintaining a measurement accuracy of 0.1 °C. In the state of art, there are several air temperature sensors based on thermistor, such as resistance temperature detector (RTD), thermistor negative temperature coefficient (NTC) and thermistor positive temperature coefficient (PTC). Thermistors are generally produced using powdered metal oxides (i.e., platinum or nickel and copper). Regarding platinum thermistors, they are preferable thanks to the platinum high stability at high temperature range of greenhouse environment. In commerce there are two main components: Pt100 and Pt1000. The second one is characterized by a greater accuracy and it could be chosen for this application.
Humidity sensors can be found in a variety of applications with unique requirements [
21]. Their wide range use has resulted in numerous sensor designs that typically incorporate capacitive, resistive, gravimetric, or optical techniques [
22]. In particular, this type of sensors is classified as capacitive and resistive, from the electrical point of view. The firsts one are designed for measuring the RH and their behavior is characterized by measuring electrical permittivity variation of a dielectric material at the humidity variation. A capacitive humidity sensor is made up a capacitor where in its plates a dielectric material with a dielectric constant value, which varies with the humidity, is inserted. Whereas, the resistive humidity sensors are characterized by the principle that the conductivity in a non-metallic conductor material depends on the humidity (or, in other words, depends on water content of the material). The conventional sensing materials for resistive-type humidity sensors are mainly oxide ceramics and polymers [
23]. For this application, a unique device, which integrates a capacitive humidity sensor and a Pt100 temperature sensor, could be selected from the analysis of commercial components (its features are reported in [
24]).
The principal desired features of a solar radiation sensor are fast time response (typically less than 1 s) and wide wavelength spectrum (between 0.3 μm and 0.5 μm) [
25]. The sensor which could be selected for this application is a thermopile solar radiation sensor. This kind of devices uses a set of thermocouples for measuring the temperature difference between two different surfaces of the system. In this way, the sensor can perform linear measurements that respect project specifications. Many models are available in commerce, and one that respects specification of
Table 1 is described in [
26].
One of the most performant sensors for measuring air velocity is the 3D ultrasonic anemometer, which measures the U-V-W Cartesian components of the wind speed, the wind direction and the sonic temperature [
27]. A typical system is composed by five analog output channels with different voltages and currents. For the magnetic North orientation, the sensor could be equipped with a compass features magneto resistive sensor. Further details of one system present on the market are reported in [
28].
As concern CO
2 concentration sensors, one of the commercial devices that respects the measurement accuracy of
Table 1, is described in [
29]. It is a nondispersive infrared sensor (NDIR sensor), which consists of a simple spectroscopic sensor, nondispersive in the sense of optical dispersion since the infrared energy is allowed to pass through the atmospheric sampling chamber without deformation [
30].
3. Methods: Design and Development of the Electronic Board
The electronic board prototype, useful for monitoring greenhouse environment, has been designed and developed using Autodesk EAGLE software. Autodesk EAGLE is an electronic design automation (EDA) software, which allows to enabling printed circuit board (PCB) designers to seamlessly connect schematic diagrams, component placement, PCB routing, and comprehensive library content [
31].
The electronic board has the goal to acquire analog and digital data collected by external sensors, and sending them to electronic devices such as internet gateway and databases, laptop and smartphone. In particular, the board permits communication based on Wi-Fi, Ethernet, Universal Serial Bus (USB) interface, RS485, Serial Peripheral Interface (SPI), Universal Asynchronous Receiver-Transmitter (UART) and Inter Integrated Circuit (I2C). The system has been developed with the purpose of firmware and software prototyping. Considering this aspect, we have decided to implement a device with both Ethernet and Wi-Fi network interfaces. In this way, it is possible to develop and study the best solution of firmware and software for wired and wireless connections, according to user needs. On the other hand, thanks to both wired and wireless connections, the device has the possibility to work in several scenarios. As an example, the board could be connected to a wired network (with RS485 Ethernet connector) and it might provide a Wi-Fi connection to the sensors, working in hotspot mode; it could be connected directly to an available wireless network and it could generate a wired connection, working as a Wi-Fi-to-Ethernet adapter, maintaining a high versatility as concerns programming and employment of the sensors.
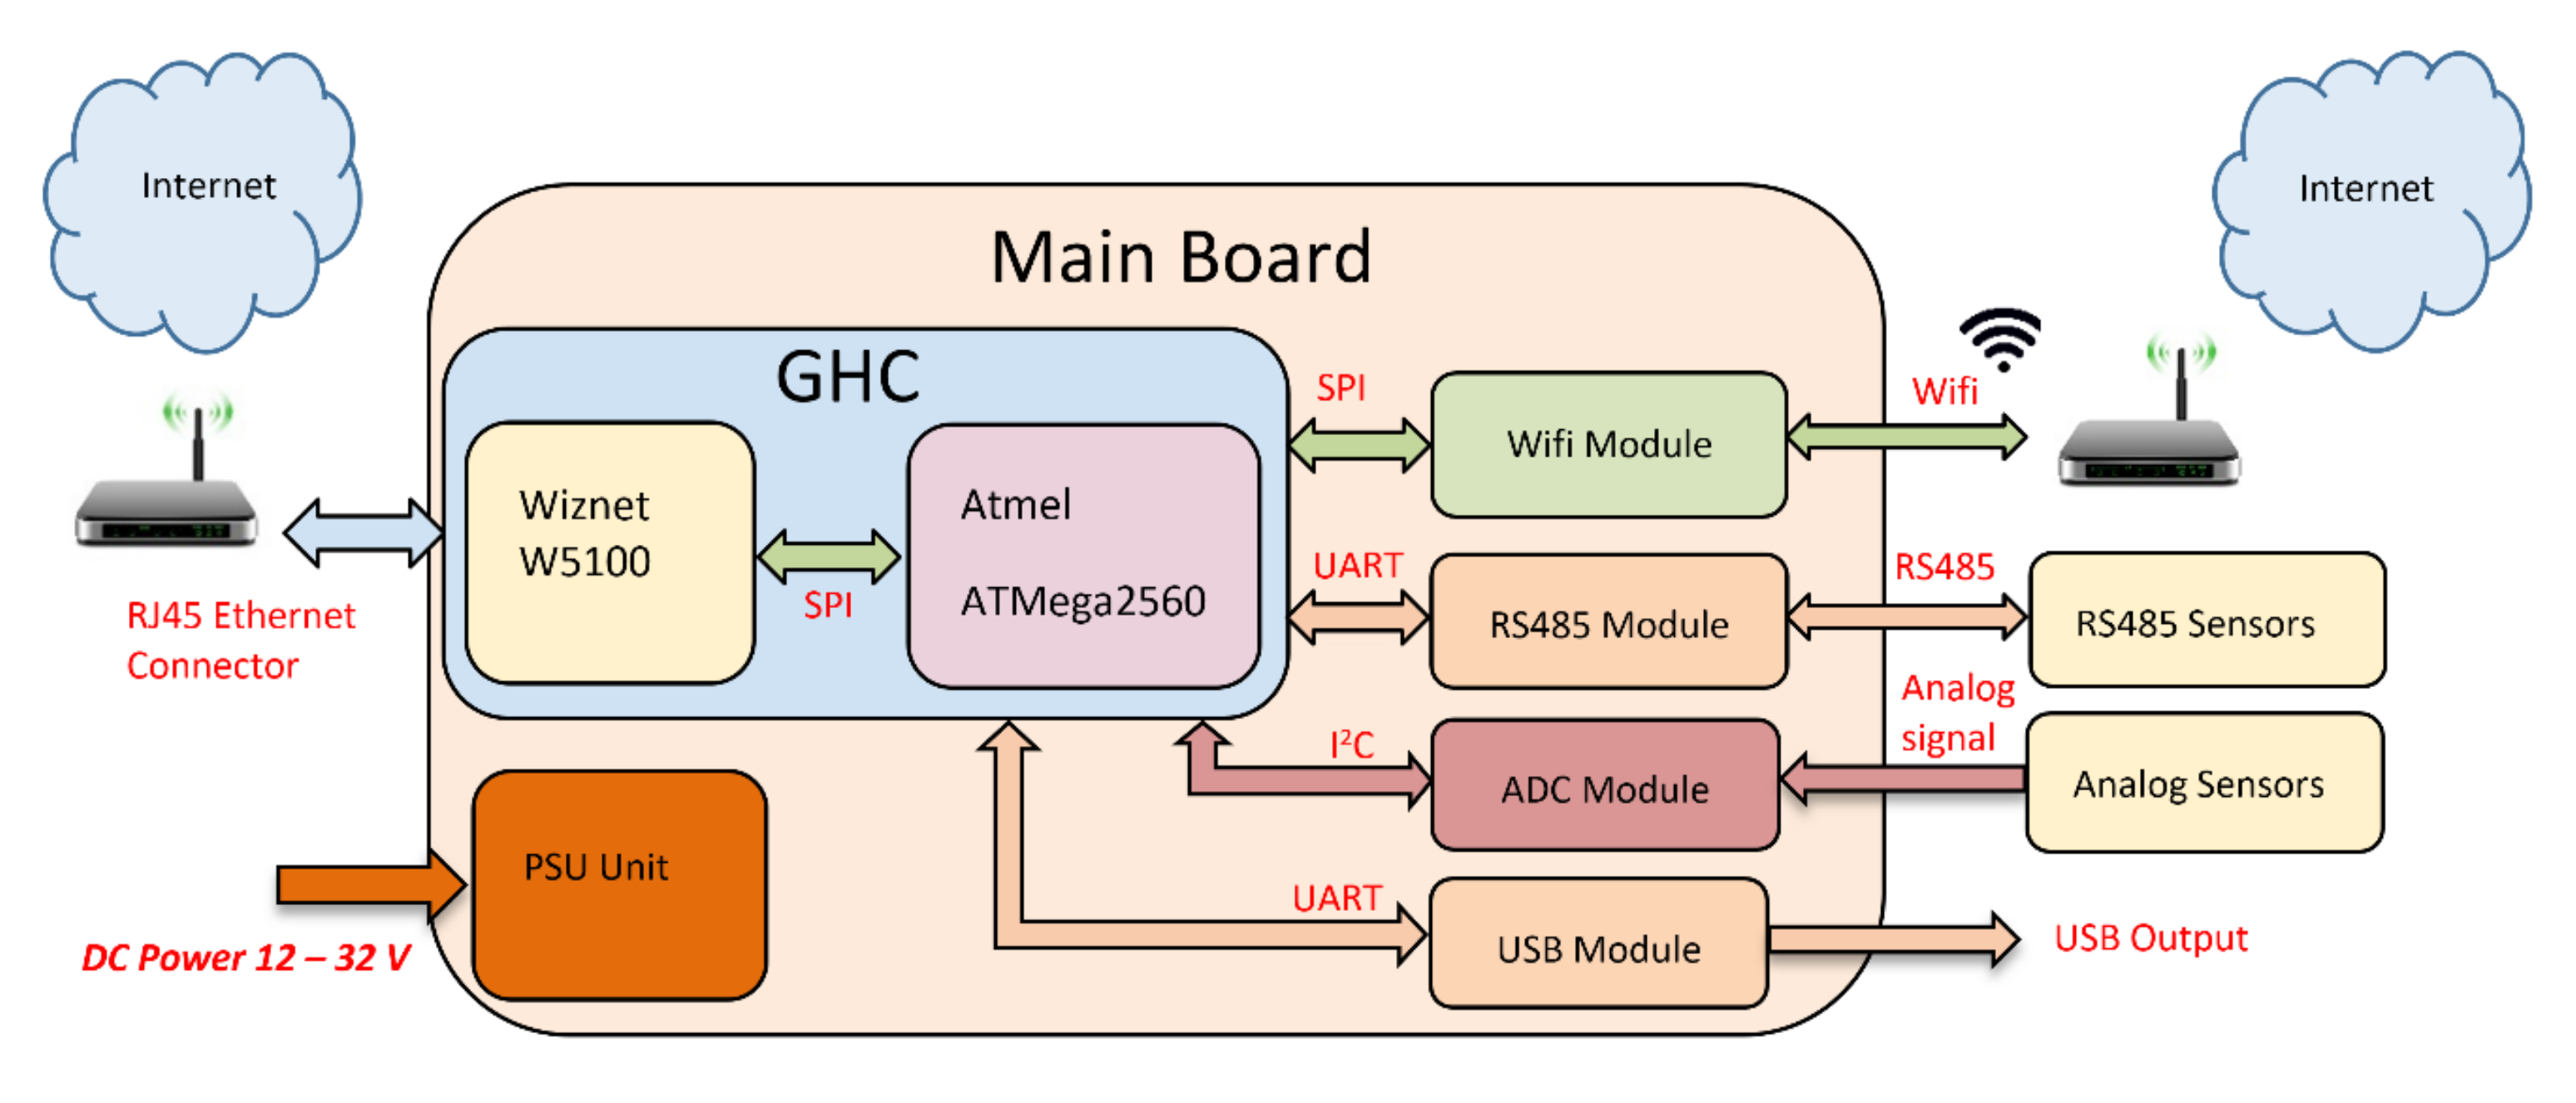
The designing of the board has been realized in modular approach to facilitate hardware and software prototyping. In particular, on the board are inserted all connectors useful for high prototyping performances, such as 2.54 mm connectors to facilitate connections of power supplies and communication buses of every sensor. In
Figure 1 is shown a general block diagram of the board, which is composed by the Green House Core (GHC), the Wi-Fi Module, the RS485 Module, the Analog-to-Digital Converter (ADC) Module and the USB Module, all hosted on the Main Board. Each component of our electronic board has been chosen in order to respect requirements considering low-cost solution.
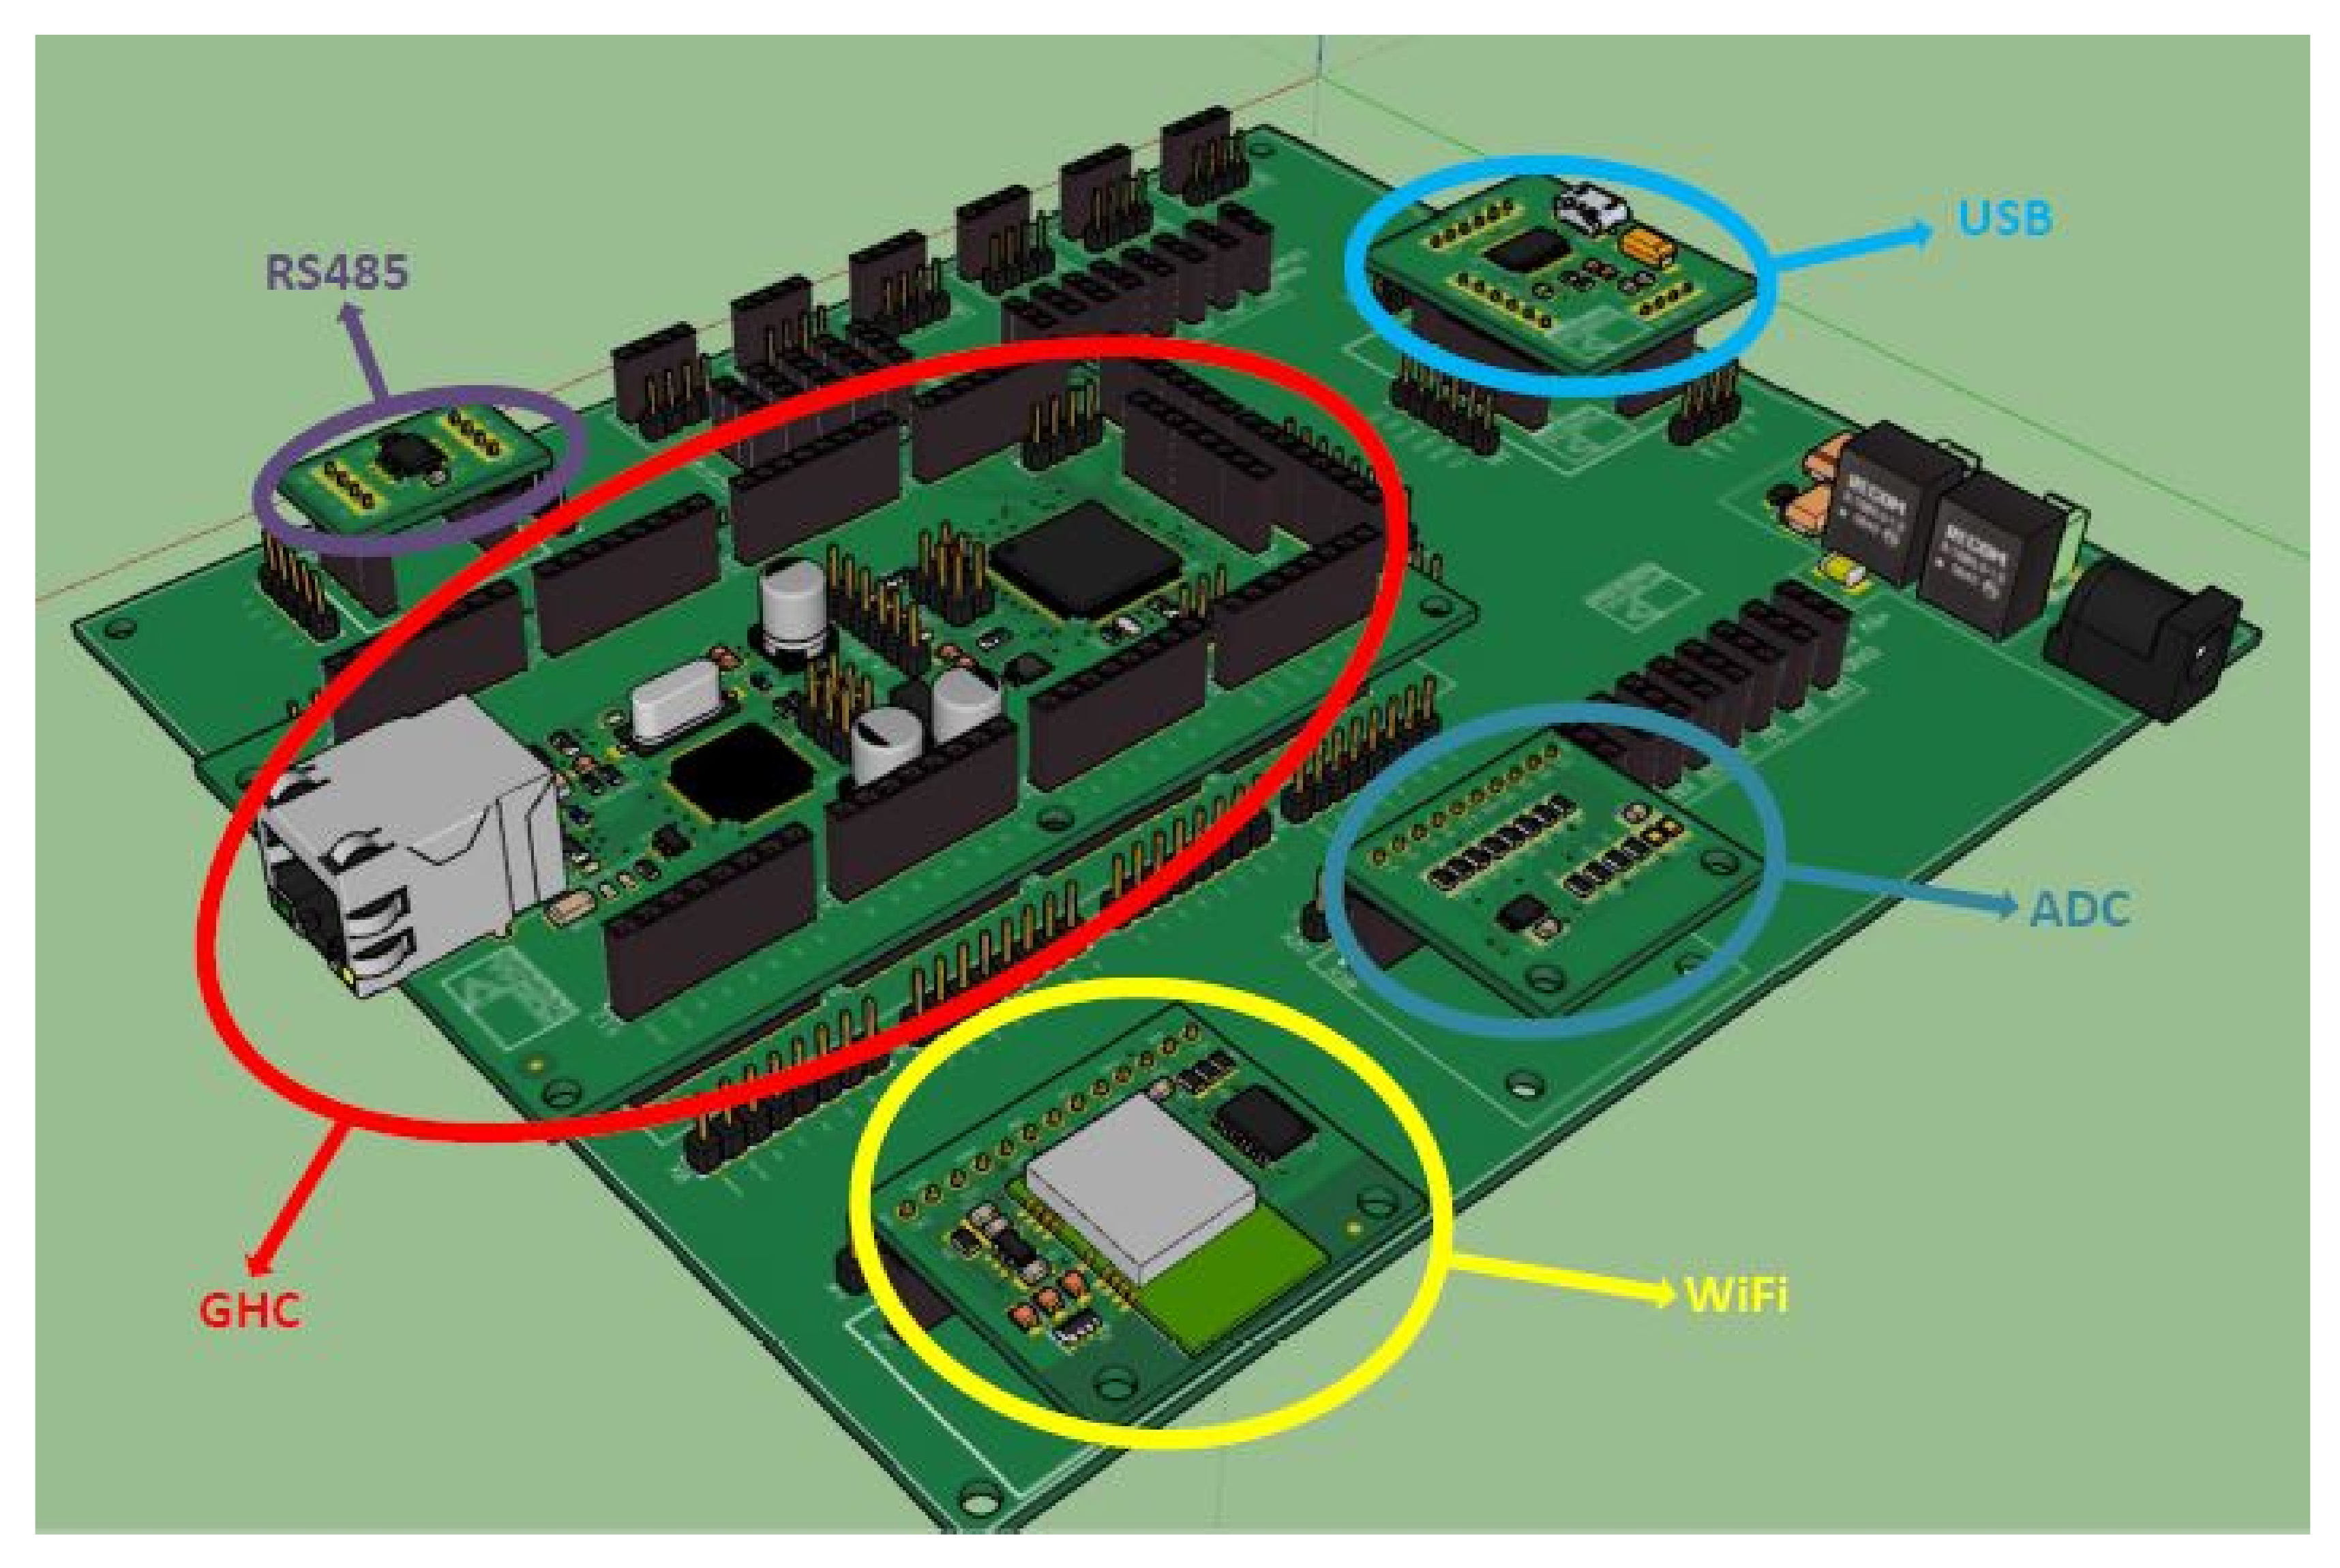
A 3D view of the board with its modules integrated in the Main Board, is shown in
Figure 2. Each module has been descripted in the following sub-sections.
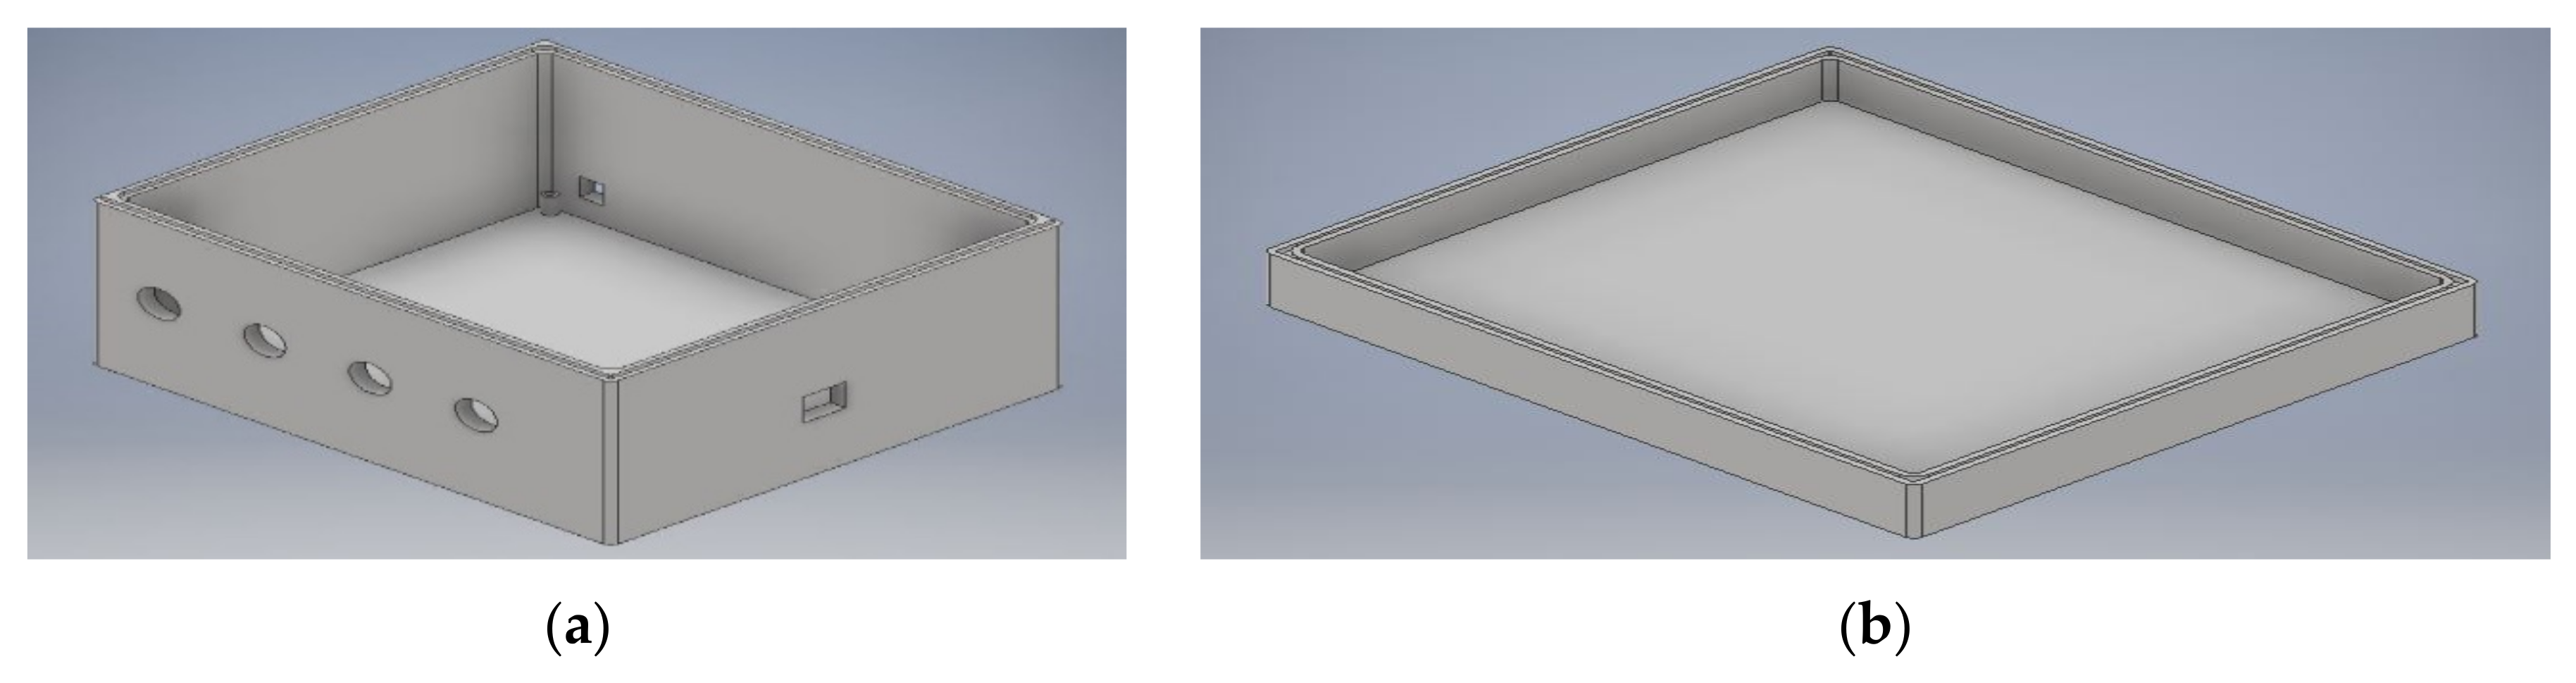
In order to allow on-site use, a dedicated box has been designed, using an appropriate CAD, to protect the board from environmental agents, such as weather conditions, fertilizer emission, intrusion, dust, accidental contact and water. For these reasons, the development of the box has respected the IEC standard 60529-IP56 [
32]. The box has six holes (one for power supply, one for Ethernet port and four for external sensors) in order to permits connections between board and sensors, power supply and internet gateway. For assembling the board on the box, four 5-mm diameter rounded turrets have been designed and positioned on each box angle. The box size is 172 × 192 × 110 millimeters.
Figure 3 shows a 3D view of the box.
3.1. Green House Core (GHC)
The Green House Core module contains the core of the board and consequently it permits to manage all modules intended to data acquisition and communication. In particular, 8-bit Atmel ATmega2560-16AU microcontroller (
Table 2) has been chosen [
33]. We have selected an 8-bit platform, instead of a more recent 32-bit platform, as well as for the economic aspect, for the following main reasons [
34,
35,
36]:
The majority of 8-bit devices are proposed in DIP packaging. This aspect makes them easy to plug into a breadboard and get starting with the prototype experiments, guaranteeing a fast and easy solution.
Most 8-bit devices run on 5 volts, as well as the ATmega2560-16AU microcontroller. 5-volt systems provide better noise immunity and the majority of industry standard modules use 5-volt logic levels, as you can see from most of selected chips of our board.
8-bit devices are robust and it results harder to damage an 8-bit device than a 32-bit device [
34].
The use of an 8-bit device guarantees a low and fast learning curve as concerns the firmware development [
34].
Many modern microcontrollers incorporate some hardware functions that serve to help the CPU operate as efficiently as possible, such as the Peripheral Event System, which allows peripherals to interact without intervention from the CPU. In the case of detecting a hardware event, it is important to first detect the event and then switch control to the desired interrupt service routine (ISR). In these situations, CPU speed isn’t the single determining factor. It is a question of how long, in terms of cycles, does it take to respond to the interrupt, run the ISR, and return. As shown in
Table 2 of [
35], 8-bit devices can be more efficient in handling hardware near actions. In fact, the average clock cycles employed in an 8-bit MCU are lower than 32-bit MCU (i.e., for detect interrupt, jump to interrupt vector, return from interrupt, etc.).
The ATmega2560-16AU microcontroller has a maximum clock frequency of 16 MHz and equipped with a 256-kB flash memory, an 8-kB Static Random Access Memory (SRAM) and a 4-kB Electrically Erasable Programmable Read-Only Memory (EEPROM). The microcontroller holds a 16-channel ADC with 10-bit resolution and several serial communication protocols.
The GHC module has been designed to set up the board for communication with SPI, I
2C and UART protocols. In addition, an Ethernet port, with a dedicated Ethernet controller designed for embedded applications, has been inserted in the project to guarantee a wired internet connection. As mentioned above, we have chosen each component of our electronic board with the aim to have a low-cost solution. In this way, we have supposed that in our greenhouse might not be a significant number of IP addresses and consequently we have opted for an IPv4 chip, which has more restrained cost and a lower curve learning than a more complex IPv6 chip. The selected Ethernet controller is the WIZnet W5100 model that supports many protocols, such as TCP, UDP, ICMP, IPv4 ARP, IGMP, PPPoE and Ethernet [
37]. A SPI serial bus connection has been implemented for communication between Atmel ATmega2560-16AU and WIZnet W5100 controllers (see
Figure 1).
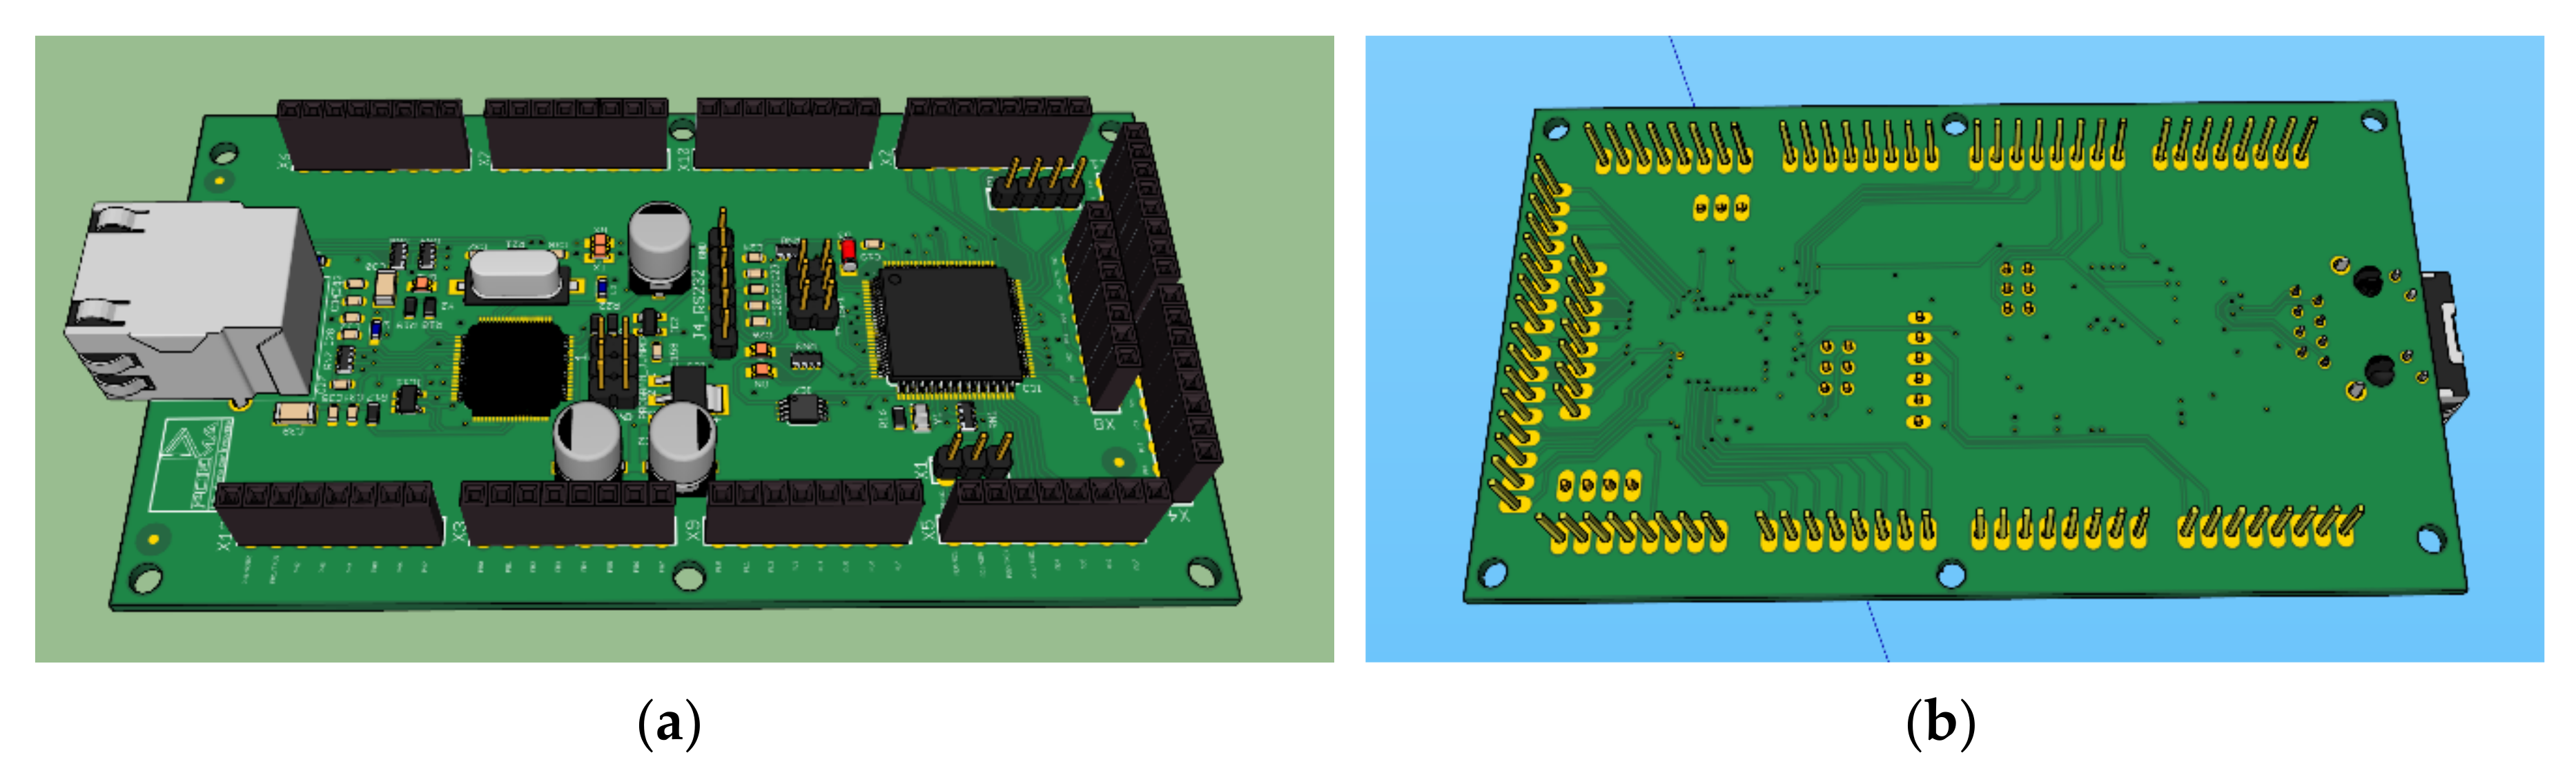
Figure 4 shows front side and back side of the GHC 3D model. As you may notice, in the project has been inserted five LEDs for a visual check of the board state. In particular, one for noticing ON state, one for seeing board working, one for Ethernet ON state and two for specifying transmission or reception in Ethernet communication.
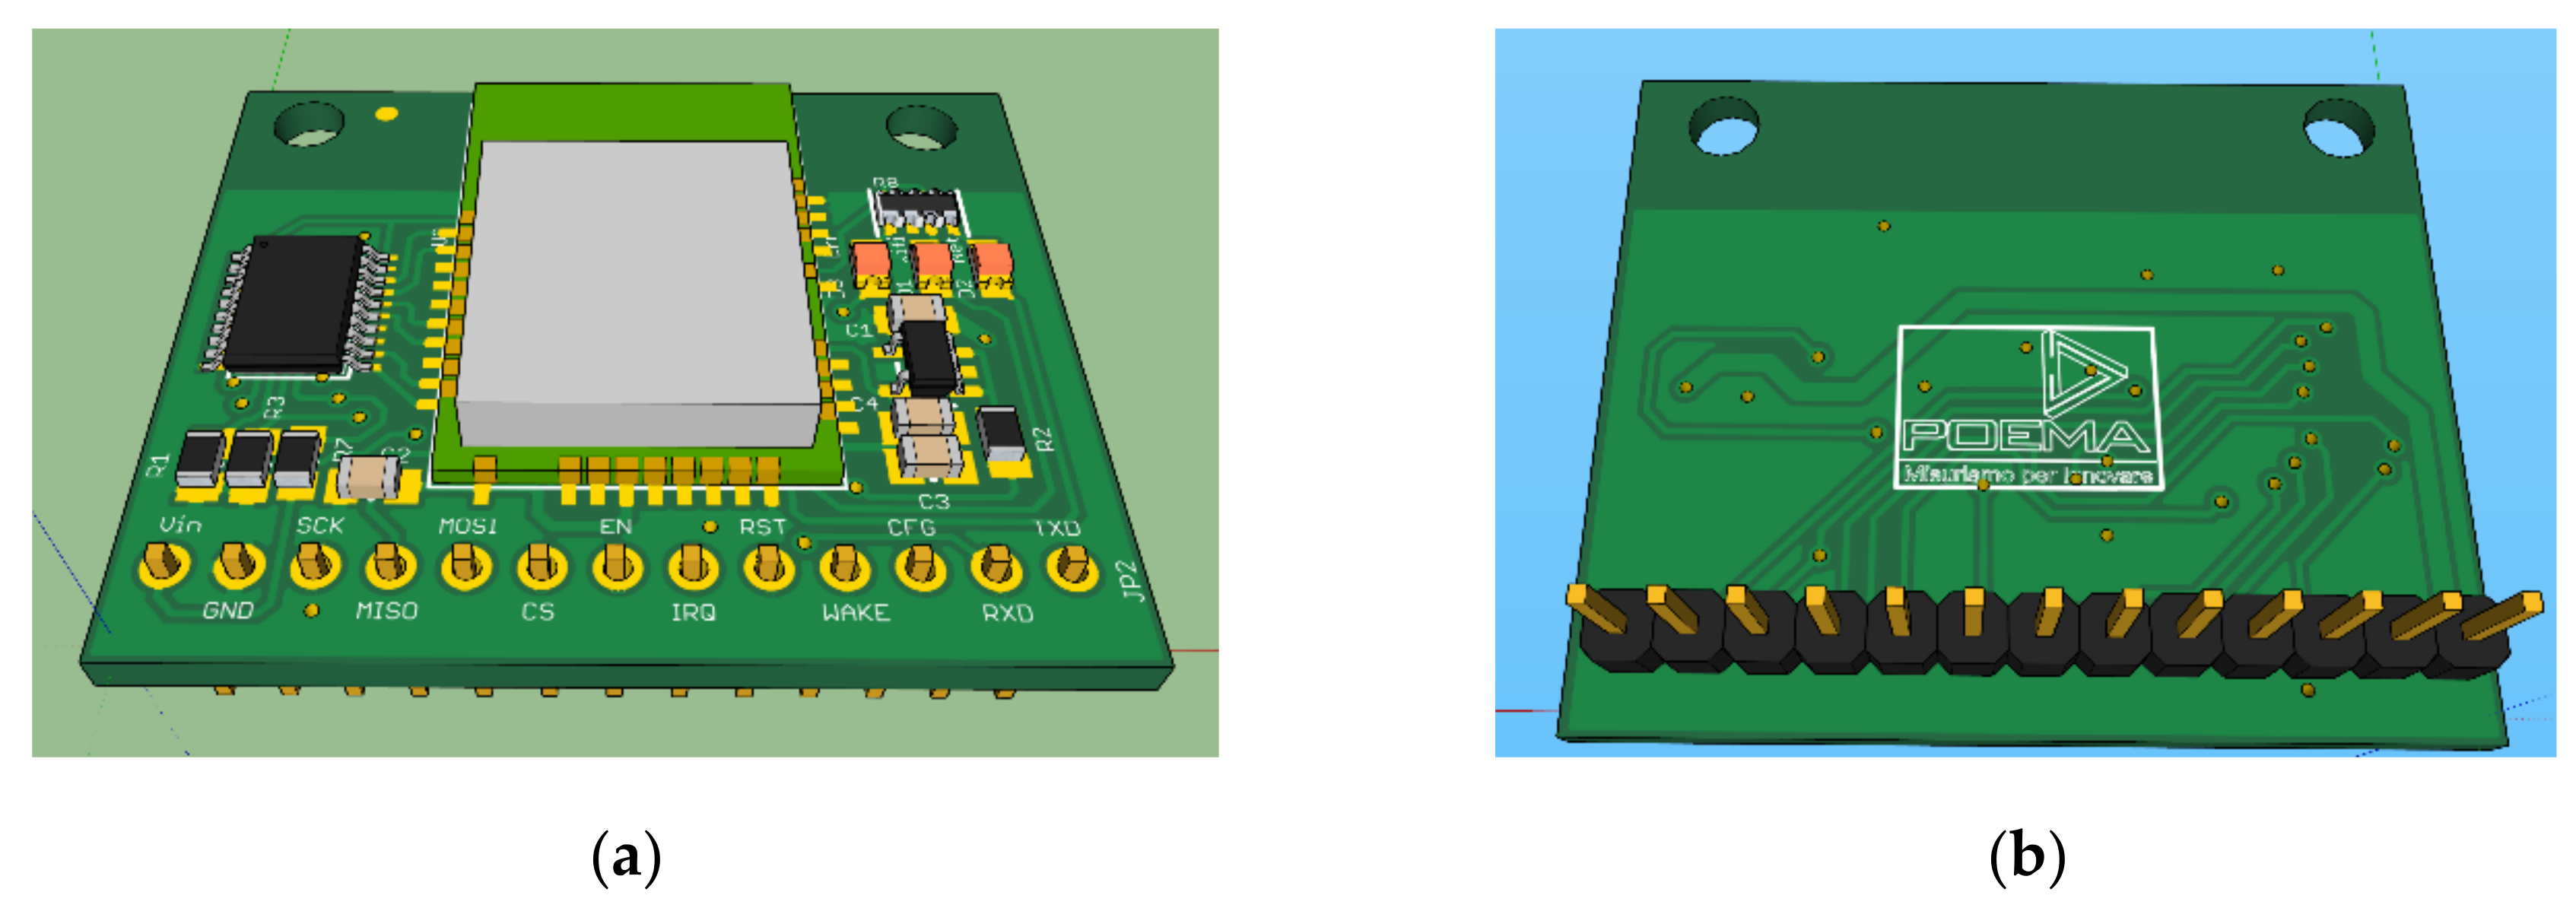
3.2. Wi-Fi Module
This module permits wireless communication between the GHC module and external devices, such as laptop, smartphone and internet gateway. The Wi-Fi chip used for the Wi-Fi module is the ATWINC1500-MR210PA model from Microchip Atmel [
38], an IoT chip that guarantees a low energy consumption. It is composed by a flash memory and a 2.4 GHz antenna (ISM band) for signal transmitting and receiving with a rate of 20 MHz. This chip is designed for communicating with SPI, UART and I
2C protocols. Main features of the module are listed in
Table 3.
Since the maximum voltage supply of this chip and also its communication signals have a voltage equal to 3.3 V, a voltage stabilizer and a level shifter have been used for adapting 5 V to desired voltage of 3.3 V. As well as the GHC module, three LEDs (i.e., red, yellow and green) have also been inserted in the Wi-Fi module, for noticing the state of the module during firmware testing and developing phase.
Figure 5 shows front side and back side of the 3D Wi-Fi module.
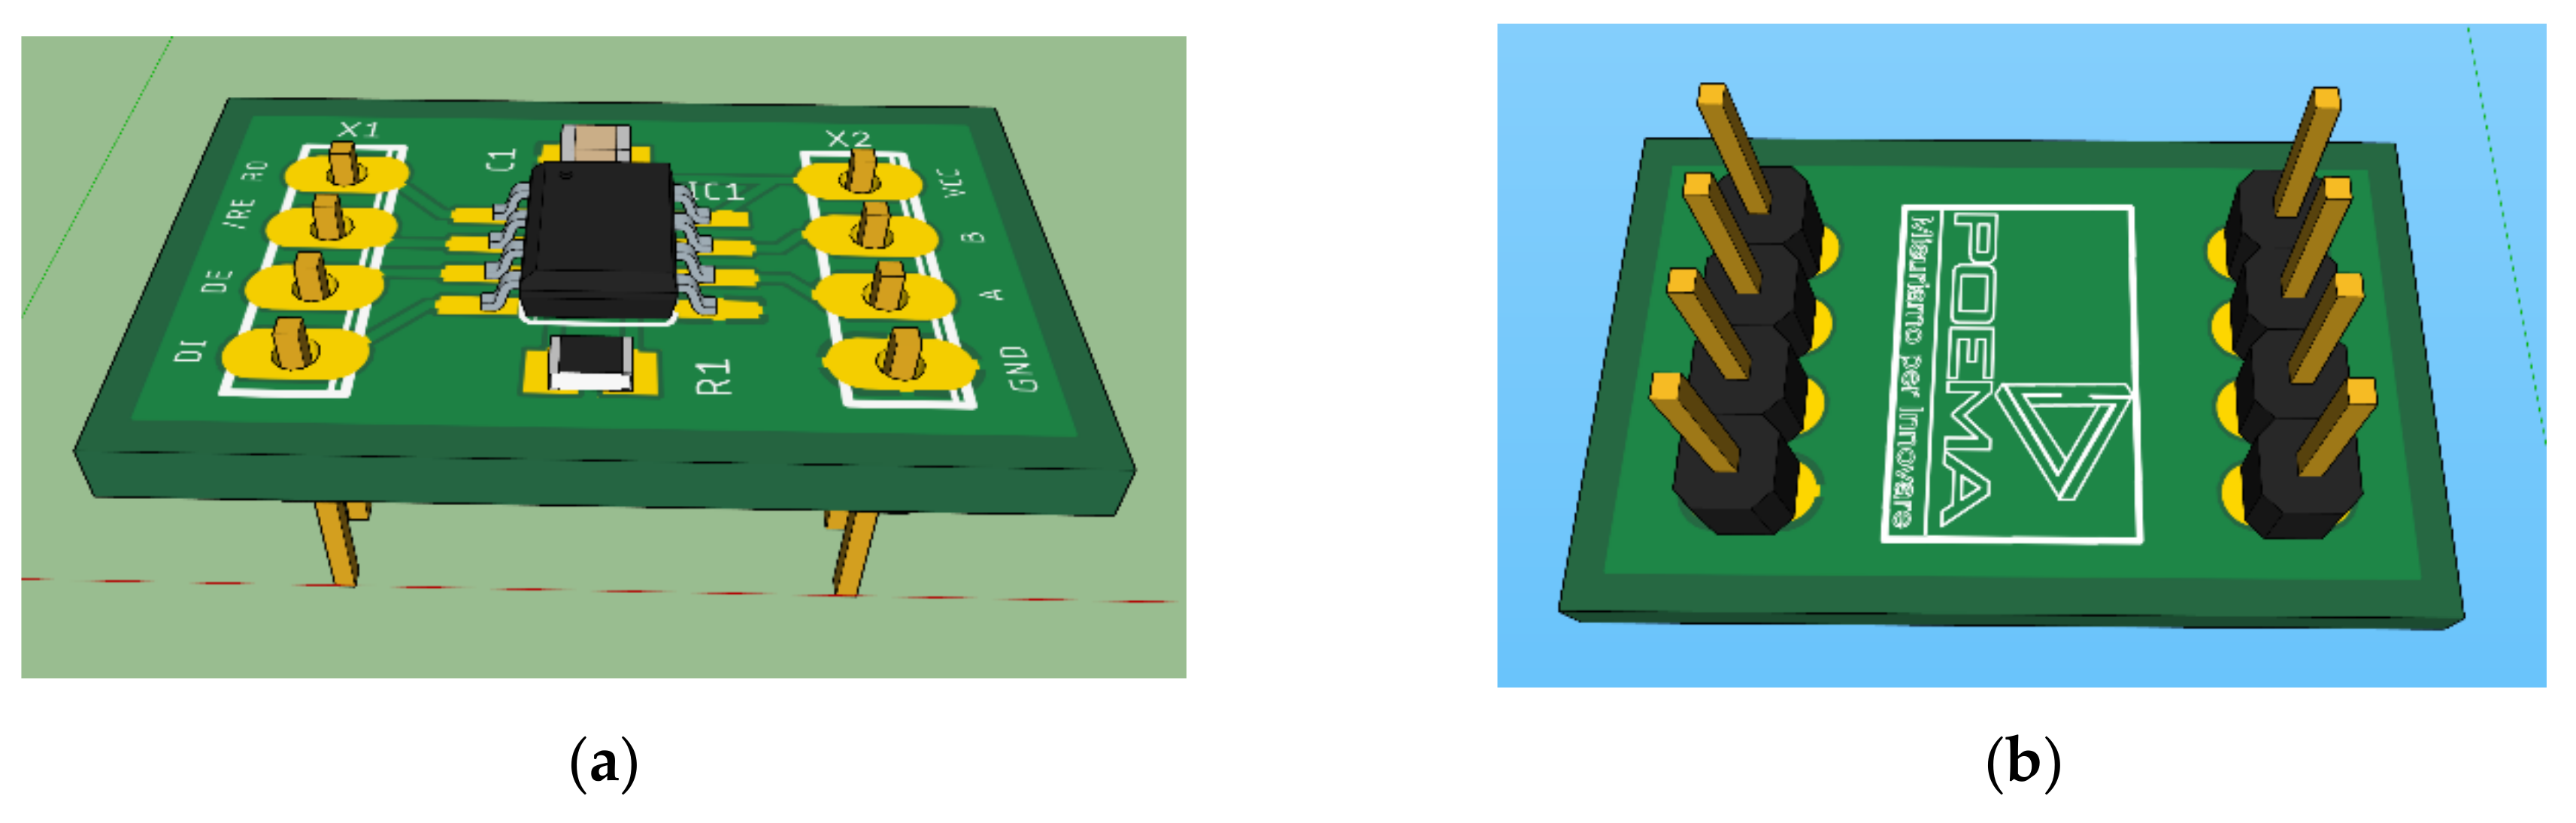
3.3. RS485 Module
The RS485 module permits to communicate with external sensors equipped with this output protocol and consequently acquire digital signals from them. Since many sensors are developed for working with both RS485 and RS422 protocols, in developing phase has been chosen the MAX3468CSA chip from Maxim Integrated [
39]. This allows a maximum data rate of 40 Mb/s and a signal delay less than 20 ns. Main characteristics of this chip are listed in
Table 4.
Figure 6 shows front side and back side of the 3D RS485 module.
3.4. ADC Module
The ADC module allows the conversion of analog signal, collected by external sensors, to digital signal, required for data processing by the board and subsequently routing to the database via the internet gateway (using Ethernet or Wi-Fi interface). In designing phase, we have selected the ADS1015 chip from Texas Instruments [
40], characterized by an internal voltage reference, a programmable gain amplifier (PGA) and a digital comparator, an oscillator and a I
2C protocol interface. In particular, the chip has a 12-bit resolution, a sampling frequency of 3.3 ksps, two differential channels and four single-ended channels. In
Figure 7 are shown front side and back side of the 3D view and in
Table 5 are reported the main characteristics of the ADS1015 chip.
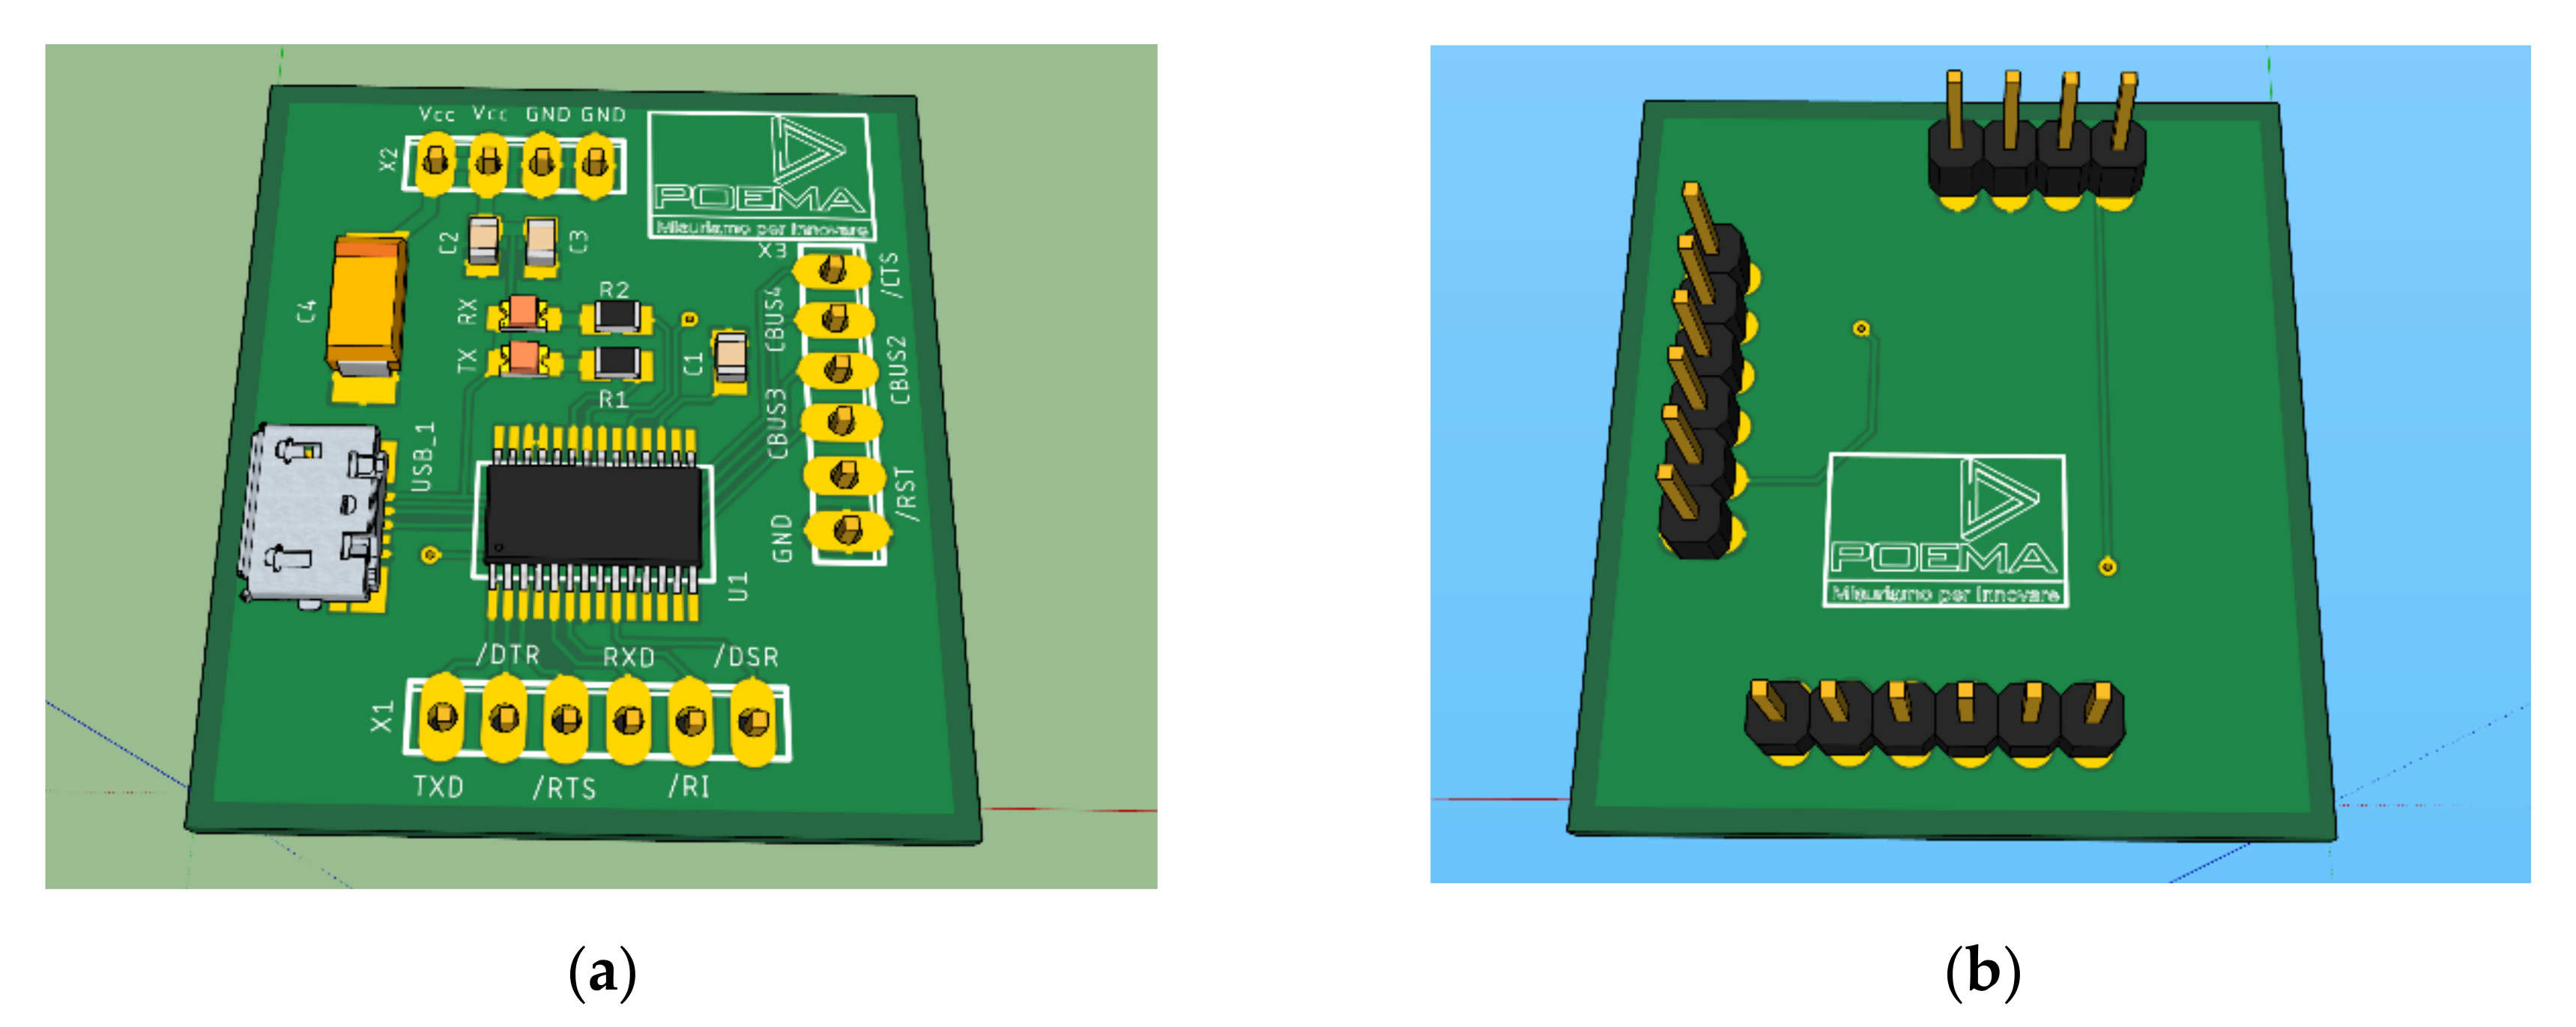
3.5. USB Module
The USB module is shown in
Figure 8 and it is useful for communication with external devices, such as laptop and smartphone and eventually for uploading and updating firmware. The chose module is the FT232R from FTDI chip [
41], a standard USB 2.0 with Universal Asynchronous Receiver-Transmitter (UART) technology. This system allows the data transmitting and receiving with a data-rate of 12 Mb/s. The chip is equipped with a 1024-bit EEPROM that permits configuration system. In the design of this module, two LEDs have been added for verifying correct tasks of data receiving/transmitting. In
Table 6 the main characteristics of the FT232R chip are reported.
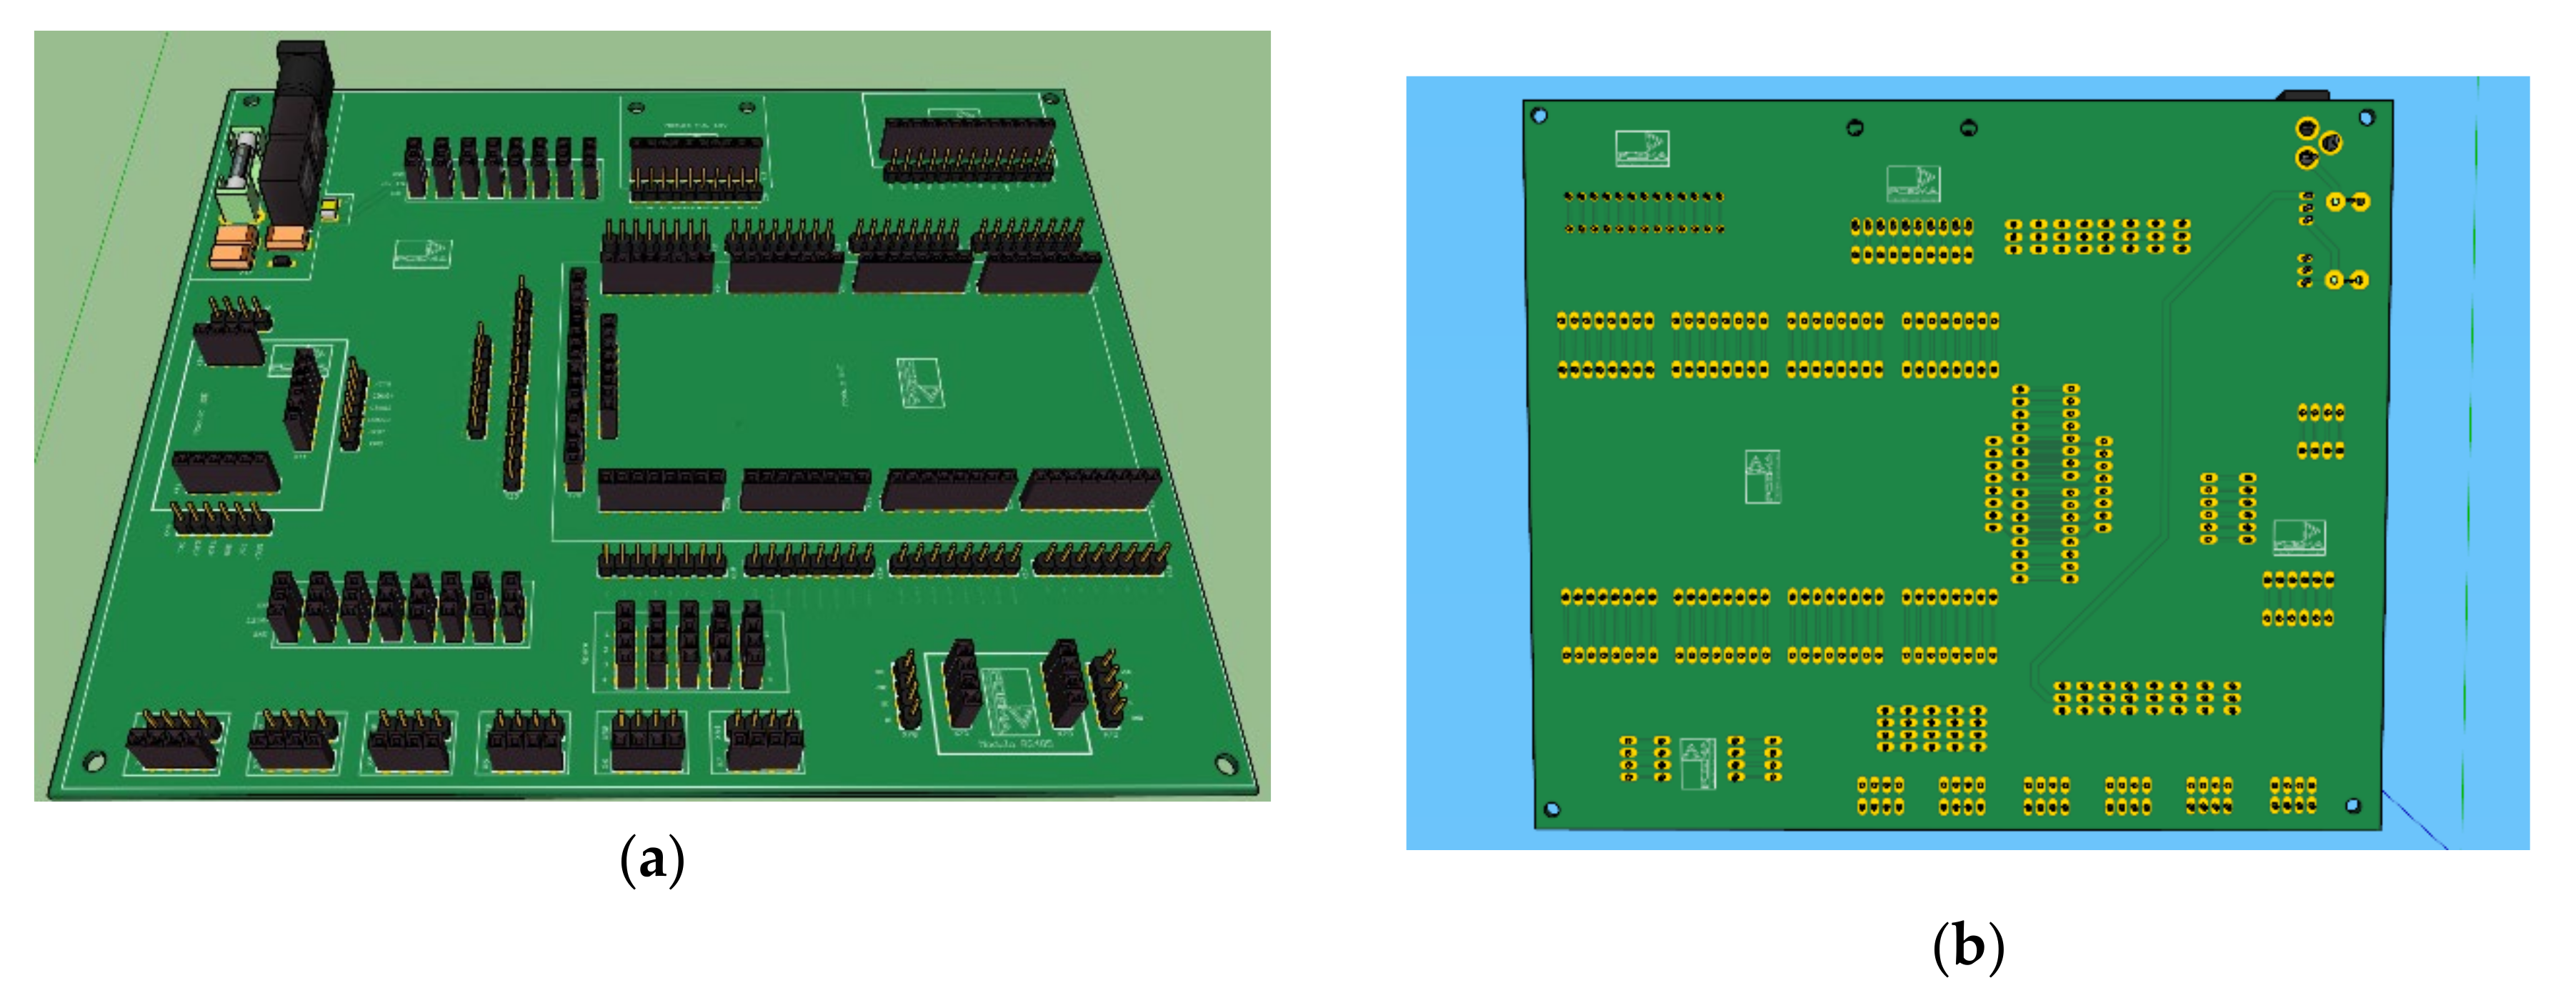
3.6. Main Board
The Main Board hosts the other modules (the GHC module, the Wi-Fi Module, the RS485 Module, the ADC Module and the USB Module) and guarantees power supply, filtering and protection to each of them thanks to Power Supply Unit (PSU) module (see
Figure 1). Since one of the aims of the board concerns prototyping firmware and software in order to make the most of device performances, the Main Board has been designed without any strict electrical connection between various modules hosted (see
Figure 9). In this way, it is possible to connect various modules as needed of the firmware and software developer (input/output ports selected, timer, pin optimization, etc.), which should program the board using an In Circuit Serial Programming (ICSP) interface. The board is 12–32 V powered and it provides, thanks to on-board DC converter [
42], two different voltages, 12 V and 5 V, according to needs. In fact, the other modules are developed to operate with a 5 V power supply, whereas all sensors could be fed to 5 V, 12 V and 24 V power supply [
24,
25,
26] and [
28,
29]. A power consumption calculation has been done in order to evaluate the maximum power supply for each module and consequently the maximum power consumption of our electronic board. In the calculation, the power consumption of outline electronics, such as resistors, capacitors, etc., is considered negligible compared to main modules consumption. The calculation is obtained considering maximum current (I
max) and voltage (V
max) supply, in the worst case, of every chips involved in the board, using the following formula:
where m is the number of modules involved in the prototype. In
Table 7, the maximum Voltage supply (V
max), the maximum current supply (I
max) and the maximum power supply (P
max) for each module are reported. Using the previous formula, the maximum power consumption of our prototype is equal to about 1619 mW. Since the board is 12 V–32 V powered, we have also calculated the energy consumption for each voltage, with the following formula:
Consequently, the energy consumption decreases when the Voltage powered increases.
As achievement of power consumption calculation, and considering that the board could also power external sensors, we have chosen the typical current supply equal to 1.5 A. In this way, we have an oversized electronic system that guarantees absolute flexibility for the board power and the external sensors connection and power. Naturally, for the sensors that request more current supply, it is necessary to have an external power supply.
4. Results: Prototype Realization and Dedicated Firmware and Software Development
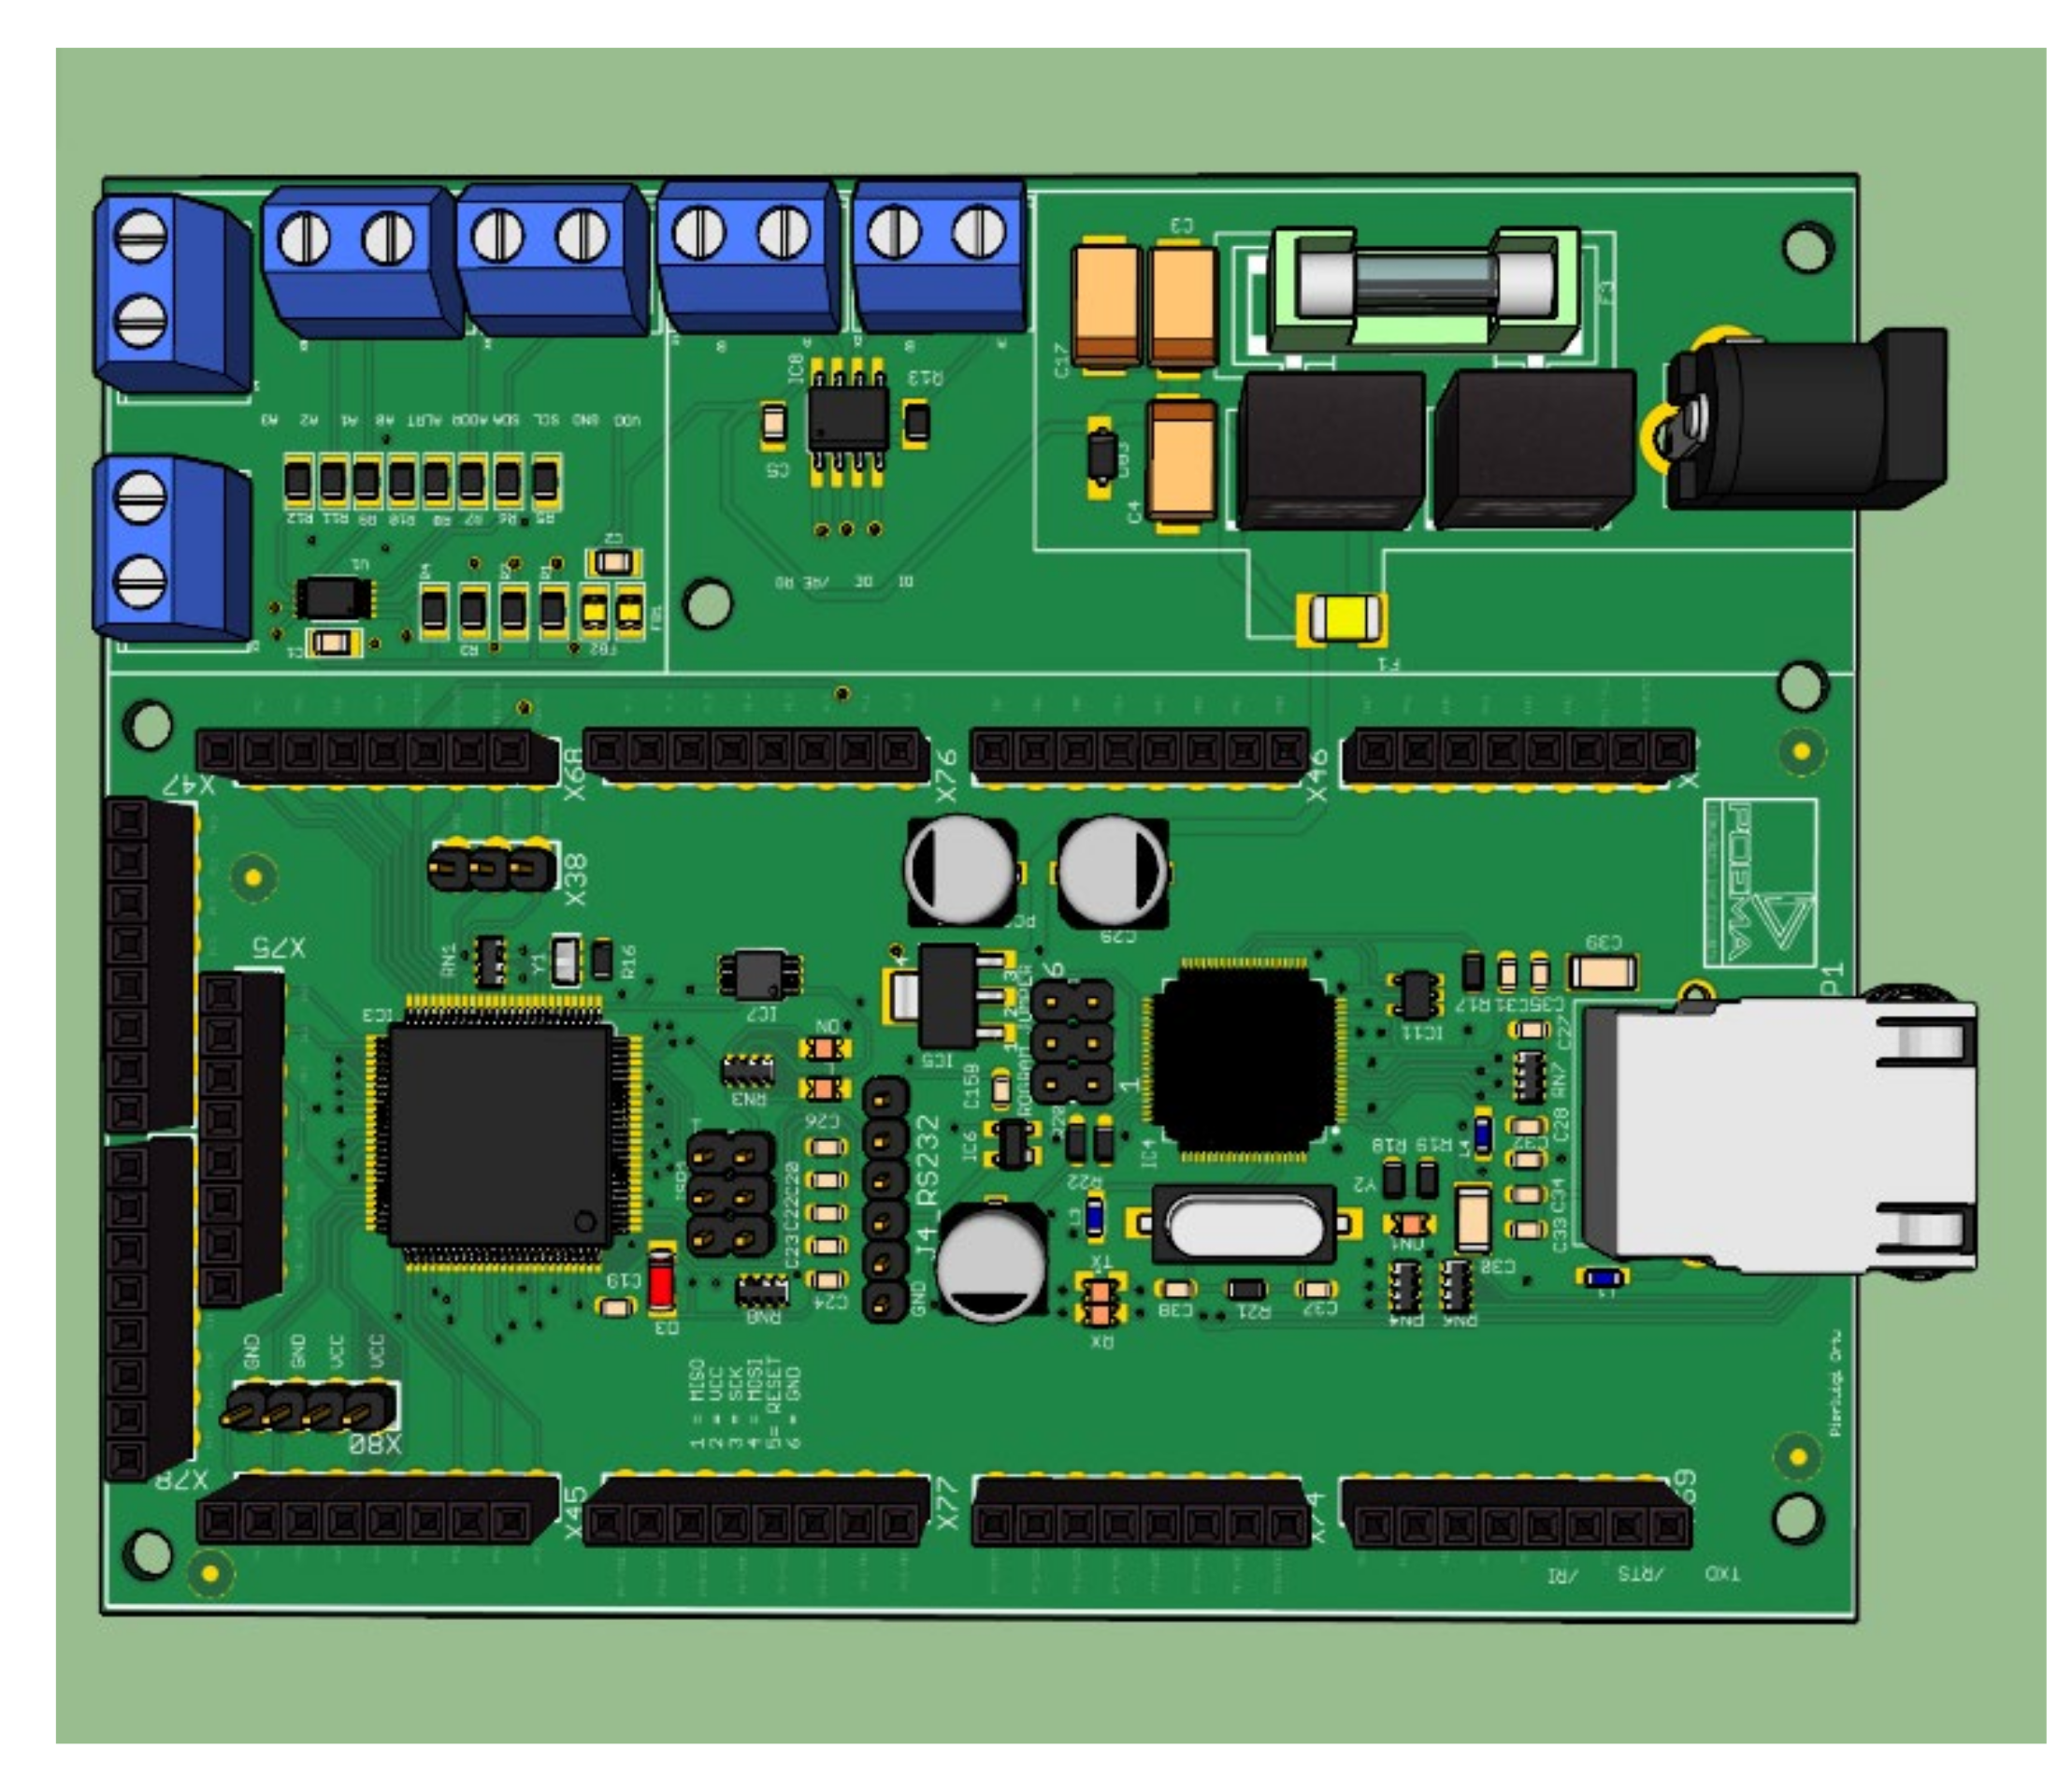
The prototype of the electronic platform for real time greenhouse environment monitoring, designed and developed in previous section, has been realized and it is shown in
Figure 10. As mentioned above, the hardware of our electronic platform has been designed in modular way with the goal to test several combinations with optimized dedicated firmware and software, based on the scenario where the device may be involved. For example, in certain applications there might be the necessity to have only Ethernet interface for connection with external devices, and the requirement to work with both digital sensors (RS485 module) and analogic sensors (ADC module). Consequently, thanks to tests performed using our modular prototype (
Figure 10), it is possible to develop the best firmware and software solution considering only the modules involved in this particular scenario (the GHC module, the RS485 module and the ADC module, whose designs are shown in
Figure 4,
Figure 6 and
Figure 7), and to develop, at a later time, a new compact board that includes only these chips. In this way, starting from our electronic prototype that guarantees maximum flexibility in terms of applicable scenarios, it is possible to develop a new integrated, compact and robust board which includes only desired modules, whose design is shown in
Figure 11. Naturally, the same reasoning can be made for other modules based on application needs.
As mentioned above, our electronic board has been developed with the purpose of firmware and software prototyping. A dedicated firmware and software has been implemented in order to make the most of device performances. The electronic prototype aims to acquire analog and digital signals collected by external sensors for air temperature, humidity, solar radiation, air velocity and CO2 concentration measurements, simultaneously. Subsequently, after data acquisition and processing, the processed data are shared to users through connection between the board and internet gateways, laptops or smartphones.
The software could conceptually be divided in two blocks: one dedicated to board bootloader and firmware, the second one for a web application for the management of acquired data by users.
The whole firmware and software package has been implemented to have a bi-directional communication between the board and the web server. For this kind of communication, performed by Ethernet and Wi-Fi modules, the standard Used Datagram Protocol (UDP) has been used to allow transmitting and receiving data string, quickly. In particular, with the objective of developing a real time monitoring prototype, which collects data with a high acquisition frequency and sends them to external devices, we have used UDP protocol because it guarantees a simple connectionless communication model with a minimum of protocol mechanisms. It is suitable for application such our project where error checking and correction are either not necessary. In addition, we have considered Constrained Application Protocol (CoAP) in order to ensure reliability of the transmission process.
4.1. Development of the Dedicated Firmware
The bootloader and the firmware, which have been developed in C language, have been added at the time of manufacturing and are useful to run user programs on the board and can be thought of as the software that allows hardware to run.
The bootloader runs when the board is turned on and it is very similar to a computer BIOS. It allows ports and microcontroller pins setting for permitting communication between the board and external devices.
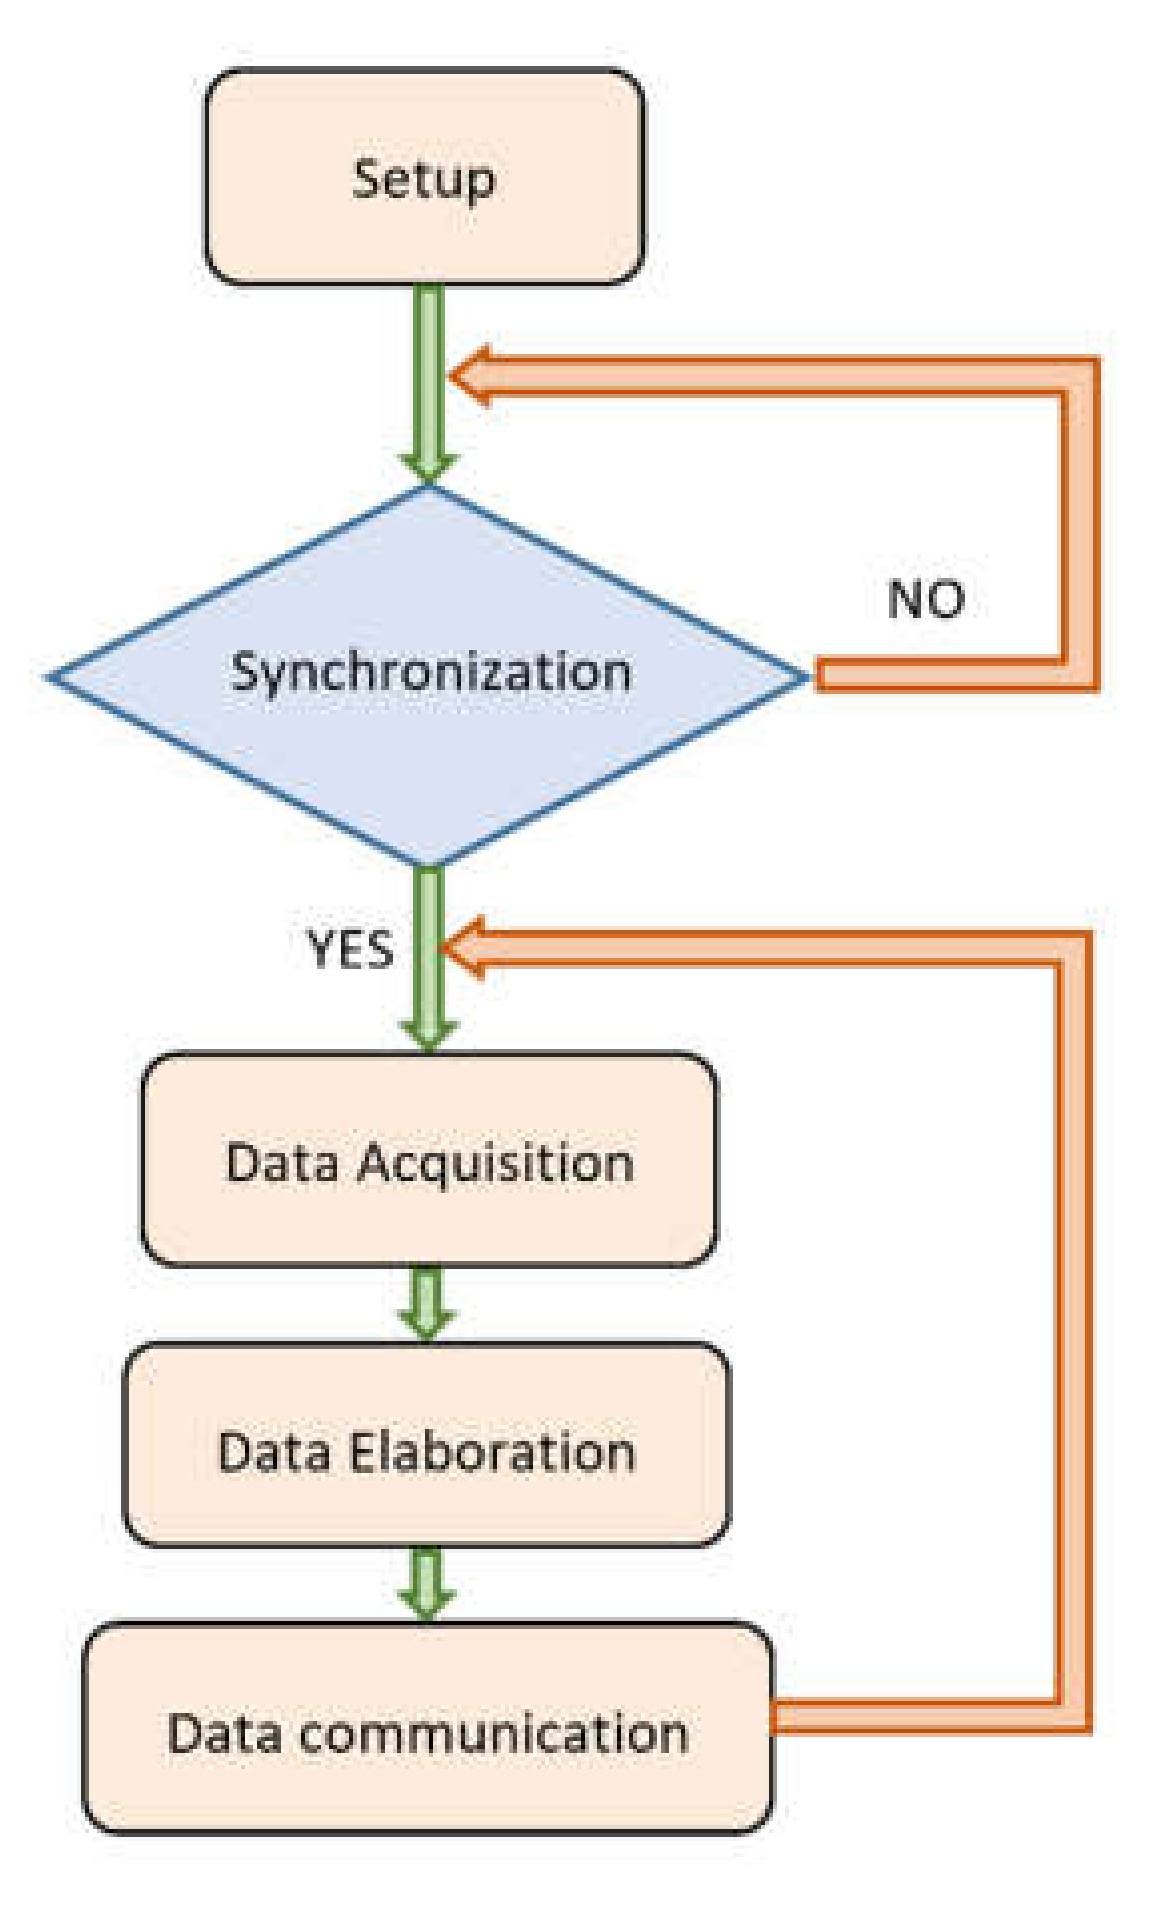
On the other hand, the firmware enables data acquisition from sensors (RS485 and ADC modules) and communication with internet gateway (Wi-Fi module and Ethernet port). A block diagram of the firmware is reported in
Figure 12. The Setup block is dedicated for modules and protocols setup and permits the initialization each time the board is switched on. During the design phase, we have installed a real time clock on the board. But despite this aspect, an initial synchronization is necessary connecting on the server. In addition, we have planned a periodical synchronization of our system nodes in order to compensate their time shifting. Consequently, the Synchronization block guarantee a synchronization with real time-clock from Internet for automatic time association to acquired data. If the synchronization is not performed, it is repeated while it will be successful. When the synchronization is done, the board starts the data acquisition from external sensors. A data elaboration is carried out using a sequential Kalman filter, namely Unscented Kalman Filter (UKF) [
43], which permits to stabilize data acquired in the previous block. In fact, the UKF uses a series of measurements observed over time, containing statistical noise and other inaccuracies, and produces an estimated achievement that tend to be more accurate than those based on a single measurement alone. After this elaboration, the Data communication block allows to save data in a standard format for web server communication with UDP and CoAP protocols.
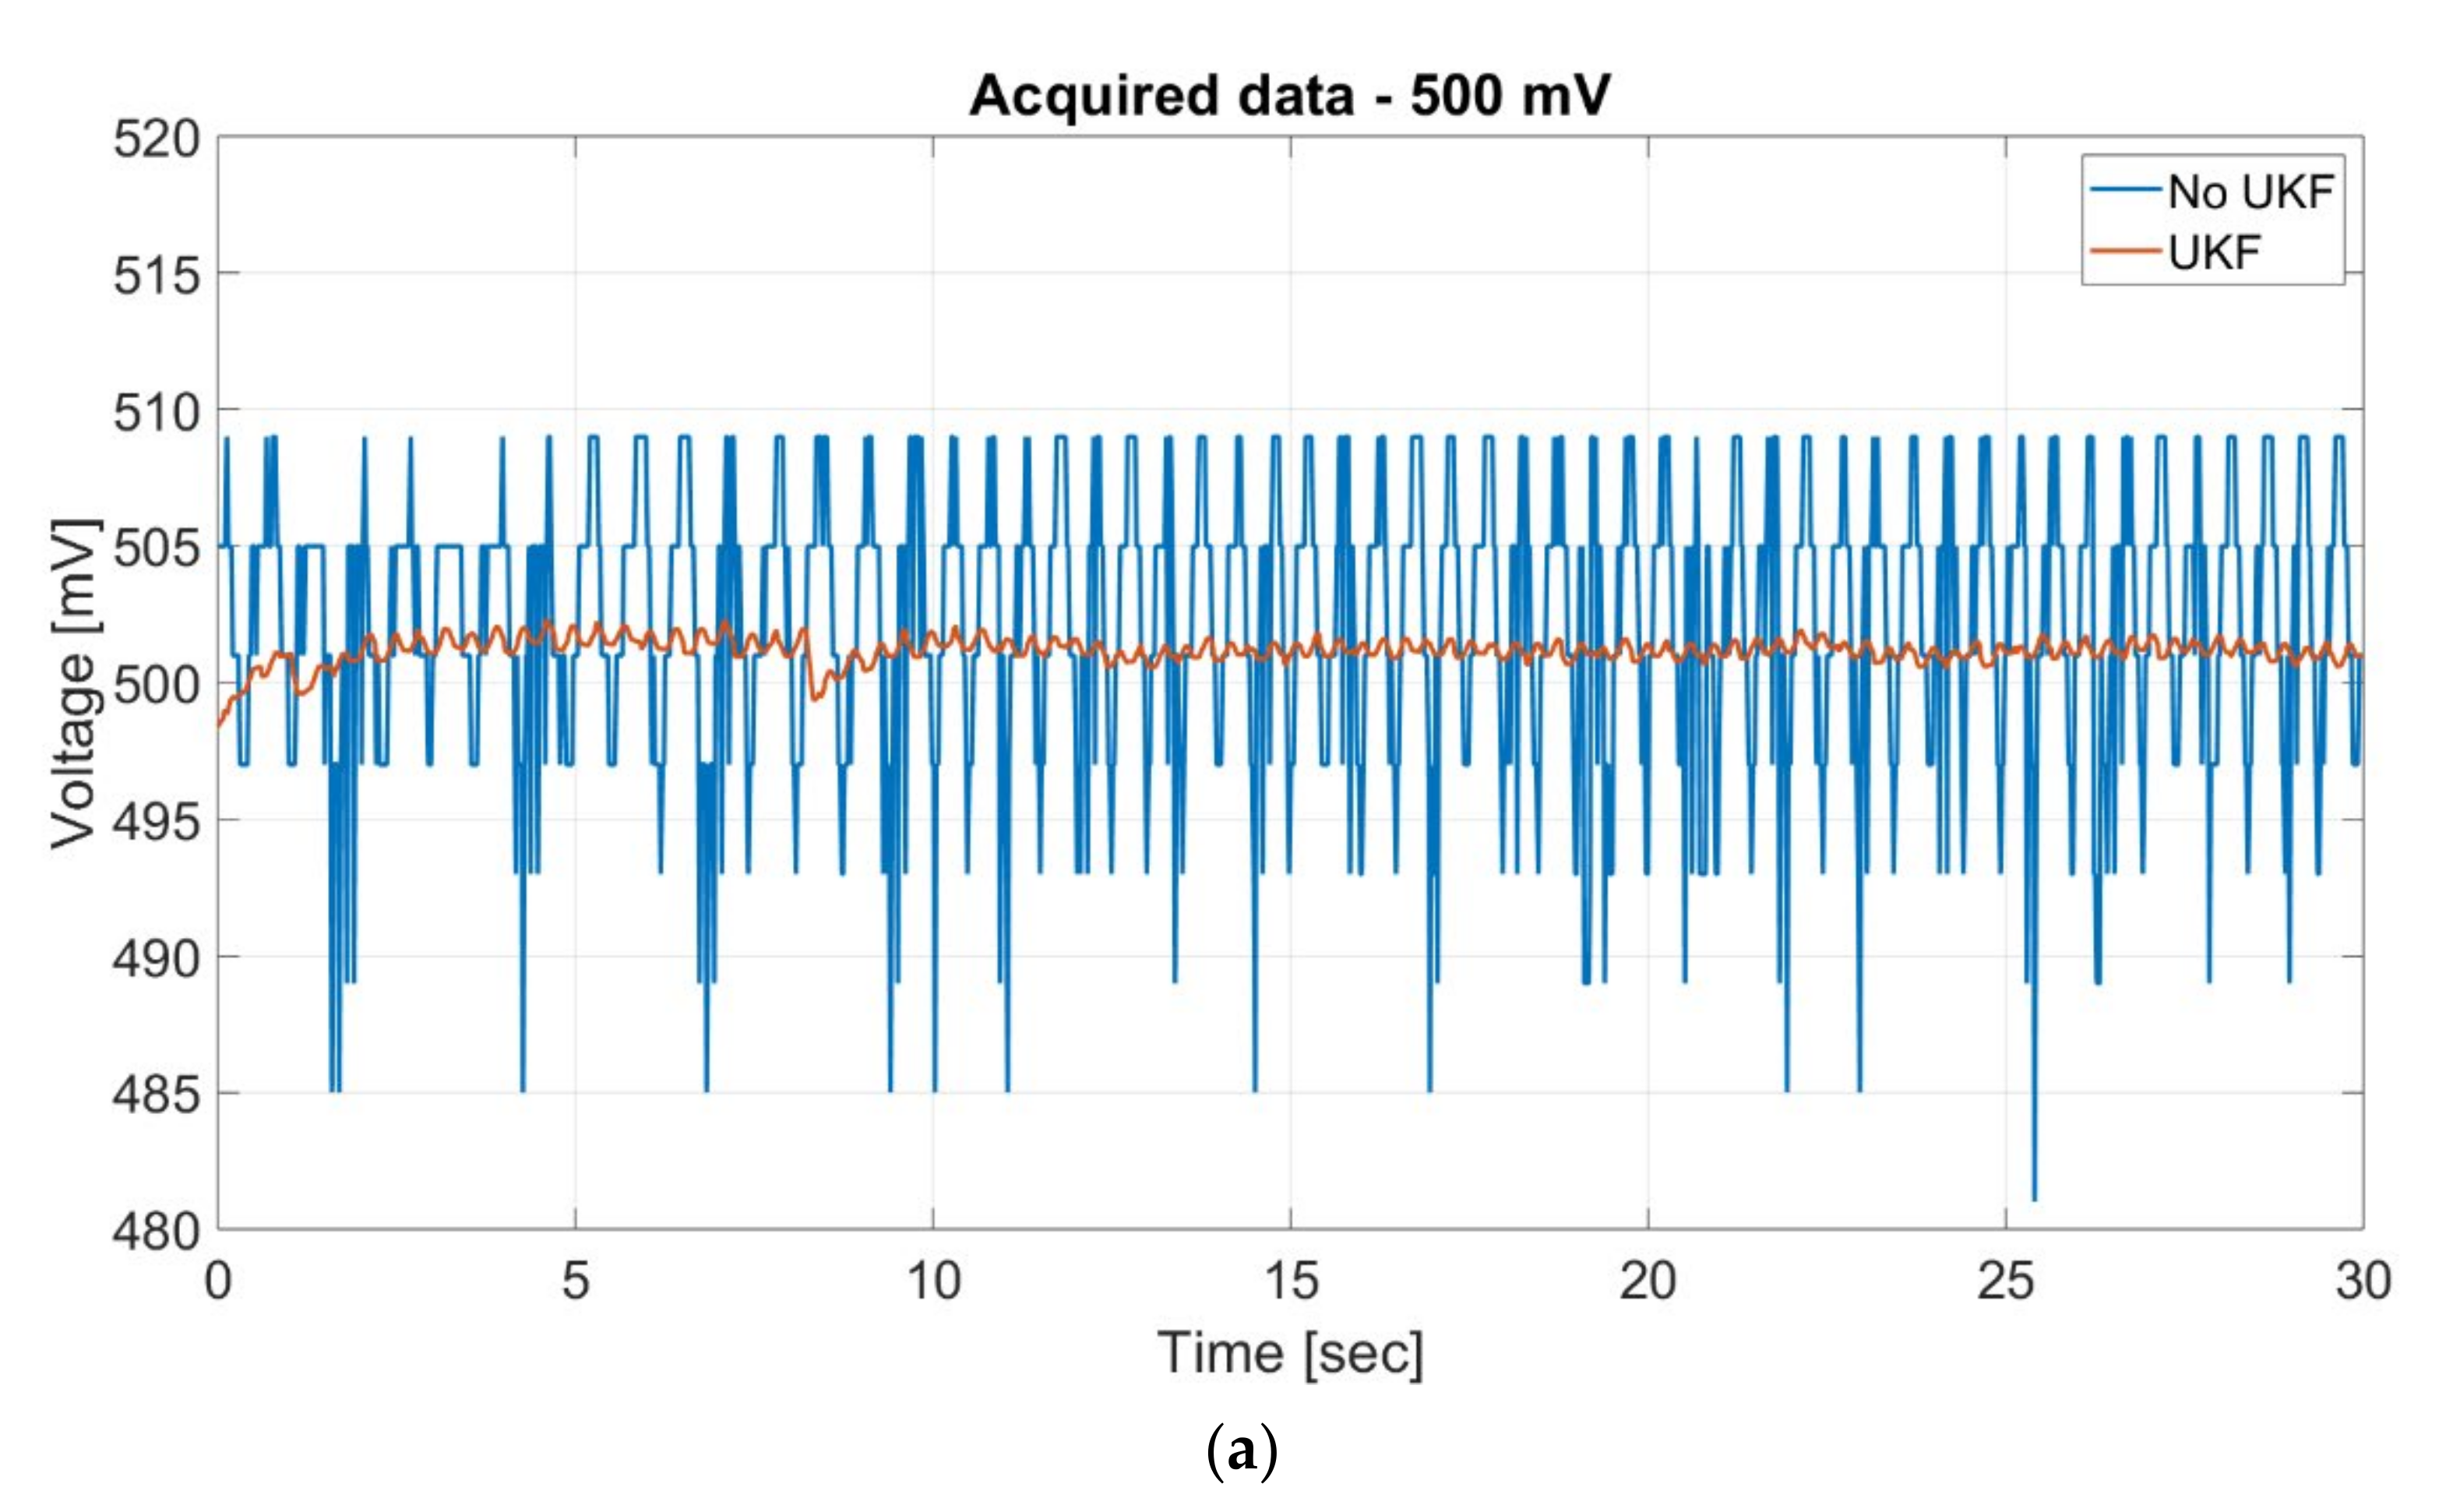
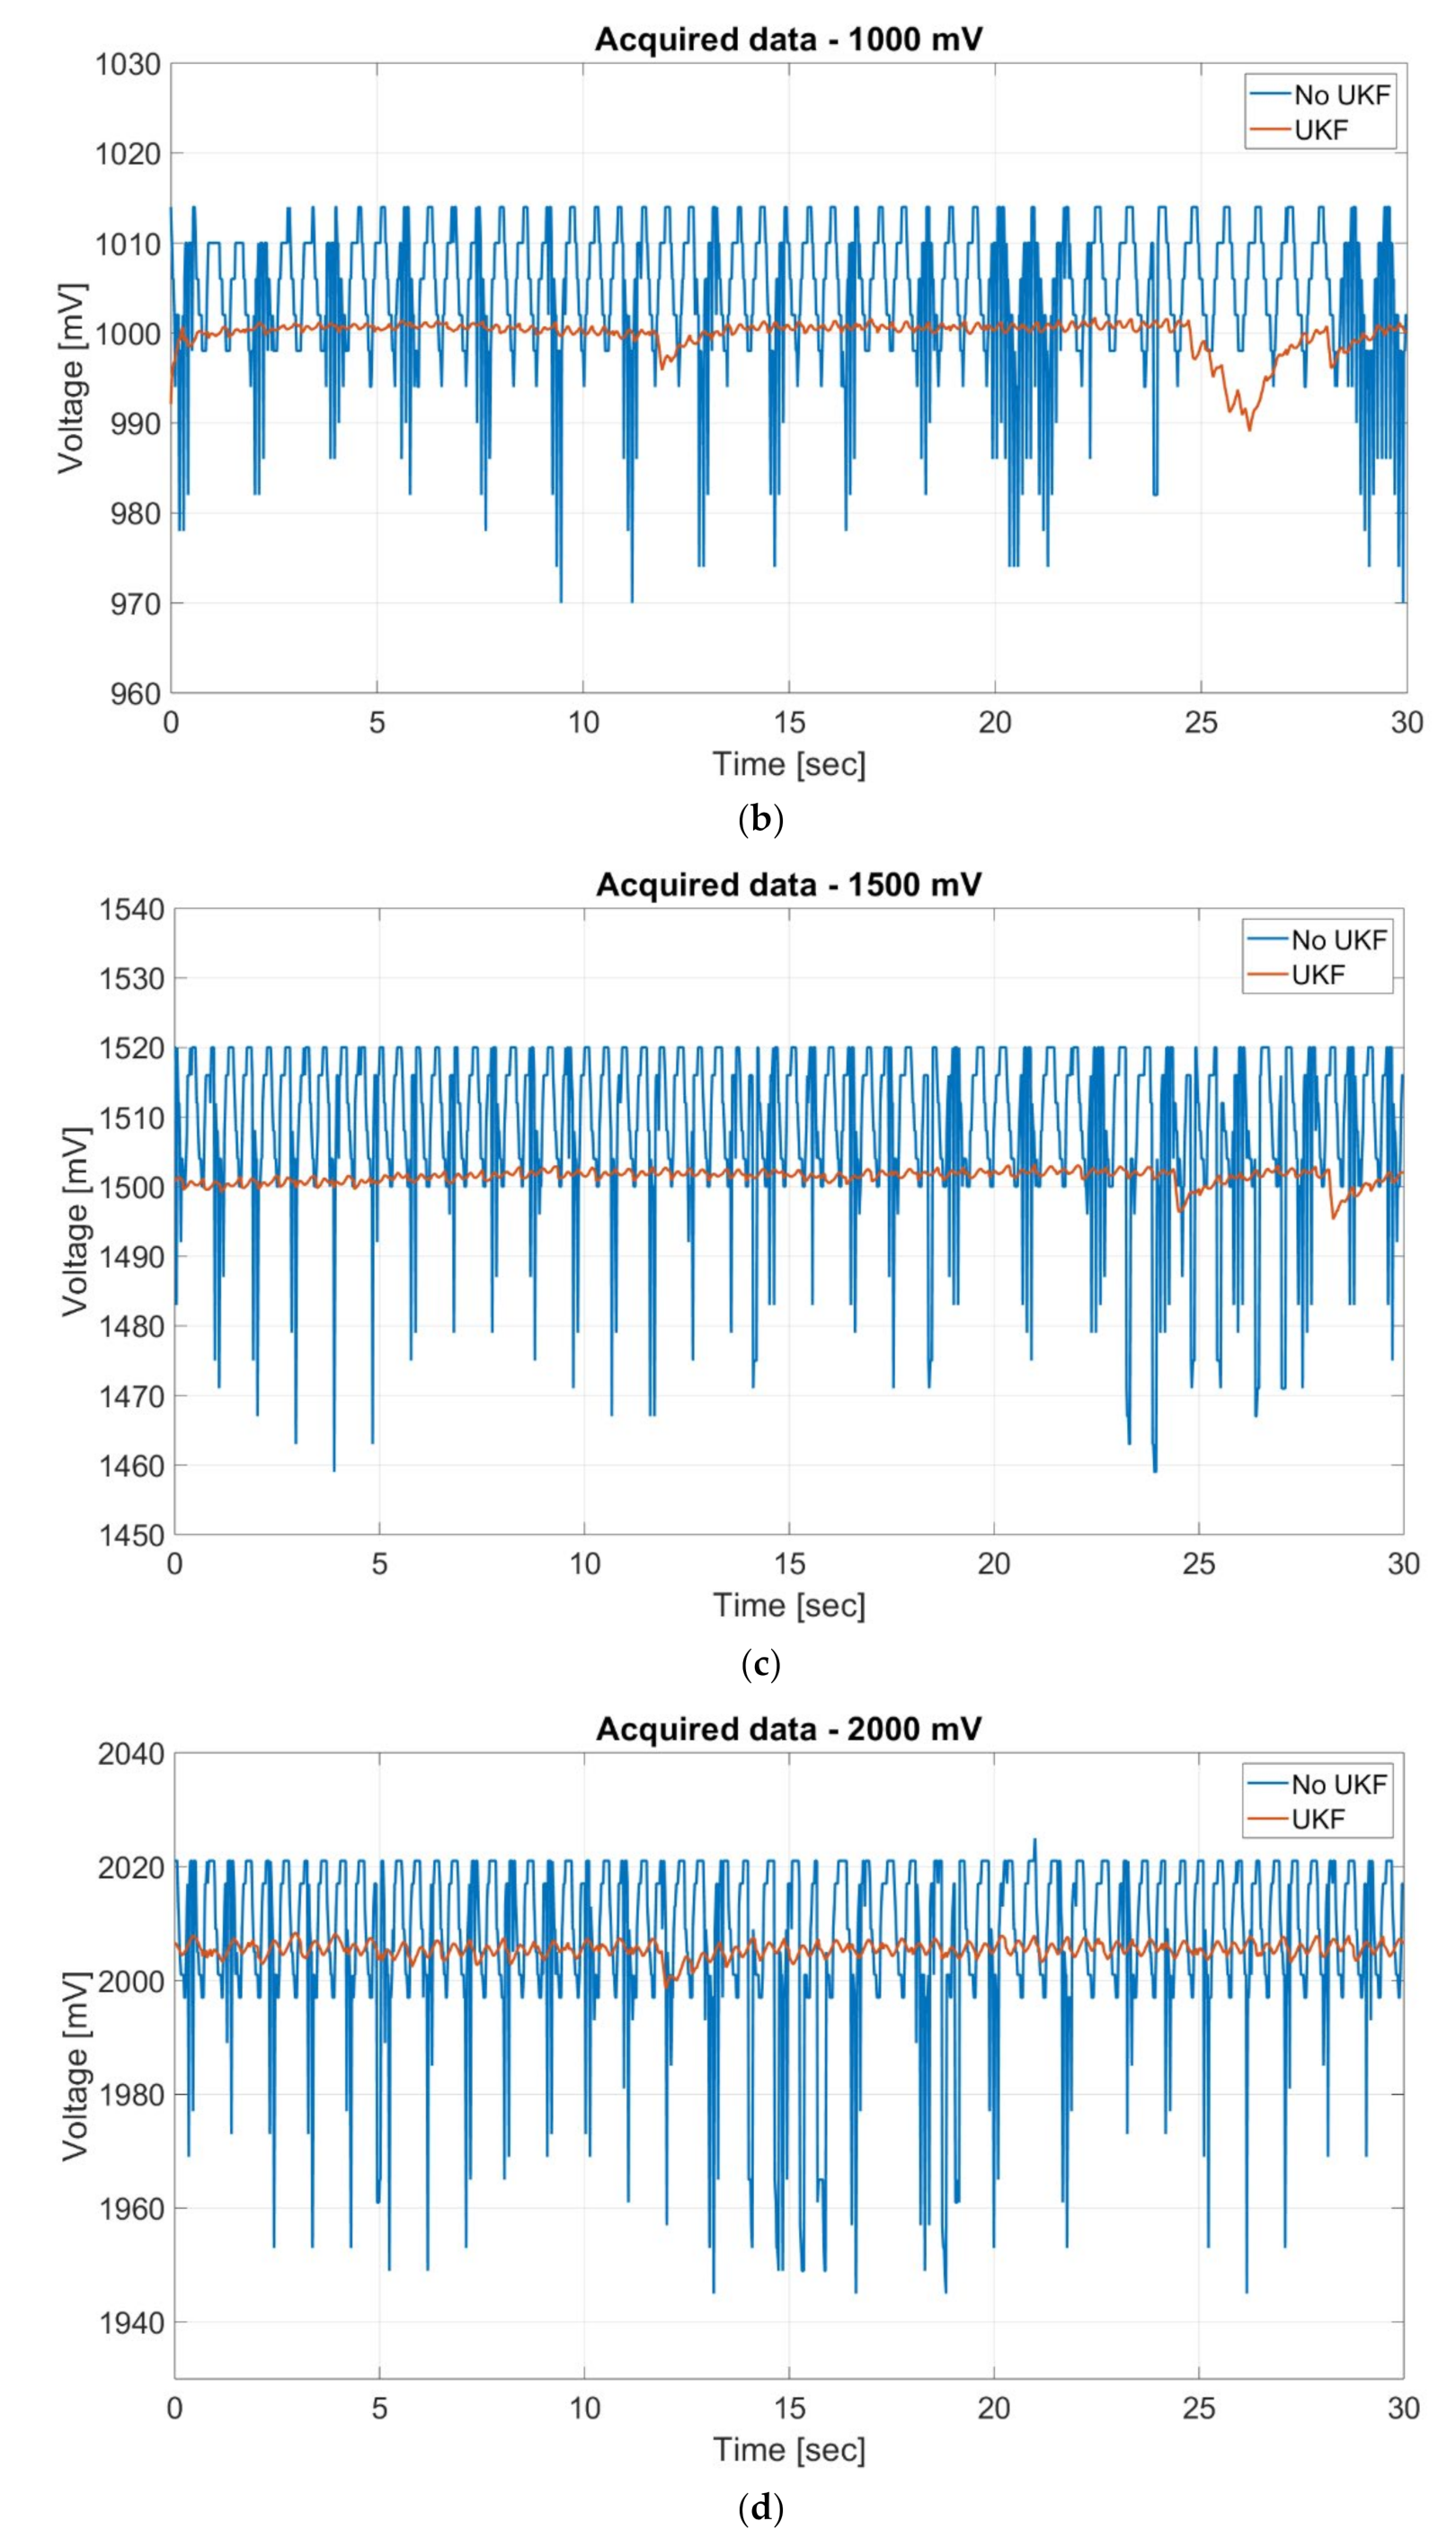
In order to investigate the stability of the acquired data and the results of the data elaboration using the UKF, we have tested the board during a time acquisition window of 30 s. The experiment has been studied with the goal of simulating a typical use scenario of the board. A resistive potentiometer has been powered by the board with a voltage of 5 V, and its voltage reading has been stored and elaborated using the UKF by the board. We have decided to test the board for voltages reading between 500 mV and 2000 mV, that are typical values of commercial sensors. In
Figure 13 are shown the graphical results of the experiment.
Thanks to the analysis of
Figure 12, we can see the advantages of using the UKF in terms of the collected data quality and stability. In particular, the board is able to collect data with voltages reading of 500 mV (
Figure 13a), 1000 mV (
Figure 13b), 1500 mV (
Figure 13c) and 2000 mV (
Figure 13d), with maximum ripples of about 60 mVpp (see blue curves of
Figure 13, named “No UKF”), according with features of the on-board DC converter [
42]. This stage is performed by the Data acquisition block of
Figure 12. When these data are elaborated by the Elaboration data block of
Figure 12, using the UKF (see red curves of
Figure 13, named “UKF”), the values of voltage readings have ripples of few mVpp. This result highlights an improvement of the data quality and stability after the elaboration stage and it is in line with the accuracy of commercial sensors that could be used in greenhouse monitoring [
24,
25,
26,
27,
28,
29].
4.2. Development of the Dedicated Software and Web Application
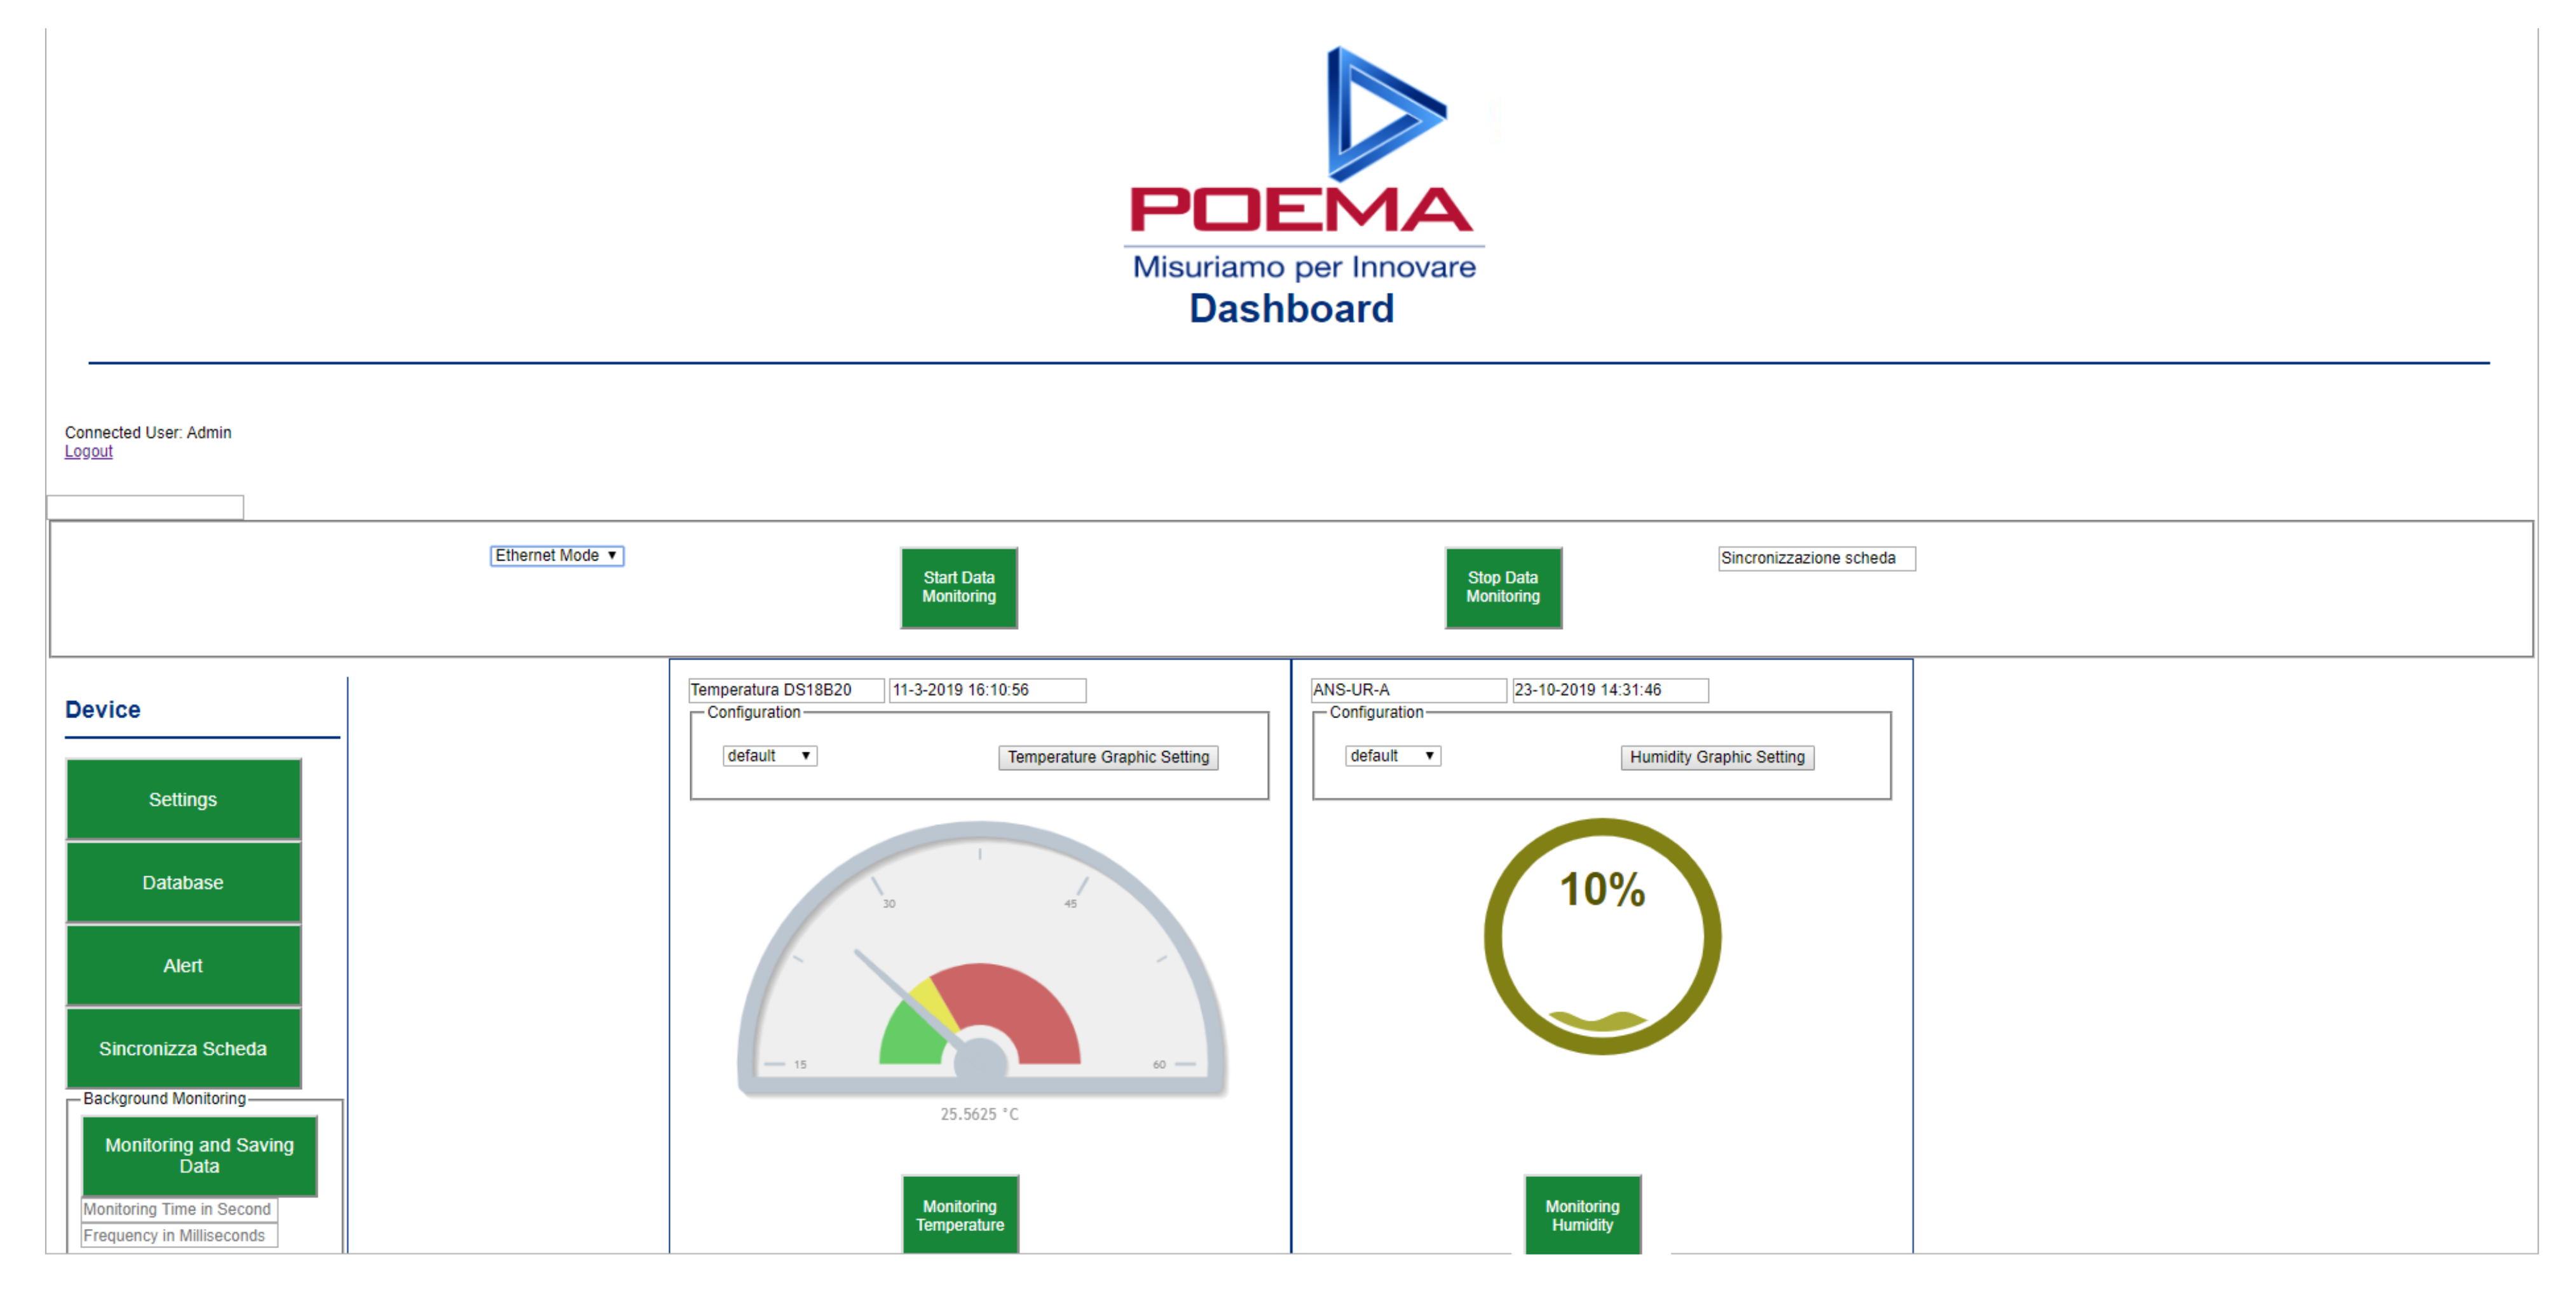
Thanks to the connectivity features of our board, the collected datasets are immediately available, for example, to the other IoT devices that could work in the greenhouse. In this way, the agricultural production process of the greenhouse could be executed by automation system that increases productivity by reducing the need for human workforce, guaranteeing a smart management of the greenhouse. On the other hand, we have implemented a Web application in order to allow also users a consultation of greenhouse environmental state, through a user-friendly graphical interface, in a simple and fast way.
The web application (that is a client-server computer program that the client runs in a web browser) has been developed using Java servlet and Java Server Pages (JSP). A Java servlet is a Java software component that implements web containers for hosting web applications on web servers and thus qualify as a server-side servlet web application. JSP is a server-side programming technology that enables the creation of dynamic, platform-independent method for building web applications in HTML language.
The Web application (see
Figure 14) allows users to synchronize the board from Internet, to acquire data information collected by the board, to storage these data in a on-line dedicated database and to show them via a web browser.


