Article

Potential of Pressure Sensor Based Mass Estimation Methods for Electric Buses

Chair of Electric Mobility and Energy Storage Systems, University of Wuppertal, 42119 Wuppertal, Germany
*
Author to whom correspondence should be addressed.
Electronics 2020, 9(5), 711; https://doi.org/10.3390/electronics9050711
Submission received: 18 March 2020 / Revised: 23 April 2020 / Accepted: 24 April 2020 / Published: 26 April 2020
(This article belongs to the Special Issue Smart Sensor Networks)

Abstract

:
One approach to improve the economic efficiency of trolleybuses in the so-called BOB Project in the German town of Solingen is to use them as mobile energy storages in a smart grid. To achieve this, reliable information on available energy is essential, which in turn needs to be derived from a precise range calculator. As shown in this article, vehicle mass is a strong influencing factor, especially in urban traffic. Depending on passenger volume, the total mass and range of the bus varies by about 30 percent. The currently available mass on the bus fluctuates by more than 2 tons for constant payloads, and there is no proven solution for a more accurate mass estimation for buses in public passenger transportation. Therefore, this article presents a viable methodology to detect changes in payload, using high precision pressure sensors on the bus’s tires and air suspensions. These mass inducted pressure changes are extracted from the measurement data, using a filter to be later converted back into the corresponding masses. As the article will show, both approaches have their respective advantages and disadvantages, but have high potential and should therefore be investigated further.

1. Introduction

Trolleybuses provide local public transportation in 300 cities worldwide [1], as in the German town of Solingen, where trolleybuses have run for more than 65 years. Although much has changed over the years, one major shortcoming—dependence on overhead lines for their electrical supply—has constantly limited their operating range and flexibility. Supplementary diesel units (and, on other routes, diesel-powered buses) have always proven necessary—up to now. At a cost of 900,000 Euro, battery-powered trolleybuses are anything but a cheap investment. Nevertheless, they are vital in times of bans on diesel-powered vehicles in some downtown areas. For this reason, it is especially important to increase their market penetration by maximizing their economic efficiency and scope of application.

1.1. Worldwide Spread of Electric Buses

Electric mobility is playing an increasingly important role in the long-term fight against climate change, such as to eliminate local emissions. For example, in Paris, the public transport operator has recently ordered 800 electric buses [2]. Additionally, over 800 electric buses are already registered in Germany by 2019 [3]. However, only 154 of them are full electric vehicles [3]. In the United States of America, a mere 0.6% of the 70,000 transit buses were electric vehicles in 2018 [4]. Moreover, 95% of the American school buses are powered by diesel engines [4]. In this context, the authors of [4] emphasize that a total substitution of all American school buses by electric buses would lead to an annual mitigation of 5.3 million tons of greenhouse gases (GHG). The reduction of GHG is indispensable for climate protection, especially regarding the historic highest value of energy-related CO2 emissions (33.1 Gt) in 2018 [5]. The International Energy Agency (IEA) highlights in their report [6] from 2019, a new high of CO2 emissions (32.8 billion tons) was caused by fuel combustion in 2017 as well. This report [6] highlights that the transportation sector has a share of 24% of the global CO2 emissions in 2017. The reduction of climate-damaging gases is one of the main tasks relating to public health. Only 8% of the Asian and pacific population live in an environment with healthy air in 2015 [7]. As a result, approximately 4 billion people in this region have to live with health risk based on air pollution. The increasing air pollution is a great challenge for the big metropolises in South and East Asia like Beijing. A look at the current sales volume of electric vehicles and national subsidies programs for electric vehicles demonstrates that the governments of countries in South and East Asia have already recognized this problem. The Chinese government, for example, subsidies electric vehicles like commercial passenger vehicles [8]. These subsidy programs make the purchase of electric vehicles more attractive. For example, the World Bank estimates a stock of 340,982 electric buses for China and 1273 electric buses for Europe, as of summer 2018 [9]. Hence, it can be summarized that China is the market leader for electric buses. This finding can be underlined by the development of Shenzhen’s public transportation system. In December 2017, Shenzhen was the first city worldwide that have already achieved a 100 percent electric bus fleet (16,359 electric buses) [10,11,12]. These figures underline the important role of China inside the market for electric buses.
Nevertheless, two of the main limiting factors of electric buses are the higher costs and the significantly lower range compared to conventional buses—even though it is sometimes just range anxiety [13]. Therefore, many researchers are working to overcome this limitation, in one way or another. The system approach presented in this article is a promising solution to overcome range anxiety by enabling a more precise estimation of energy consumption with regard to range prediction based on precise information about the vehicle weight.

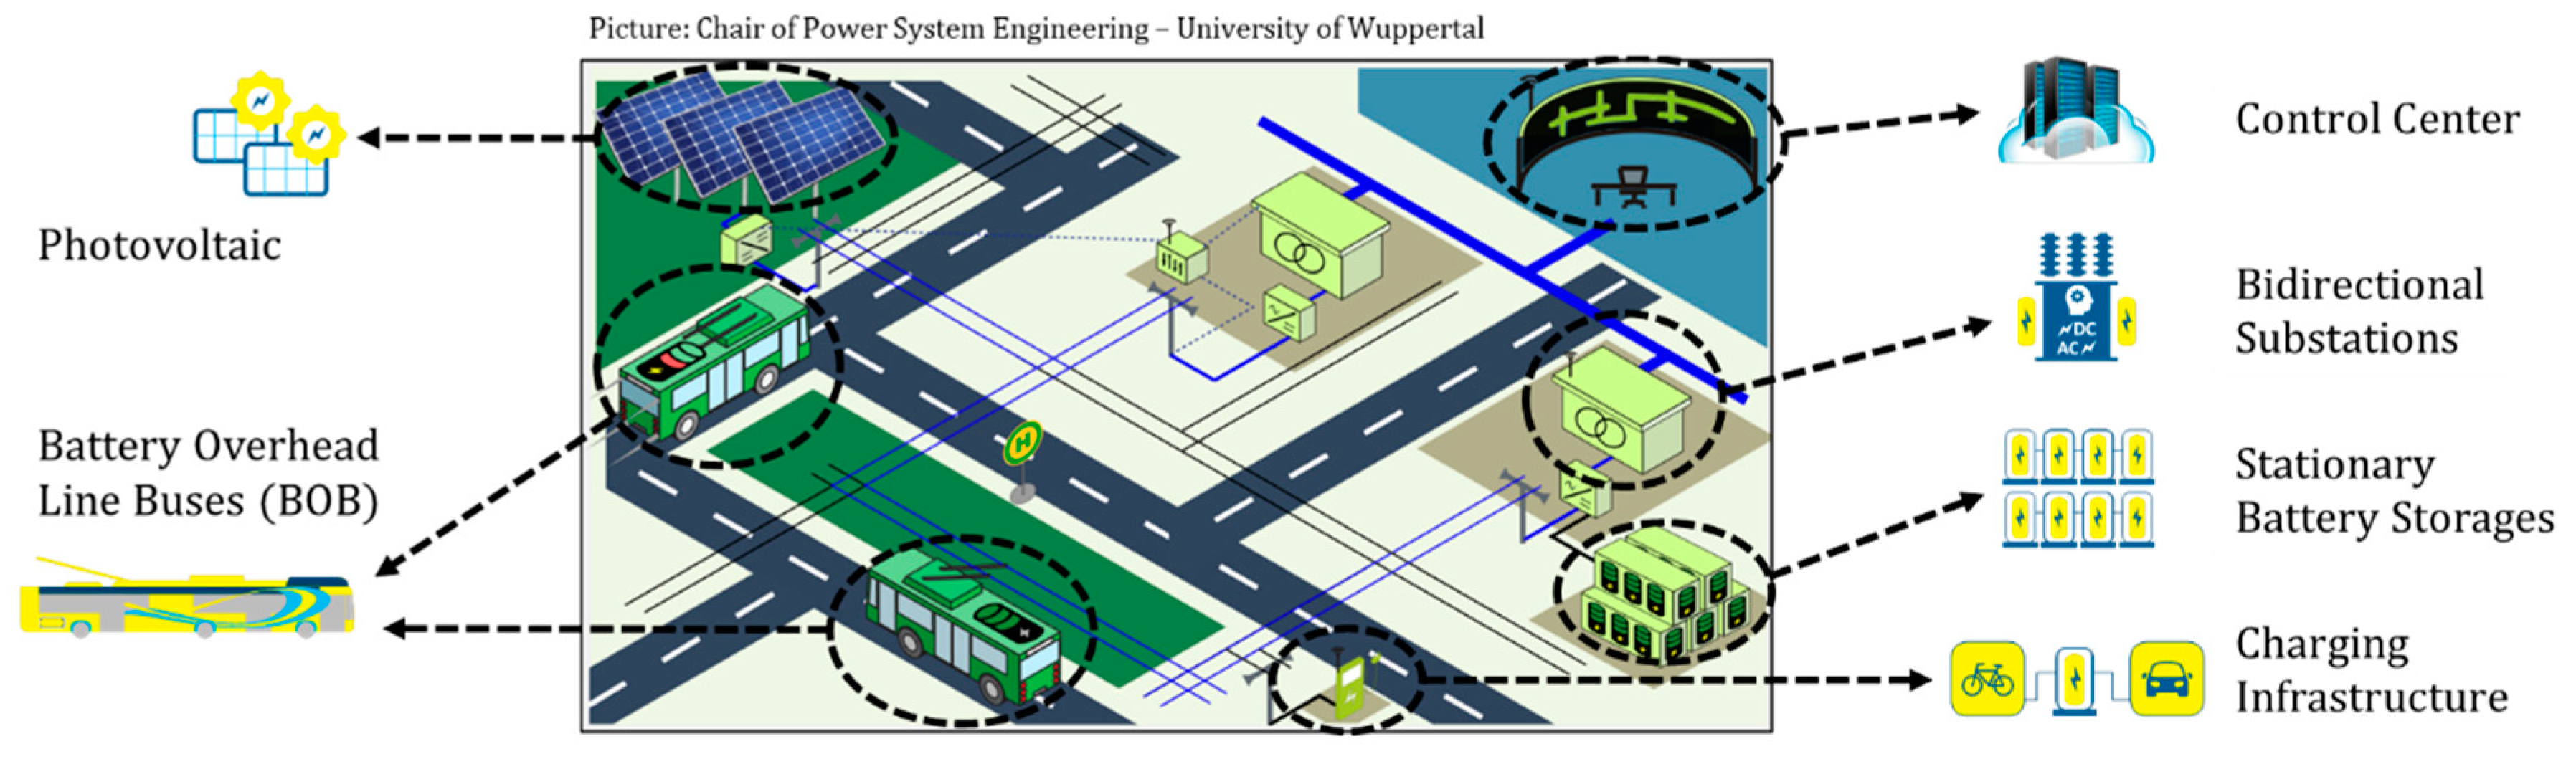
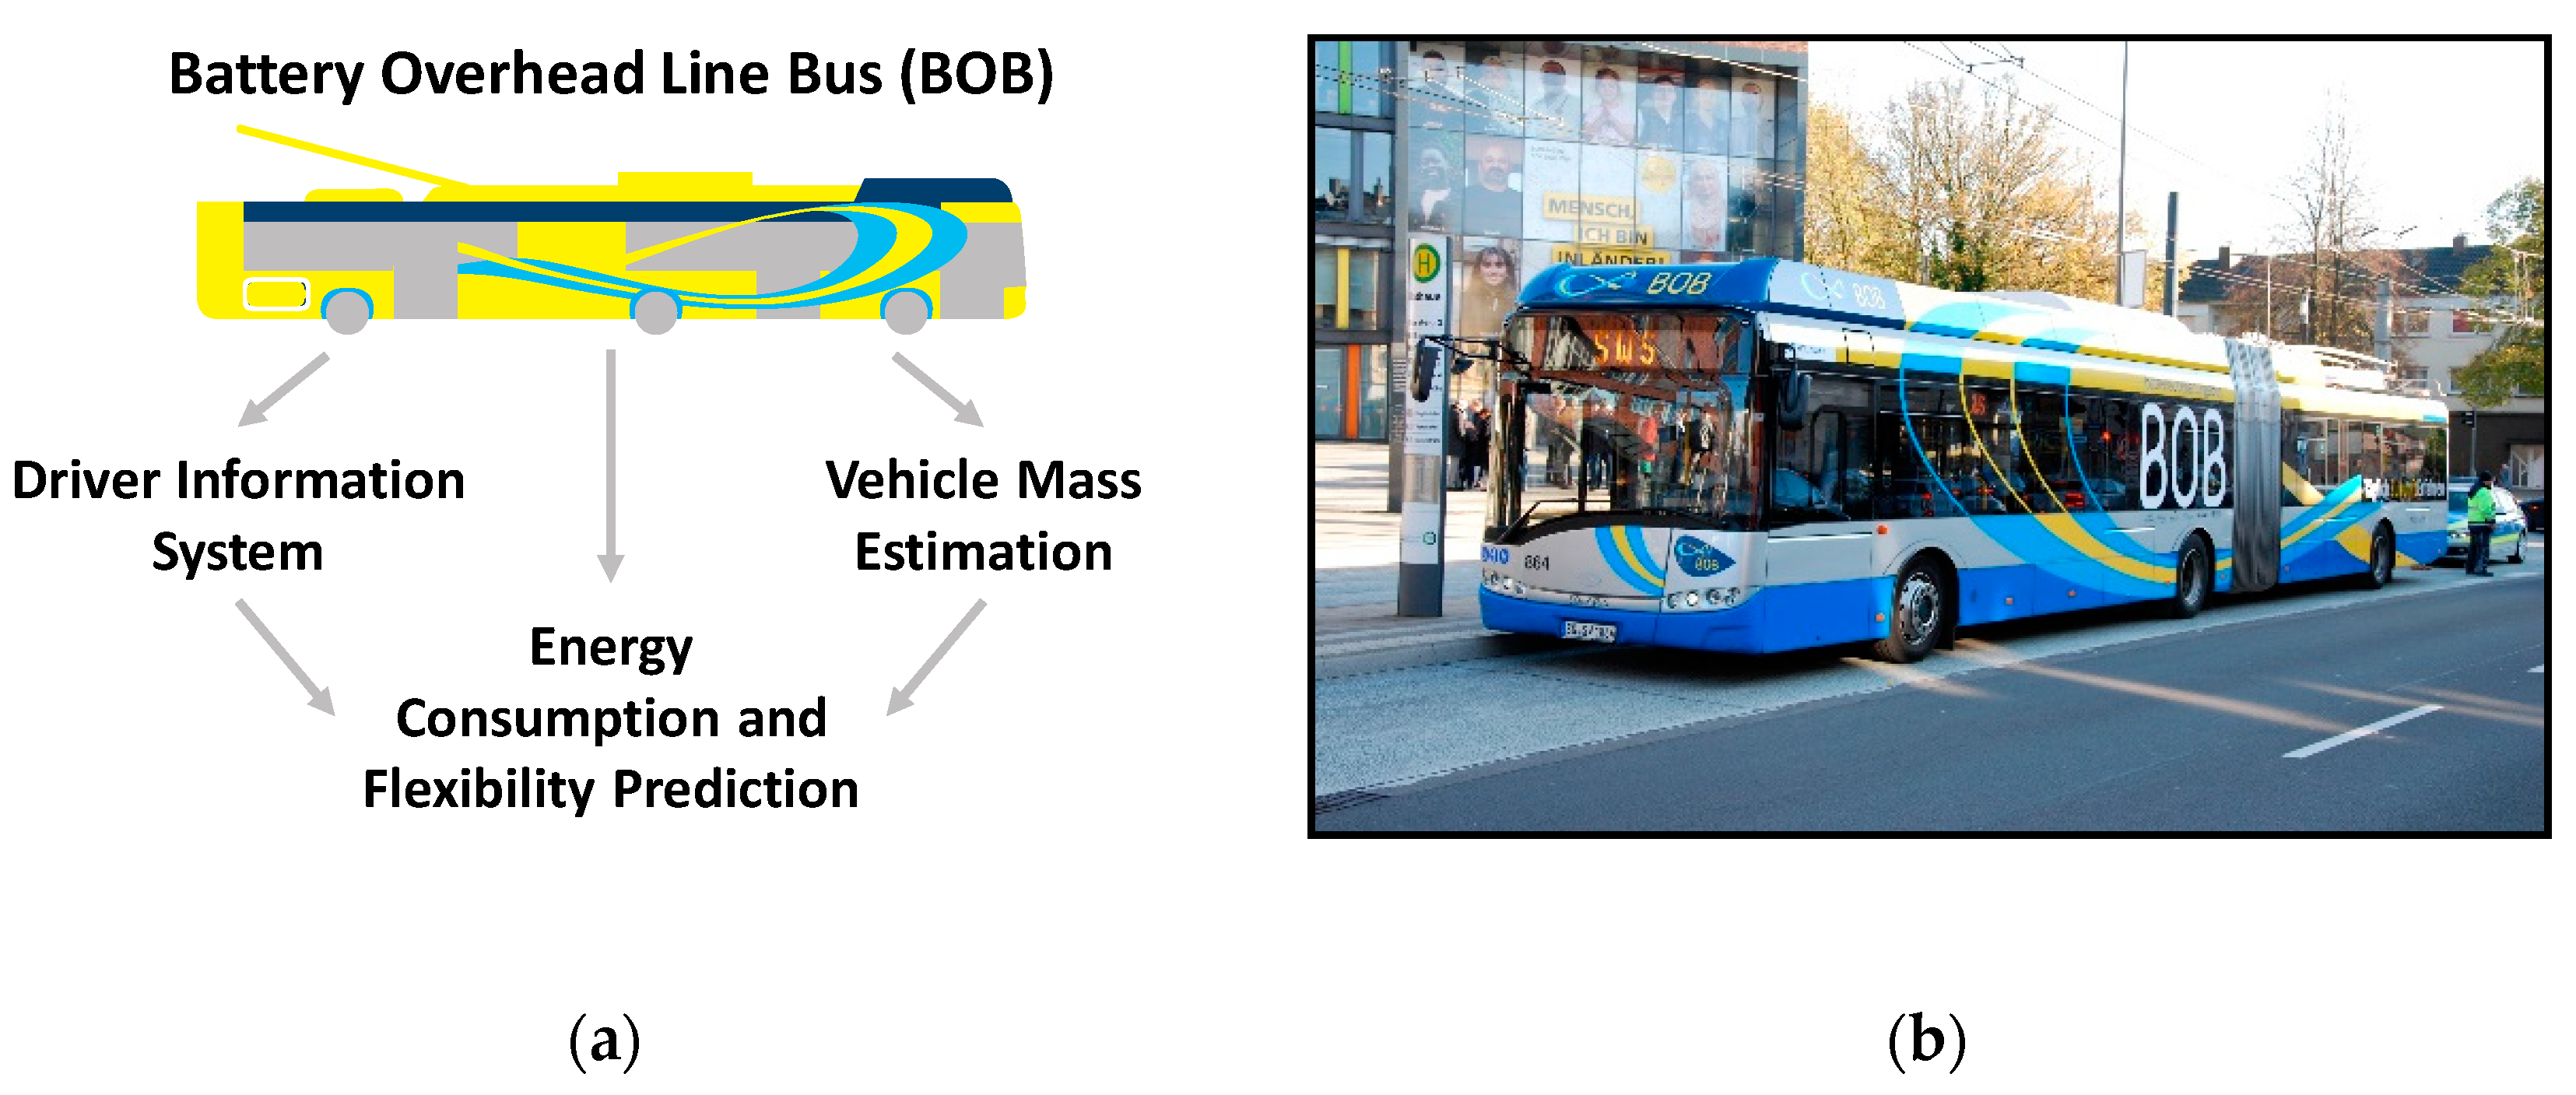
1.2. Project Introduction

The largest overhead line infrastructure of Germany is located in Solingen (North Rhine-Westphalia) and it provides a good test field for correspondent technologies and concepts. In 2017, the German Federal Ministry of Transport and Digital Infrastructure (“Bundesministerium für Verkehr und digitale Infrastruktur”) has decided to fund the project “BOB Solingen” with 15 million Euros to decarbonize the urban transportation system of Solingen by replacing diesel units in Solingen’s trolleybus fleet with battery-driven ones as a stand-by, enabling the buses to function on routes without overhead lines. Thereby, the various challenges of a cross-sectoral electrification have to be overcome by new solutions to combine the traffic system with the energy supply system [14]. A project with a quite similar research focus is “SwissTrolley plus”, which is located at Zurich (Switzerland). The project goals are e.g., a vehicle-based energy management and charging strategy and a battery-health conscious operating strategy for maximum lifetime [15,16]. Another example is the project “E-Bus 2020”, which is a cooperation between the Hogeschool van Arnhem en Nijmegen (Netherlands), the Hochschule Niederrhein (Germany) and some industrial partners [17].
The project “BOB Solingen” focuses on the holistic approach of a smart trolley bus system (STS), where each of the battery-overhead-buses (BOB) represents one of many actors to locally manipulate the overhead line load. Figure 1 schematically displays the different subprojects, like the stationary storages, bidirectional substations, charging infrastructure and integration of photovoltaic.
The intended decarbonization is not only a question of the replacement of trolley buses with supplementary diesel units, but also of the electricity generation for the whole bus fleet. In addition to the use of 100% sustainable energy (since 2009 [18]), the prospective production and consumption of regenerative energy directly at the overhead line is already scheduled, and is going to be realized by several photovoltaic (PV) power plants. In case of a high energy production, where fully charged BOB are passing the PV supply areas, neither the bus battery nor the overhead line is able to absorb the recuperation energy. Therefore, bidirectional sub stations are going to substitute the conventional ones to enable an energy transport to the upstream grid level (AC 10 kV). Additionally, stationary battery storages are a second possibility to handle temporally peak loads in the overhead line, especially during high utilization periods. In order to meet the aspiration for an efficient use of resources, the battery storages are built up out of decommissioned BOB batteries, which have a remaining State of Health of less than 80%. Hence, they are not usable for traction applications any longer, but are still good enough to operate in an energy buffer storage. The initial batch of batteries comes from repurchased traction batteries from other buses.
Besides the system preservation components, the energy consumers are the most important actors of the project and Solingen’s urban transportation system. These are on the one hand the trolley buses (including the new BOB as well), and on the other hand charging points (connected to the DC overhead lines), which are to be built in the course of the research project, too. The latter also involves coping with challenges such as time-critical power fluctuations due to the sensitive overhead line, as well as measurements that comply with legal calibration and billing regulations. Therefore, adapted and intelligent charging strategies have to be developed and implemented to increase the all over occupancy rate and efficiency of each charging point. The topics of our chair are all those that are directly related to the bus, as shown in Figure 2a. The first actual bus is shown in Figure 2b.

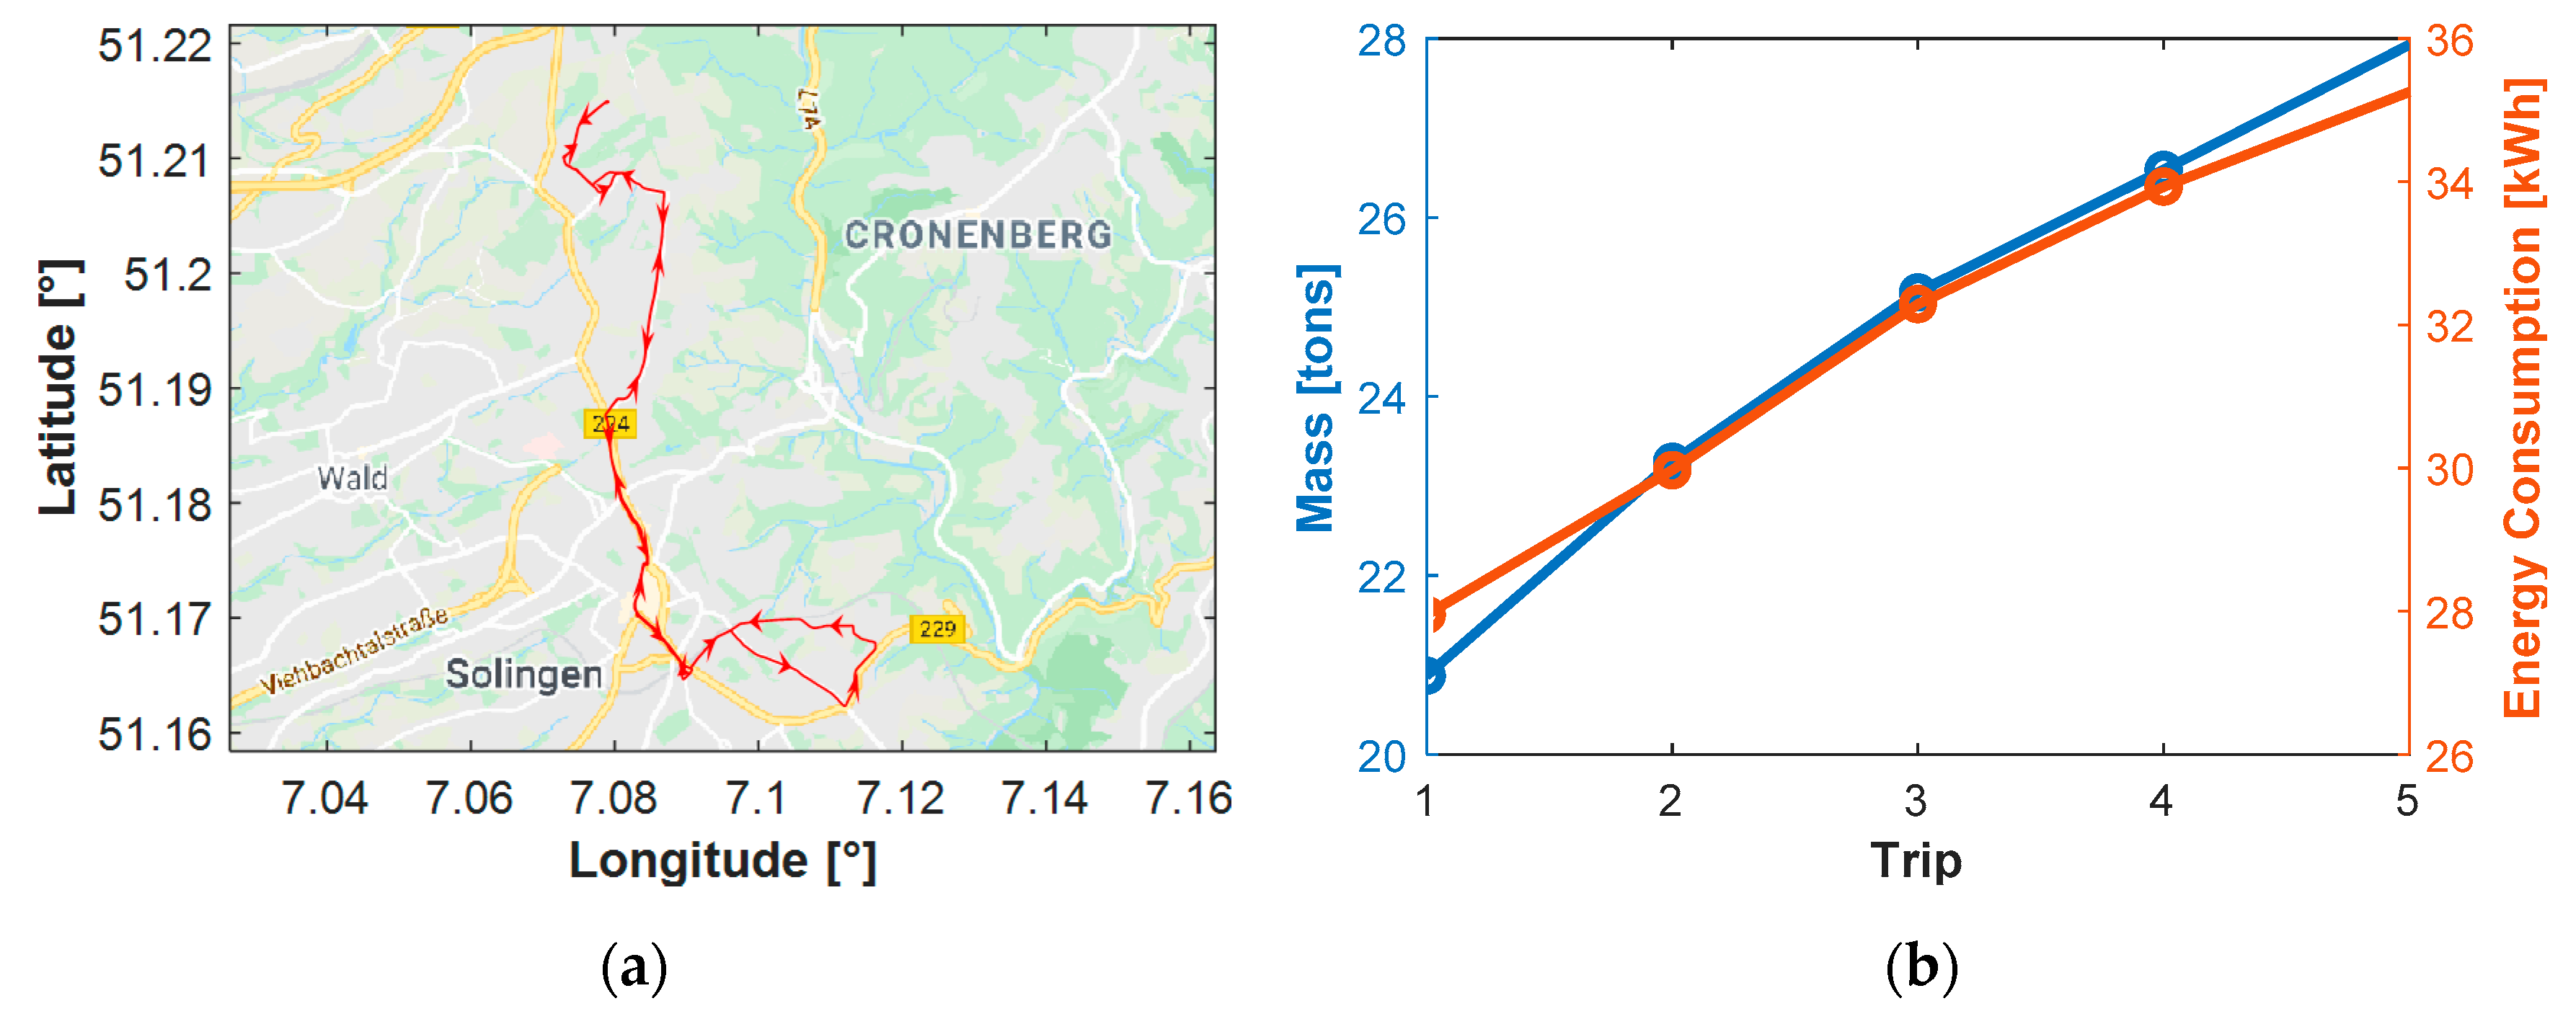
1.3. Topic Introduction

There are currently four battery-overhead-buses owned by the transport company for active (line operation) and scientific use. The choice for the test track fell on the route of the previously diesel bus line 695, as plotted in Figure 3a, since it has a challenging combination of total route length and distribution between overhead (2.3 km) and battery (12 km) mode. As the route is a loop, every meter of altitude has to be driven both uphill and downhill. A data logger with a separate GPS module was connected to the CAN bus of the BOB, and then the test track was traversed with different loads. The collected data were then analyzed in MATLAB, among others, to identify the factors that influence the range of the buses. It is important for this specific topic to underline the impact of higher payloads on energy consumption. The driving force was calculated from the torque and the speed at the output shaft of the two electric motors. In Figure 3b, the mass (in tons) and effective energy consumption including recuperation (in kilowatt-hours) for the different test drives have been plotted. An increase of mass by about 34% from 20.8 tons (nearly empty bus, trip 1) to 27.9 tons (full bus, trip 5) leads to an increase in energy consumption for driving by about the same amount.
Further test drives substantiate these findings, although of course they are subject to slight fluctuations, mainly due to public road traffic and driving style. A larger amount of data from upcoming test drives is necessary to smooth out the curves. Another finding from these test drives were that the currently available mass on the bus fluctuates by more than 2 tons with constant payloads, which leaves a lot of room for improvement.

1.4. Related Work

The sections before show the overall goals of the BOB project and highlight the influence of the vehicle mass on needed traction energy and therefore on the range of the buses. One of these goals is the vehicle mass detection of electric buses by the analysis of vehicles tires and air suspension systems. The following sections present the common methodologies for vehicle mass detection and some selected application examples, which use the information about the current vehicle mass.
In the last few years, interest in the topic of vehicle mass detection has experienced an upswing. The main drivers for this development are autonomous and electric vehicles and the improvement of road safety. The information about the current vehicle mass can be used to improve advanced driver assistant systems (see Section 1.5). The common applied methodologies can be divided into the two categories: “static” and “dynamic”. Static methods are able to detect the vehicle mass while the velocity is equal to zero. Compared to this, dynamic methods calculate the vehicle mass while the velocity is greater than zero. Therefore, one advantage of the static method is the knowledge of the current vehicle mass before the journey starts. For example, the dynamic method presented in [19] needs approximately 80 s to reach vehicle mass values, which are close to the real mass. This is longer than the mean driving time between two urban bus stops, which is less than a minute for this route, and thus not practical. In addition, static methods are able to detect the vehicle mass distribution, which is a great advantage compared to other methods. The need for extra sensors, like high-sensitive tire pressure sensors, is one disadvantage of the static method. The dynamic method usually obtained the necessary data from the sensors of modern vehicles and thus, this method can be cheaper compared to the static approach. The application of sensors to detect the suspension deflection is one common static method and is used in [20]. In addition, further methods, which analyze different tire parameters (tire contact area, tire pressure etc.), have already been presented in [21,22]. These methods have been developed for the application at passenger vehicles. Our method is developed for the application at electric buses and needs to handle some challenges (e.g., moving people), which do not occur in passenger vehicles. In summary, it can be said that no static methods for electric buses which use tire pressure sensors for vehicle mass estimation are known.
The dynamic method presented in [23] uses acceleration sensors to estimate the vehicle mass. A further system [24] applies a state-parameter observer that analyzes the signals of suspension deflection sensors and a vertical accelerometer. Hence, this method combines the strength of both approaches (static and dynamic). The parameters obtained by the dynamic method can also be used to train neural networks for vehicle mass and road grate estimation (e.g., for heavy-duty vehicles) [25]. The analysis of the vehicle’s longitudinal and lateral motion is also a common dynamic method to estimate the vehicle mass [26]. The preconditions for the method presented in [26] are a vehicle acceleration with a small steering angle (longitudinal motion) and the turn of the vehicle at constant longitudinal speed (lateral motion). This means, if the preconditions are not fulfilled, the accuracy of vehicle mass may not be satisfactory. In the context of the system approach shown in this article, the inventors of the patent [27] analyze the tire contact area and tire forces, while the velocity is greater than zero to estimate the vehicle mass. Hence, tire pressure sensors can also be helpful by the application of dynamic methods.

1.5. Scope of Application

The results of the energy consumption measurements of the BOB on line 695 regarding different payloads show that the mass has a significant influence on the consumption and thus the range of vehicles. This finding can also be confirmed by further science publications [21,28,29]. If this influence can be quantified, it can be handled in many cases. However, as stated in [30], in the majority of vehicles no information on mass is available.
The energy consumption of vehicles is mainly based on the aerodynamic resistance force, rolling resistance force, climbing resistance force, and acceleration resistance force. Besides the aerodynamic resistance force, all other resistance forces depend on the vehicle mass [28,31]. Thus, a precise range prediction without the knowledge on current vehicle mass is not feasible. In [32], a method for online mass estimation for electric vehicles is presented. The aim of this method is to realize an optimal charging schedule for electric vehicles based on relevant information like the payload of the vehicle. A further example for the improvement of the range prediction of electric vehicles based on the knowledge of the vehicle mass is shown in [28]. The estimation of the vehicle mass can be also combined with road slope detection [25]. Both parameters are relevant for gearshift controlling systems [23].
In recent years, the range of electric vehicles has increased. Nevertheless, the charging time is still greater compared to refueling conventional vehicles. Hence, the above presented examples highlight that the vehicle mass is an important parameter to optimize the utilization of the energy stored in the high voltage battery of electric vehicles.
Furthermore, knowledge about mass and mass distribution would improve different safety aspects, ranging from improvements in adaptive cruise control to further safety systems like rollover mitigation [33,34]. For example, the knowledge about current vehicle mass can be used to enhance the control performance of autonomous and electric vehicles [35]. The topography, breaking and acceleration events, and routes with many curves can lead to a load transfer. Hence, if the vehicle mass as well as the load transfer is known, the control of autonomous vehicles for emergency maneuvers can be optimized as well [36]. For vehicle dynamic controls and the trajectory of autonomous vehicles, different methods have been already introduced in the last few years. Some of these methods use the so-called model predictive control (MPC). The authors of [37] emphasize that these methods need many parameters, like tire data and payload. Therefore, the system presented in this article can be a helpful tool to improve the dynamic control of autonomous vehicles by tire pressure monitoring and vehicle mass calculation, respectively. A lane keeping system (LKS) is a further application example that may benefit of the information about the vehicle mass [38]. Furthermore, safety aspects are not the only motivation for the estimation of the vehicle mass. The driving comfort can also benefit by the application of the systems mentioned in this section [24]. A further application example can be the vehicle mass estimation of electric trucks. The vehicle mass of trucks can vary up to approximately 400% [24]. Hence, electric trucks can benefit by these systems as well. Thus, the growing spread of electric vehicles and the great number of activities of automobile manufactures in the field of autonomous vehicles show the high relevance of systems for vehicle mass detection regarding future mobility.
In the European Union [39] and the United States of America [40] tire pressure monitoring systems are required for cars by law to enhance road safety and to reduce GHG emissions. In the case that this regulation may be expanded to buses and trucks, the presented system for tires could become even more attractive for the manufacturers of buses and commercial vehicles, as it can fulfil the regulation, while offering the additional advantages that come with knowledge about mass and its distribution.

2. Materials and Methods

Now that the indispensability of the vehicle mass for an accurate range prediction—and therefore the whole smart-trolley-system, as well as all the other scopes of application—has been clarified, the three investigated approaches to mass estimation will be briefly presented. This will be followed by some details regarding the used hardware and software for the results presented in this article.

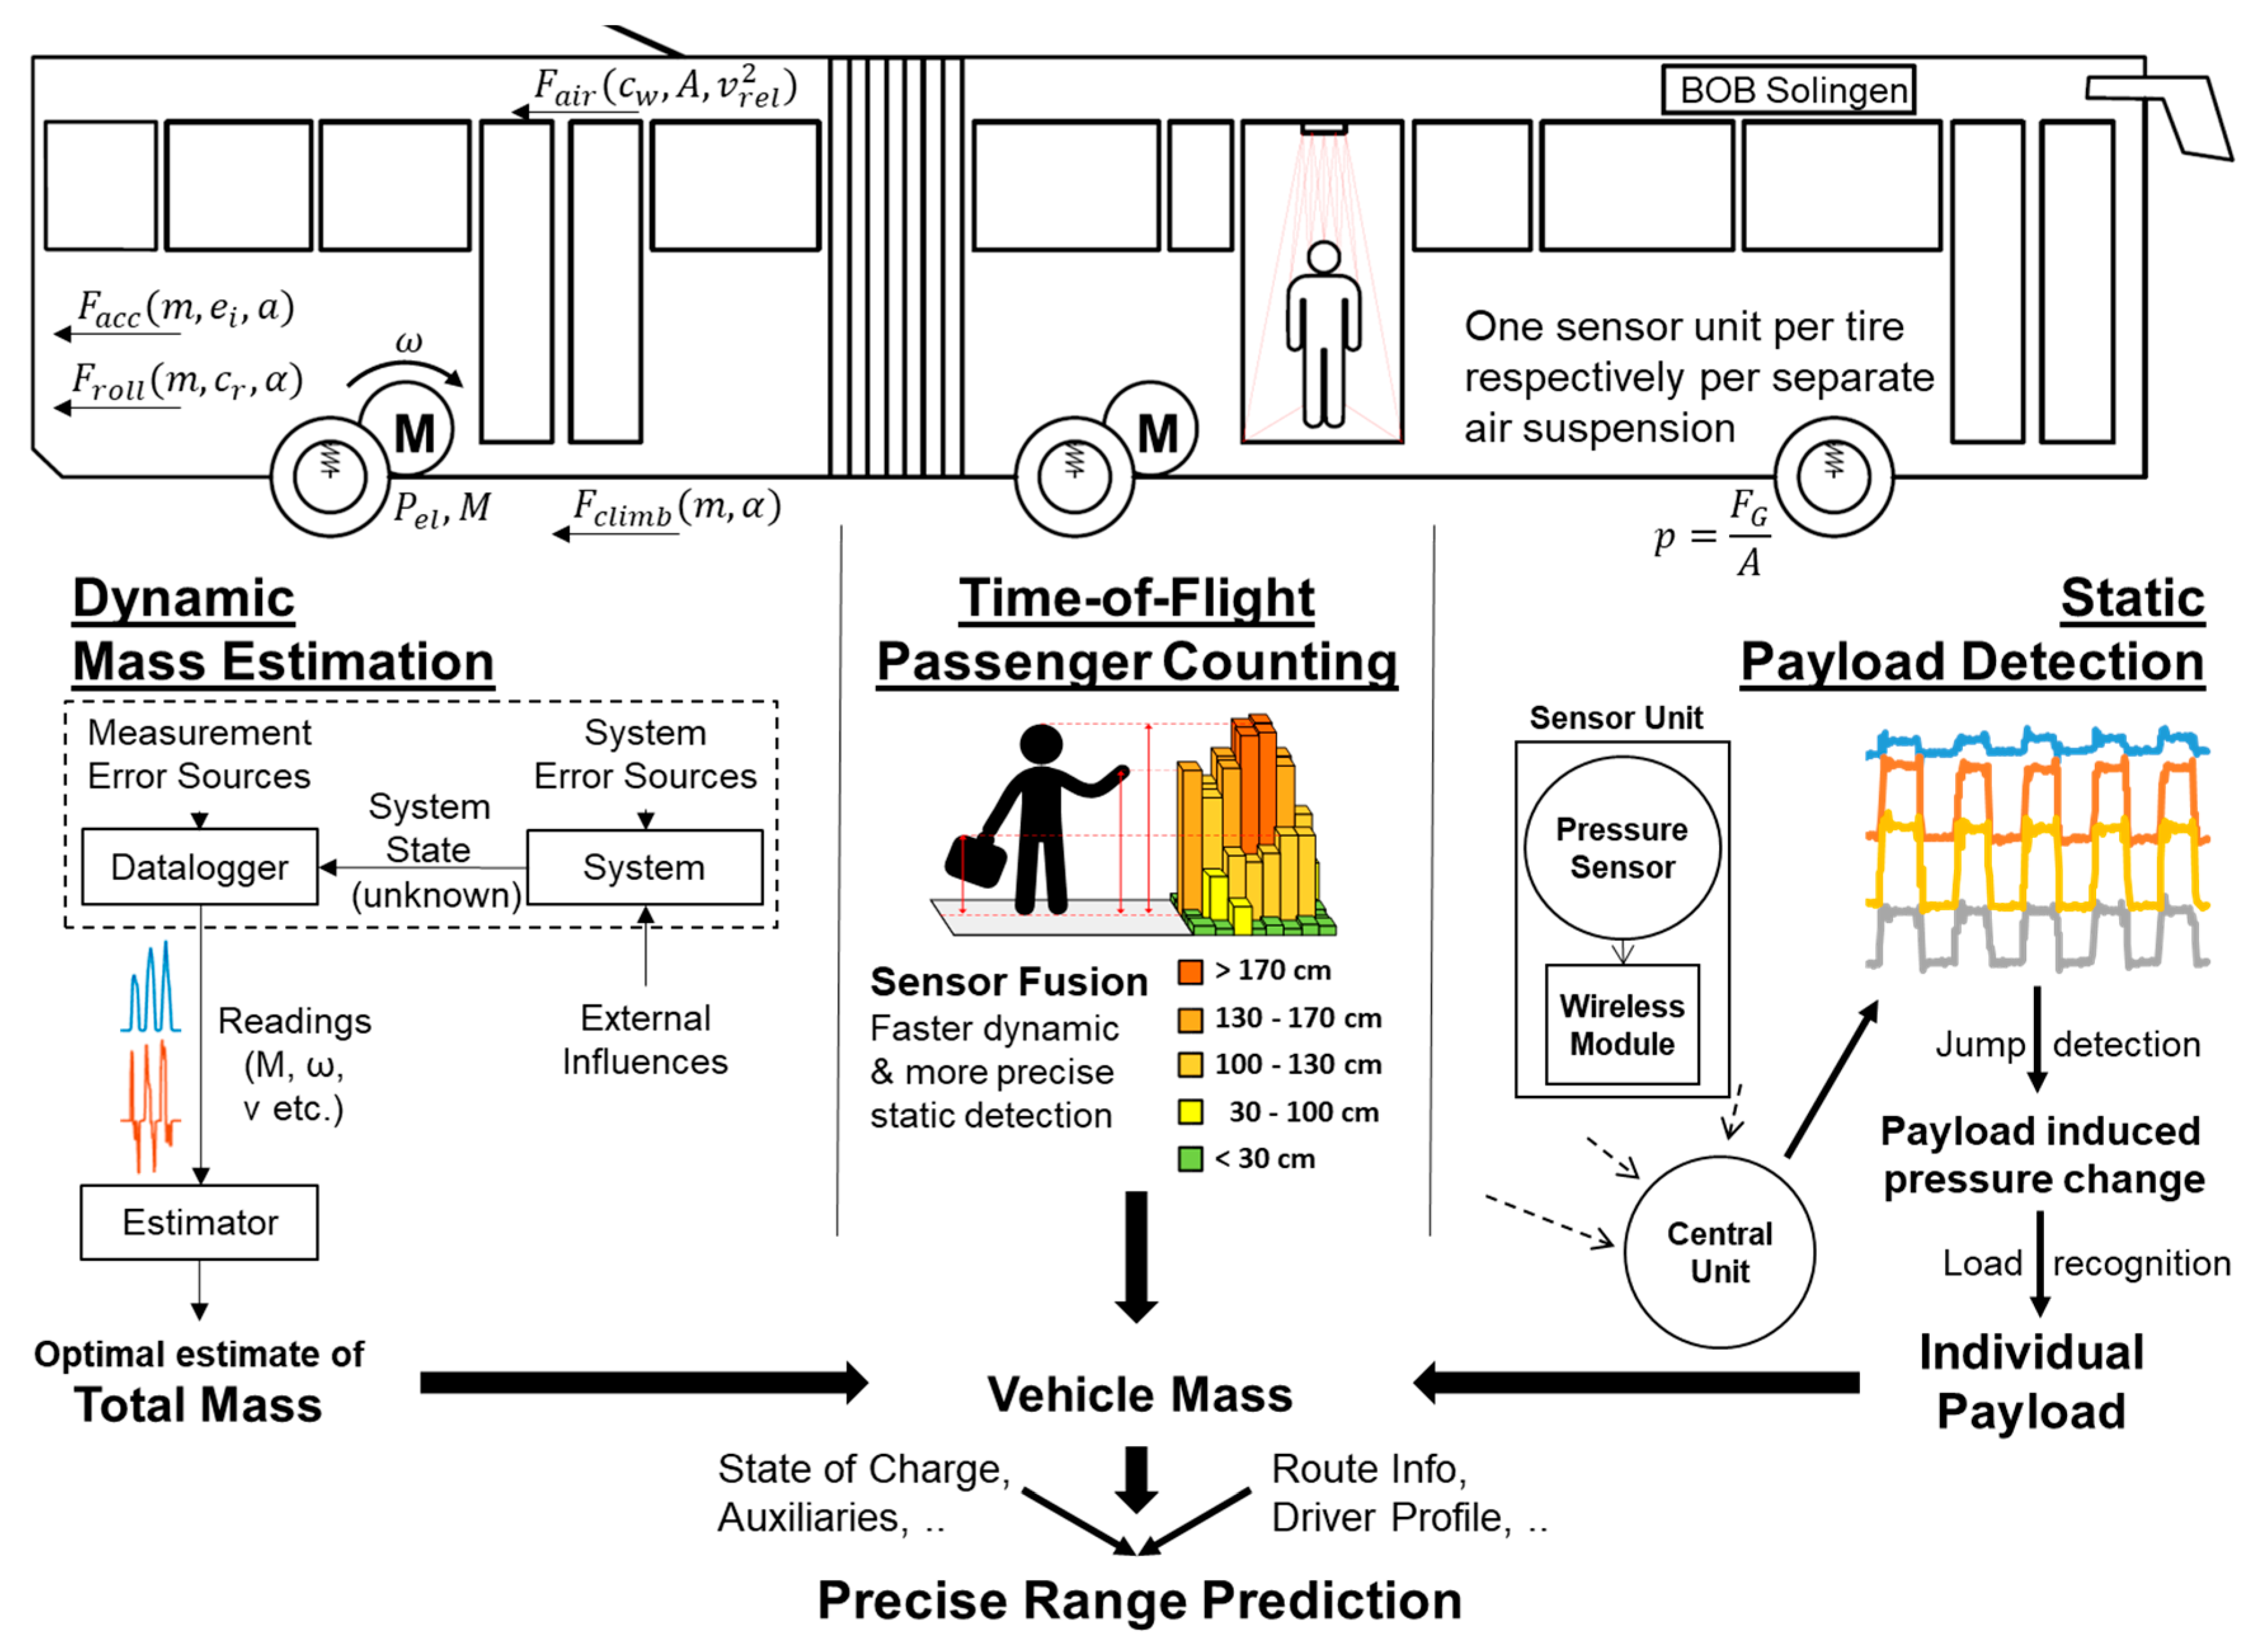
2.1. Overall Concept

The general goal of this study was to provide information on vehicle mass as fast, reliably and precisely as possible, and with the most cost-efficient hardware. In terms of sensor fusion, a three-layered concept was pursued, as shown in Figure 4 and described below.

2.1.1. Dynamic Mass Estimation

This method only needs information provided by the bus’s already existing sensors, like motor torque and speed. By solving the dynamic driving equations for the mass and filtering out implausible pairs of data using a state observer, it should be possible to estimate a converging mass—given there are enough high dynamic events. Testing has currently started with the first available yet limited datasets. The data include measurement values of, for instance, motor torque and speed, and is compared to the expected results from the physical traction force equations containing the acceleration force and other forces and variables. Nevertheless, as these neither are the main topic of this article nor are needed for comprehension, they will not be considered further.

2.1.2. Time-of-Flight (ToF) Passenger Counting

This approach is based on the application of an advanced automatic passenger counting (APC) system. Most APC-systems are based on simple light barriers. But there are also widespread and similarly priced systems that use ToF-Sensors. These have the ability, in addition to merely counting, to also record the height profile of persons, which allows, at least statistically, conclusions about the approximate weight. Since such a system was to be installed anyway, it is self-evident to have chosen a ToF-based one. Initial tests in our laboratory have shown the reliability but also the inaccuracies of the system. Further tests will be made to determine the possible accuracy by using more complex image analysis methods.

2.1.3. Static Payload Detection
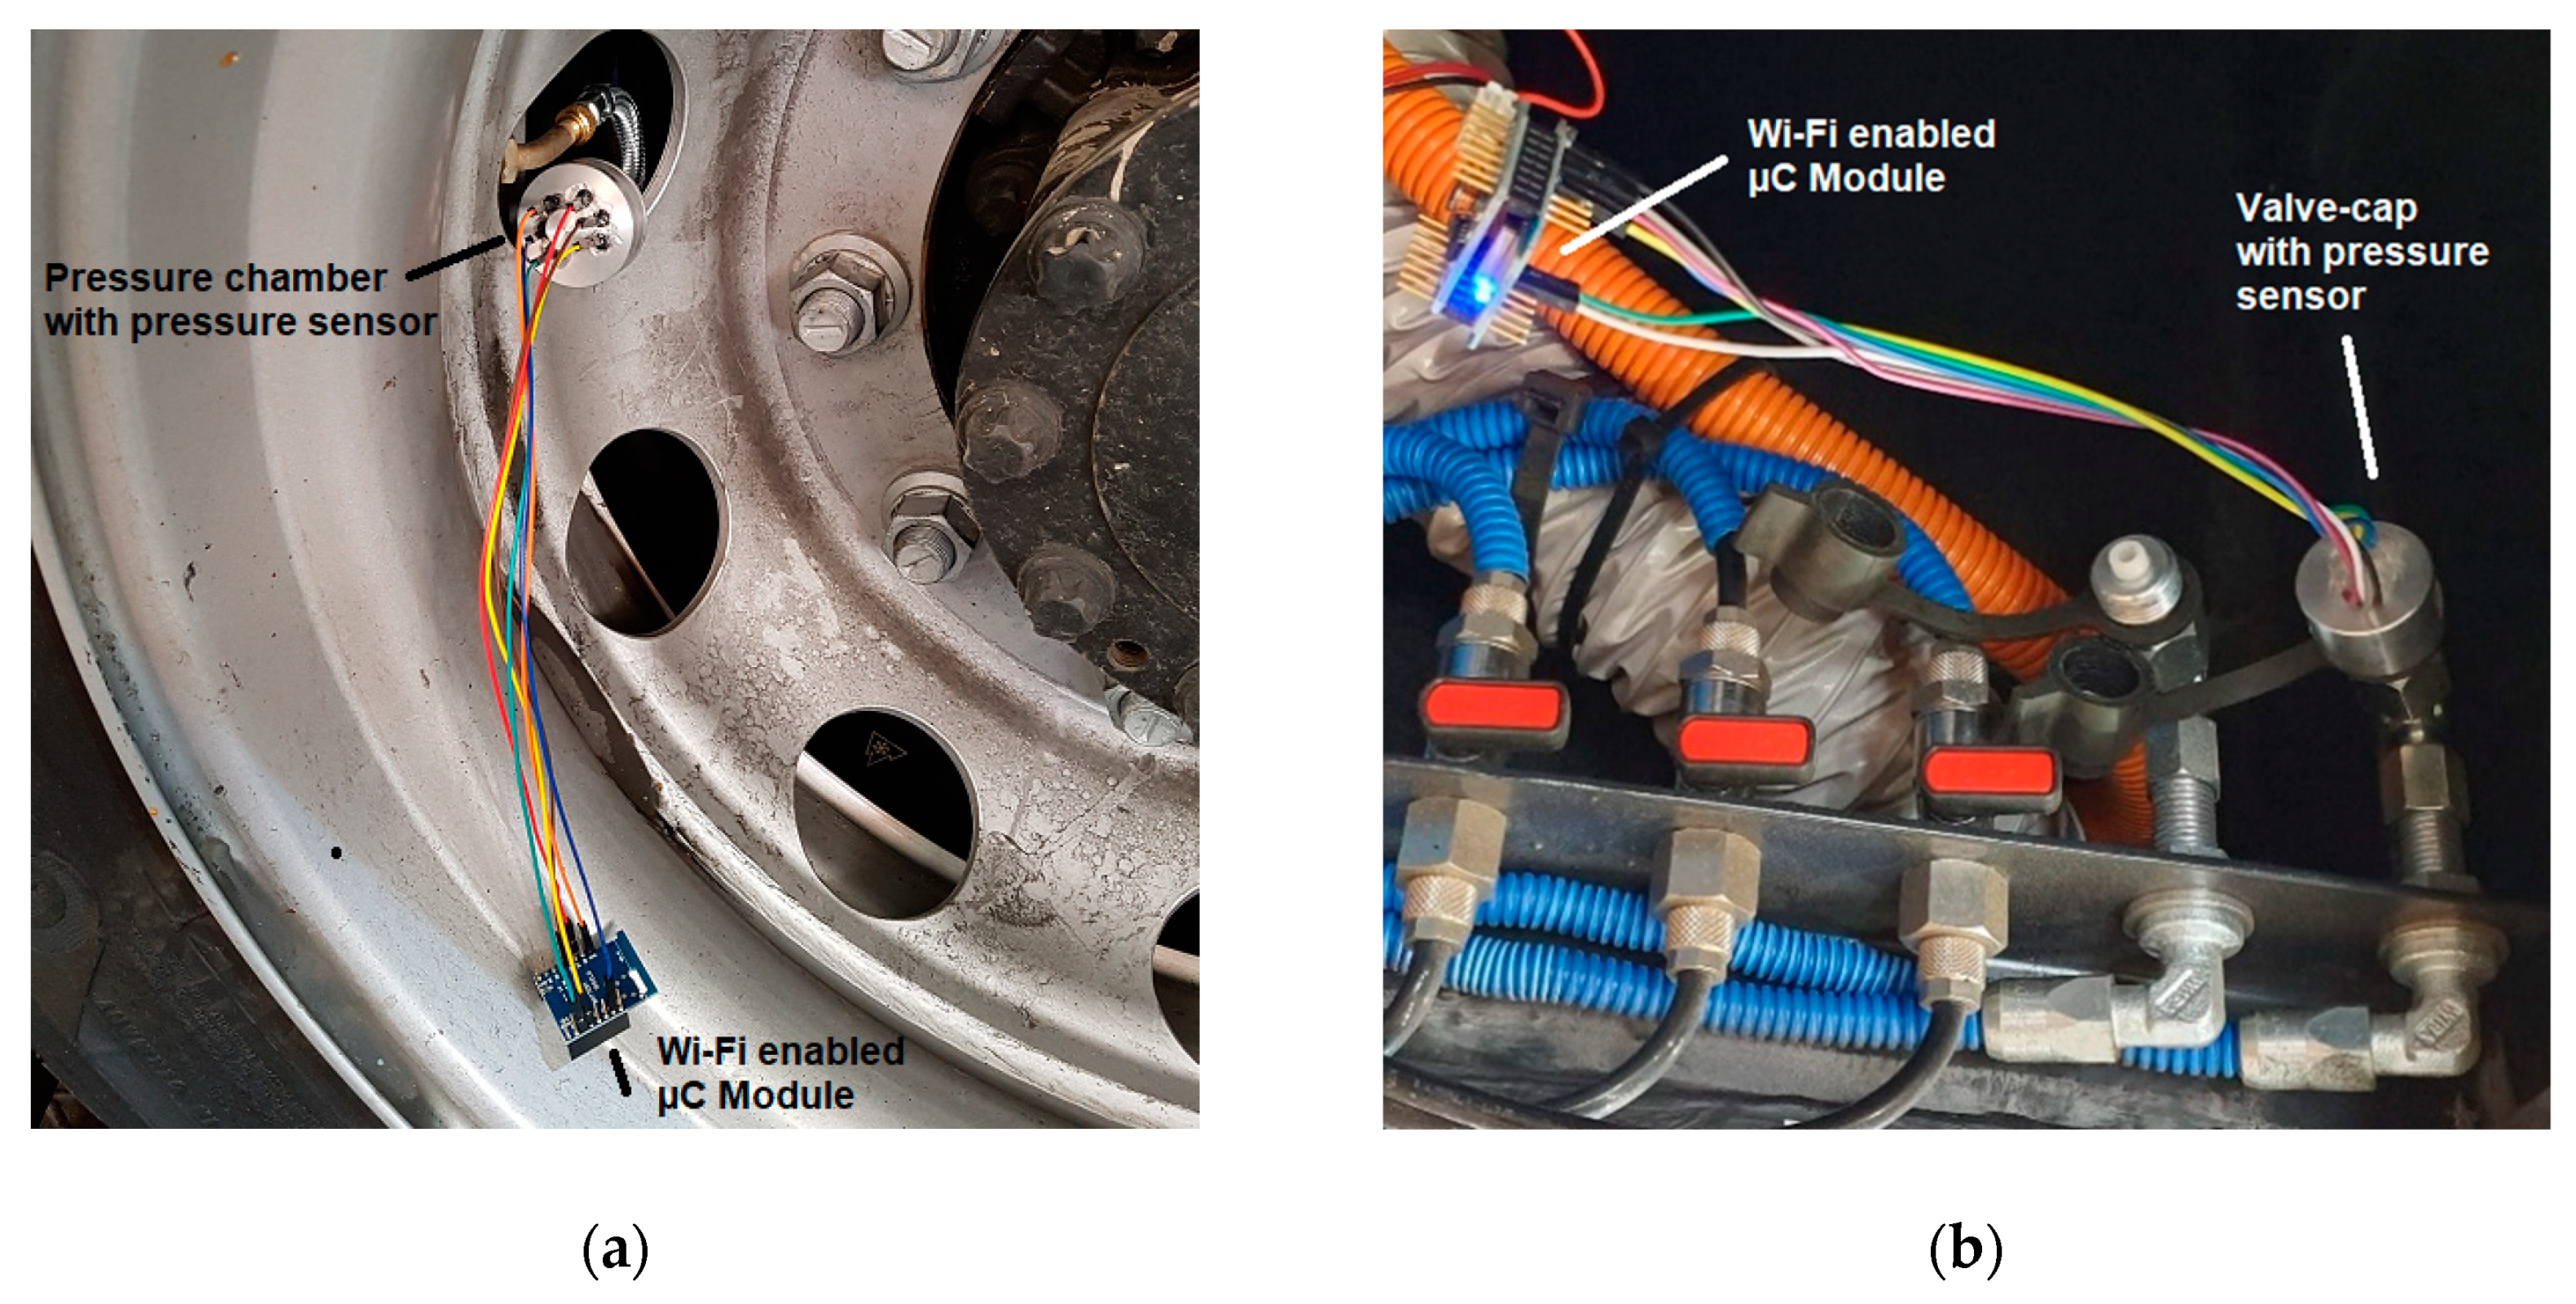
With cost efficient sensor units, developed by ourselves, and custom tailored algorithms, it is possible to convert small changes in tire or air suspension pressure into payloads. This is a reliable approach already successfully tested on car tires with the highest stand-alone potential [41]. The feasibility for buses was doubted for some reasons explained later, but as this article will show, it is also a promising approach here. A combination with both of the aforementioned approaches at a later time should even further increase the accuracy and reliability of the static mass detection.

2.2. Used Hardware

The sensor units used for all the presented measurements on the bus are based on the high resolution pressure sensor module MS5803, consisting of a piezo-resistive pressure sensor and a 24 bit analog-to-digital-converter (ADC). Two variants of the sensor are used. One that delivers up to 0.04 millibar resolution in the necessary range of up to 7 bars for the air suspension and one with up to 0.2 millibar resolution that can withstand up to 14 bars for the tires. Wired to the ESP8266 based microcontroller board Wemos D1 Mini and glued into custom-made valve extensions, pressure data can be collected using SPI, sent via Wi-Fi and stored in an SQL-database. The tire sensor prototype, as can be seen in Figure 5a, is especially designed for hassle free testing during the development stage to overcome the need for tire changes and to allow easy debugging. In a further stage, the transition to a Bluetooth 5 Low Energy based microcontroller will be made in favor of the significantly reduced energy consumption and smaller form factor. Moreover, after finished development the tire sensor unit could be mounted on the rim inside the tire, as most standard tire pressure monitoring systems do. The air suspension sensor shown in Figure 5b was a first attempt to minimize the sensor size.

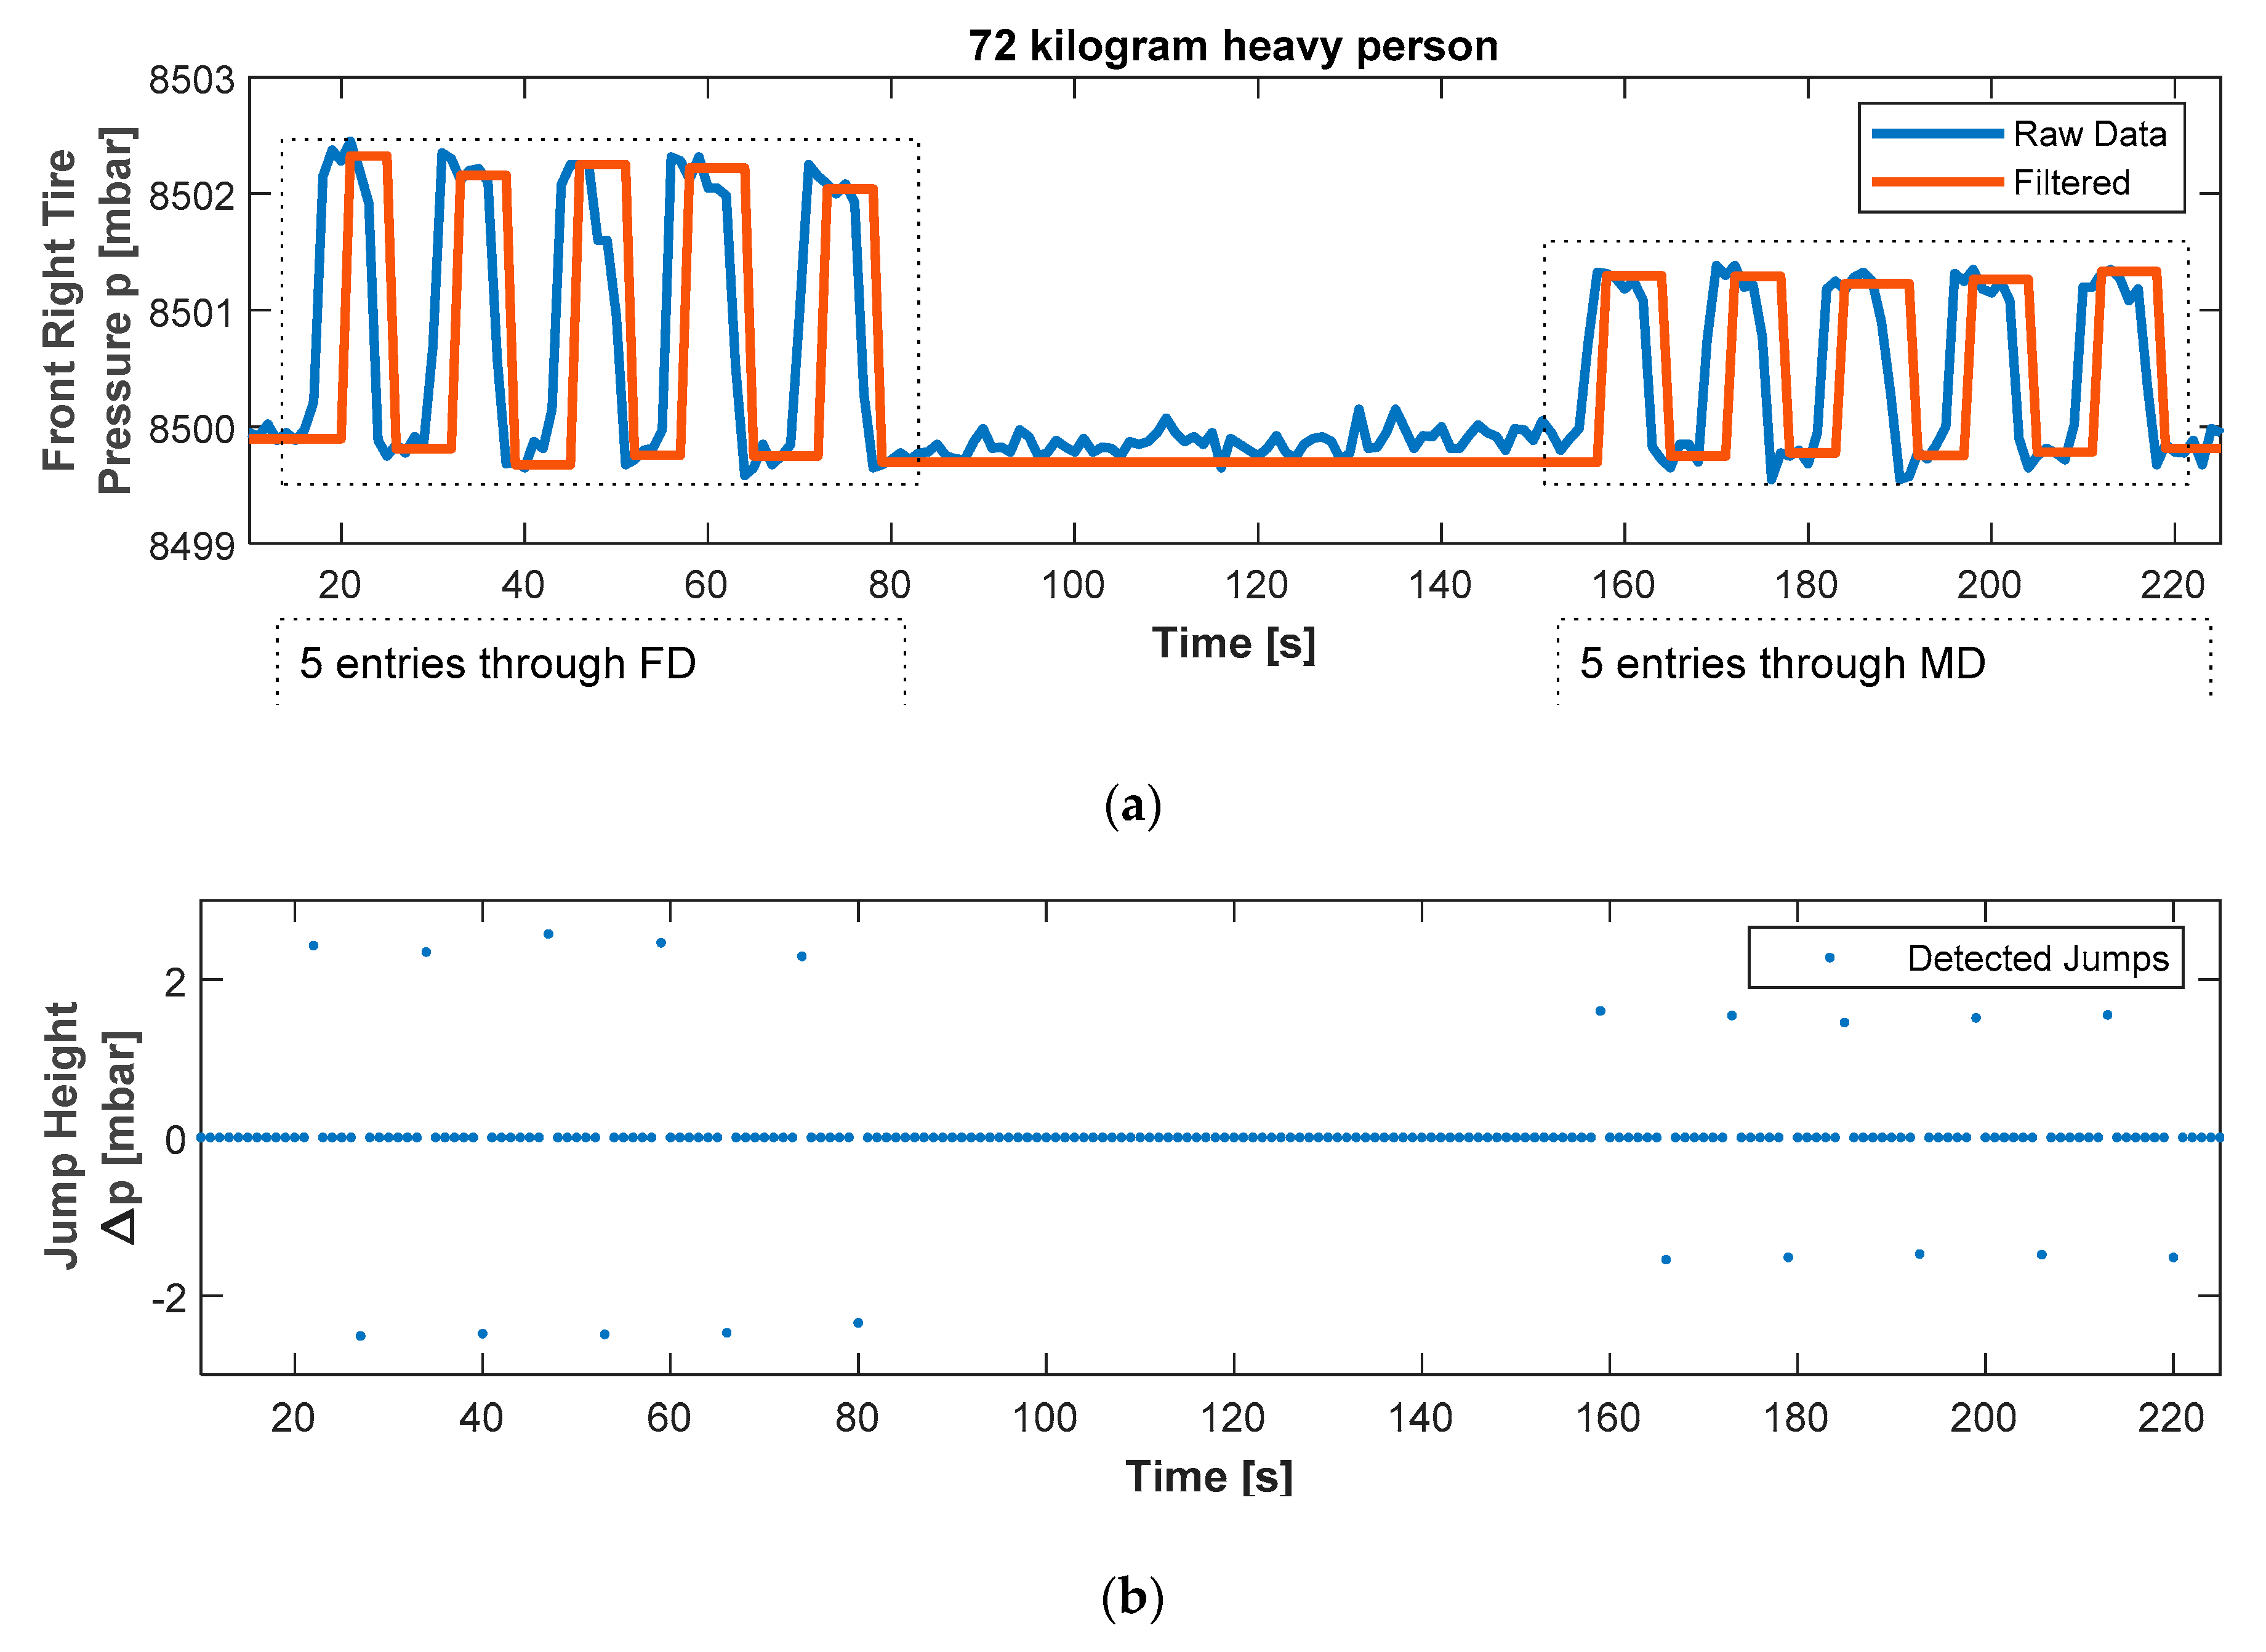
2.3. Filter Algorithm

The idea behind the algorithm is to detect a step in the pressure inside the air suspension or tire and, depending on the height of the step, the mass is calculated. The algorithm starts by calculating the variance s 2 of the last n v a r time steps. The running variance is computed by the two-pass algorithm, which, in the first step, computes the mean pressure
p ¯ = 1 n v a r   i = 1 n v a r p i ,
where p i is the respective pressure value and n v a r is the count of pressure values. This is followed by calculation of the variance
s 2 = 1 n v a r 1 i = 1 n v a r   ( p i p ¯ ) 2 .
In the next step, it is checked if that variance exceeds the bound s 2 l i m , and if it does, a counter t c is triggered and the time t j is saved for later reference. The counter t c is incremented, while the variance of the pressure is above the bound s 2 l i m . As soon as the variance drops below the bound, the counter is checked to see if it has been active for a minimum duration of t j , m i n . If the counter has not been active for a sufficient time, it will reset to zero, and the algorithm starts checking the variance for deviations again. If the counter was active for a time t j , m i n , the mean value p ¯ s t a r t of the step position is saved. For the next t m time steps, the mean value is calculated. Once t m time steps have been reached, the absolute difference of the two mean values for the start and end position of the step are compared
Δ p = p ¯ e n d p ¯ s t a r t = i = t j ± t c t j + t c + t m p i i = t j t m t j p i .
If the difference Δ p did not exceed the minimum value for a step p m i n , the values for step position and the mean values are deleted. Otherwise, (if the difference is greater or equal than the bound p m i n ) the mass m payload that was the cause of the step is calculated with the measurement-based quadratic equation
m p a y l o a d = c o n s t a Δ p 2 + c o n s t b Δ p .
At the same moment, the algorithm starts again and is ready to detect the next entry. The constants vary with chassis and tire type. For largely varying initial tire pressures, another linear correction factor can be added to the whole equation. Derived from the experiences with cars, it is expected that inclusion of all 10 tires of the bus will increase the reliability of step detection and the accuracy of mass detection. The same filter can be applied to the air suspensions pressure curve as well.

3. Results

This chapter introduces and discusses the results of the tire and air suspension measurements separately, before finally comparing them in the discussion chapter.

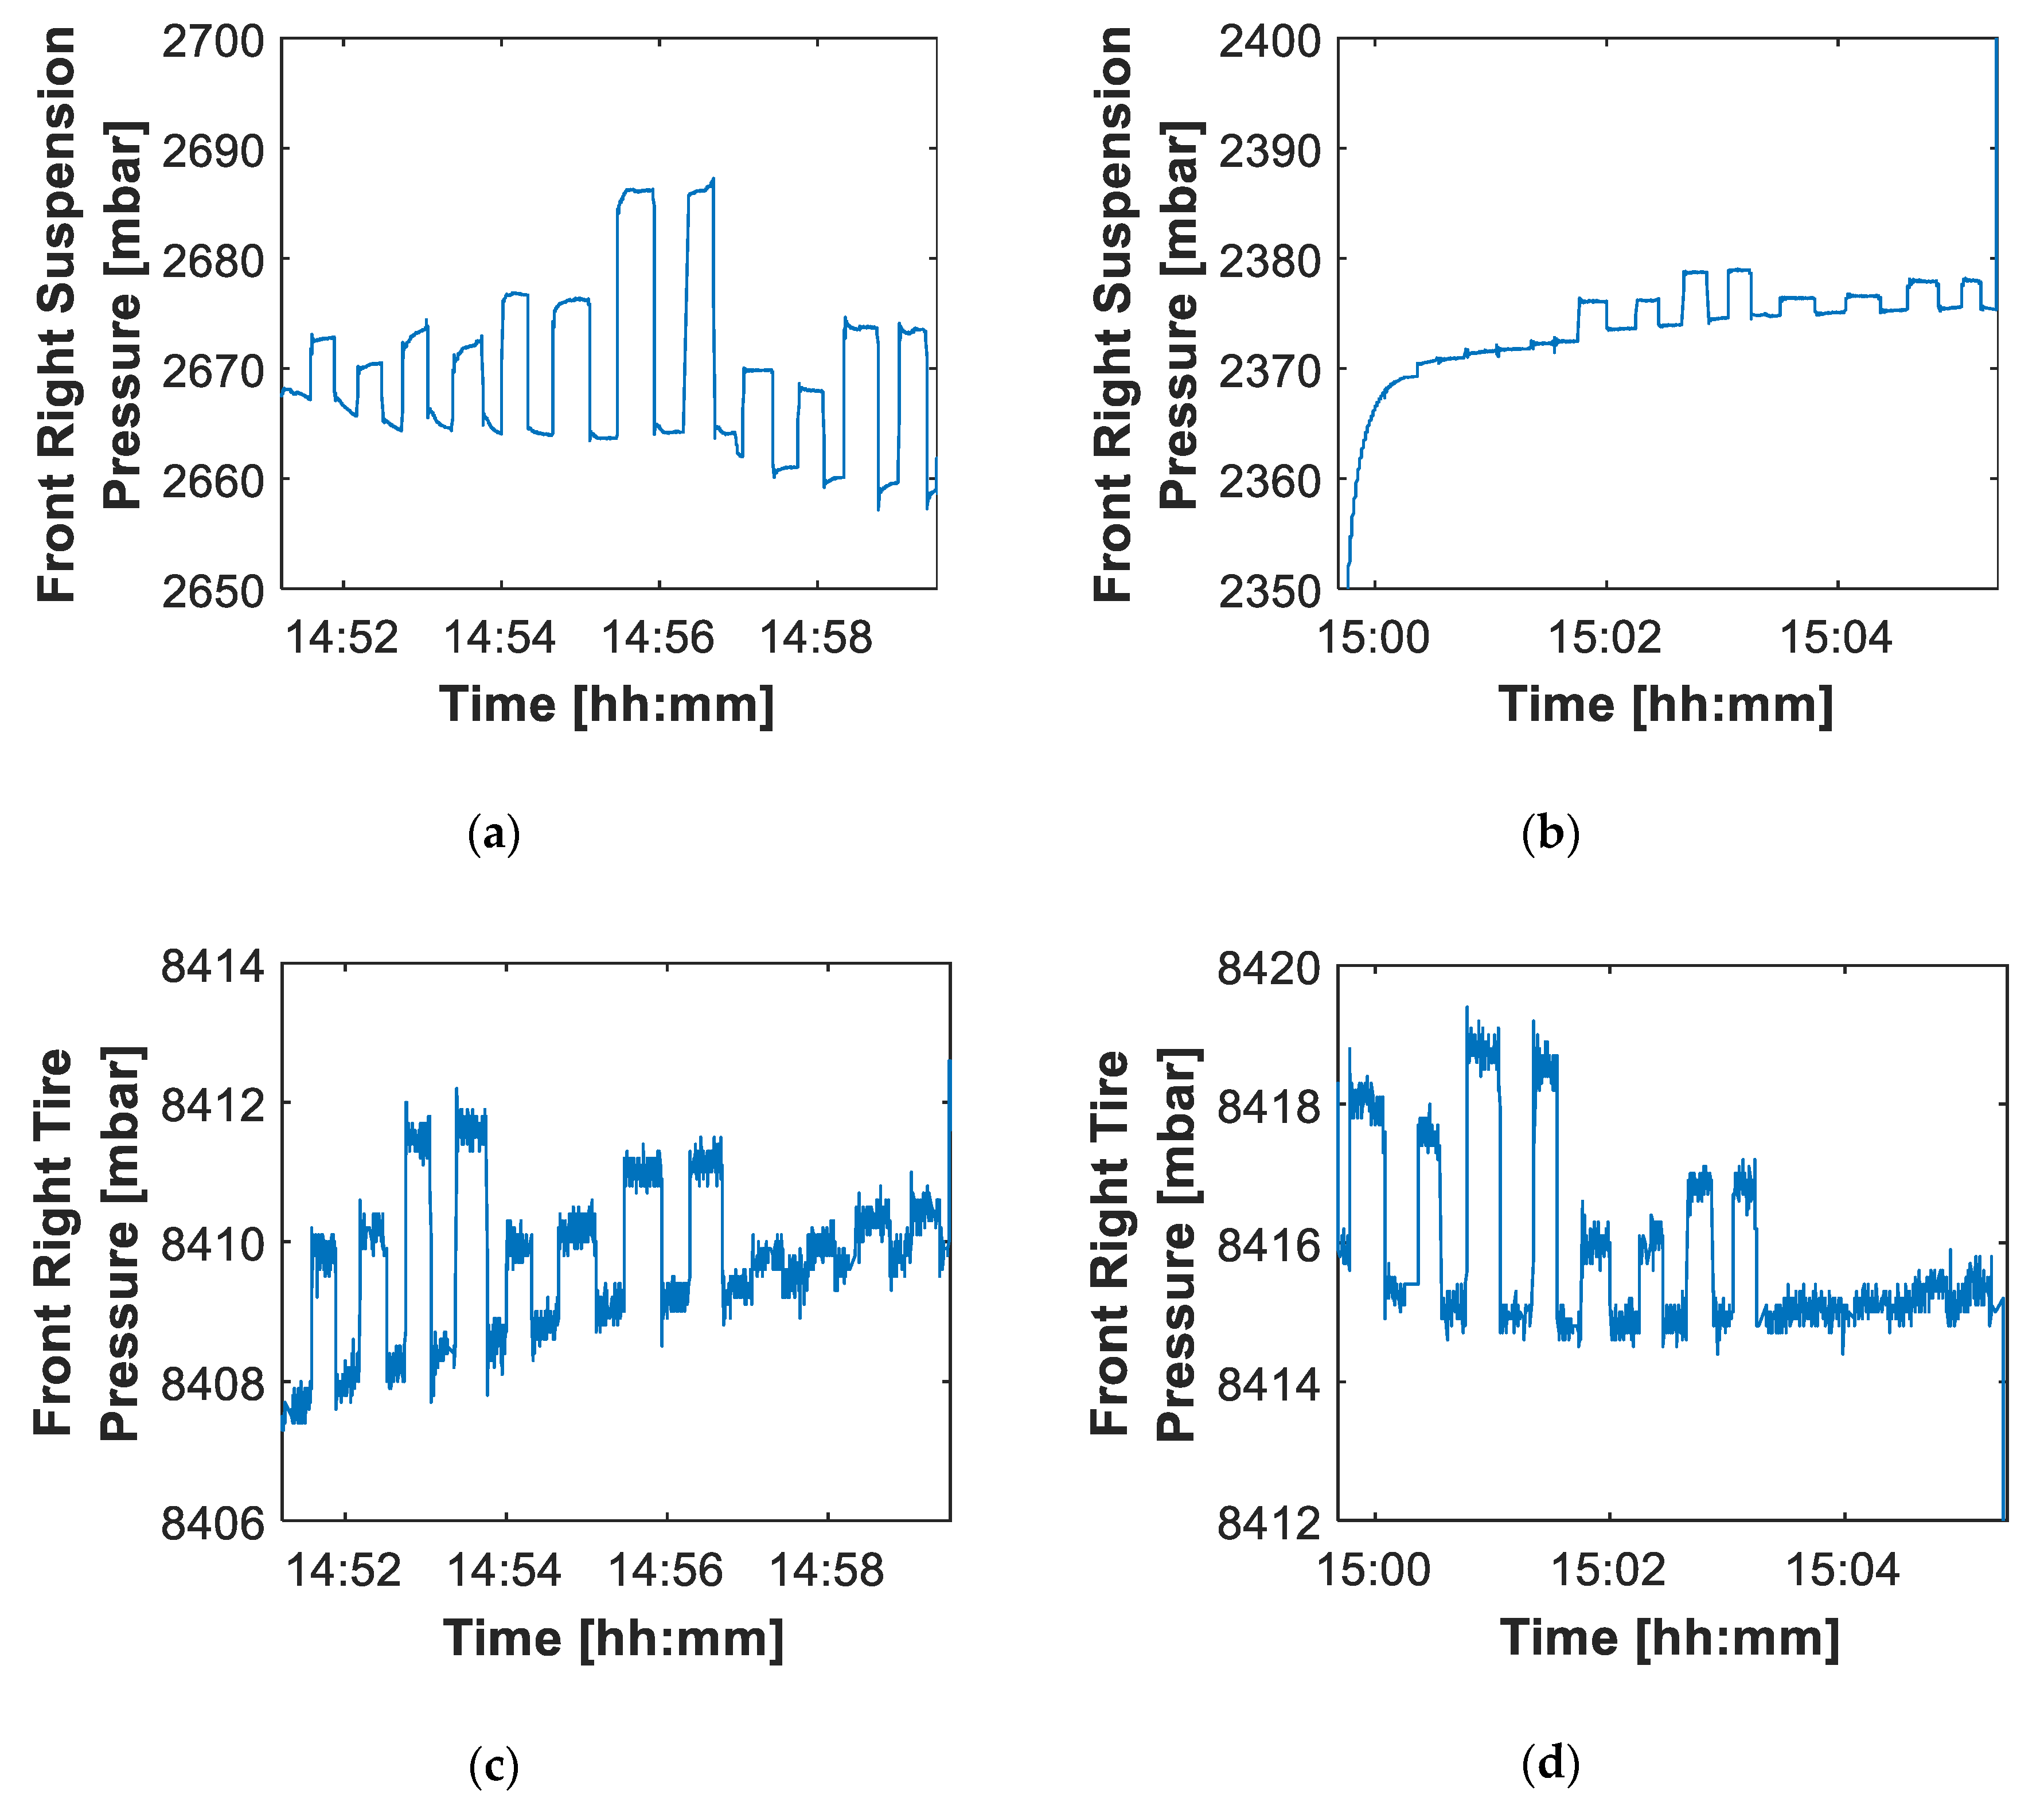
3.1. Measurements on the Tire

This section is used to present the tire measurement results. Where applicable, the differences and similarities to previous tests with cars will be shown, and topics that need further investigation will be pointed out.

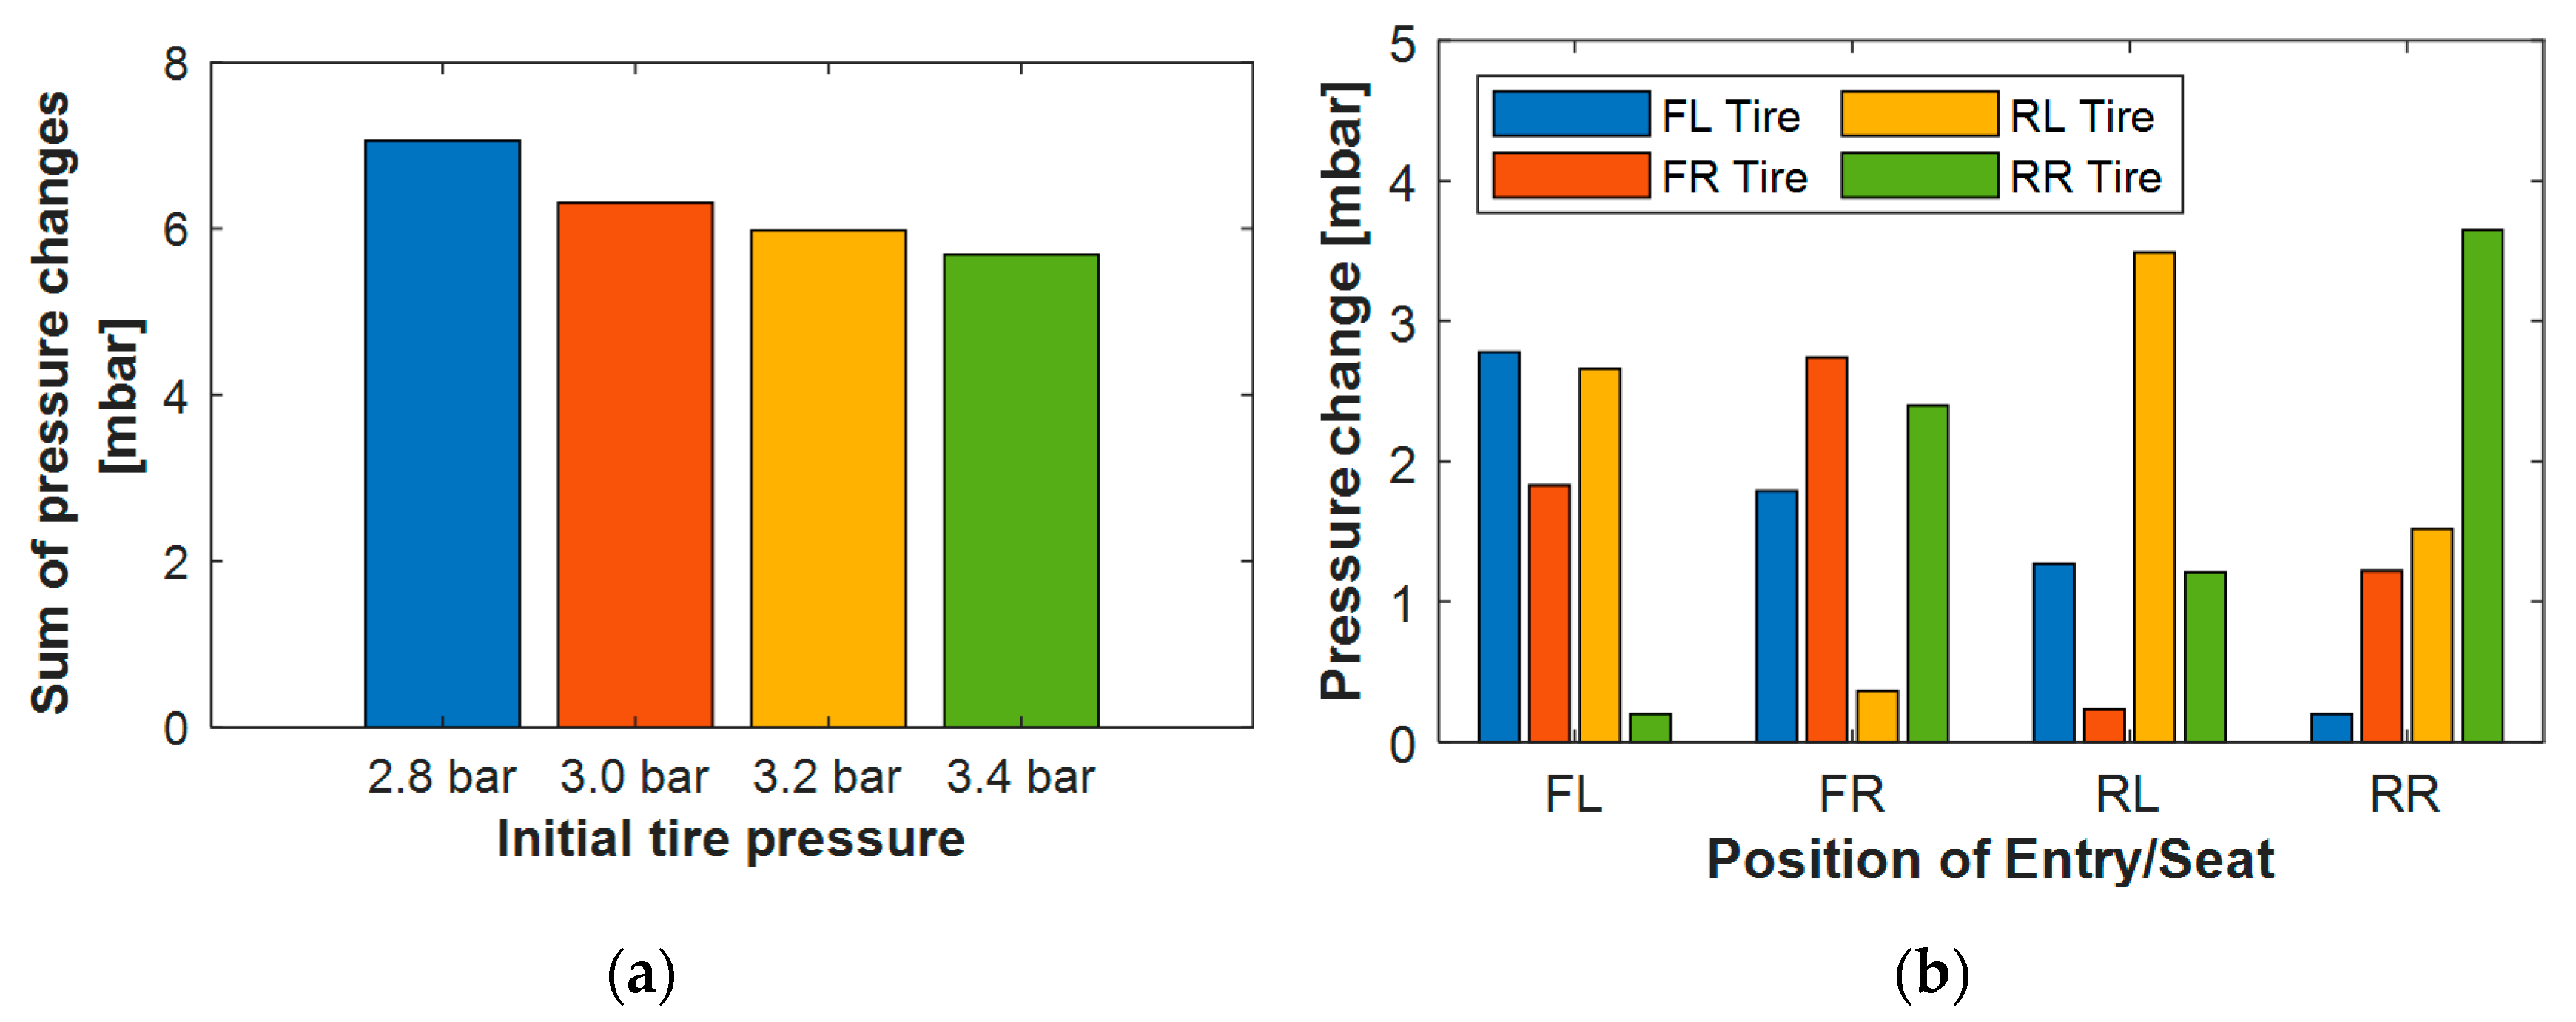
3.1.1. Influence of Initial Pressure

Increasing the initial pressure of the tire has already led to a noticeable reduction in pressure steps by cars (see Figure 6a).
As the initial pressure of bus tires is three times higher and the resolution of the pressure sensor for this larger area is less accurate, only one sensor was carefully manufactured and tested in the beginning. Therefore, the results discussed in detail below exceeded expectations.

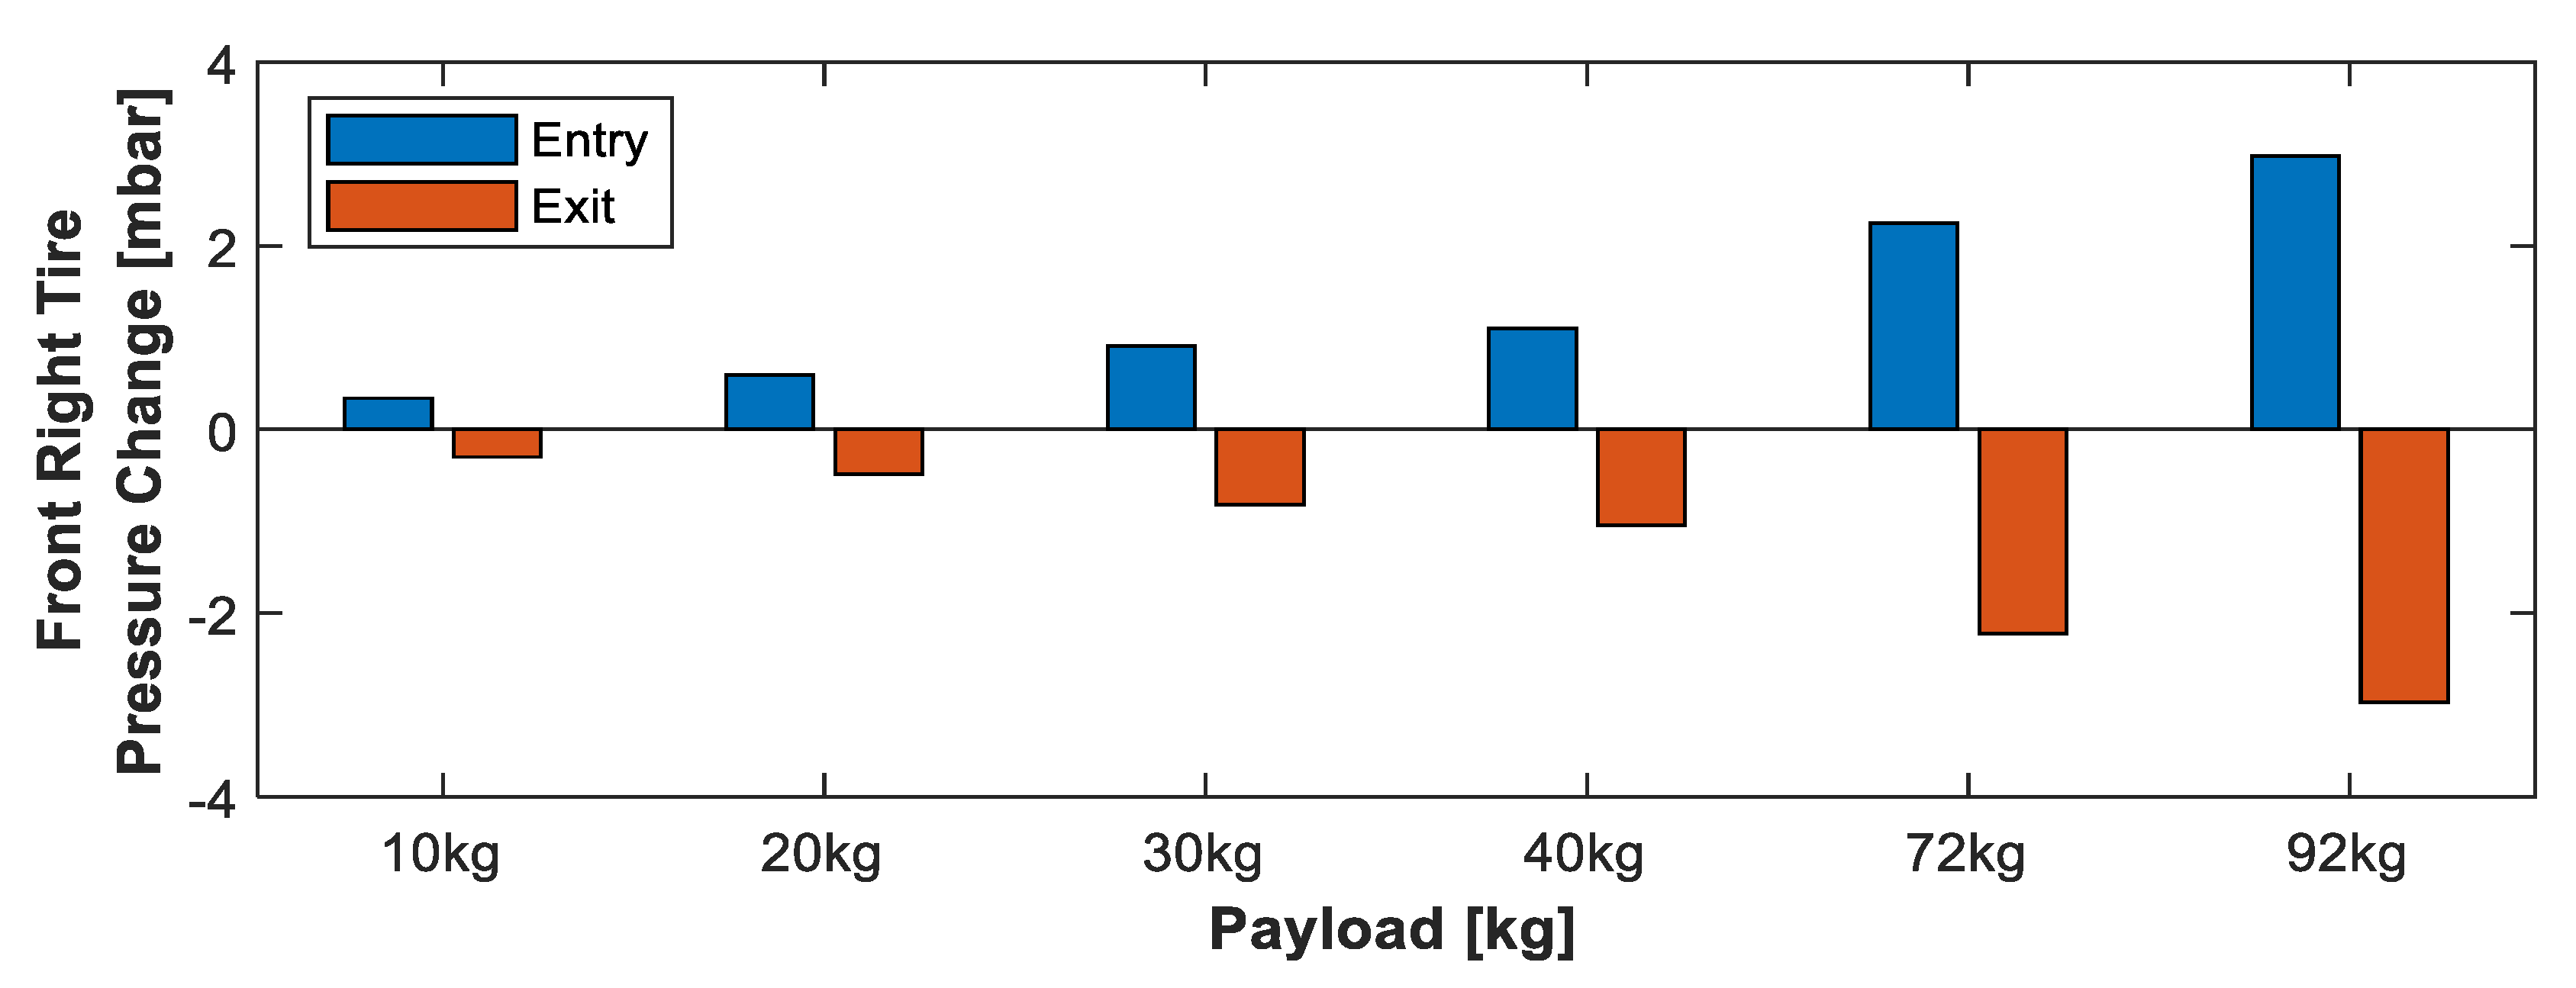
3.1.2. Influence of Entry Position

As seats, doors and tires are not symmetrically aligned, the induced pressure changes vary with the entry and seat position, as can be seen in Figure 6b. Fortunately, in standard passenger cars the entry position can easily be identified, as the pressure change in the diagonally opposite tire (related to the seat-position) is significantly lower than that in all other tires. To explain the pressure distributions, Figure 7b presents a schematic drawing of the involved vehicle parts.
The rear seats are much closer to the rear tires, whereas the front seats are placed more centrally between the front and rear tires. This results in significantly greater pressure steps for the respective rear tire, if somebody sits down on the back seats. For the front seats, changes in tire pressure are more evenly distributed.
In order to allow a precise conversion of the detected steps into weights, this is essential information for the further development of the algorithm, and must therefore be observed. Even in the sum of all tire pressures, the entry position is not negligible. For example, have a look at the dotted bars in the middle of Figure 7a. Without knowledge about the entry position, it is not possible to distinguish between a 72-kg person in the front row and an 81-kg person in the back of a car. With ten tires, three doors on the right side of the trolleybus and simultaneous entrances and exits in any combination, this will be an even bigger challenge for the bus. If a filter alone cannot solve this satisfactorily, it is possible to combine the system with an automatic passenger counting system. Figure 7b illustrates the tire and seat positions for the reference car, and Figure 7c illustrates the tire, air suspension and door positions of the bus and how they will be referenced. The tire sensor unit was attached to the front right tire (FR) of the bus, next to the front door (FD). In the upper part of Figure 8, the raw and filtered pressure values from tire FR are shown for five successive entries, each by the front and middle door, of a 72-kg person. The lower part of Figure 8 shows the detected changes in tire pressure, determined by the aforementioned algorithm, which can then be converted into weight. The payload-induced pressure-steps can be clearly distinguished from measurement noise. All entries presented in Figure 8 were made by the same person, but as the front door is closer to the front tire, the induced pressure steps differ in height. This leads, as already mentioned before, to the need for a filter, which is able to distinguish between the different entry positions, either based only on the pressure values of all ten tires or with the help of a passenger counting system.

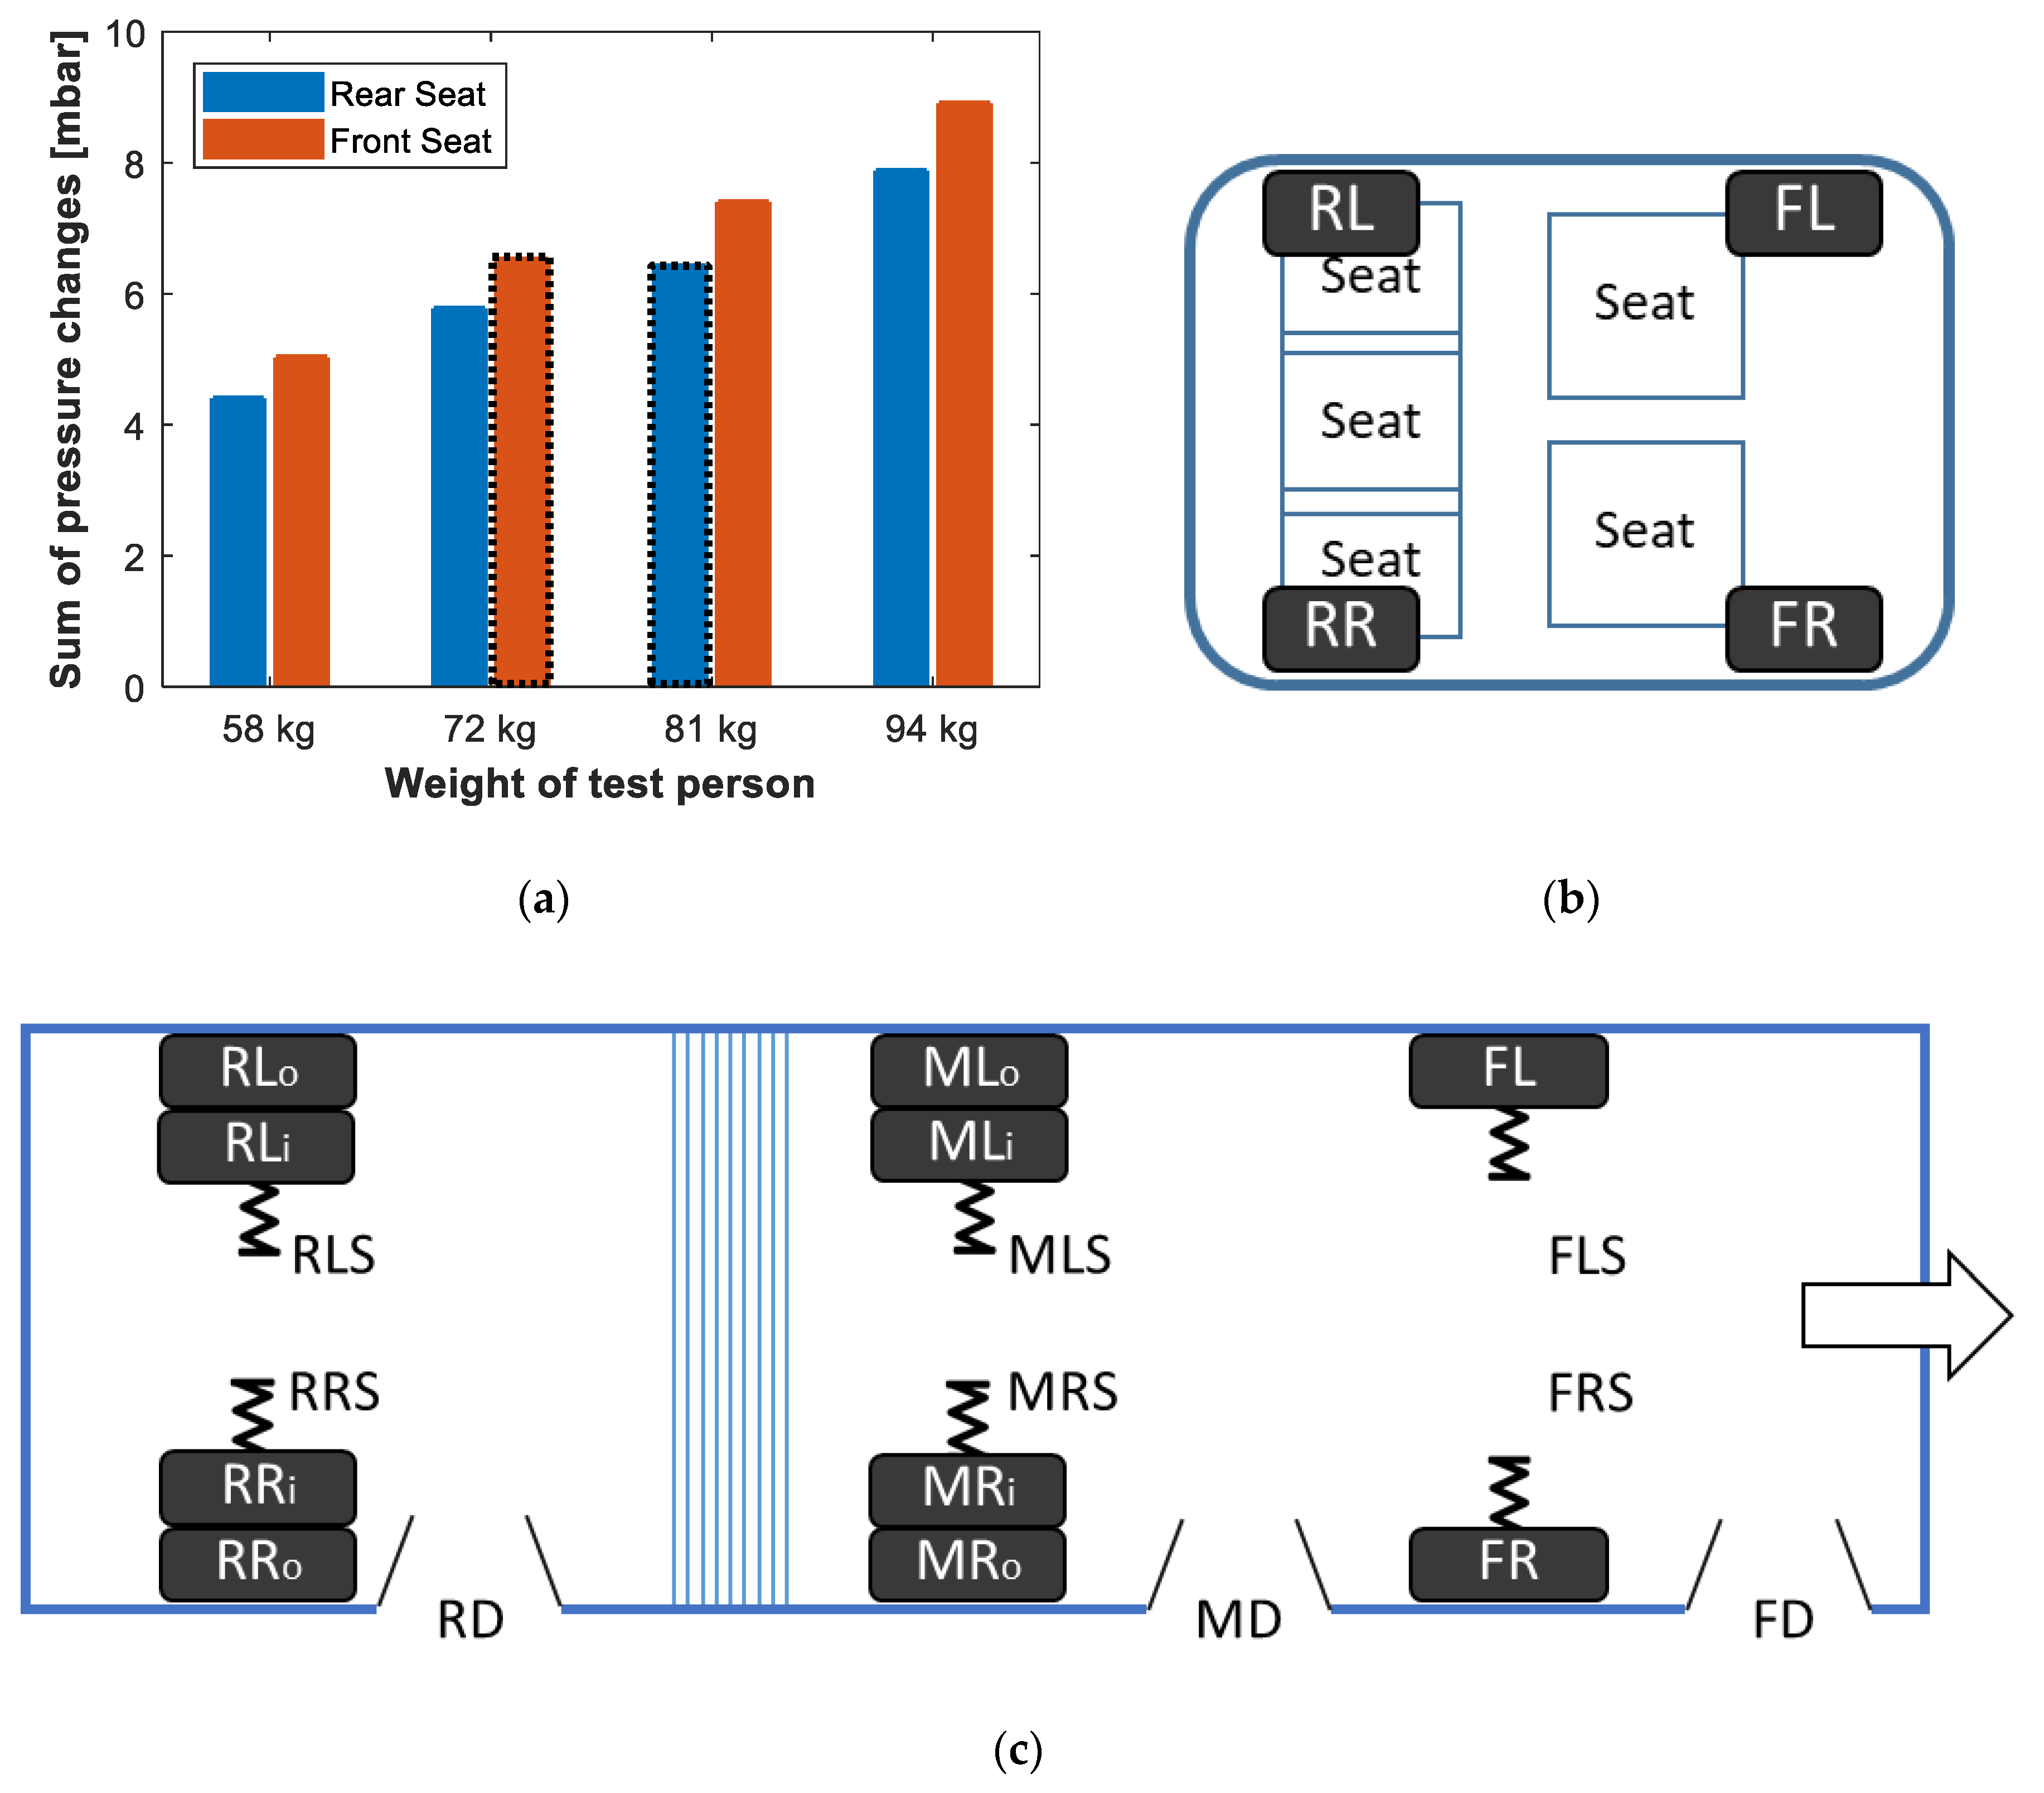
3.1.3. Proportionality of Pressure Steps and Weight

Further tests were performed to determine the detectability of different and especially lower weights. In order to be able to estimate the possible accuracy, it must be determined how much the pressure steps of different payloads differ from each other. For this reason, the bus was loaded with different weights and test persons. The averaged results are shown in Figure 9. They are used to determine the constants of the pressure step to mass conversion part of the algorithm.

3.1.4. Estimation of the Lowest Detectable Payload

With the sensor mounted to the front right tire, it was feasible to detect pressure steps for weights as low as 10-kg occurring in the front door. Reliable results for the middle door were achieved for weights of more than 30-kg. The raw and filtered data are shown in Figure 10a,b. As can be seen, there is a detectable large difference between 10 and 20-kg payloads in the front door.
In Figure 10c,d the noticeable large difference between the steps of the 30-kg payload in the front and middle door can be observed.

3.2. Measurements on the Air Suspension

In this section, the suspension measurement results are presented and discussed. The bus consists of three axes. Each axle is suspended on the left and right by an air spring, as can be seen in Figure 7c. Although they are all fed from the same compressor, they have very different air pressures, ranging from 2.7 to 5.8 bar (absolute, while leveled). In addition, the right side of the bus (with the doors) is often lowered at the stops by reducing the pressure there, to make boarding easier. As will be shown, this has a considerable influence on the height and recognizability of the pressure steps. Only one air suspension sensor was made for this first feasibility test. In order to be able to make a statement about the pressure changes in the individual air bellows, the sensor was installed in succession on all six air suspensions, and the entries were made as similar as possible. Using superposition, the relationship between all entry positions and all air suspensions can be derived for the two test persons of 70 and 105-kg in weight, respectively.

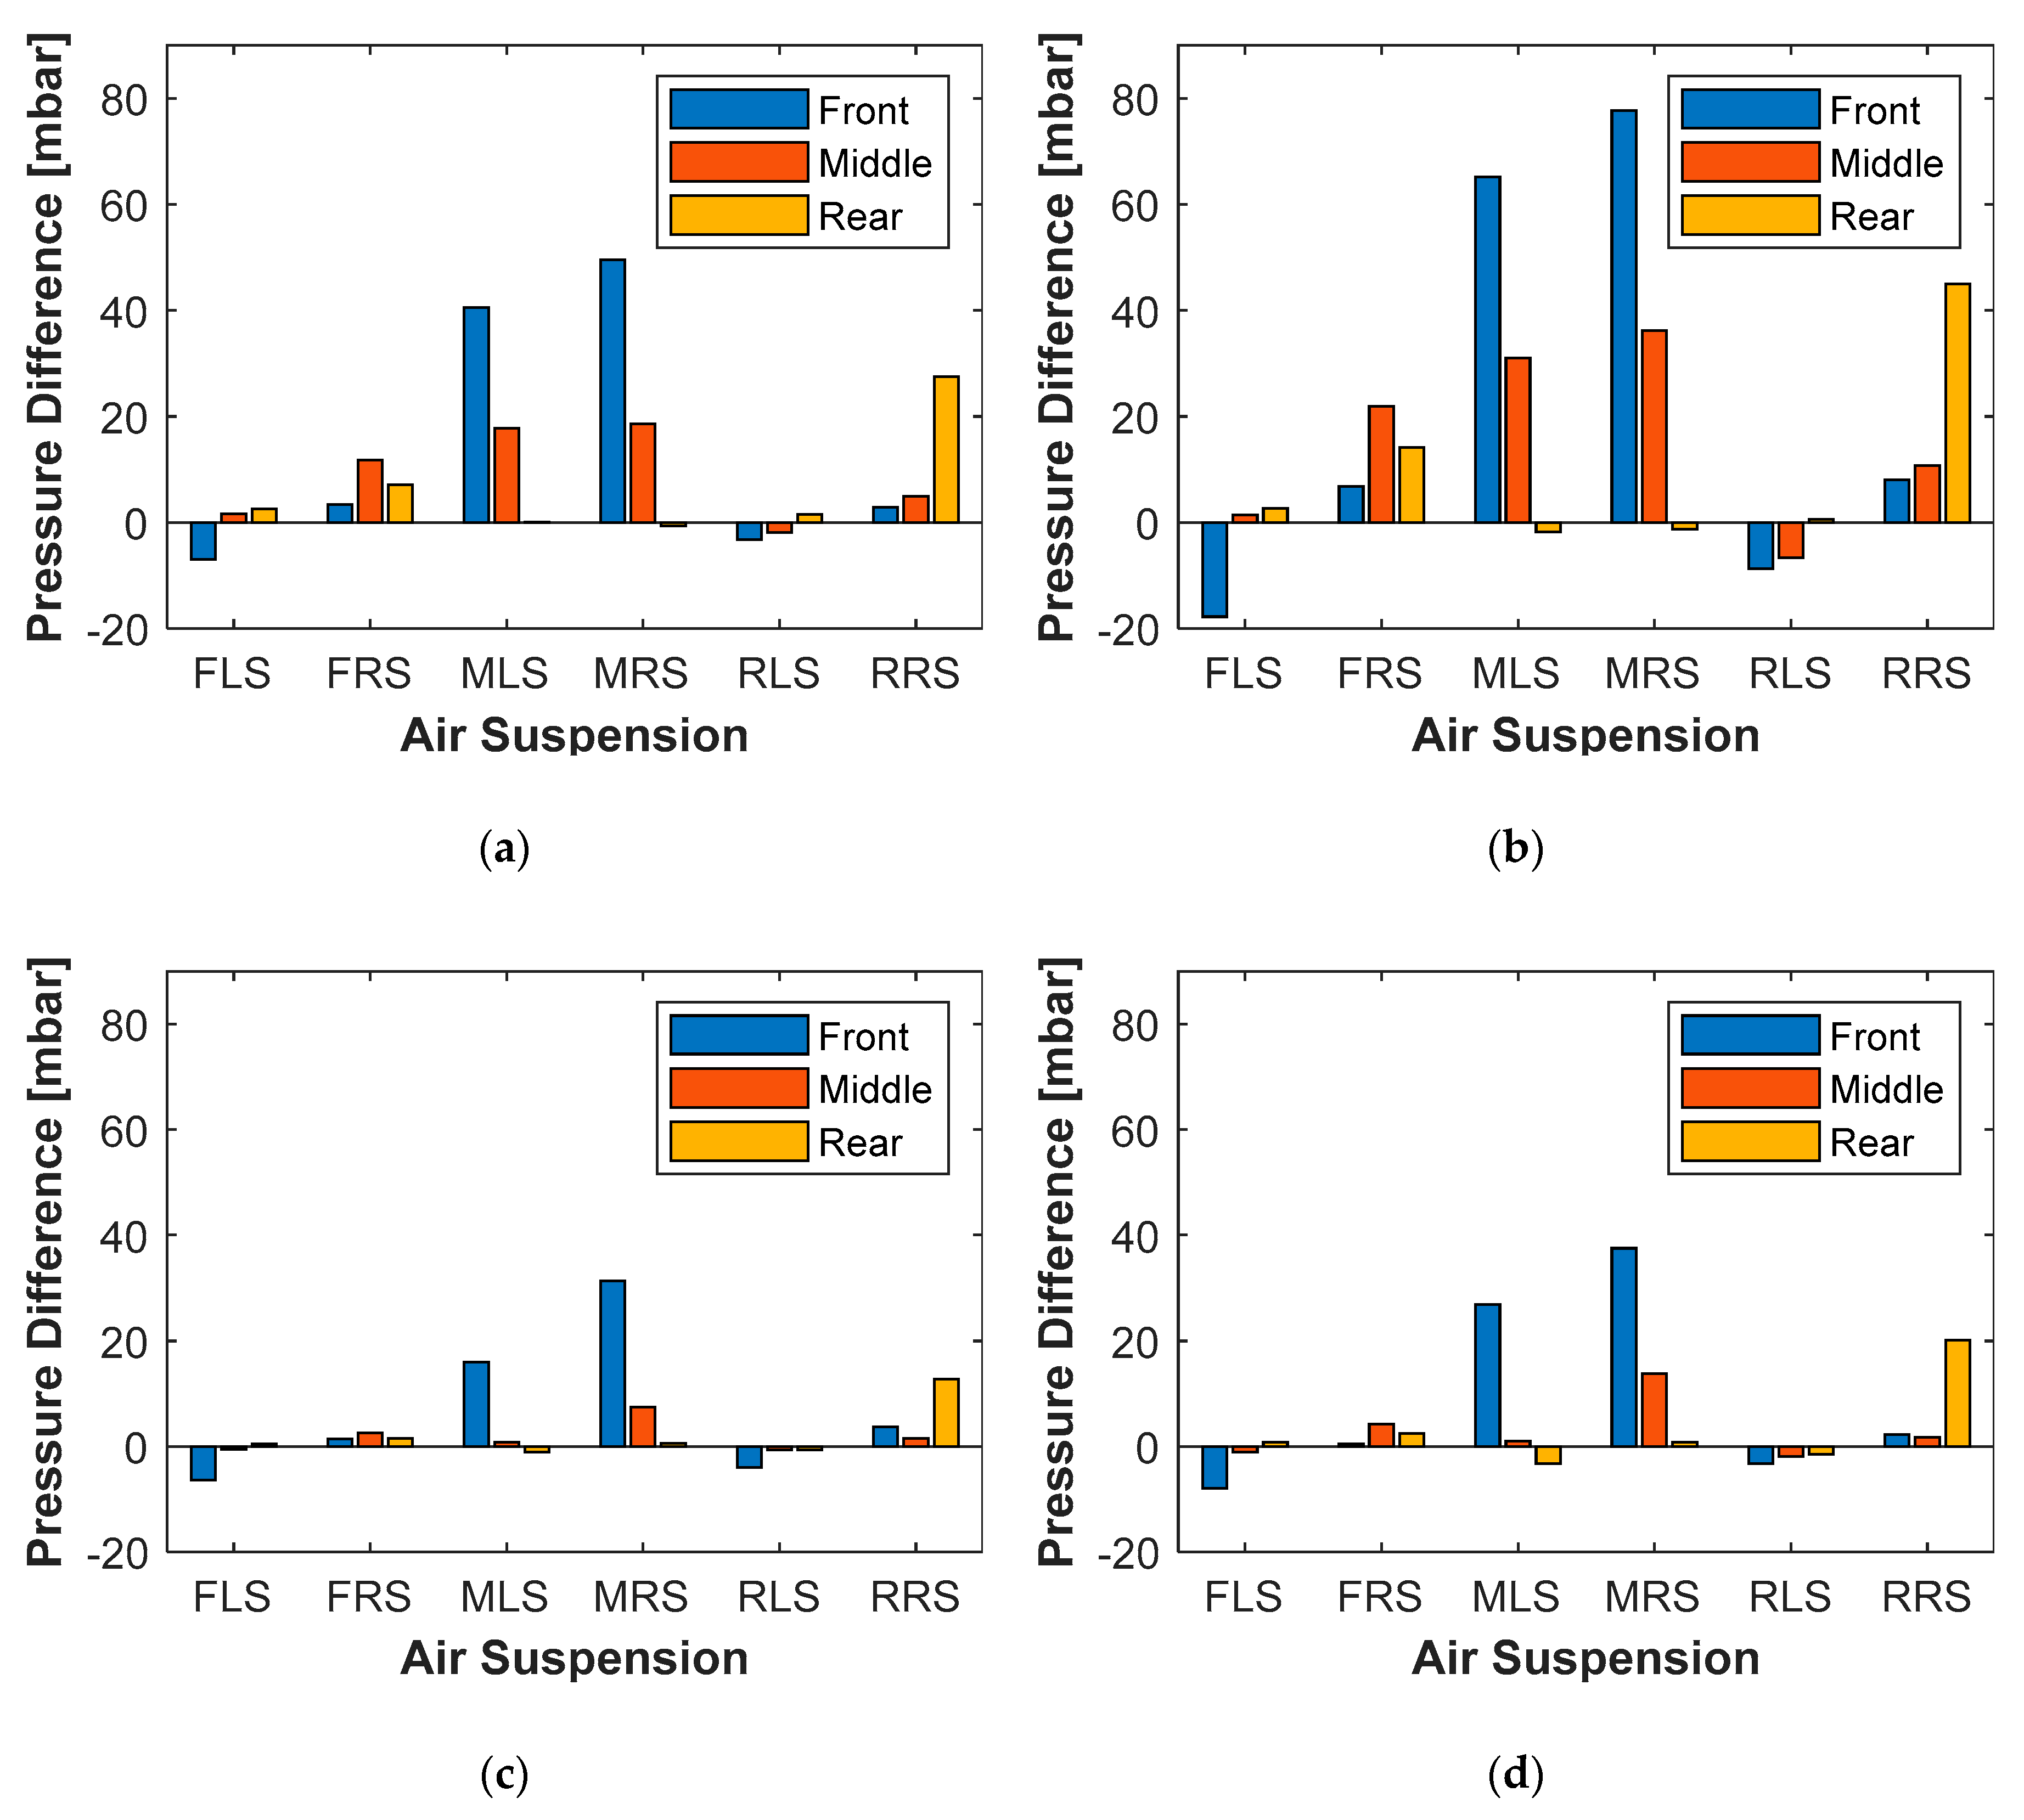
3.2.1. Distribution among the Individual Air Springs

For the air suspensions, it is also advisable to start by looking at the distribution of the load respective to the pressure on the individual air springs. Therefore, the four diagrams of Figure 11 show the detected changes in pressure broken down to the individual air springs for both persons and both states (leveled, lowered) of the bus in comparison. Figure 11a shows the detected pressure steps for the entry of a 70-kg person through each of the three doors, split up to the individual suspensions. Interestingly, the biggest pressure change when entering through the front door is not at the front, but at the middle air suspension.
It can also be noted that the total pressure change across all air suspensions for a front entry is substantially larger than for the other two entry positions. In Figure 11b, it can be seen that it is basically the same for a heavier person with regard to the distribution, only of course with correspondingly larger pressure changes. It should also be noted that the left side of the bus (opposite the doors) is partially relieved, and this even makes a negative pressure change noticeable there. If the bus is lowered to make it easier to get in, the load-related pressure changes are much smaller, as can be seen in Figure 11c and Figure 12a,b. The cause of this is very likely the lower initial pressure, but it is still to be determined completely. The distribution is also worth mentioning as it changes. Due to the slope to the right, the air suspensions there are now subjected to greater loads. However, the total pressure change drops to about a third or even less, depending the entry position. It also remains to be seen how reproducible this is, due to the fact that the lowering process can be non-binary. As Figure 11d suggests, the relative ratio between the two loads also remains lowered as expected.

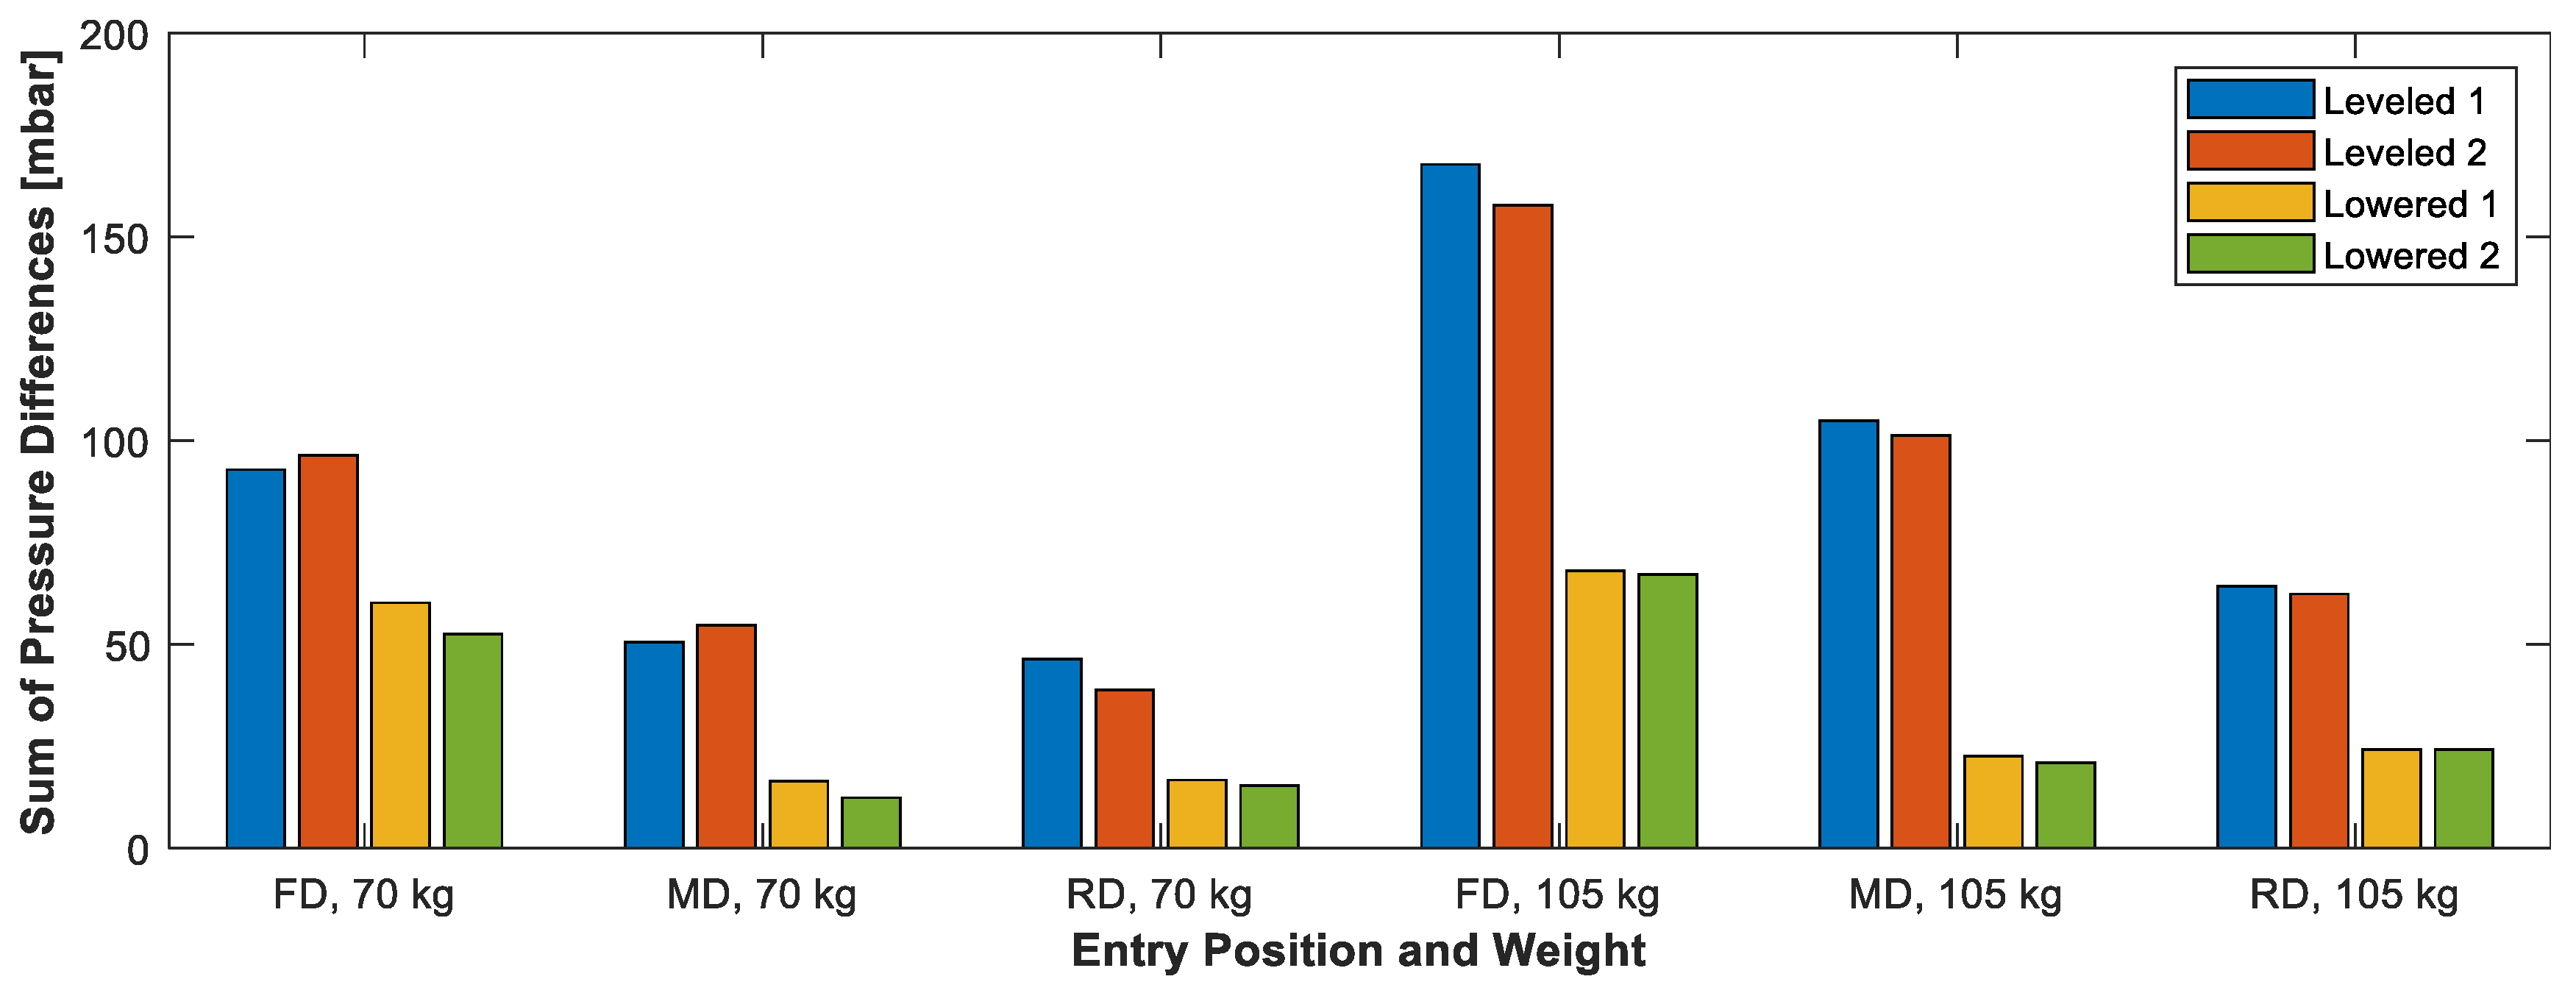
3.2.2. Influence of Lowering

A look at the raw data in Figure 12b reveals that the pressure is much more restless shortly after the sudden change in pressure due to the lowering, which makes it more difficult to detect changes, as the payload-induced steps are smaller and the base pressure more volatile. Lowering does only marginally affect tire pressure, as can be seen in comparison in Figure 12c,d. While leveled, the first entry of the 70-kg test person at the front door results in a pressure change of about 5 millibar in the front right air suspension and 2 millibar in the front right tire. Whereas, while lowered, the value of the air suspension decreases so much that it is no longer detectable, while the value from the tire remains nearly the same.

3.2.3. Influence of Entry Position

Considering the total pressure changes summed up over all six air suspensions, as shown in Figure 13, one can conclude that the gap between the sum of all pressure changes for the different test persons is large enough to safely distinguish both persons from another. This applies to both states of the bus and all doors, although not to the same extent. The summed up pressure changes for entries at the front door are substantially larger than those from the middle or rear door.

4. Discussion

Section 1.3 presented the huge impact of vehicle mass on consumption, and therefore the need for precise information about the current mass of the bus for being able to make forecasts on range or possible excess energy for other means. The subsequent section then gave an overview of existing methods for mass detection for other vehicles, and explained why they are unsuitable for buses. For that reason, this article examined if an approach to detect single person entries using tire pressure from cars can be adapted to work with buses, and compared it to an approach well known from heavy duty vehicles to originally detect larger changes in payloads using air suspension monitoring. To summarize the findings briefly: whereas the main advantage of the mass inducted pressure changes from the air suspensions is that they are several times larger than those from the tires, and therefore better accuracy can be assumed, their disadvantage is that they greatly decrease and are much more volatile when the bus is lowered. In other words, the pressure steps in the tires are generally smaller but also more stable. Therefore, there is no real winner in this category—before further measurements. When it comes to power supply, no matter how and where the tire pressure sensors will be mounted due to the wheels turning, the power needs to come from the battery, and the data must be sent wirelessly. The radio technology needs to be switched from Wi-Fi to Bluetooth Low Energy or ISM bands, to ensure an acceptable battery life. This was planned anyway, but of course the technical feasibility check had priority. The connectors to the air suspensions, on the other hand, are locked in place and overcome this limitation, as they could be wired to the bus’s battery. However, it should not be left unmentioned that the tire pressure sensors additionally offer their protective function with regard to monitoring the formation of flat or burst tires. Both systems can offer information on mass distribution and thus enhance vehicle safety functions, as mentioned in Section 1.5. In order to be able to make a well-founded statement about accuracy and to be able to compare itself with other systems, further data must be recorded and evaluated.

5. Conclusions

Measurement from test drives showed that consumption for traction of the examined bus on its route increases almost linearly with its payload by up to 30%. For this reason, it is clear that knowledge of its mass is important for a precise range prediction, and thus the presented project goals, like using the buses to support the grid. In addition, many other aspects that can benefit from knowledge of mass and mass distribution, such as various vehicle assistance systems, have been pointed out. Furthermore, a broad literature search showed that there already are some methods for vehicle mass estimation, but also indicated that none of them suits buses well. Therefore, this article presented two approaches for mass detection using high-precision pressure sensors. These sensors were combined with Wi-Fi enabled microcontrollers to measure small payload inducted pressure changes in the bus’s air suspension and tires. A filter was used to detect these pressure changes and to convert them back into weights. Pressure changes from different weights in different doors showed a high level of distinctiveness. The presented results of these first measurements therefore clearly show that both approaches are viable methods to mass detection for buses and that satisfying accuracy can be expected. However, it has also been shown that a number of further tests will be necessary to achieve this goal in practice. For this reason, it is planned to produce a full set of six plus ten sensor units and realize a large-scale test series with simultaneous recording of all tires and air suspensions, as well as more different weights, more repetitions and different scenarios.

Author Contributions

Research and writing, U.S.; writing—related work, H.F.; writing—introduction, H.F., M.W.; research and supervision, B.S. All authors have read and agreed to the published version of the manuscript.

Funding

The presented article arises from the research project “BOB Solingen”, which is funded by the German Federal Ministry of Transport and Digital Infrastructure (“Bundesministerium für Verkehr und digitale Infrastruktur”).

Acknowledgments

Thanks to the transport company “Stadtwerke Solingen GmbH” for making the measurements possible.

Conflicts of Interest

The authors declare no conflict of interest.

References

  1. Kellerman, A. Automated and Autonomous Spatial Mobilities; Edward Elgar Publishing: Cheltenham, UK, 2018. [Google Scholar]
  2. France 24. Paris Orders 800 New Electric Buses to Fight Smog. 9 April 2019. Available online: https://www.france24.com/en/20190409-paris-orders-800-new-electric-buses-fight-smog (accessed on 14 June 2019).
  3. PricewaterhouseCoopers GmbH. E-Bus-Radar; PwC: Berlin, Germany, 2019. [Google Scholar]
  4. Frontier Group & U.S. PIRG Education Fund. Electric Buses—Clean Transportation for Healthier Neighborhoods and Clean Air; Frontier Group: North Shields, UK, 2018. [Google Scholar]
  5. International Energy Agency. Global Energy & CO2 Status Report—The Latest Trends in Energy and Emission in 2018; International Energy Agency: Paris, France, 2019. [Google Scholar]
  6. International Energy Agency. CO2 Emissions from Fuel Combustion, 2019 Edition; International Energy Agency: Paris, France, 2019. [Google Scholar]
  7. United Nations Environment Programme. Air Pollution in Asia and the Pacific: Science-Based Solutions; UNEP: Bangkok, Thailand, 2019. [Google Scholar]
  8. The International Council on Clean Transportation. Policy Update: China Announced 2019 Subsidies for New Energy Vehicles; The International Council on Clean Transportation: Washington, DC, USA, 2019. [Google Scholar]
  9. The World Bank. Electric Mobility & Development. The World Bank: Washington, DC, USA, 2018. [Google Scholar]
  10. Keegan, M. Shenzhen’s Silent Revolution: World’s First Fully Electric Bus Fleet Quietens Chinese Megacity. The Guardian. 12 December 2018. Available online: https://www.theguardian.com/cities/2018/dec/12/silence-shenzhen-world-first-electric-bus-fleet (accessed on 14 June 2019).
  11. Lin, Y.; Zhang, K.; Shen, Z.-J.M.; Miao, L. Charging Network Planning for Electric Bus Cities: A Case Study of Shenzhen, China. Sustainability 2019, 11, 4713. [Google Scholar] [CrossRef] [Green Version]
  12. Transport & Environment. Electric Buses Arrive on Time: Marketplace, Economic, Technology, Environmental and Policy Perspectives for Fully Electric Buses in the EU; Transport & Environment: Brussels, Belgium, 2018. [Google Scholar]
  13. Melliger, M.; van Vliet, O.; Liimatainen, H. Anxiety vs reality—Sufficiency of battery electric vehicle range in Switzerland and Finland. Transp. Res. Part D Transp. Environ. 2018, 65, 101–115. [Google Scholar] [CrossRef]
  14. Federal Ministry of Transport and Digital Infrastructure. Pressemitteilung BMVI übergibt 15-Mio-Euro-Förderung für Hybrid-Oberleitungsbusse; Federal Ministry of Transport and Digital Infrastructure: Berlin, Germany, 2017.
  15. Ritter, A.; Elbert, P.; Onder, C. Energy Saving Potential of a Battery Assisted Fleetof Trolley Buses. IFAC-PapersOnLine 2016, 11, 377–384. [Google Scholar] [CrossRef]
  16. Santis, A.; Lauber, L.; Luder, D.; Broennimann, S.; Filliger, R.; Vezzini, A. SwissTrolley plus: R&D on battery lifespan. In Proceedings of the SCCER Mobility 4th Annual Conference, Zurich, Switzerland, 15 September 2017. [Google Scholar]
  17. HAN Automotive Research. Project Description of “E-Bus 2020”; HAN Automotive Research: Arnhem, The Netherlands, 2020. [Google Scholar]
  18. Stadtwerke Solingen GmbH. Elektromobilität bei den Stadtwerken; Stadtwerke Solingen GmbH: Solingen, Germany, 2018. [Google Scholar]
  19. Zhang, X.; Xu, L.; Li, J.; Ouyang, M. Real-Time Estimation of Vehicle Mass and Road Grade Based on Multi-Sensor Data Fusion. In Proceedings of the 2013 IEEE Vehicle Power and Propulsion Conference (VPPC), Beijing, China, 15–18 October 2013. [Google Scholar]
  20. Kim, C.; Ro, P.I. Reduced-order modelling and parameter estimation for a quarter-car suspension system. Part D J. Automob. Eng. 2000, 214, 851–864. [Google Scholar] [CrossRef]
  21. Fechtner, H.; Teschner, T.; Schmuelling, B. Range prediction for electric vehicles: Real-time payload detection by tire pressure monitoring. In Proceedings of the IEEE Intelligent Vehicles Symposium, Seoul, Korea, 28 June–1 July 2015. [Google Scholar]
  22. Ogawa, A. Tire State Quantity Detecting Apparatus and Method. USA Patent US7243534B2, 17 March 2005. [Google Scholar]
  23. Hao, S.; Luo, P.; Xi, J. Estimation of vehicle mass and road slope based on steady-state Kalman filter. In Proceedings of the IEEE International Conference on Unmanned Systems (ICUS) 2017, Beijing, China, 27–29 October 2017. [Google Scholar]
  24. Boada, B.L.; Boada, M.J.L.; Zhang, H. Sensor Fusion Based on a Dual Kalman Filter for Estimation of Road Irregularities and Vehicle Mass Under Static and Dynamic Conditions. IEEE/ASME Trans. Mechatronics 2019, 24, 1075–1086. [Google Scholar] [CrossRef] [Green Version]
  25. Torabi, S.; Wahde, M.; Hartono, P. Road Grade and Vehicle Mass Estimation for Heavy-duty Vehicles Using Feedforward Neural Networks. In Proceedings of the 2019 4th International Conference on Intelligent Transportation Engineering (ICITE), Singapore, 5–7 September 2019. [Google Scholar]
  26. Kim, I.; Kim, H.; Bang, J.; Huh, K. Development of estimation algorithms for vehicle’s mass and road grade. Int. J. Automot. Technol. 2013, 14, 889–895. [Google Scholar] [CrossRef]
  27. Hac, A.B. Dynamic Estimation of Vehicle Inertial Parameters and Tire Forces from Tire Sensors. USA Patent US20090177346A1, 9 July 2009. [Google Scholar]
  28. Grewal, K.S.; Darnell, P.M. Model-based EV range prediction for Electric Hybrid Vehicles. In Proceedings of the Hybrid and Electric Vehicles Conference 2013 (HEVC 2013), London, UK, 6–7 November 2013. [Google Scholar]
  29. Carlson, R.B.; Lohse-Busch, H.; Diez, J.; Gibbs, J. The Measured Impact of Vehicle Mass on Road Load Forces and Energy Consumption for a BEV, HEV, and ICE Vehicle. SAE Int. J. Altern. Powertrains 2013, 2, 105–114. [Google Scholar] [CrossRef] [Green Version]
  30. Kidambi, N.; Harne, R.L.; Fujii, Y.; Pietron, G.M.; Wang, K.W. Methods in Vehicle Mass and Road Grade Estimation. SAE Int. J. Passeng. Cars-Mech. Syst. 2014, 7, 981–991. [Google Scholar] [CrossRef]
  31. Ehsani, M.; Gao, Y.; Emadi, A. Modern Electric, Hybrid Electric, and Fuell Cell Vehicles; CRC Press: Boca Raton, FL, USA, 2010. [Google Scholar]
  32. Maalej, K.; Kelouwani, S.; Agbossou, K.; Dube, Y.; Henao, N. Long-Trip Optimal Energy Planning with Online Mass Estimation for Battery Electric Vehicles. IEEE Trans. Veh. Technol. 2014, 64, 4929–4941. [Google Scholar] [CrossRef]
  33. Feng, Y.; Xiong, L.; Han, W. Vehicle Identification Method and System for Quality. Chinese Patent CN103946679, 25 May 2016. [Google Scholar]
  34. Pence, B. Recursive Parameter Estimation using Polynomial Chaos Theory Applied to Vehicle Mass Estimation for Rough Terrain. Ph.D. Thesis, The University of Michigan, Ann Arbor, MI, USA, 2011. [Google Scholar]
  35. Li, B.; Li, W.; Du, H. Trajectory control for autonomous electric vehicles with in-wheel motors based on a dynamics model approach. IET Intell. Transp. Syst. 2016, 10, 318–330. [Google Scholar] [CrossRef]
  36. Subosits, J.; Gerdes, J.C.; J., S.; J.C., G. Autonomous vehicle control for emergency maneuvers: The effect of topography. In Proceedings of the 2015 American Control Conference (ACC), Chicago, IL, USA, 1–3 July 2015. [Google Scholar]
  37. Weiskircher, T.; Wang, Q.; Ayalew, B. Predictive Guidance and Control Framework for (Semi-) Autonomous Vehicles in Public Traffic. IEEE Trans. Control Syst. Technol. 2017, 25, 2034–2046. [Google Scholar] [CrossRef]
  38. Pohl, J.; Ekmark, J. A Lane Keeping Assist System for Passenger Cars-Design Aspects for the Driver Interface. In Proceedings of the 18th International Technical Conference on the Enhanced Safety of Vehicles, Nagayo, Japan, 19–22 May 2003. [Google Scholar]
  39. Economic Commission for Europe of the United Nations. Regulation No 64 of the Economic Commission for Europe of the United Nations (UN/ECE); Economic Commission for Europe of the United Nations: Geneva, Switzerland, 2010. [Google Scholar]
  40. U.S. Department of Transportation. National Highway Traffic Safety Administration, Federal Motor Vehicle Safety Standards: Tire Pressure Monitoring Systems; U.S. Department of Transportation: Washington DC, USA, 2005.
  41. Fechtner, H.; Spaeth, U.; Patelkos, E.; Schmuelling, B. Optimisation of driver and driving assistance systems of electric vehicles by a static vehicle mass estimation. In Proceedings of the IET Hybrid and Electric Vehicle Conference, IET HEVC 2016, London, UK, 2–3 November 2016. [Google Scholar]
Figure 1. Schematic of the whole project.
Electronics 09 00711 g001
Figure 2. (a) Vehicle based Research Focuses. (b) The first battery-overhead-bus (BOB) of Solingen.
Electronics 09 00711 g002
Figure 3. (a) Route of first BOB-Line 695 in Solingen, Germany. (b) Correlation of mass and consumption for the 695 route.
Electronics 09 00711 g003
Figure 4. Overview of the combined vehicle mass detection system.
Electronics 09 00711 g004
Figure 5. Attached Sensor Prototypes. (a) Tire Sensor. (b) Air Suspension Sensor.
Electronics 09 00711 g005
Figure 6. (a) Influence of initial pressure on height of mass induced pressure steps, sum of all four tires (car). (b) Influence of seat position on pressure changes (car).
Electronics 09 00711 g006
Figure 7. (a) Differences in total pressure change for front and rear seats, sum of all four tires (car). (b) Seat and tire positions (car). (c) Arrangement and numbering of tires, air springs and doors (bus).
Electronics 09 00711 g007
Figure 8. Raw and filtered data curves (a) and corresponding detected pressure steps from the algorithm (b) for five entries each in the front and middle door (bus).
Electronics 09 00711 g008
Figure 9. Pressure values for different payloads (bus).
Electronics 09 00711 g009
Figure 10. Raw and filtered data for small payloads (bus). (a) Ten kilogram front door. (b) Twenty kilogram front door. (c) Thirty kilogram front door. (d) Thirty kilogram middle door.
Electronics 09 00711 g010
Figure 11. Resulting pressure changes in the respective air suspensions for two loads and conditions. (a) Seventy kilograms, leveled. (b) One-hundred-and-five kilograms, leveled. (c) Seventy kilograms, lowered. (d) One-hundred-and-five kilograms, lowered.
Electronics 09 00711 g011
Figure 12. Influence of lowering on suspension and tire pressure. (a) Front Right Suspension, leveled. (b) Front Right Suspension, lowered. (c) Front Right Tire, leveled. (d) Front Right Tire, lowered.
Electronics 09 00711 g012
Figure 13. Overview of all accumulated pressure changes from all six air suspensions for two test persons and all three doors.
Electronics 09 00711 g013

