Abstract
Today’s modern control strategies of an induction motor (IM) drive require a power source with an adjustable output voltage frequency and amplitude. The most commonly used converter topology is a two-level voltage-source inverter (VSI). However, the utilization of a VSI introduces additional voltage and current distortion, which leads to additional power losses in the machine’s magnetic circuit. Both the transistor switching frequency and the type of the inverter control determine the total harmonic distortion (THD) of the motor’s phase currents. In this paper, the influence of the inverter DC-link voltage on the iron losses of an IM controlled by a predictive torque control (PTC) is presented. It is shown that if the IM drive operates below the rated speed, it is possible to modify the PTC algorithm to reduce the additional iron losses caused by the non-harmonic inverter output voltage. The control of the DC-link voltage is achieved by using a silicon-controlled rectifier. Experiments were conducted on a 5.5 kW IM controlled by PTC, and the results are compared against a sinusoidal voltage supply created by a synchronous generator.
1. Introduction
Since electric motors consume a considerable part of the world’s electric energy, energy savings of electric motor drives are a hot topic amongst researchers. Using a voltage-source inverter (VSI) as a power supply for the induction motor (IM) drive introduces additional losses compared to a sinusoidal supply [1,2] since the total harmonic distortion (THD) of the motor supply voltage directly contributes to the loss increase [3].
Electric machines represent an inductive load; therefore, the switching frequency directly affects the current waveform. The influence of the switching frequency on the iron losses is particularly significant for frequencies below 5 kHz [4,5,6], where the current distortion becomes relatively high, leading to the distortion of the flux density inside the machine [7,8]. The increment of the iron losses under a non-sinusoidal supply is caused mainly by increased eddy currents [9] and also by minor hysteresis loops [7].
In many applications, it is not always possible to keep the switching frequency arbitrarily high. A good example can be high-power drives, where the switching frequency has to be restricted according to the used semiconductors and their cooling. On the other hand, if the control algorithms are synchronized with the switching frequency, then the restrictions provide a sufficient computing time that can be utilized in the case of complicated modern control algorithms. Among those, we can include predictive control strategies, such as model predictive control (MPC).
In the case of an induction motor drive, a typical implementation of MPC is predictive torque control (PTC) that has been a subject of extensive research in recent years [10]. The basic principle of PTC is similar to the classical direct torque control (DTC) because the stator flux linkage vector amplitude and electromechanical torque are controlled by applying an appropriate inverter voltage vector to the motor terminals without the use of a modulator. The main difference between PTC and DTC is that PTC uses a mathematical model to predict the future state and chooses the most suitable voltage vector according to the cost function, whereas the DTC uses hysteresis controllers and a predefined table.
Both the basic PTC and DTC schemes share the same major disadvantages, which are the motor current and torque ripple unless the sampling time is very low [11]. There are a number of articles that deal with the current ripple [12,13], which is directly related to additional losses in the motor when powered from the inverter, including the iron losses. The solutions mentioned in the literature are rather software-oriented. The most straightforward solution is to increase the sampling frequency. However, this leads to an increase in switching frequency. Other solutions introduce a modulator to either increase the number of possible voltage vectors [14] or to decrease their effective magnitude [15,16]. However, the implementation of a modulator also leads to an increase in the switching frequency, which may not always be possible due to the reasons mentioned above. Certain improvements can be reached with a prolonged prediction horizon, when the current distortion is reduced for the whole predicted horizon [17] rather than for the next step only. This solution increases the complexity of the control algorithm and brings only a small improvement in the case of the induction motor [11]. As far as hardware solutions are concerned, they mainly include multilevel inverters [12,18], which increase the set of available voltage vectors. All of the methods mentioned above lead to an improvement in the current distortion, and, therefore, iron losses decrease, but they do so at the price of switching frequency increase or significant topology modification (multilevel inverters).
The iron loss minimization strategy presented in this paper can be considered both hardware and software oriented. The hardware part is based on the general idea that the modulation index directly affects the iron losses [19]. We took advantage of the fact that a silicon-controlled rectifier (SCR) based pre-charge circuit is usually used in medium power converters for the initial charging of the DC-link capacitor [20]. If a power factor correction (PFC) is required, the pulse-width modulation (PWM) rectifier can be utilized in the power stage. Such topologies are common in railway vehicles equipped with AC drives [21,22]. The DC-link voltage control can then be achieved by introducing a DC/DC converter between the rectifier and inverter [23]. However, other topologies could allow for direct DC-link voltage control. For instance, in [24], a converter topology with a middle-frequency transformer was proposed that could be directly utilized for this purpose. As far as traction converters for electric vehicles are concerned, topologies enabling DC-link voltage control in a wide range have also been reported in the literature [25].
The software part of our proposed method was based on a modification of the conventional PTC algorithm that lie within the integration of the DC-link optimization into the PTC algorithm. The proposed solution works particularly well when nominal DC-link voltage is not required, i.e., when the drive is operating under speed lower than the nominal one. Reducing DC-link voltage leads to current ripple reduction and, consequently, to decrease in the iron losses since the flux density distribution distortion also decreases. For simplicity, a conventional SCR was used for the DC-link voltage control in this paper. However, in general, any power electronics topology that enables the variation of the DC-link voltage can be utilized.
The iron losses were obtained by segregation based on the International Electrotechnical Commision (IEC) standard, i.e., the losses are calculated from the measured electric input power, stator copper losses, and mechanical losses during a no-load operation of an IM controlled by the PTC algorithm. For the sake of comparison, the experiments were also repeated for a sinusoidal voltage supply created by a synchronous generator (SG). The experimental results showed that if the motor speed was lower than the nominal one, it was possible to reduce the additional iron losses caused by the VSI switching by decreasing the magnitude of the DC-link voltage. The lower the speed, the higher power savings that could be achieved by the application of our proposed method.
2. Induction Machine Loss Segregation
Induction motor losses are usually divided into five categories: stator winding losses, rotor winding losses, iron losses, mechanical losses, and additional losses [1,2]. In this paper, iron losses were of interest. In the following paragraphs, we describe the methodology of iron loss separation, which is based on the IEC standard [1]. The main difference between the methodology used in this paper and the methodology used in the IEC standard is, that since the iron losses were obtained from the no-load test, the tested motor was not preheated by the load test. The parameters of the used electric machines are shown in Table A1 and Table A2 in the Appendix.
2.1. Stator Copper Losses
Stator copper losses can be calculated as:
where is the stator winding phase resistance and is the RMS value of the stator phase current. The stator winding resistance can be obtained from the standard DC test.
2.2. Constant Losses
The constant losses are defined as:
where is the electric input power, are the friction and windage losses, and are the iron losses.
2.3. Friction and Windage Losses
Mechanical losses are usually calculated from four or more constant loss points between 30% and 60% of the rated motor voltage by developing a curve against no-load voltage squared and then performing linear extrapolation to zero voltage [1,2]. The intersection of the extrapolation curve with the vertical axis then corresponds to the mechanical losses. However, mechanical losses are speed and temperature-dependent [2]. Therefore, to obtain the dependence of the losses on speed, several tests with a variable harmonic supply voltage created by an SG were performed. The motor-rated voltage was recalculated for each frequency to preserve the same voltage-to-frequency ratio. The measured dependence is shown in Figure 1.
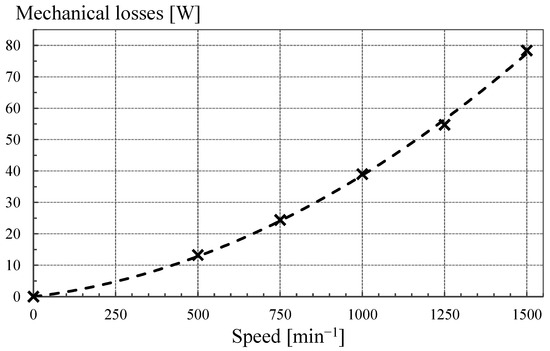
Figure 1.
Dependence of the measured mechanical losses on speed for a cold motor. Crosses: measured data; and dashed curve: second-order polynomial fit.
2.4. Iron Losses
Out of Equations (1) and (2), the iron losses can be calculated as:
Therefore, to obtain the iron losses, the electrical input power, stator copper losses, and mechanical losses in the respective operating point have to be determined.
3. Proposed Predictive Torque Control Strategy
In the case of a two-level VSI, eight different voltage vectors can be achieved by transistor switching combinations. The idea behind the predictive torque control is to predict the developed torque and the stator flux linkage amplitude for each of the possible voltage vectors in a one-step horizon [10]. The only measured quantities are the phase currents, DC-link voltage, and the rotor speed. An observer is required to calculate the non-measurable quantities, such as the stator and rotor flux linkage vectors.
For flux estimation, extended Luenberger observer (ELO) was utilized. The observer was described in detail in [26], where the stability was also investigated. The observer poles were designed by a classic approach in which the poles of the observer were placed to the left of the motor poles [27]. Since the estimated system state was the rotor flux vector and the quantity required by the predictive control was the stator flux vector, the simple recalculation from the basic induction motor equations was used, i.e.:
Within the PTC algorithm, the stator flux vector and torque are predicted for the next step as [28]:
where is the sampling time, is the number of pole-pairs, and denotes cross product.
Then, all the predicted states are evaluated by the cost function. The cost function expresses how close the individual predicted states are to the reference values of flux amplitude and torque . The cost function is formulated as:
where is the weighting factor. The cost function yields the best possible voltage vector candidate. The chosen voltage vector is then applied to the motor terminals in the next step. The PTC operation scheme is depicted in Figure 2.
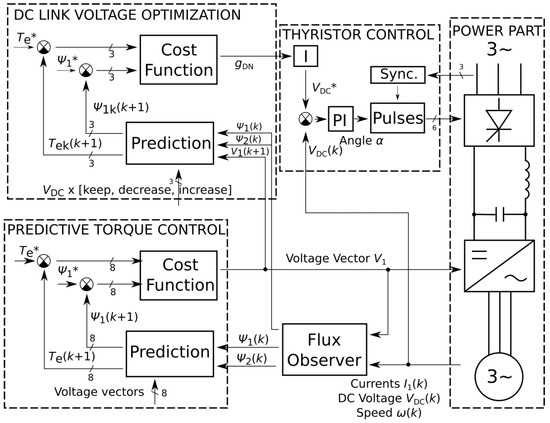
Figure 2.
Predictive torque control (PTC) with adjustable DC-link voltage operation scheme.
3.1. Influence of DC-Link Voltage on the Drive Behavior
Keeping the full DC-link voltage may not be necessary for all operating points. Let us suppose that the motor winding is sinusoidally distributed and that it is only the fundamental component of the voltage that contributes to the average value of the machine torque. Under these presumptions and also by neglecting the nonlinear VSI behavior, the DC-link voltage decrease will lead to the shrinkage of the hexagon, which represents the theoretical maximum set of voltage vectors generatable by the VSI. At some threshold voltage , the hexagon will touch the circular trajectory of the fundamental voltage wave. The whole situation is depicted in Figure 3. A further DC-link voltage decrease will cause operation with an additionally distorted current waveform, and under some critical value, the speed of the drive will start dropping.
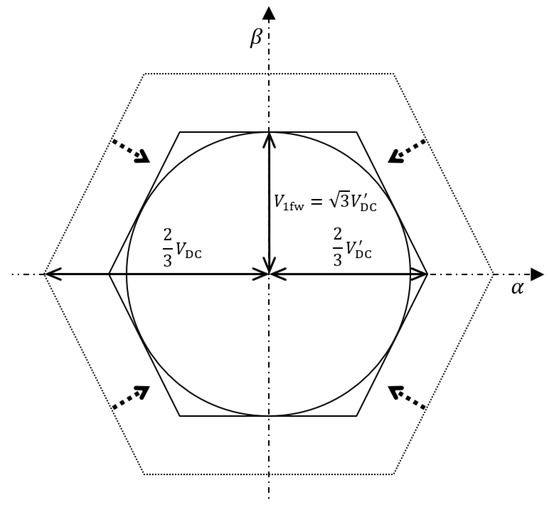
Figure 3.
Relationship between the trajectory of the fundamental voltage wave vector and inverter DC-link voltage.
The relationship between the radius of the stator voltage vector circular trajectory created by the fundamental wave and lowered DC-link voltage can be expressed as:
3.2. DC-Link Voltage Control Strategy
To adjust the DC-link voltage, an active SCR in a bridge configuration was added before the DC-link. The required voltage was achieved by the proper thyristor firing angle control by a voltage PI controller. For the operation with the minimum DC-link voltage, an optimization algorithm based on PTC was designed. For several considered DC-link voltage candidates in this algorithm, the torque and flux amplitude is predicted, and the cost function selects the most suitable one. The voltage vector candidates are:
where is a vector corresponding to the inverter switching combination selected by PTC and is the set of empirically selected DC-link voltage coefficients. For these three voltage vectors, the torque and flux amplitude are predicted again as:
These equations give three candidates that can be utilized in the next step. They are evaluated by the cost function as:
The cost function chooses the most suitable situation at which the torque and flux are closest to their references. A specific DC-link change is connected with each of these three candidates; the DC-link voltage can be increased, decreased, or stay unchanged. This can be formally written as:
The cost function output chooses a value from the set , which is brought to the integrator to eliminate possible sudden changes in the DC-link voltage. Then, the SCR firing angle is adjusted by a PI controller to reach the voltage demanded by the integrator output.
4. Experimental Results
4.1. Predictive Torque Control with Voltage Optimization
The PTC strategy with adjustable DC-link voltage was experimentally verified on a laboratory drive with a 5.5 kW induction motor coupled with a 6.7 kW DC dynamometer. The motor nameplate data and parameters used by the mathematical model measured by the conventional no-load and blocked-rotor tests are summarized in Table A1 in the Appendix.
The control algorithm was implemented on dSPACE ds1103 with a 100 µs control loop. Since the PTC strategy did not use a modulator, the time during which the chosen voltage vector was applied to the motor terminals was 100 µs or its multiples. The measured average switching frequency was around 1.6 kHz.
The functionality of the PTC with adjustable DC-link voltage is verified in Figure 4. The drive operated in a speed loop with a PI controller and was loaded by a DC dynamometer. On the left side of the figure, it can be seen that the reference speed and load torque were 500 min−1 and 12 Nm, respectively. On the right side, it can be seen that the reference speed and load torque were 750 min−1 and 17 Nm, respectively. The DC-link voltage optimization algorithm was activated at time 11 s in both cases. After 9 s, the nominal DC-link voltage was restored. The figure shows that in both cases, the drive was able to develop the required torque and maintain the reference speed at the same time. Additionally, the torque ripple was reduced.
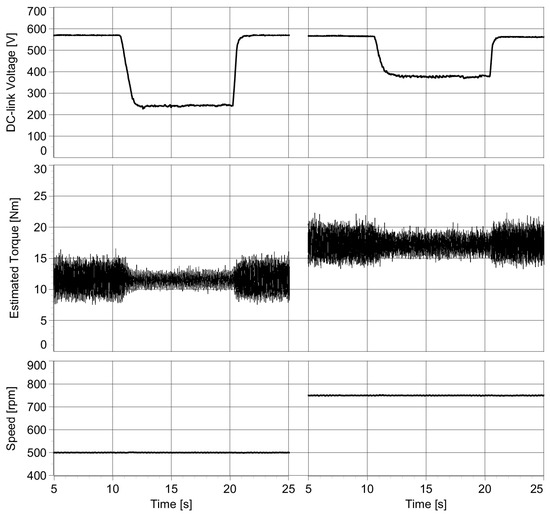
Figure 4.
PTC operating at full and optimized DC-link voltage. Reference speed: 500 min−1 (left) and 750 min−1 (right); reference flux: 1 Wb; load torque: 12 Nm (left) and 17 Nm (right).
4.2. Iron Loss Analysis
Two different hardware topologies were used for the iron loss analysis. First, similarly as in the previous section, the IM was connected to the inverter controlled by the PTC algorithm in a speed loop and without a mechanical load (Figure 5). Second, the motor was connected to the SG to compare the losses between the PTC-controlled IM and the IM supplied from a sinusoidal voltage (Figure 6). The electrical power was measured by power analyzer NORMA 4000 placed between the motor terminals and the respective source.
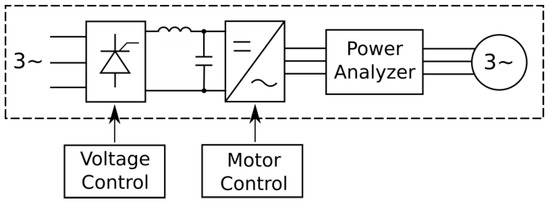
Figure 5.
Block diagram of the inverter-supplied induction motor.
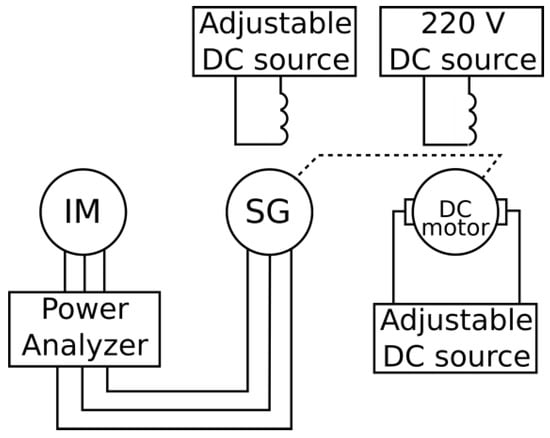
Figure 6.
Block diagram of the synchronous-generator-supplied induction motor.
In the case of PTC, the operating point was defined by the reference speed and flux. Within each operating point, the DC-link voltage was varied between the minimum (optimized) and the maximum (firing angle equal to zero) value. For each DC-link voltage, the input electrical power and the RMS stator current were measured. The iron losses were then calculated according to the methodology described in Section 2. Each operating point (reference speed, flux, and load torque) was associated with a specific RMS value of the fundamental voltage wave. This value was recorded and later used for the sinusoidal supply test.
In the case of the sinusoidal voltage test, the output frequency of the SG was adjusted by the DC motor and the output voltage by the SG excitation. The operating conditions were repeated by setting the same speed and RMS value of the fundamental voltage wave as in the case of PTC. For each operating point, i.e., motor speed and terminal voltage, the input electrical power, and the RMS current were measured. Same as in the case of PTC, the iron losses were then calculated according to the methodology described in Section 2.
The experiments were performed for three different speeds: 500, 750, and 1000 min−1. The reference flux in the PTC algorithm was set to 1 Wb in all the cases. The difference between the phase current waveforms for the case of rotor speed equal to 500 min−1 is presented in Figure 7. The figure shows that the current distortion during the reduced DC-link voltage (THD 4.6%) was significantly lower than at the full DC-link voltage (THD 8.8%).
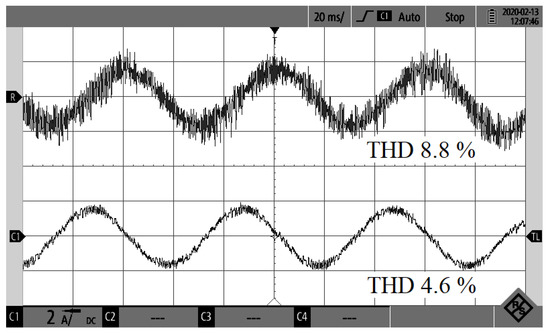
Figure 7.
Phase current comparison. Reference speed 500 min−1; reference flux: 1 Wb, no-load operation Top: 570 V DC-link voltage; bottom: 210 V DC-link voltage.
The IM loss distribution is depicted in Figure 8, Figure 9 and Figure 10. The losses for the sinusoidal power supply are shown on the left side. On the right side, the dependence of the individual losses, including iron losses, on the DC-link voltage is presented.
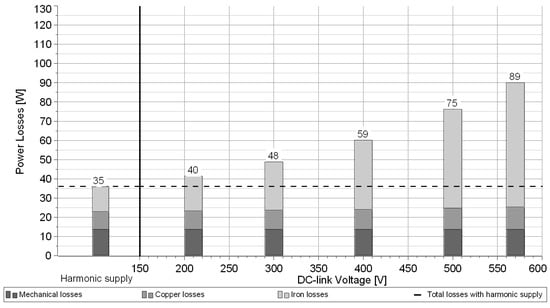
Figure 8.
Motor speed 500 rpm and no-load condition: loss distribution in the case of a sinusoidal supply (left) compared to a loss distribution of the PTC-controlled induction motor (IM) (right) with the reference stator flux 1 Wb and different values of DC-link voltage.
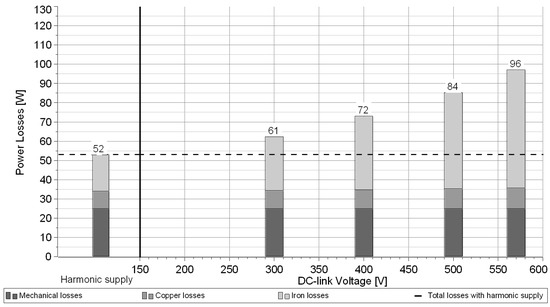
Figure 9.
Motor speed 750 rpm and no-load condition: loss distribution in the case of a sinusoidal supply (left) compared to a loss distribution of the PTC-controlled IM (right) with the reference stator flux 1 Wb and different values of DC-link voltage.
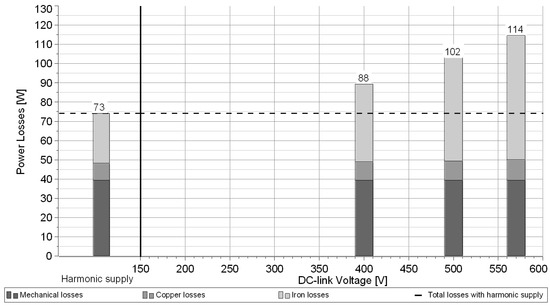
Figure 10.
Motor speed 1000 rpm and no-load condition: loss distribution in the case of a sinusoidal supply (left) compared to a loss distribution of the PTC-controlled IM (right) with the reference stator flux 1 Wb and different values of DC-link voltage.
The figures show that lowering the DC-link voltage led to an iron loss reduction. As the speed decreased, energy savings became more significant. Therefore, if the motor speed was lower than the nominal one, energy lost in the magnetic circuit could be reduced by the optimal DC-link voltage control. However, it was apparent that the higher the speed, the less space remained for the voltage optimization since the inverter required a higher voltage for back electromotive force compensation.
5. Discussion and Conclusions
In this paper, the analysis of the effect of a novel predictive DC-link voltage optimization algorithm integrated into the standard PTC on the iron losses of an IM drive was presented. The method is particularly suitable for drives operating in a wide speed range that are equipped with a controllable rectifier (or DC/DC converter when the energy source is the battery). Examples of such drives include railway vehicles or electric vehicles. If the drive speed is low, it is not necessary to maintain the nominal voltage in the DC-link, which can then be reduced to suppress the current ripple that directly contributes to the additional motor losses, including the iron losses. Out of the IM loss components, iron losses were chosen for the fact they can be conveniently measured and also because that they represent a significant portion of the additional losses of the distorted-current-supplied machine. For the DC-link voltage control, an SCR was utilized. However, any topology allowing for DC-link voltage control can be adopted.
The experimental results showed significant energy saving achieved by the proposed method, especially during low-speed operation. With the decreasing DC-link voltage, the losses tended to get closer to the values measured during the sinusoidal supply. The difference between the losses during optimized and nominal voltage was from 25 to 50 W for the presented cases. The increment of the stator copper losses due to the distorted current during nominal DC-link voltage was around 1.5 W and could be considered negligible. Furthermore, mechanical losses were also presented, but they remained constant for each reference speed. In future work, the authors will focus on a detailed analysis of the influence of the proposed methods on the DC-link-voltage-dependent inverter losses.
Author Contributions
Conceptualization, P.K. and O.L.; methodology, P.K., O.L. and J.B.; software P.K.; validation, P.K. and O.L.; formal analysis, P.K., O.L. and J.B.; investigation, P.K. and O.L.; resources, O.L.; data curation, P.K. and O.L.; writing—original draft preparation, P.K. and O.L.; writing—review and editing, P.K., O.L. and J.B.; visualization, P.K. and O.L.; supervision, J.B.; project administration, J.B.; funding acquisition, O.L. All authors have read and agreed to the published version of the manuscript.
Funding
This paper was supported by the Student Grant Agency of the Czech Technical University in Prague under grant No. SGS20/062/OHK3/1T/13.
Acknowledgments
The authors would like to thank the Department of Electric Drives and Traction of Czech Technical University in Prague for providing their facilities during the investigation.
Conflicts of Interest
The authors declare no conflict of interest.
Appendix

Table A1.
Induction motor parameters.
Table A1.
Induction motor parameters.
| Nameplate Data | Mathematical Model Parameters | ||
|---|---|---|---|
| Nominal power | 5.5 kW | Stator resistance | 2.53 Ω |
| Nominal voltage | 380 V | Rotor resistance | 2.62 Ω |
| Nominal current | 11.8 A | Stator inductance | 0.616 H |
| Nominal speed | 1430 min−1 | Rotor inductance | 0.616 H |
| Number of poles | 4 | Magnetizing inductance | 0.592 H |
| Winding connection | Y | Iron core resistance | 530 Ω |
Table A2.
DC dynamometer and synchronous generator nameplate data.
Table A2.
DC dynamometer and synchronous generator nameplate data.
| DC Dynamometer | Synchronous Generator | ||
|---|---|---|---|
| Nominal power | 6.7 kW | Nominal power | 8 kW |
| Nominal armature voltage | 220 V | Nominal stator voltage | 400 V |
| Nominal armature current | 32.6 A | Nominal stator current | 14.5 A |
| Nominal speed | 1500 min−1 | Nominal speed | 1500 min−1 |
| Nominal excitation voltage | 220 V | Nominal excitation voltage | 32 V |
| Nominal excitation current | 1.2 A | Nominal excitation current | 7.6 A |
References
- Karkkainen, H.; Aarniovuori, L.; Niemela, M.; Pyrhonen, J. Converter-Fed Induction Motor Efficiency: Practical Applicability of IEC Methods. IEEE Ind. Electron. Mag. 2017, 11, 45–57. [Google Scholar] [CrossRef]
- Aarniovuori, L.; Rasilo, P.; Niemelä, M.; Pyrhönen, J. Analysis of 37-kW Converter-Fed Induction Motor Losses. IEEE Trans. Ind. Electron. 2016, 63, 5357–5365. [Google Scholar] [CrossRef]
- Zhang, D.; An, R.; Wu, T. Effect of voltage unbalance and distortion on the loss characteristics of three-phase cage induction motor. IET Electr. Power Appl. 2018, 12, 264–270. [Google Scholar] [CrossRef]
- Boglietti, A.; Ferraris, P.; Lazzari, M. and Pastorelli, M. Change of the iron losses with the switching supply frequency in soft magnetic materials supplied by PWM inverter. IEEE Trans. Magn. 1995, 31, 4250–4252. [Google Scholar] [CrossRef]
- Zhang, D.; Dai, H.; Zhao, H.; Wu, T. A Fast Identification Method for Rotor Flux Density Harmonics and Resulting Rotor Iron Losses of Inverter-Fed Induction Motors. IEEE Trans. Ind. Electron. 2018, 65, 5384–5394. [Google Scholar] [CrossRef]
- Zhang, D.; Liu, T.; Zhao, H.; Wu, T. An Analytical Iron Loss Calculation Model of Inverter-Fed Induction Motors Considering Supply and Slot Harmonics. IEEE Trans. Ind. Electron. 2019, 66, 9194–9204. [Google Scholar] [CrossRef]
- Xue, S.; Feng, J.; Guo, S.; Chen, Z.; Peng, J.; Chu, W.Q.; Xu, P.L.; Zhu, Z.Q. Iron Loss Model for Electrical Machine Fed by Low Switching Frequency Inverter. IEEE Trans. Magn. 2017, 53, 1–4. [Google Scholar] [CrossRef]
- Boglietti, A.; Ferraris, P.; Lazzari, M.; Pastorelli, M. Influence of the inverter characteristics on the iron losses in PWM inverter-fed induction motors. IEEE Trans. Ind. Appl. 1996, 32, 1190–1194. [Google Scholar] [CrossRef]
- Boglietti, A.; Ferraris, P.; Lazzari, M.; Profumo, F. Iron losses in magnetic materials with six-step and PWM inverter supply (induction motors). IEEE Trans. Magn. 1991, 27, 5334–5336. [Google Scholar] [CrossRef]
- Wang, F.; Zhang, Z.; Mei, X.; Rodríguez, J.; Kennel, R. Advanced Control Strategies of Induction Machine: Field Oriented Control, Direct Torque Control and Model Predictive Control. Energies 2018, 11, 120. [Google Scholar] [CrossRef]
- Karamanakos, P.; Geyer, T. Guidelines for the Design of Finite Control Set Model Predictive Controllers. IEEE Trans. Power Electron. 2020, 35, 7434–7450. [Google Scholar] [CrossRef]
- Cho, Y.; Choi, W.J.; Lee, K.B. Model predictive control using a three-level inverter for induction motors with torque ripple reduction. In Proceedings of the IEEE International Conference on Industrial Technology (ICIT), Busan, Korea, 26 February–1 March 2014; IEEE: New York, NY, USA, 2014; pp. 187–192. [Google Scholar]
- Karamanakos, P.; Geyer, T. Model Predictive Torque and Flux Control Minimizing Current Distortions. IEEE Trans. Power Electron. 2019, 34, 2007–2012. [Google Scholar] [CrossRef]
- Bhowate, A.; Aware, M.; Sharma, S. Synthetic Voltage Vector Selection Criteria in Predictive Torque Control for Performance Improvement of Three Phase Induction Motor Drive. In Proceedings of the 10th International Conference on Power Electronics and ECCE Asia (ICPE 2019—ECCE Asia), Busan, Korea, 27–30 May 2019; IEEE: New York, NY, USA, 2019; pp. 1263–1267. [Google Scholar]
- Cho, Y.; Bak, Y.; Lee, K. Torque-Ripple Reduction and Fast Torque Response Strategy for Predictive Torque Control of Induction Motors. IEEE Trans. Power Electron. 2018, 33, 2458–2470. [Google Scholar] [CrossRef]
- Zhang, Y.; Yang, H. Model Predictive Torque Control of Induction Motor Drives with Optimal Duty Cycle Control. IEEE Trans. Power Electron. 2014, 29, 6593–6603. [Google Scholar] [CrossRef]
- Geyer, T.; Quevedo, D.E. Performance of Multistep Finite Control Set Model Predictive Control for Power Electronics. IEEE Trans. Power Electron. 2015, 30, 1633–1644. [Google Scholar] [CrossRef]
- Zhang, Y.; Bai, Y. Model predictive control of three-level inverter-fed induction motor drives with switching frequency reduction. In Proceedings of the 43rd Annual Conference of the IEEE Industrial Electronics Society (IECON 2017), Beijing, China, 29 October–1 November 2017; IEEE: New York, NY, USA, 2017; pp. 6336–6341. [Google Scholar]
- Boglietti, A.; Ferraris, P.; Lazzari, M.; Profumo, F. Effects of different modulation index on the iron losses in soft magnetic materials supplied by PWM inverter. IEEE Trans. Magn. 1993, 29, 3234–3236. [Google Scholar] [CrossRef]
- Patel, Y.P.; Tallam, R.M.; Brown, B.P.; Busse, D.F.; Hu, J.; Campuzano, D.; Strandt, A.R. Mitigation of the Effects of Common-Mode Current on the Operation of SCR-Based Rectifiers for AC Drives. In Proceedings of the 2015 IEEE Energy Conversion Congress and Exposition (ECCE), Montreal, QC, Canada, 20–24 September 2015; IEEE: New York, NY, USA, 2015; pp. 2949–2955. [Google Scholar]
- Youssef, A.B.; El Khil, S.K.; Slama-Belkhodja, I. State Observer-Based Sensor Fault Detection and Isolation, and Fault Tolerant Control of a Single-Phase PWM Rectifier for Electric Railway Traction. IEEE Trans. Power Electron. 2013, 28, 5842–5853. [Google Scholar] [CrossRef]
- He, L.; Xiong, J.; Ouyang, H.; Zhang, P.; Zhang, K. High-Performance Indirect Current Control Scheme for Railway Traction Four-Quadrant Converters. IEEE Trans. Ind. Electron. 2014, 61, 6645–6654. [Google Scholar] [CrossRef]
- Fuentealba Vidal, E.; Eidt Colling, I.; Barbi, I. A Bidirectional PWM Three-Phase Step-Down Rectifier Based on the Differential-Mode Power Conversion Principle. IEEE Trans. Power Electron. 2009, 24, 2951–2958. [Google Scholar]
- Drabek, P.; Peroutka, Z.; Pittermann, M.; Cedl, M. New Configuration of Traction Converter with Medium-Frequency Transformer Using Matrix Converters. IEEE Trans. Ind. Electron. 2011, 58, 5041–5048. [Google Scholar] [CrossRef]
- Chakraborty, S.; Vu, H.-N.; Hasan, M.M.; Tran, D.-D.; Baghdadi, M.E.; Hegazy, O. DC-DC Converter Topologies for Electric Vehicles, Plug-in Hybrid Electric Vehicles and Fast Charging Stations: State of the Art and Future Trends. Energies 2019, 12, 1569. [Google Scholar] [CrossRef]
- Zhang, Y.; Zhao, Z.; Lu, T.; Yuan, L.; Xu, W.; Zhu, J. A comparative study of Luenberger observer, sliding mode observer and extended Kalman filter for sensorless vector control of induction motor drives. In Proceedings of the 2009 IEEE Energy Conversion Congress and Exposition, San Jose, CA, USA, 20–24 September 2009; IEEE: New York, NY, USA, 2009; pp. 2466–2473. [Google Scholar]
- Gacho, J.; Zalman, M. IM Based Speed Servodrive with Luenberger Observer. J. Electr. Eng. 2016, 61, 149–156. [Google Scholar] [CrossRef]
- Rodriguez, J.; Cortes, P. Predictive Control of Power Converters and Electrical Drives; Wiley-IEEE: Hoboken, NJ, USA, 2012; 246p. [Google Scholar]
© 2020 by the authors. Licensee MDPI, Basel, Switzerland. This article is an open access article distributed under the terms and conditions of the Creative Commons Attribution (CC BY) license (http://creativecommons.org/licenses/by/4.0/).