1. Introduction
The development of Autonomous Vehicles (AVs) poses novel problems regarding ethics, safety, cybersecurity, and social acceptance. It is expected that these vehicles will be safer with respect to the human-driven ones and, thanks to the new connectivity capabilities in terms of both vehicle-to-vehicle (V2V) and vehicle-to-infrastructure (V2I) communications, more able to reduce the traffic inside cities. It is a disruptive technology that puts on the table issues about safety, security, ethics, and social acceptance. In particular, the latter is an important point to be taken into account, since, if the users do not trust those vehicles, all these advantages will be lost.
We claim that an improvement in the trustiness on these vehicles can also improve their social acceptance. Of course, acceptance is a complex and multi-faceted phenomenon [
1]. Acceptance studies are a novel field but, among authors, the idea that technological improvements can be assessed only when considered as part of a social, economic, and usage-related context is widespread. Considering that the development of the AVs is in the prototype stage, there are many activities aimed at improving these vehicles. The first, of course, are those related to the development of the driving algorithms. Such algorithms, other than the instruction sequences, need also a huge set of calibration parameters that can be equivalent from the safety and vehicle stressing point of view, but that can have different effects from the passengers’ perspective. As an example, the way in which an autonomous vehicle decides to approach a road bend, either moving toward the center of the lane or towards the side of the road, can be perceived in different ways by people depending on the surrounding conditions, such as weather or other traffic, and their emotional states.
Similarly, the AV may react to a fault according to many different strategies to preserve functional safety [
2]. This is possible thanks to the mitigation strategies added by the manufacturers to isolate the effects of dangerous faults, making them safe. Unfortunately, it is not always possible to maintain the same level of performance. In this case, we are in the presence of
graceful degradation mitigation techniques that guarantee the same safety level of the original functions but with less comfort. On a prototype vehicle, it is possible to inject the fault we want to assess, engaging its failure effect mitigation algorithm. At this point, thanks to the proposed emotions recognition system, it is possible to evaluate the effect of the algorithm on the passengers’ feelings, obtaining an objective metric on how the performance degradation can be acceptable by the users’ perspective.
The main contribution of this paper is the implementation of a proof-of-concept system to improve calibrations of AVs driving algorithms. The idea is to provide objective classifications of the passengers’ reactions to autonomous vehicle decisions, thus helping the driving functions calibration on the basis of an analysis that is less sensitive to the subjectivity and variability of post-drive responses to questionnaires. To achieve this result, we developed a system to recognize the emotions that the passengers are feeling with different calibrations in an objective and automatic manner. We adopted known techniques, such as emotions recognition through neural networks and 3D ambient reconstruction. To improve the emotions recognition accuracy, we chose and trained state-of-the-art neural networks on databases available in the literature. These databases are often used individually for training and test phases, but we thought that merging them would improve networks generalization capabilities. We largely described the training results to allow readers to evaluate the accuracy of the system. Moreover, we prepared an environment to perform the emotion detection, able to work off-line or in real-time. The off-line environment is intended for post-processing videos, recorded during driving sessions, for classifying human emotions, while providing to observers the ability to manually validate the neural network results. Conversely, the real-time environment is intended for use during test drive sessions, as it performs on-the-fly classification of human emotions.
The rest of the paper is organized as follows.
Section 2 presents the state of the art on emotion recognition through neural networks and the development of autonomous vehicles.
Section 3 describes the proposed approach.
Section 4 describes the training results obtained with the chosen neural networks.
Section 5 describes the experimental results obtained with the proof-of-concept system.
Section 6 draws some conclusions.
2. State of the Art
As humans, we are instinctively able to determine the emotions that our fellows are feeling. It is well known that facial expressions are a fundamental part of this social ability. In the 1970s, the American psychologist Paul Ekman scientifically studied this phenomenon. In 1972 [
3], he published the list of the six primal emotions shared among all human groups, independently from their culture: anger, disgust, fear, happiness, sadness, and surprise. In the following years, he and other researchers added to this list other emotions. For our purposes, and considering n the labels available in the chosen facial expressions databases, we considered only eight basic emotions: the six proposed in 1972 plus contempt and neutrality. For our automotive application, however, we were interested in recognizing only five of them: fear, happiness, neutrality, sadness, and surprise. We chose to keep recognition of all of them to make the obtained results interesting for a wider audience.
Ekman developed also the
Facial Action Coding System (FACS) [
4]. Facial expressions are performed thanks to facial muscles; hence, they are, from the physical point of view, possible configurations of those that are moved one by one or in groups. These groups of muscular movements are called
Action Units (AUs). Thus, it is possible to classify a facial expression resorting to a weighted evaluation of those AUs. Thanks to these evaluations, it is possible to make the facial expressions determination more objective. However, to make things even more complex, the same emotion can be shown with different groups of AUs, thus there is a huge intraclass variability. If the labeling of the considered facial expression has been performed by analyzing the AUs, the picture is marked as FACS encoded. Furthermore, facial expressions can be posed or spontaneous: while the latter are more common to see in everyday life, the former are a more caricatural, exaggerated version of the same.
Various scientists worked on this topic in the years, hence, nowadays, many pictures of posed and spontaneous facial expressions, organized in databases, are available in the literature. The databases selected for this work are:
The
Extended Cohn–Kanade (CK+) database [
5,
6] contains 593 sequences from 123 subjects portrayed in all eight emotional states considered in this document. Each sequence starts from a neutral state and then gradually reaches the peak of the considered emotion. Overall, 327 of the 593 sequences are FACS coded.
The
Facial Expression Recognition 2013 (FER2013) Database [
7] is composed of 35,887 pictures of
pixels retrieved from the Internet. Since the original labeling method has demonstrated itself erroneous in some cases, a newer set of annotations named FER+ [
8] was released in 2016. It contains labels for 35,488 images since the remaining 399 do not represent human faces, and it also adds the contempt emotion.
The
Japanese Female Facial Expression (JAFFE) database [
9] contains 213 grayscale photos of posed facial expressions performed by 10 Japanese women. Each image has been rated on six emotional adjectives by 60 Japanese subjects.
The
Multimedia Understanding Group (MUG) database [
10] contains photos of 86 models posing six emotional states: anger, disgust, fear, happiness, sadness, and surprise. The images of this database are taken inside a photographic studio, thus in controlled illumination conditions.
The
Radboud Faces Database (RaFD) [
11] is a collection of photos of 67 models, posing all eight emotional states considered in this paper. Each picture was taken from five different angles simultaneously.
The
Static Facial Expression in the Wild (SFEW 2.0) database [
12] is composed of frames extracted from different movies depicting people having seven different emotional states: anger, disgust, fear, happiness, neutrality, sadness, and surprise. For our purposes, we decided to use only the 1694 labeled aligned images.
The
FACES database [
13] is a collection of 2052 images taken from 171 actors. They acted two times the following six facial expressions: anger, disgust, fear, happiness, neutrality, and sadness. The actors are further divided into three different age classes.
To the best of our knowledge, in the literature results obtained by merging various facial expressions databases to train a neural network are not available. We thought that this merging operation could be very useful to augment the image variability in terms of the number of portrayed people, light conditions, backgrounds in which the photos were taken, etc. We called these
database ensembles and we developed an open-source tool to simplify their creation, as described in
Section 3.1.
The Society of Automotive Engineers (SAE) defined six levels [
14] of driving automation, starting from 0 when the driving is completely in charge of the driver, up to level 5, where the vehicle drives by itself in any condition. Various authors studied the interactions between these automations and humans, focusing especially on how the Advanced Driver Assistance Systems (ADAS) integrated into the car should interact with the driver [
15] and about the adaptation of the digital cockpit to different driving situations [
16]. Other devices installed inside cars are driver fatigue and drowsiness sensors. They work thanks to a sensor for detecting the steering wheel angle, electrocardiogram performed on the steering wheel surface [
17], and cameras that, thanks to a computer vision algorithm, can detect the frequency at which the driver blinks [
18].
While these applications are applied during the driving, we are interested in the algorithm calibration phase, before the vehicle is shipped, especially for the trajectory planning (examples of the involved coefficients can be found in [
19]). This can help carmakers to choose algorithms and respective calibrations that best suite their customer expectations. To the best of our knowledge, no author has yet proposed the use of emotion recognition through computer vision to calibrate autonomous driving algorithms.
3. Proposed Approach
As described in the previous section, it is possible to determine people’s emotions by their facial expressions. It is not possible to write “by hand” a software function to analyze the pictures of the passengers’ faces and determine their emotions with a good performance so we adopted a machine learning approach. We expect that, thanks to a properly trained neural network, it will be possible to solve this challenge. From the operative point of view, we decided to divide the development of the proof-of-concept calibration system into three different phases:
We developed a tool, called Facial Expressions Databases Classifier (FEDC) [
20], able to perform different operations on the selected databases images in order to prepare them for the training of the neural networks. FEDC can also be used to make the supported databases homogeneous so that they can be merged. We called these derived datasets database ensembles (DE).
We chose the most suitable neural networks available from the literature, and trained them with single databases as well as with some database ensembles to compare them by means of objective metrics that we define below.
We create 3D graphics reconstructed scenarios depicting some driving situations with different calibrations of the autonomous driving algorithm. By showing them to testers, and analyzing their facial expressions during the representations, we determined what calibrations are preferred by passengers.
3.1. Facial Expressions Databases Classifier
It provides an easy to use Graphical User Interface (GUI) that allows the operator to select the database he/she wants to classify, the output directory, and some post-processing options he/she wants to apply to the images, displaying the current operation with a progress bar and an informative label. More technically, the tool takes the images from the database file provided by the databases’ editors, creates a number of folders equal to the number of emotions present in the chosen database, and moves the images. After that, the selected post-processing operations can be applied, in the relative folder, using the cataloging system adopted by databases’ editors. This tool has been released as open source under the MIT license on GitHub [
20] and it is constantly updated.
3.1.1. Partitioning of the Dataset
To properly train a neural network, it is a good practice to divide the databases into three smaller datasets:
The training dataset is used to effectively train the network.
The validation dataset is used to evaluate the neural network performances during the training.
The test dataset is used to test the capability of the neural network to generalize by using different samples from the ones involved in the training.
If the subdivision option is enabled, FEDC creates the train, test, and optionally the validation folder, each one containing a subfolder containing the related images of every emotion of the selected database. The user can choose how to subdivide the database images for the datasets as a percentage, making using of two sliders in the case that the validation subdivision is disabled, or three.
3.1.2. Performance Enhancement Features
The most recent version of FEDC (4.0.3) can also perform the following operations on the images:
change image format;
conversion in grayscale color space;
crop the images to face only;
histogram equalization (normal or CLAHE);
scaling of horizontal and vertical resolutions; and
transformation of rectangular images into square ones.
3.2. Choice of the Neural Networks
To obtain effective results, we searched for the best neural networks made specifically for facial expression recognition. Our choice fell on the following two state-of-the-art networks, designed with different approaches. Ferreira [
21] published in 2018 a deep network that is relatively complex and has a default image size of 120x120 pixels. Miao [
22] published in 2019 a shallow neural network that is much simpler and has a default image resolution of 48x48 pixels. Both, in their default configuration, have about 9 million parameters, but, by setting a resolution of images of 48 × 48 pixels for the network in [
21], it is possible to reduce its parameters to about 2 million. This reduction allows performing emotion recognition on single board computers, opening the door to a reduction of the cost of these tests. In this way, it is possible to run the tests in real-time on autonomous vehicle prototypes. This is important since running the tests without storing face images allows increasing the number of testers.
3.3. Calibration Benchmark Applications
After we obtained some suitable neural networks, we used them to assess the effects of different
calibrations on the passengers’ feelings considering different
situations within common
scenarios. To perform emotion recognition, we developed a utility software, called
Emotions Detector, using Java and the OpenCV, DeepLearning4J (DL4J) [
23], and Apache Maven libraries. It can acquire both images from a webcam or frames of a prerecorded video, crop them to the face only, apply the post-processing algorithms needed by the neural network, and run the network on them. At the end of the process, the images themselves and their emotions probability distributions are saved automatically to obtain a test report. We defined:
Calibration: A set of parameters that determine the behavior, in terms of trajectory (acceleration ramps, lateral distances from obstacles, and preferred lateral accelerations) and, in general, all the numerical parameter (not considered in this paper) needed to properly develop an AV driving algorithm.
Sscenario: The environment (real or virtual) in which the vehicle’s behavior is shown with different calibrations and traffic conditions.
Situation: A combination composed of a calibration, a scenario, and a traffic conditions set, to be shown to testers.
The situations can be represented both in simulators and real vehicles. Of course, the use of a real vehicle can give better results, but ensuring the repeatability of the tests requires the use of a closed track and other vehicles for the traffic, making the tests extremely expensive.
4. Neural Networks Training
We decided to focus on neural networks training since the evaluation of their accuracies is fundamental to achieve an objective emotions detection.
Section 4.1 describes the training set-up.
Section 4.2 describes the metrics to assess the performances of the networks, and ways to improve them performing operation such as cross validation, data augmentation, and normalization.
Section 4.3.1 describes the results obtained training the network [
21] on the CK+ database.
Section 4.3.2 describes the results obtained from the networks trained on the FER2013 database.
Section 4.3.3 describes the results obtained training the networks on the database ensembles. For the reader convenience, these results are summarized in
Section 4.4.
For the training of the aforementioned neural networks (see
Section 3.2), we chose the following databases in order to be able to compare the results of our implementations with those obtained by neural networks’ authors:
CK+, which was used only for the network in [
21] because it was not used by the authors of [
22]; and
FER2013.
We also prepared the following two database ensembles recurring to FEDC:
Ensemble 1, composed of all the labeled images from all the databases supported by FEDC; and
Ensemble 2, composed of all the posed facial expressions images from the databases CK+, FACES, JAFFE, MUG, and RaFD.
We performed training in 23 different configurations.
Table 1 indicates the number of pictures for each emotion that can be found in the chosen databases.
4.1. Training Environment Set-Up
We chose to use Keras [
24] as a high-level abstraction API because it is simple to use and, for some years now, it has been one of the most widely used solutions for neural networks training. It can abstract three different frameworks for machine learning: TensorFlow [
25], Microsoft Cognitive Toolkit (CNTK) [
26], and Theano [
27]. All three proposed solutions adopt an open source-like license. For our purposes, we chose to use TensorFlow. Other utility libraries adopted to speed-up the code writing and to improve the presentation of the experimental results are:
Matplotlib [
28], a 2D plotting library for Python;
NumPy [
29], a package for scientific computing for Python;
Open Source Computer Vision Library (OpenCV) [
30], a computer vision and machine learning software library for C++, Java, MATLAB, and Python;
Pandas [
31], which provides high-performance, easy-to-use data structures and data analysis tools for Python; and
Scikit-learn [
32], a library for data mining and data analysis.
4.2. Performance Assessment Metrics
An (artificial) neural network is a mathematical system. The name “neural networks” comes from the conceptual similarity to the biological neural system. From the mathematical point of view, a “neuron” is a mathematical function with a certain number q of inputs, and one output, y. Those inputs are linearly combined to determine the activation signal s, with the equation . is usually called the bias parameter. After the sum node, a non-linear function is applied to s, obtaining the output signal . is commonly called activation function. Popular activation functions are historically the sigmoidal function and, nowadays, the ELU, ReLU, and LeakyReLU functions.
Various layers of this kind compose a neural network. In the literature, it is possible to find various neural networks designed for various purposes.
4.2.1. Underfitting and Overfitting
The primary objective of a neural network is to create a model that is able to generalize. This implies that a good model can work in the same way with both already seen and new unseen data. There are two different ways in which the system is unable to achieve this ideal behavior:
If a model has not learned sufficient characteristics from the input data, it will not be able to generalize towards new data, therefore it will underfit.
Conversely, if it has learned too many features from the training samples, it will limit its ability to generalize towards new data: in this case, the model will overfit.
Not all the network parameters are chosen during the training. Some of them have to be set before the training or are determined by the neural network structures. The former are called hyperparameters. Before describing the experimental results, it is better to define some terms:
Learning rate defines the update “speed” of the parameters during the training. If it is lower with respect to the ideal one, the learning is slowed down but become smoother; on the contrary, if its value is too high, the network can diverge or underfit.
Sample is an element of a database. In our case, it is a picture of a human face with a facial expression properly labeled with the represented emotion.
Batch is a set of N samples processed independently and in parallel. During the training process, a batch corresponds to a single update of the network parameters.
Epoch is usually a passage on the entire dataset and corresponds to a single phase of the training.
For each experiment, we computed these metrics:
Accuracy is defined as
where
is the number of correct predictions and
P is the number of total predictions. For this metric, the higher is the better.
Loss represents how bad the model prediction is with respect to a single sample. For this metric, the lower is the better. In the literature, there are l many different methods to compute this parameter, such as binary cross-entropy, categorical cross-entropy, mean absolute deviation, mean absolute error, mean squared error, Poisson, squared hinge, and so on. For our purposes, we chose to compute this metric as a categorical cross-entropy, defined as:
This loss function must be used for single label categorization, i.e. when only one category is applicable for each data point. It is perfectly suited to our cases, since we formulated the hypothesis that each image (sample) can represent only one of the considered emotions (category).
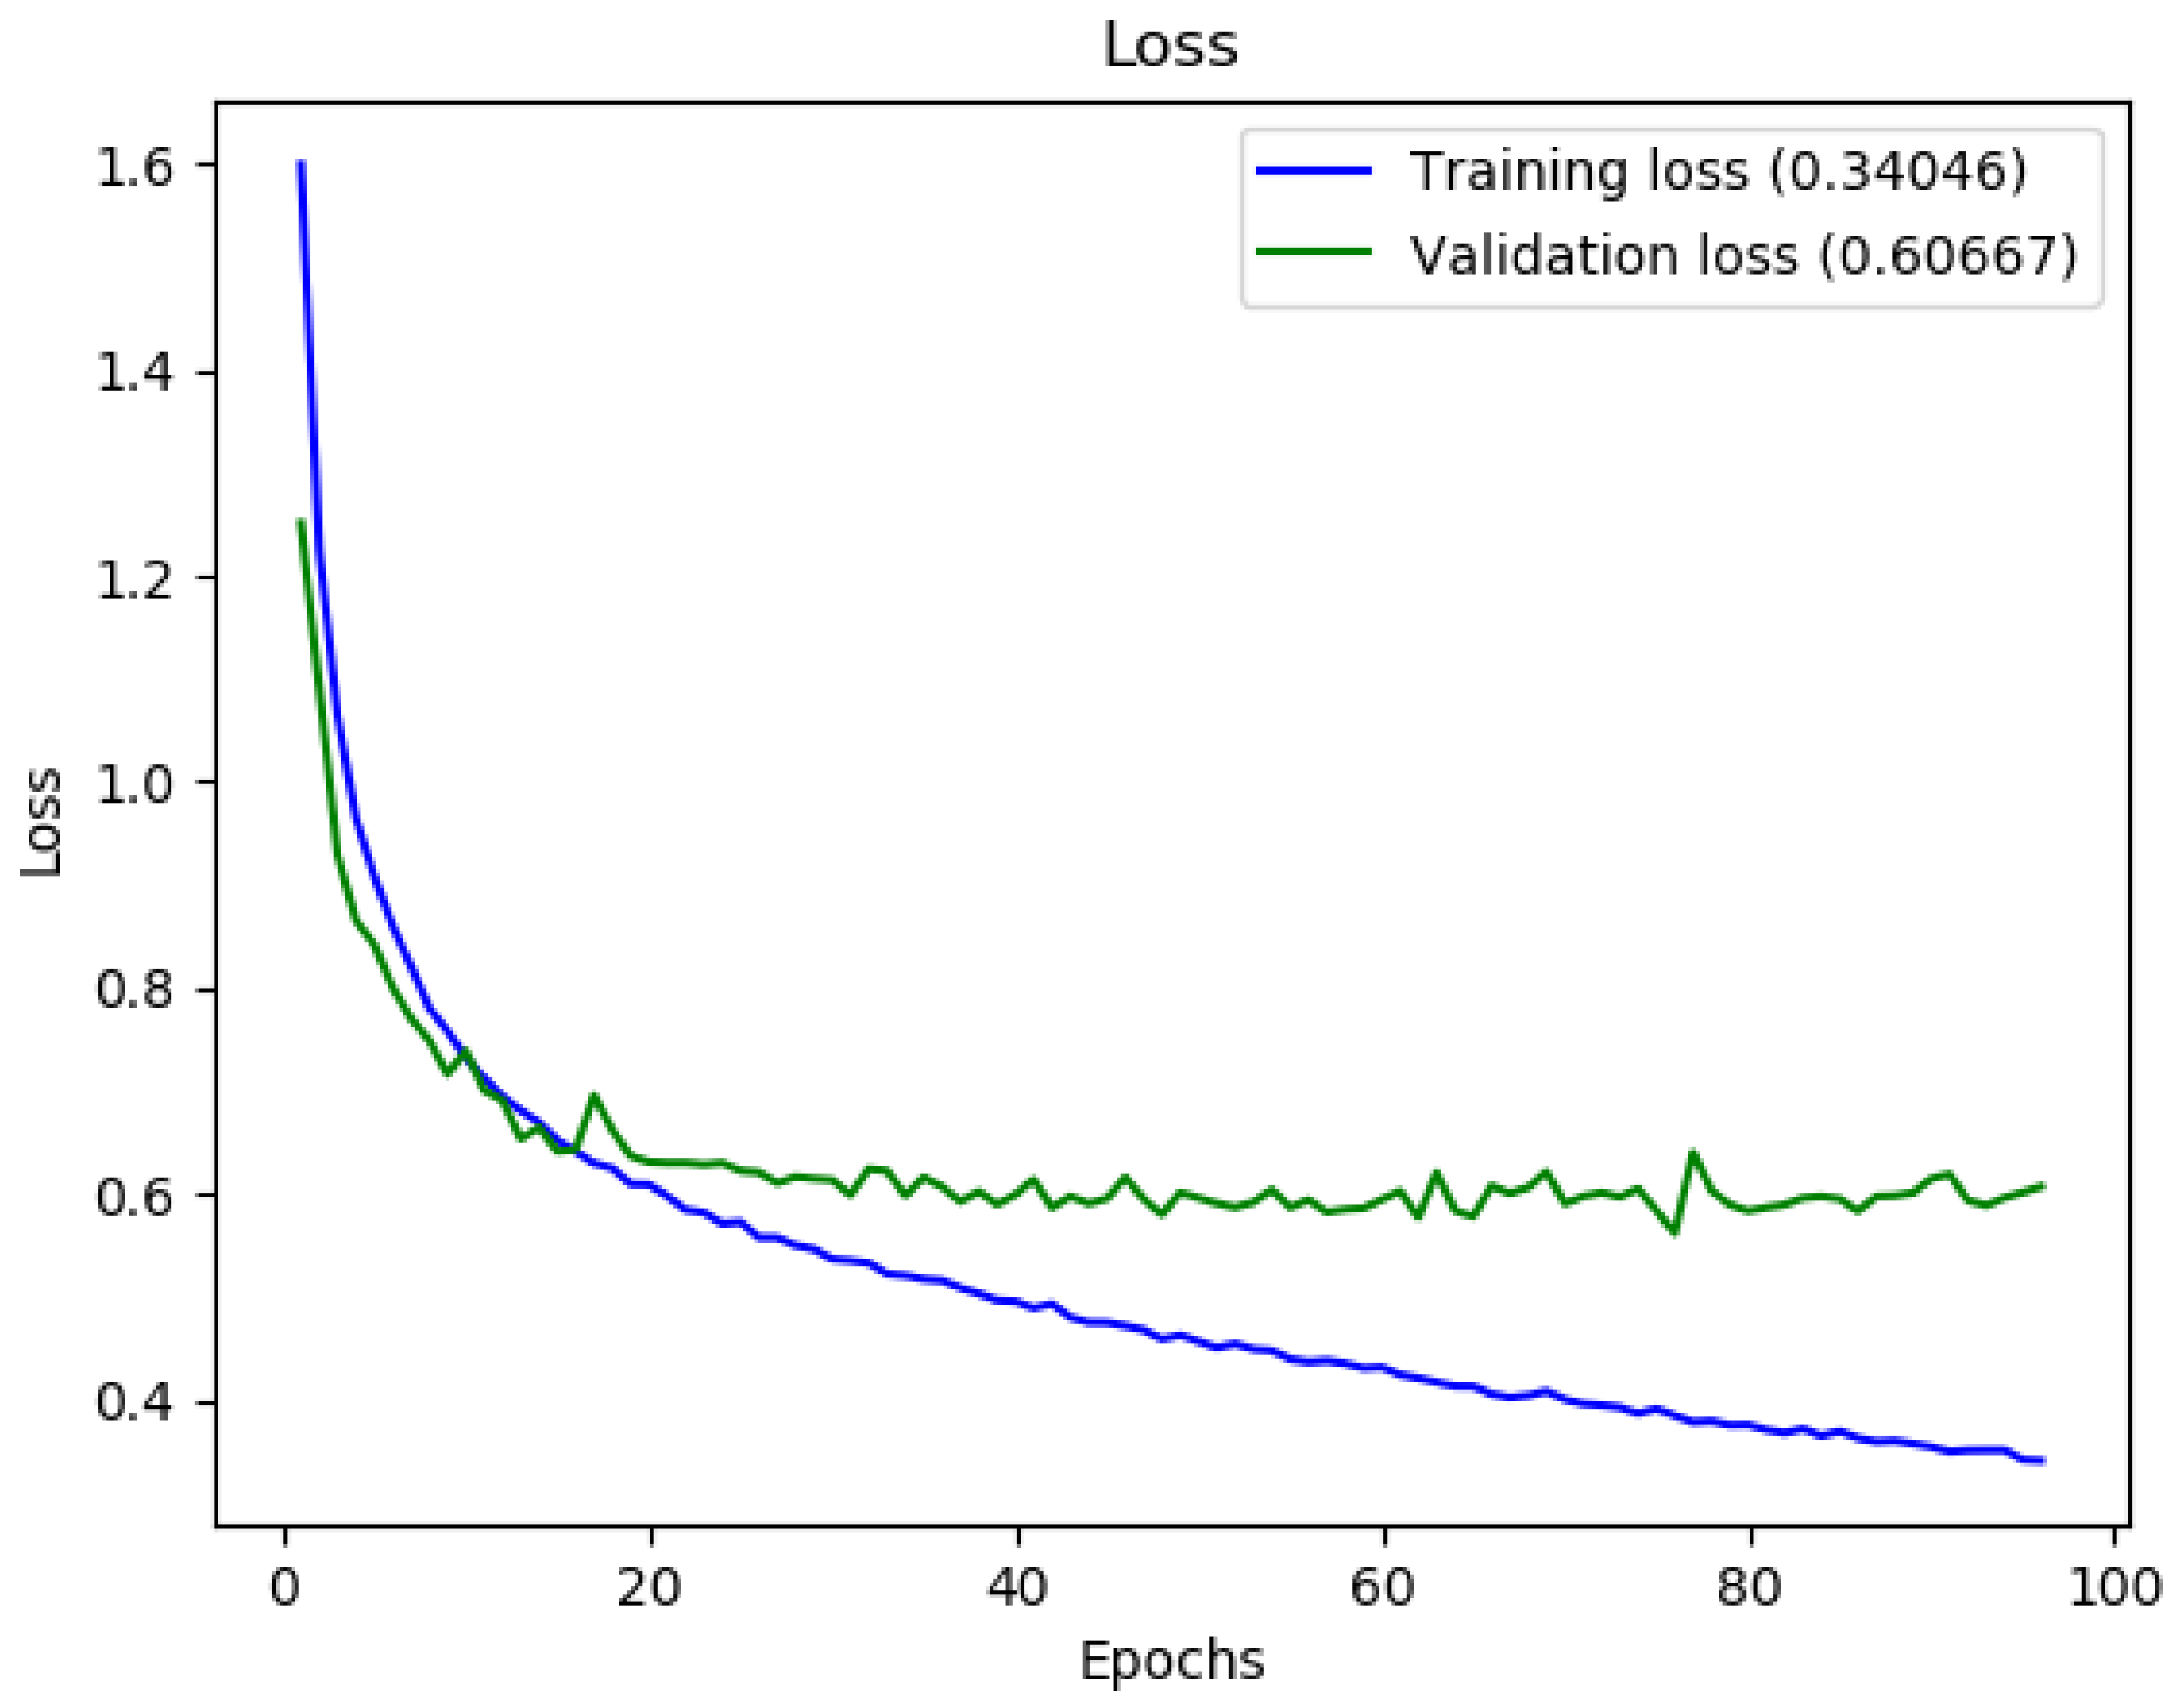
In particular, the curve composed by the various losses computed in each epoch, called loss curve in the literature, is important to determine if the model underfits or overfits. If the training dataset loss curve is much greater than the one of the validation dataset, we are in underfitting conditions. If the loss curves are near, we probably obtained a good model. Finally, if the loss curve of the training dataset is instead much lower than that of the validation dataset, it indicates the presence of overfitting [
33].
Confusion matrix: Considering that the classification system has been trained to distinguish between eight different emotions, the confusion matrix summarizes the result of the testing of the neural network. It is a particular contingency table in which emotions are listed on both sides. In the top row, there are the labels of the pictures (ground truths), while in the left column there are the predicted categories (emotions).
4.2.2. Cross Validation
To reduce overfitting, it is possible to adopt the cross-validation technique. It consists in partitioning the dataset into multiple subsets, some of which are used for training and the remaining for validation/testing purposes. In the literature are described various kinds of techniques, such as Leave-One-Out Cross-Validation (LOOCV), k-Fold, Stratified, and Time-Series. Stratified is used when we are dealing with binary classification problems, while Time-Series is used when the dataset is composed of observation made at different times; hence, these two are not suitable for our purposes. For this work, LOOCV or k-Fold can be chosen. We chose the latter, putting . In the k-Fold, the dataset is split into k folds (subsets) of approximately the same size: folds are used for training, while the remaining one is used for validation or test. Using the FEDC database subdivision function, we divided the database into two subsets: one containing 90% of the images, which was used for training and validation, while the remaining 10% was used to perform the test. Before the training, we further split the first subset into nine smaller subsets: eight of them were used for training, while the remaining one was used for validation. Changing the validation subset after each training, it was possible to perform nine different training of the neural network, in order to pick the one that performed better.
4.2.3. Data Augmentation
Data augmentation is adopted when a low number of samples is available. The idea is to modify them in different ways in order to artificially increase their number. For example, in the case of images, augmented ones can be obtained by rotating, reflecting, applying translations, and so on. In this way, it is possible to improve the generalization capability of the network without modifying the model. For our purposes, we applied different transformations on the images. In all the training, we applied these data augmentations:
brightness range from to ;
random horizontal flip enabled;
rotation interval between deg;
shear range of ;
width and height shift range of ; and
zoom transformation interval between .
4.2.4. Normalization
To improve the training process, we applied, alternately, two different normalizations to the grayscale space of the images:
[0,1] and
z-score normalization. The [0,1] normalization is a particular case of the
scaling to range normalization, defined generally by the formula:
in which
is set to 0 and
is set to 1. The
z-score normalization, sometimes called
standardization, is used to obtain a distribution with mean
and standard deviation
. The applied formula is:
in which
x represent the 8-bit brightness value of the images,
and
are, respectively, the minimum and the maximum brightness within the images,
is the arithmetic average of the brightness of all the pixels of the images, and
its standard deviation.
4.3. Training Results
We implemented the networks within the Keras environment, as described elsewhere. The code to train the network can be found at [
34]. For the network in [
22], we did not encounter any problems, while, for the network in [
21], we faced an ambiguity in the “e-block” layer because, in the paper, it is not clearly described how to implement the relative “crop and resize” operation. We decided to implement it as a single convolutional layer, in which the kernel size is defined according to the resolution of the input images. For 120 × 120 pixels images, which is the default input size for the network, the kernel size is 106 × 106, while, for 48 × 48 pixels images, which is the size of the picture of the FER2013 database, the kernel size is 43 × 43. In both cases, we have set the number of output filter to 64, in order to make the next multiplication operation possible. We trained the networks with these datasets:
CK+ database [
5,
6] (only for the network in [
21] );
Ensemble 1; and
Ensemble 2.
For each training, we used the “EarlyStopping” callback to stop the training if, after 18 consecutive epochs, there was no improvement in the loss curve computed on the validation dataset. In some trainings, we also set the “ReduceLROnPlateau” callback to multiply the learning rate by 0.99 or 0.95 in every epoch.
To avoid being excessively long and boring, we only report the most interesting cases. The other cases can be found in [
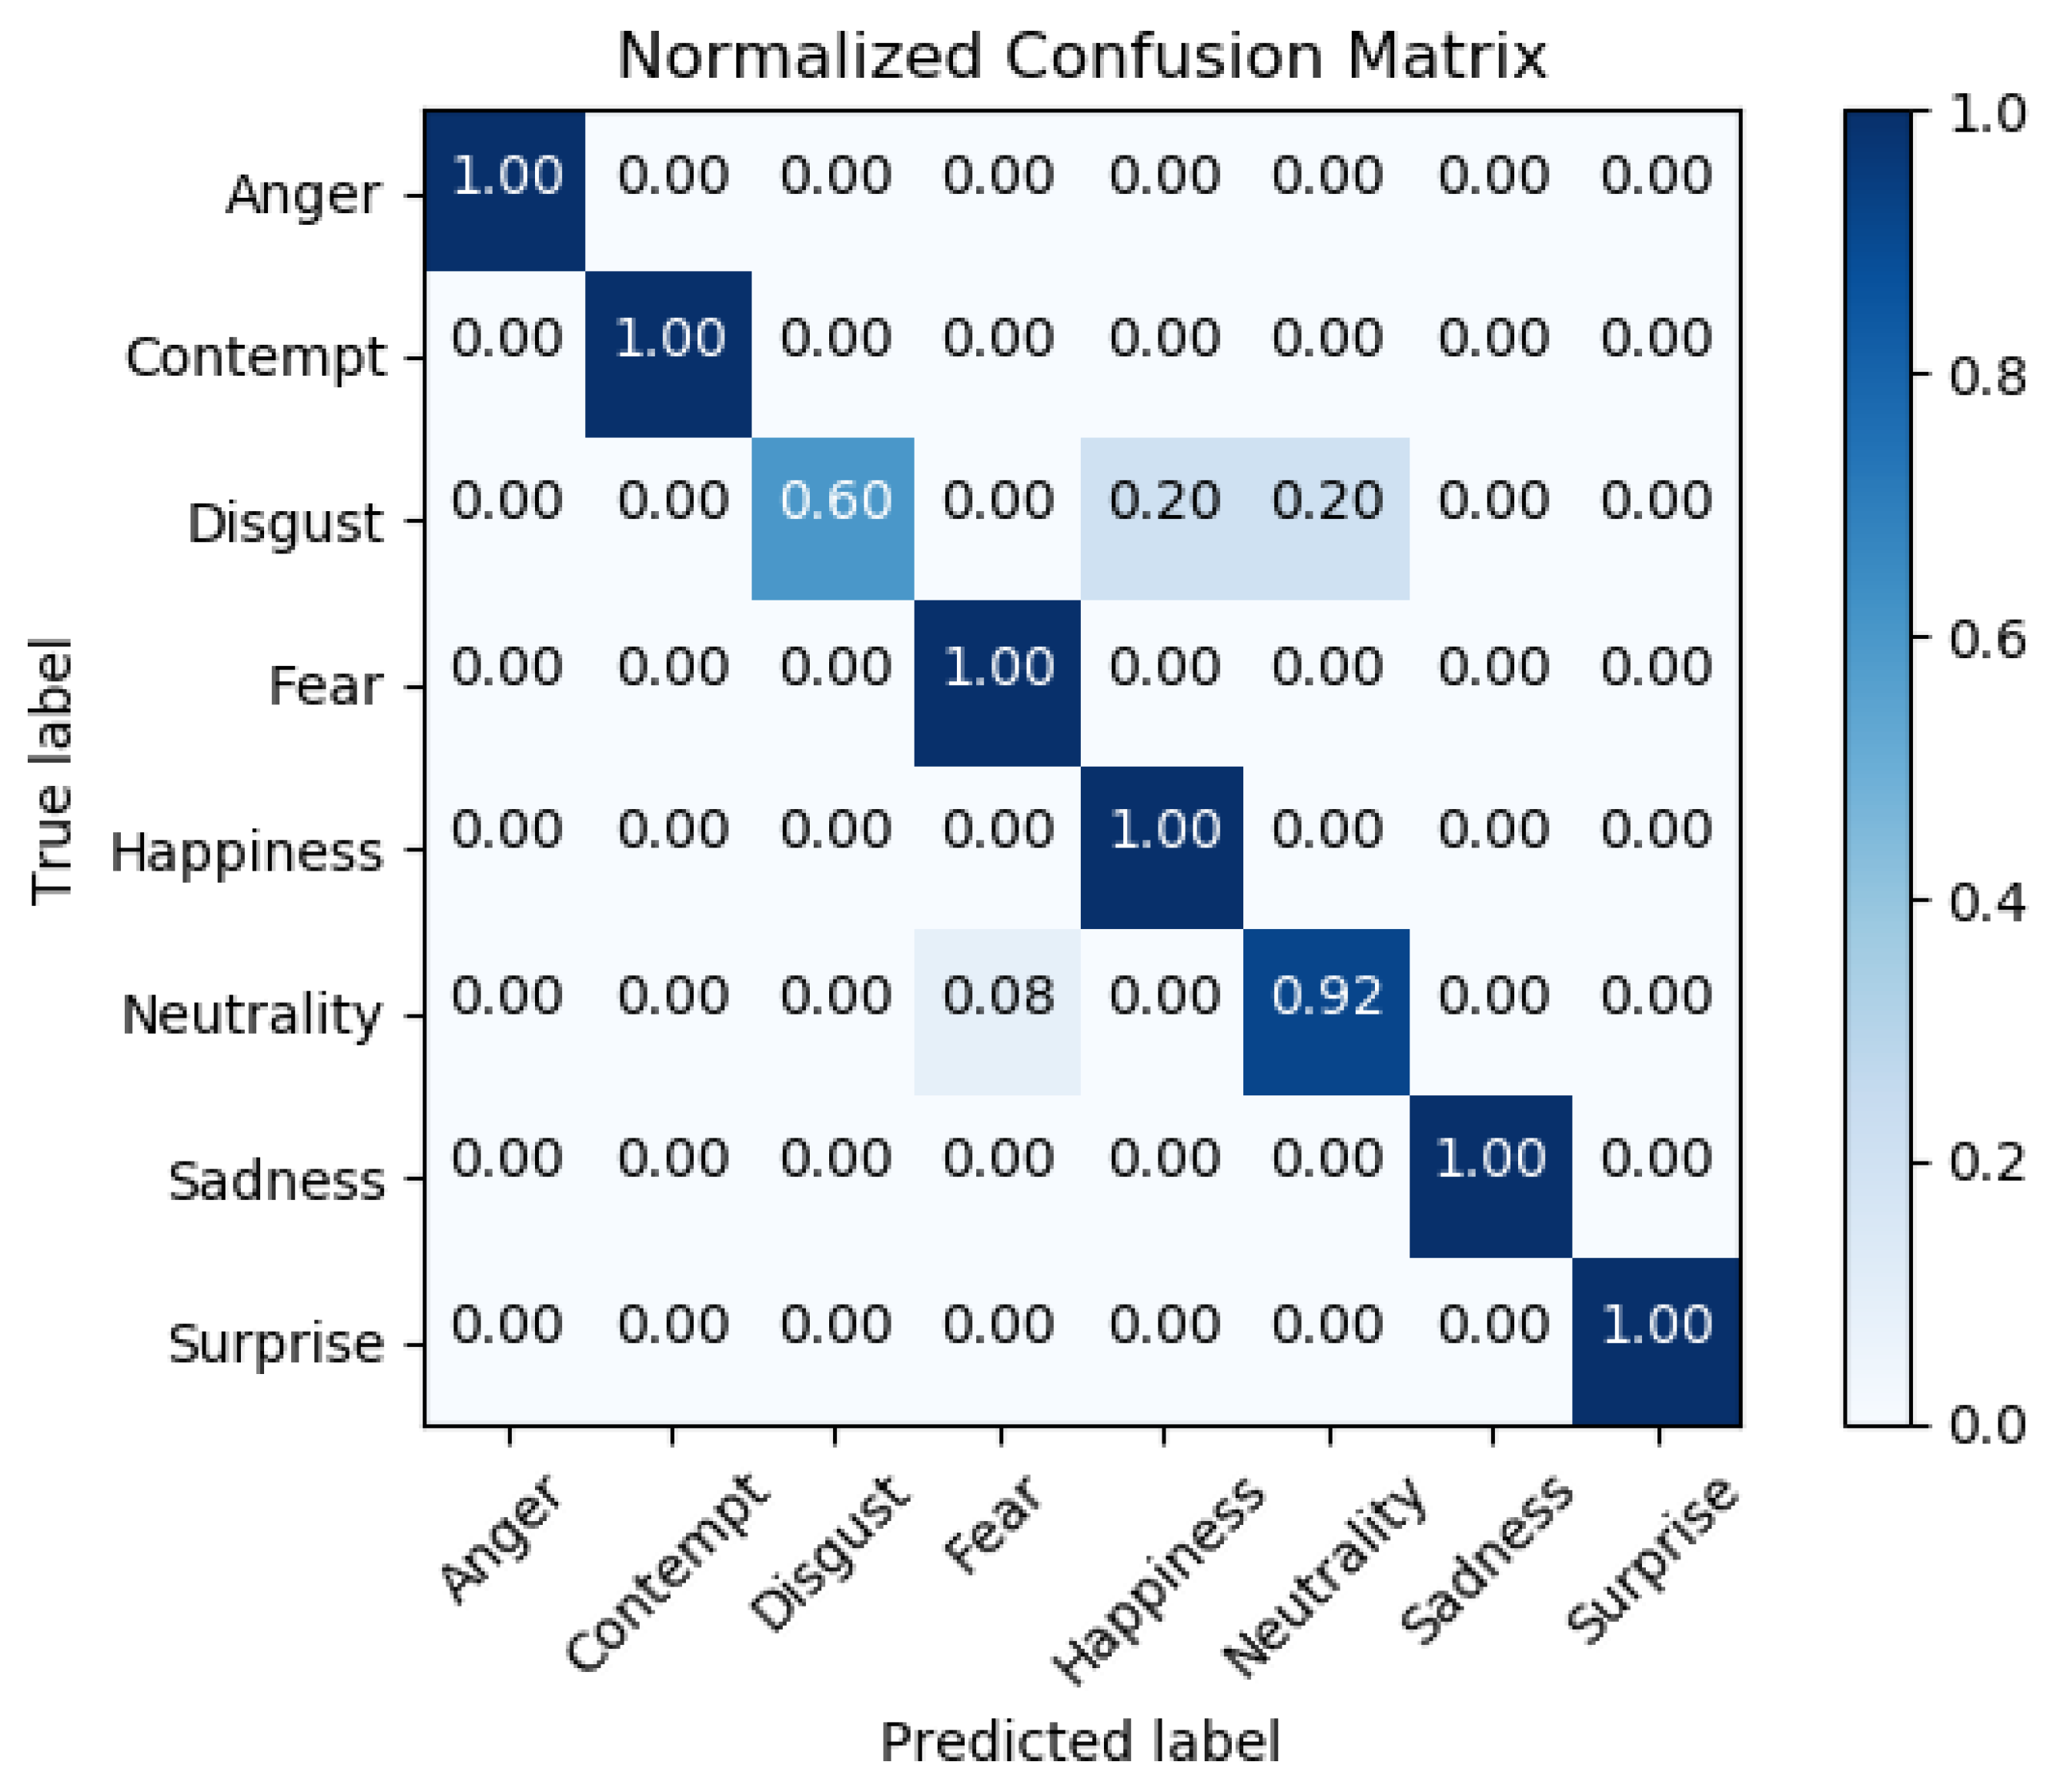
35]. The cases we selected are in bold in Table 3: for each of them, we report its accuracy graph, its loss graph, and its confusion matrix.
As hyperparameters, we set:
4.3.1. CK+ Database
The first training of the network in [
21] was performed on the CK+ database, resized to a resolution of 120 × 120 pixels. With the previously said division, it was split in this way: 364 images were used for training, 46 images were used for validation, and 40 images were used for testing.
The results obtained are in line with the one presented in [
21], thus our implementation seems to work properly.
4.3.2. FER2013 Database
The FER2013 [
7] database has a huge number of pictures, but the resolution of the images is only 48x48 pixels. Instead of performing an upscaling of these pictures, we decided to modify the network in [
21] to work, as described previously, with these low-resolution images.
We used the same settings and hyperparameters adopted from the CK+ database, increasing only the batch size to 100. We therefore obtained 28,712 images for training, 3590 for validation, and 3585 for testing.
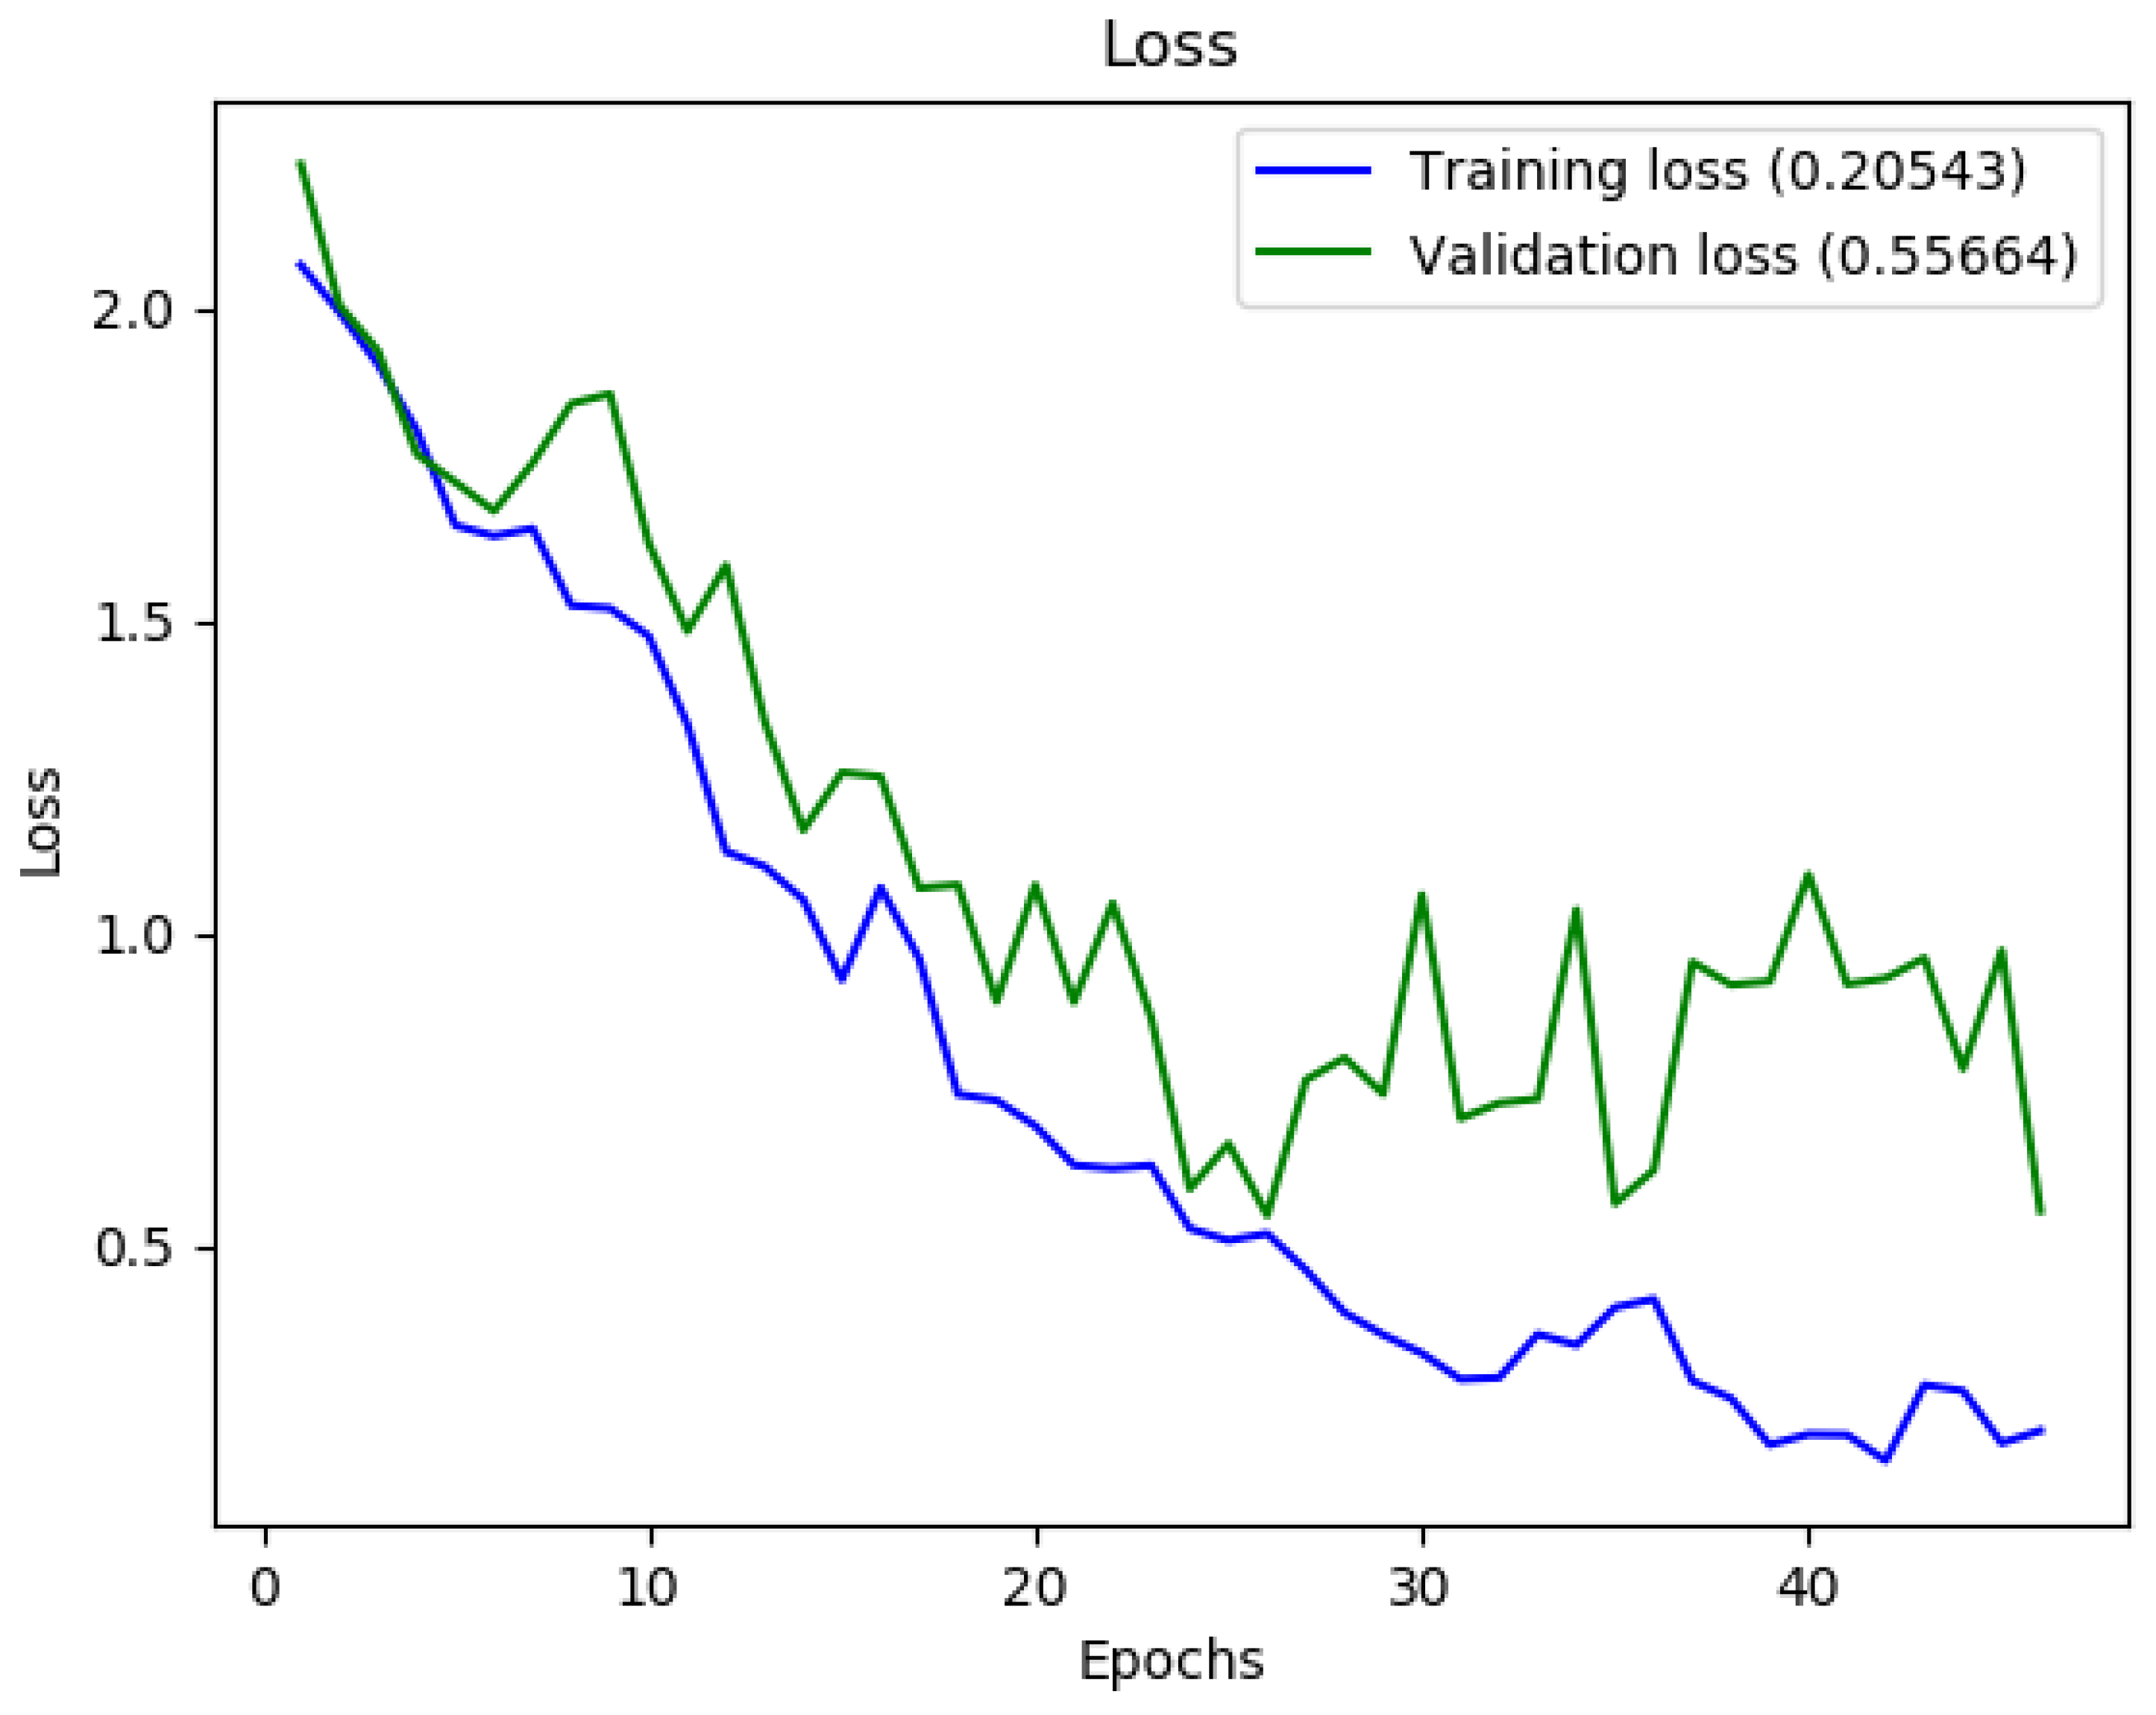
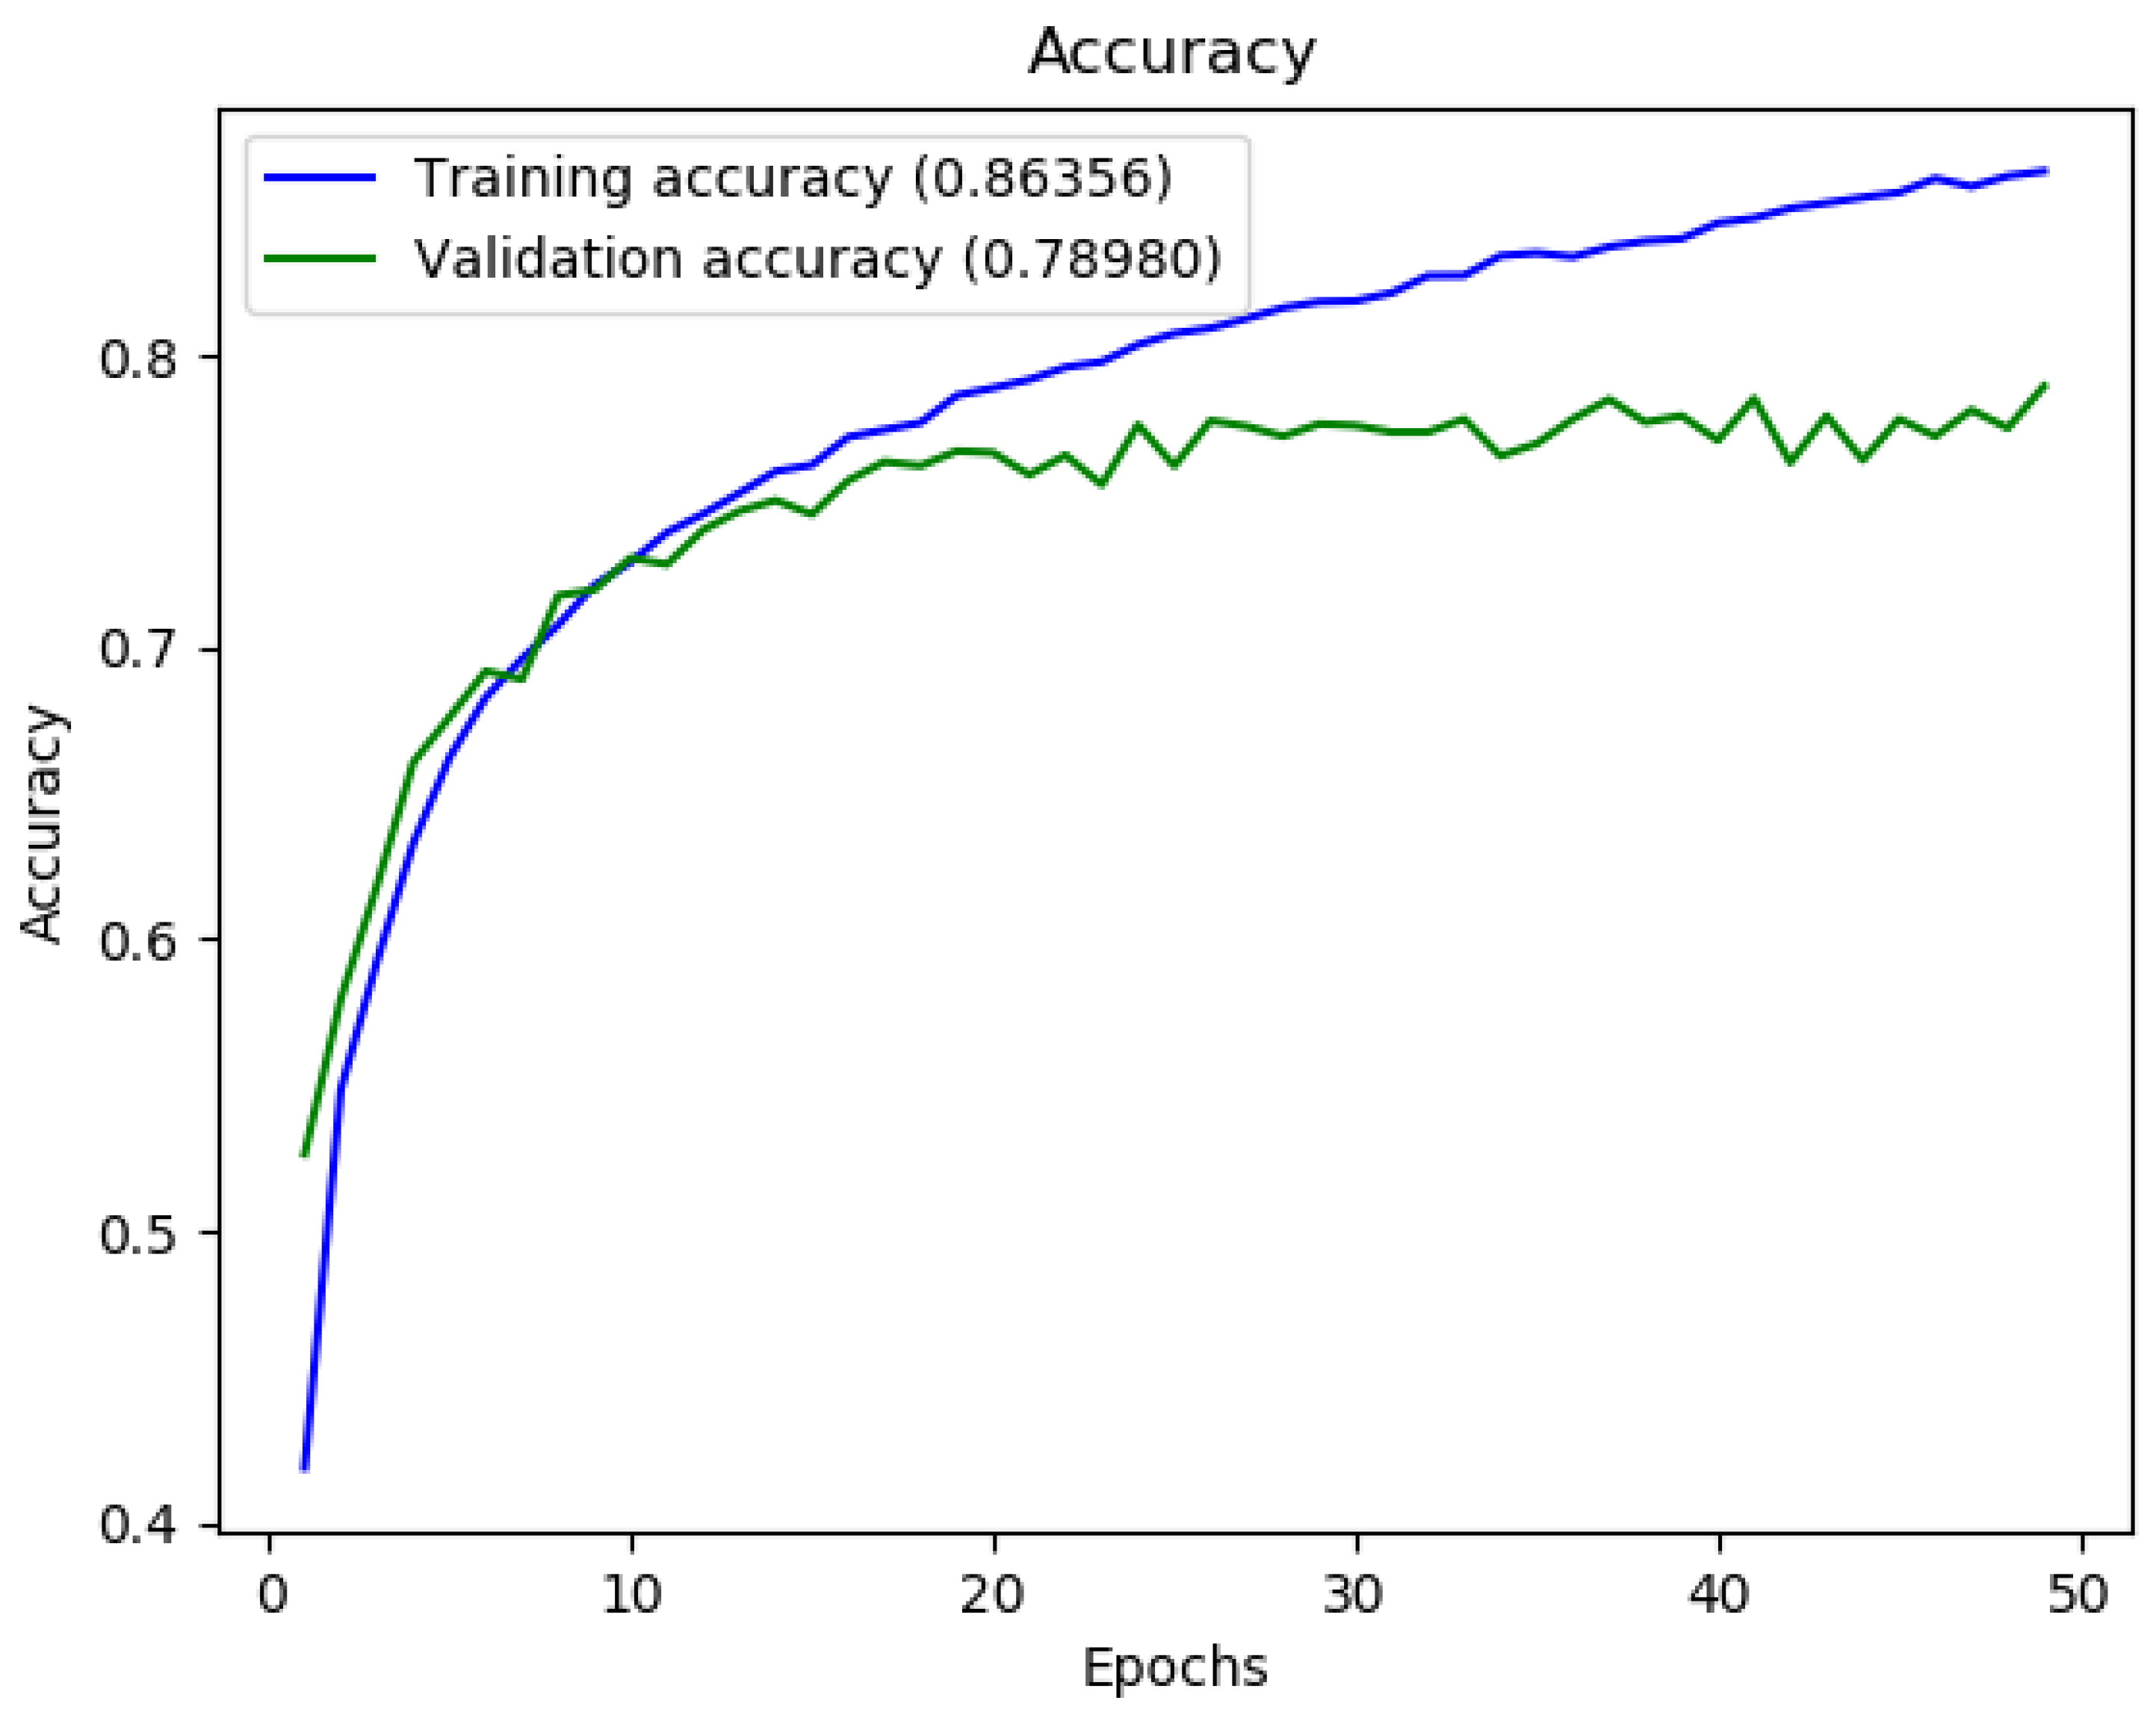
With this database, we obtained accuracies around 60%: a not impressive result, surely improvable but also undermined from the sometimes dubious labels and to the presence, in the database, of some images that do not represent human faces. Thus, we decided to use the FER+ [
8] annotations, which allowed us to remove erroneous images and to improve ground truth.
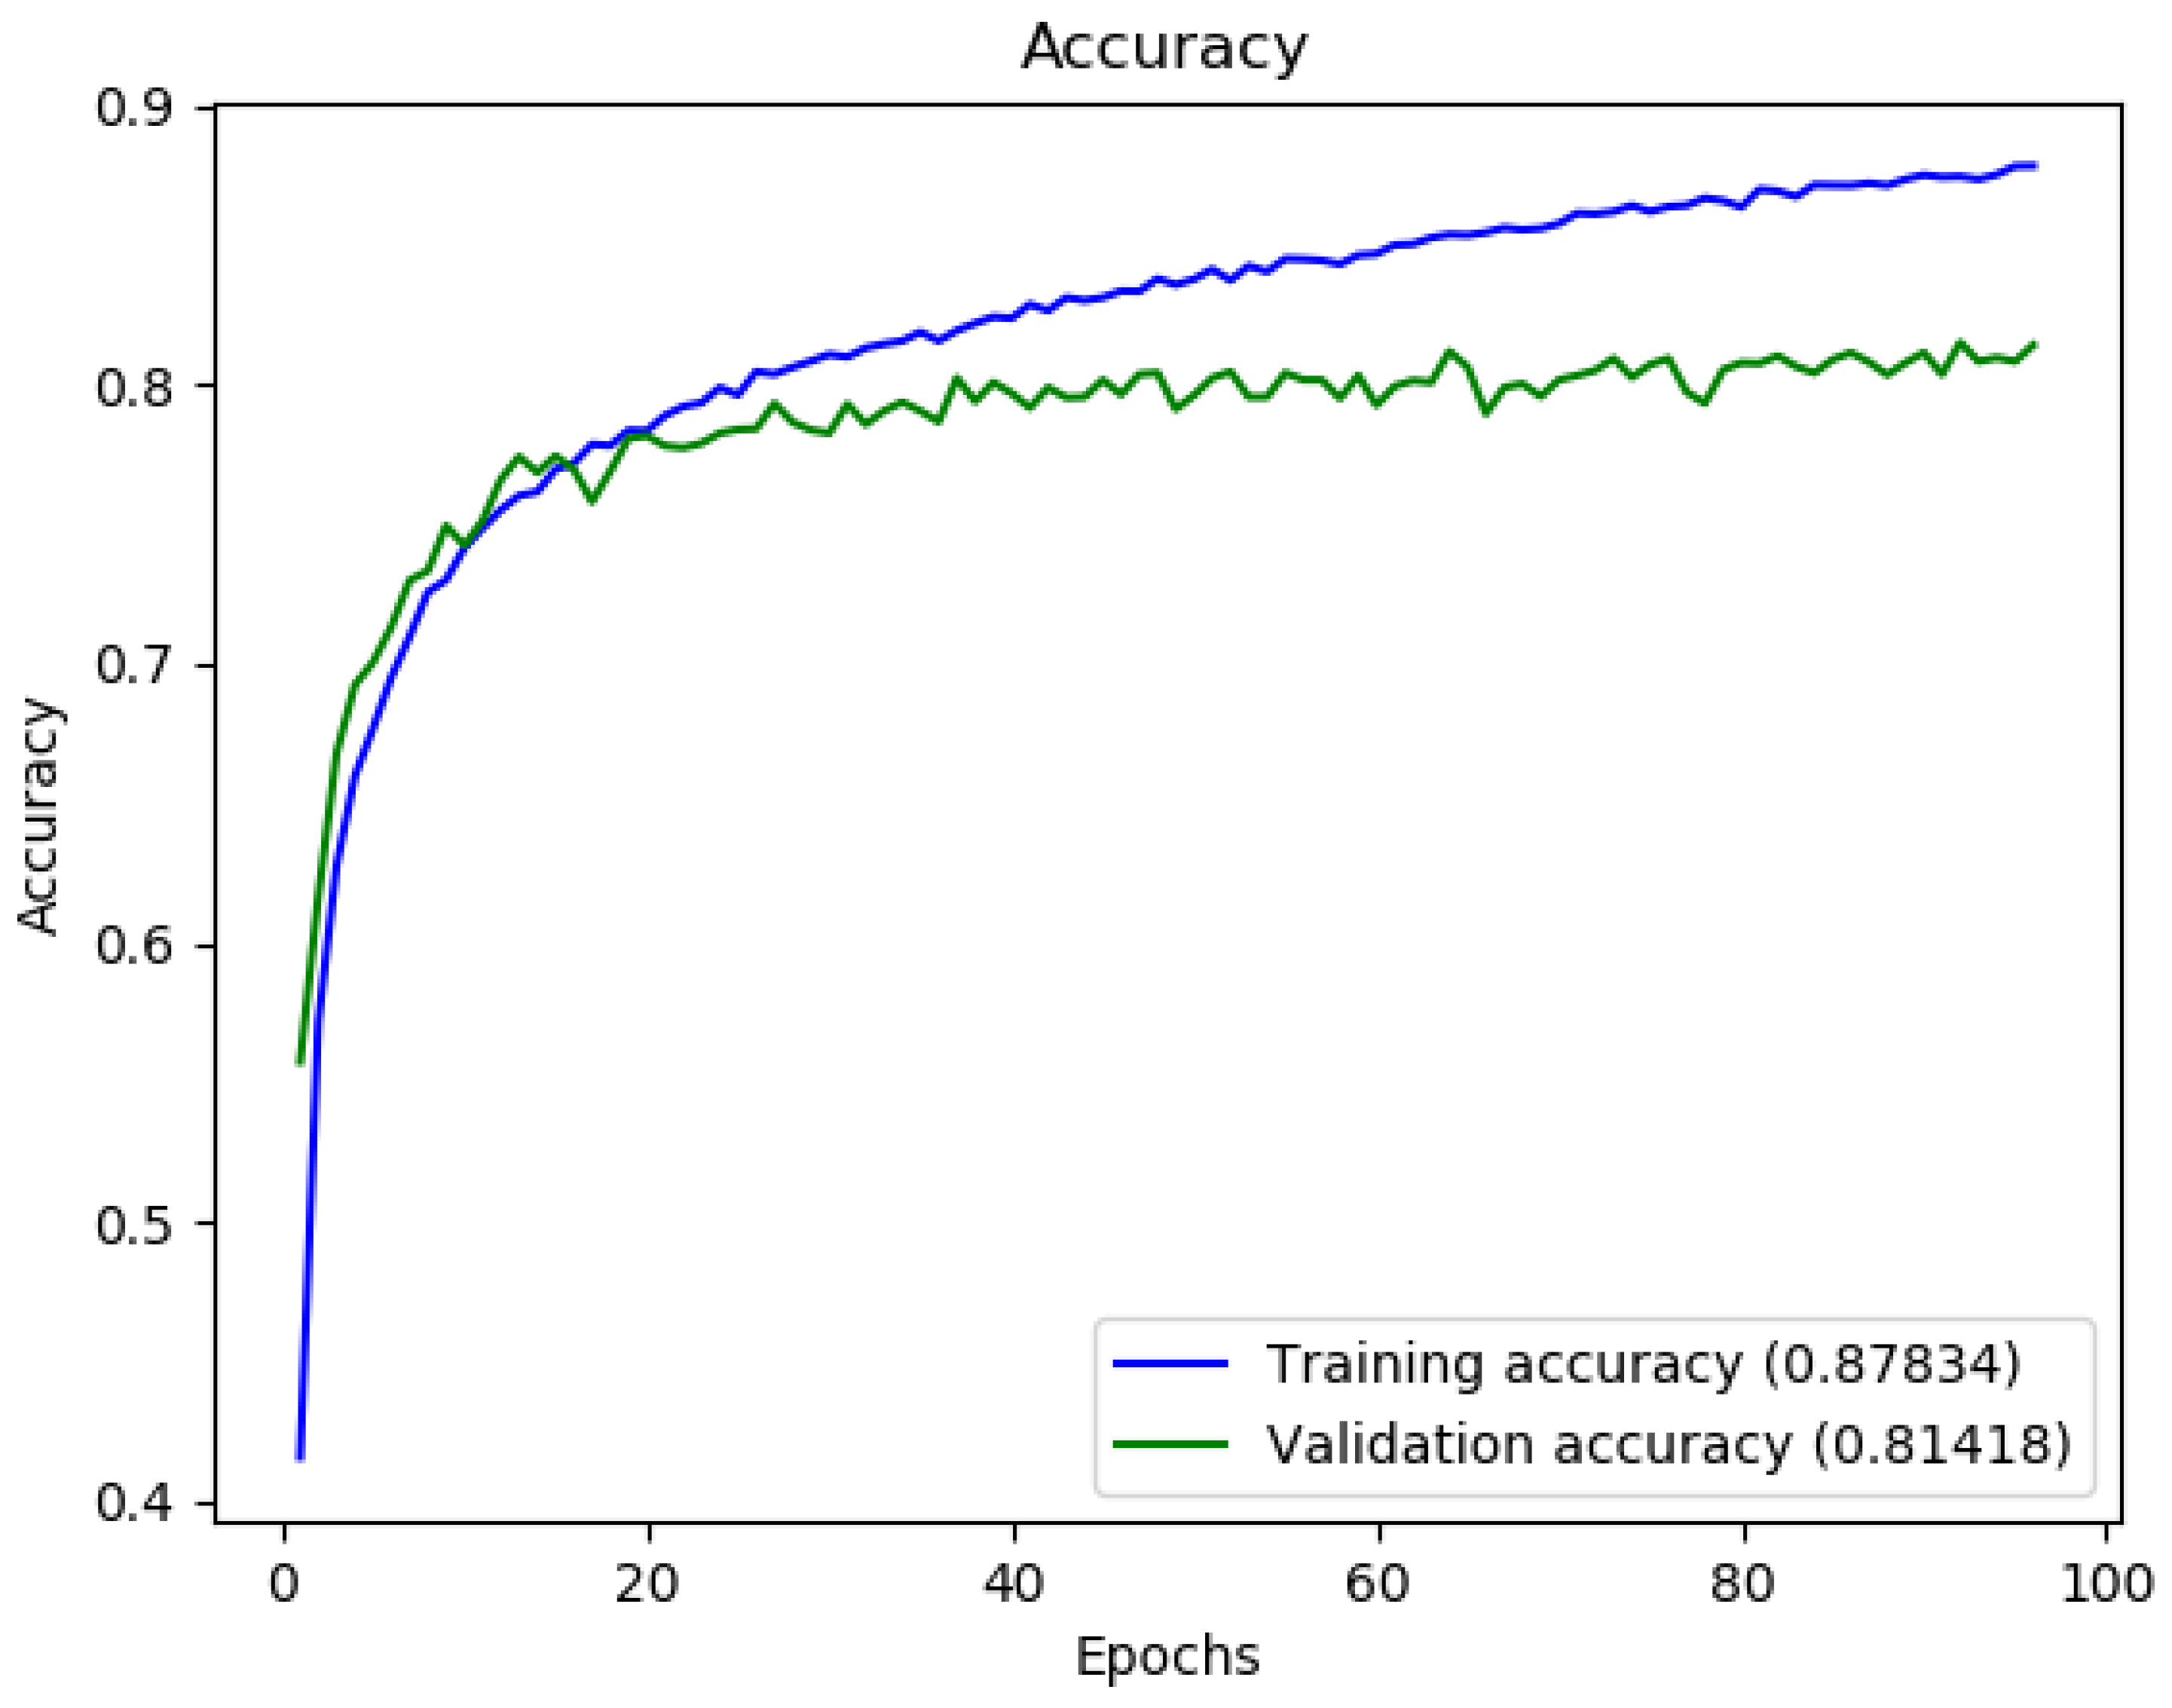
The best results in terms of test accuracy on this database were obtained from the network in [
21], and are shown in
Figure 4,
Figure 5 and
Figure 6.
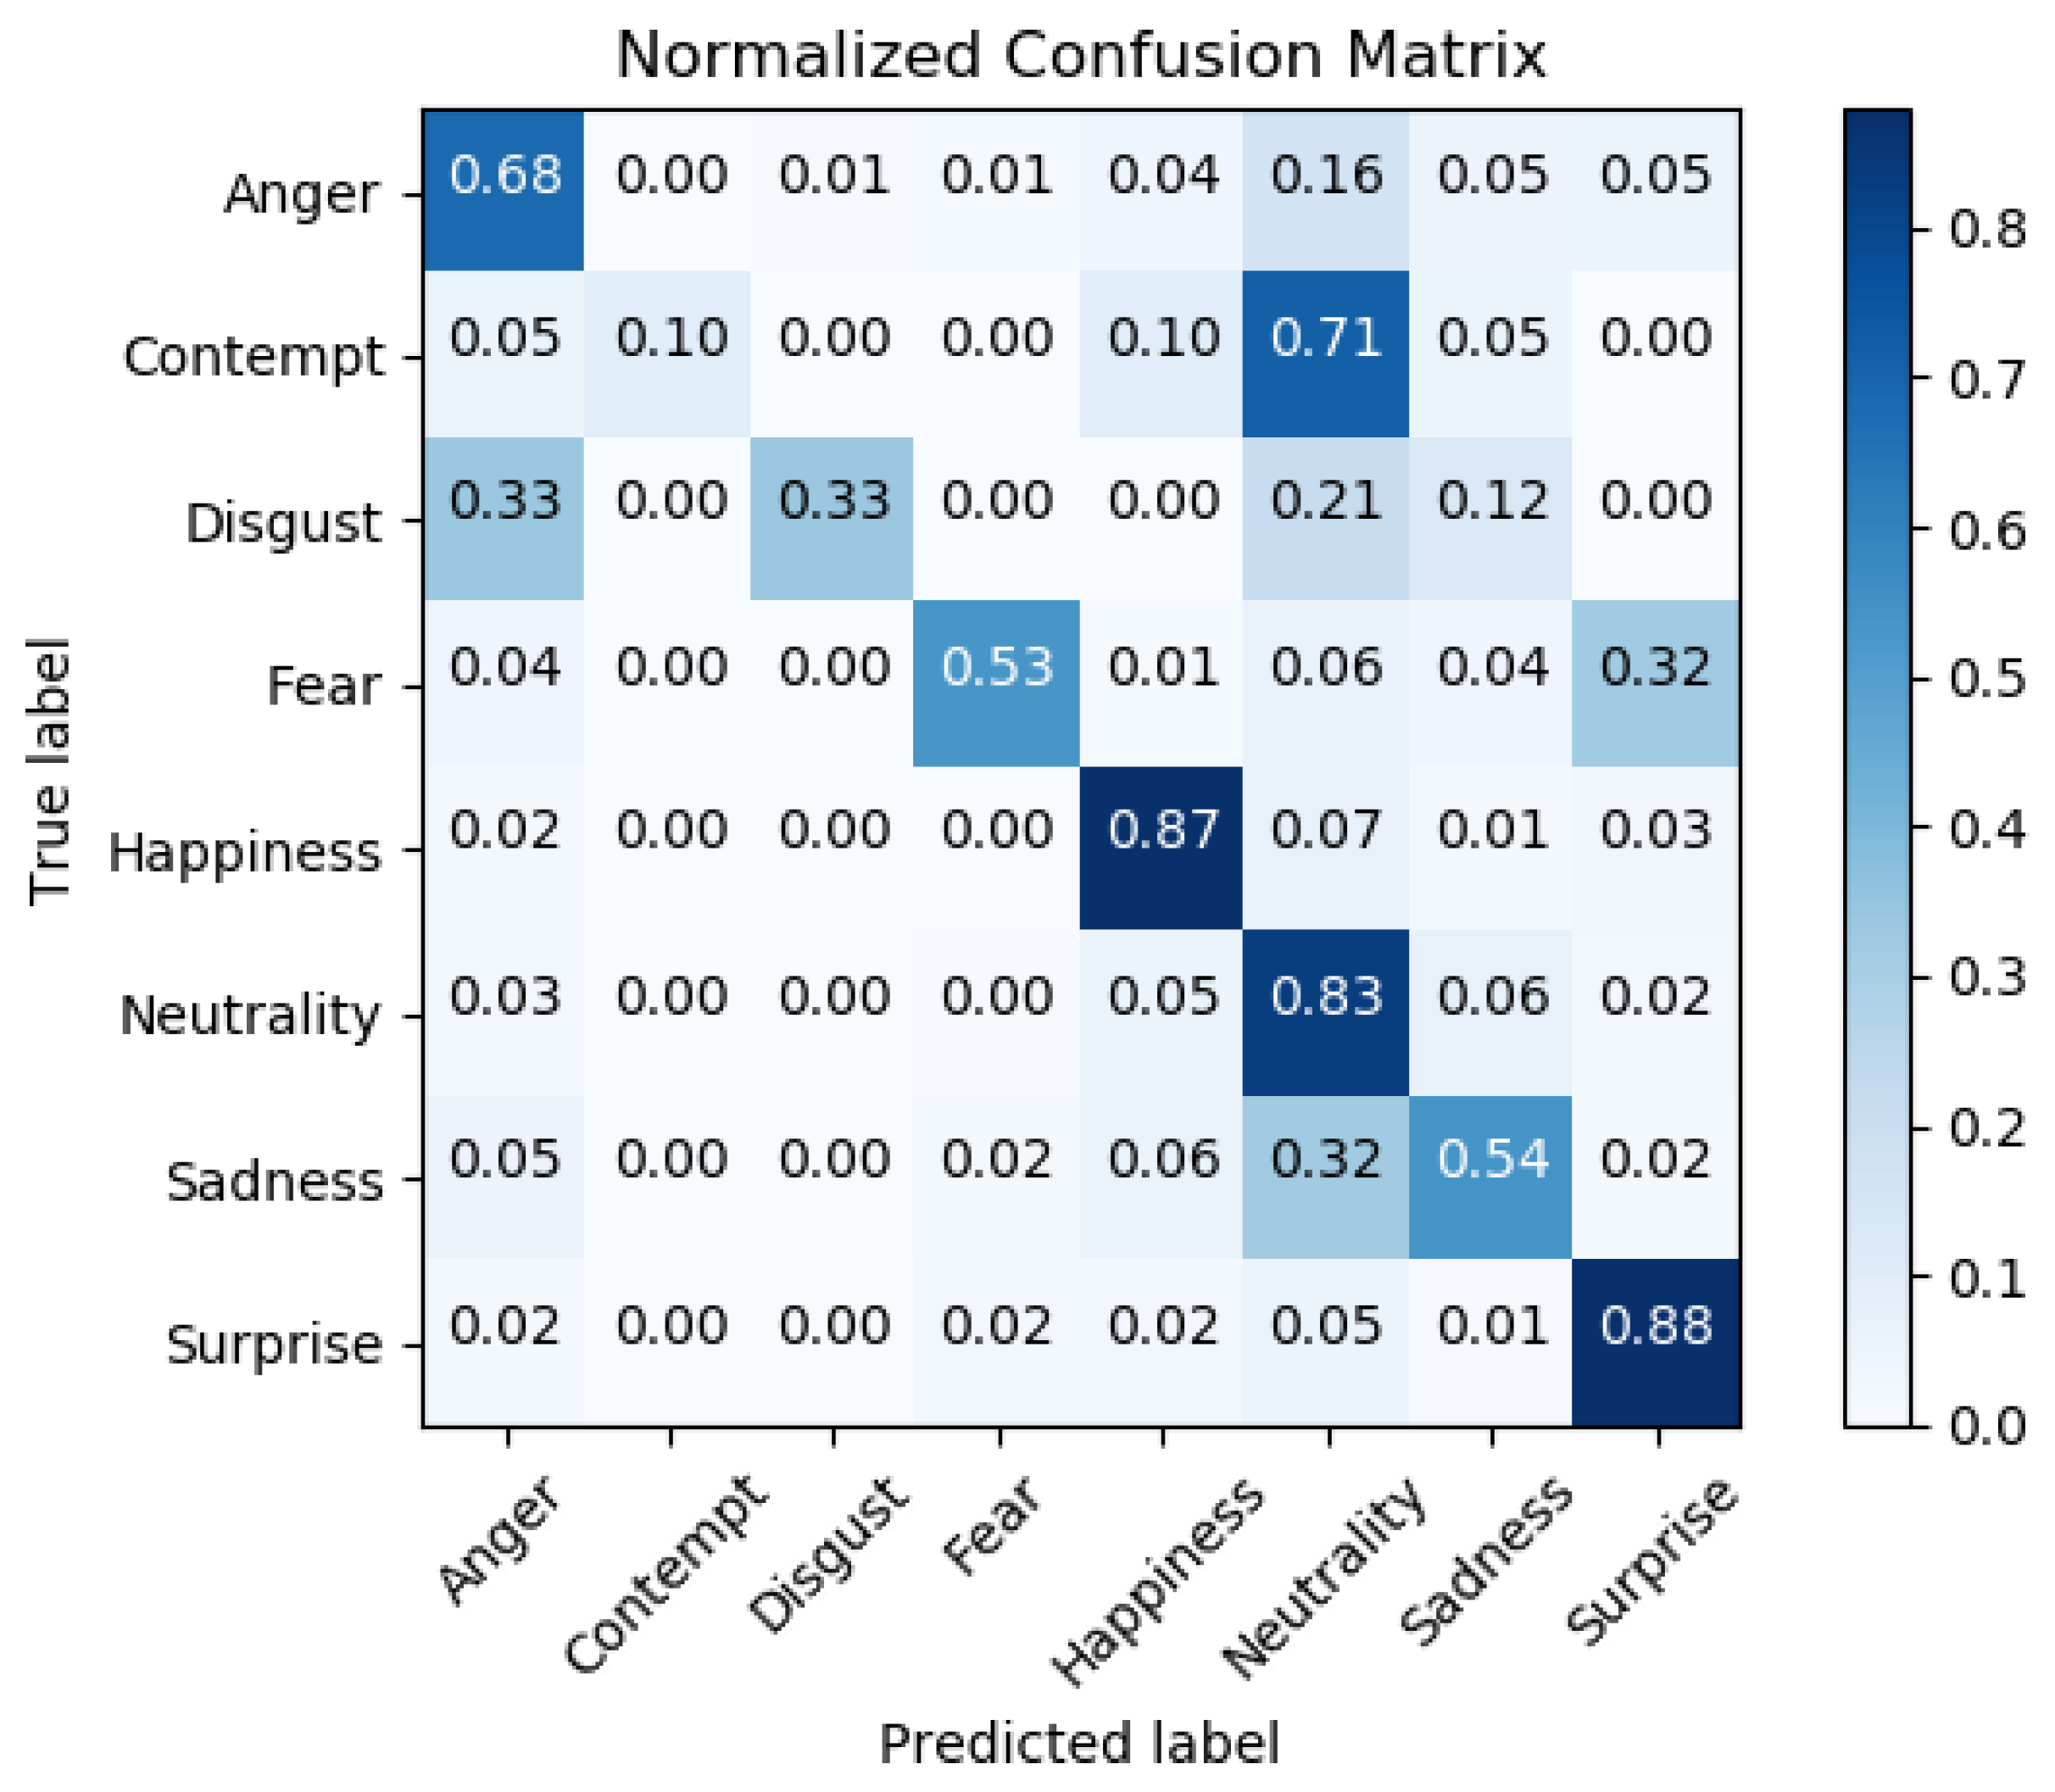
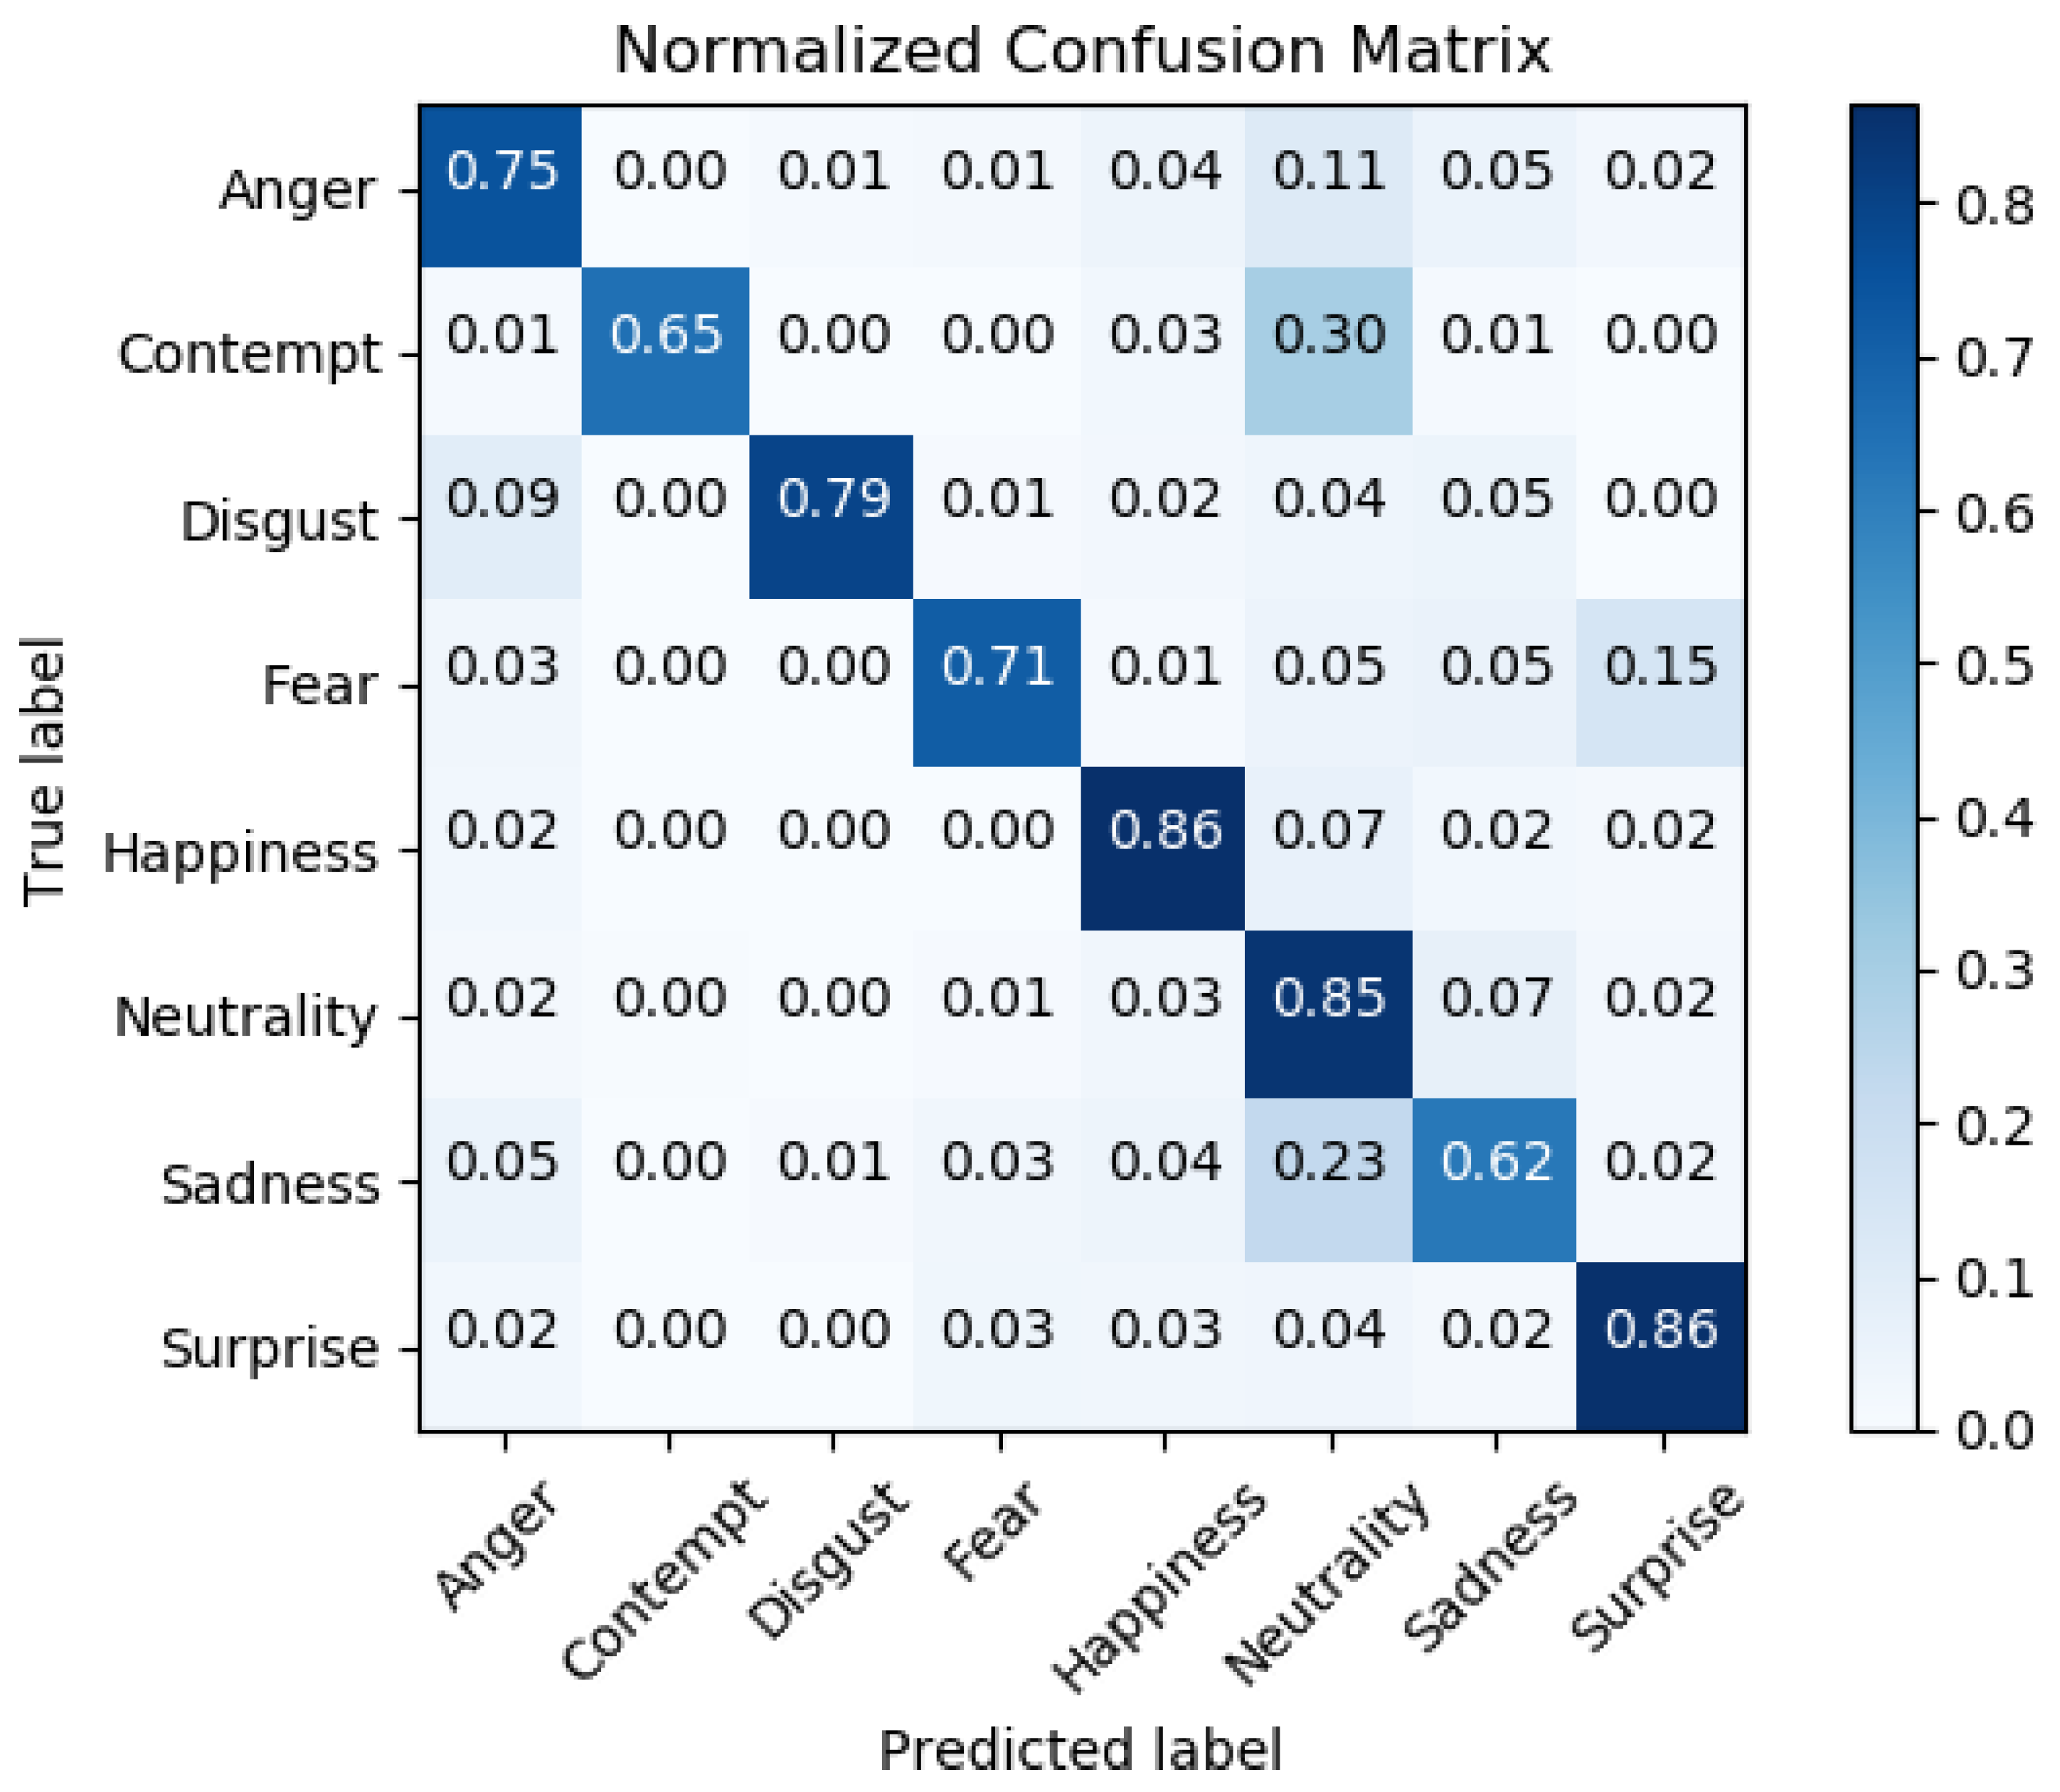
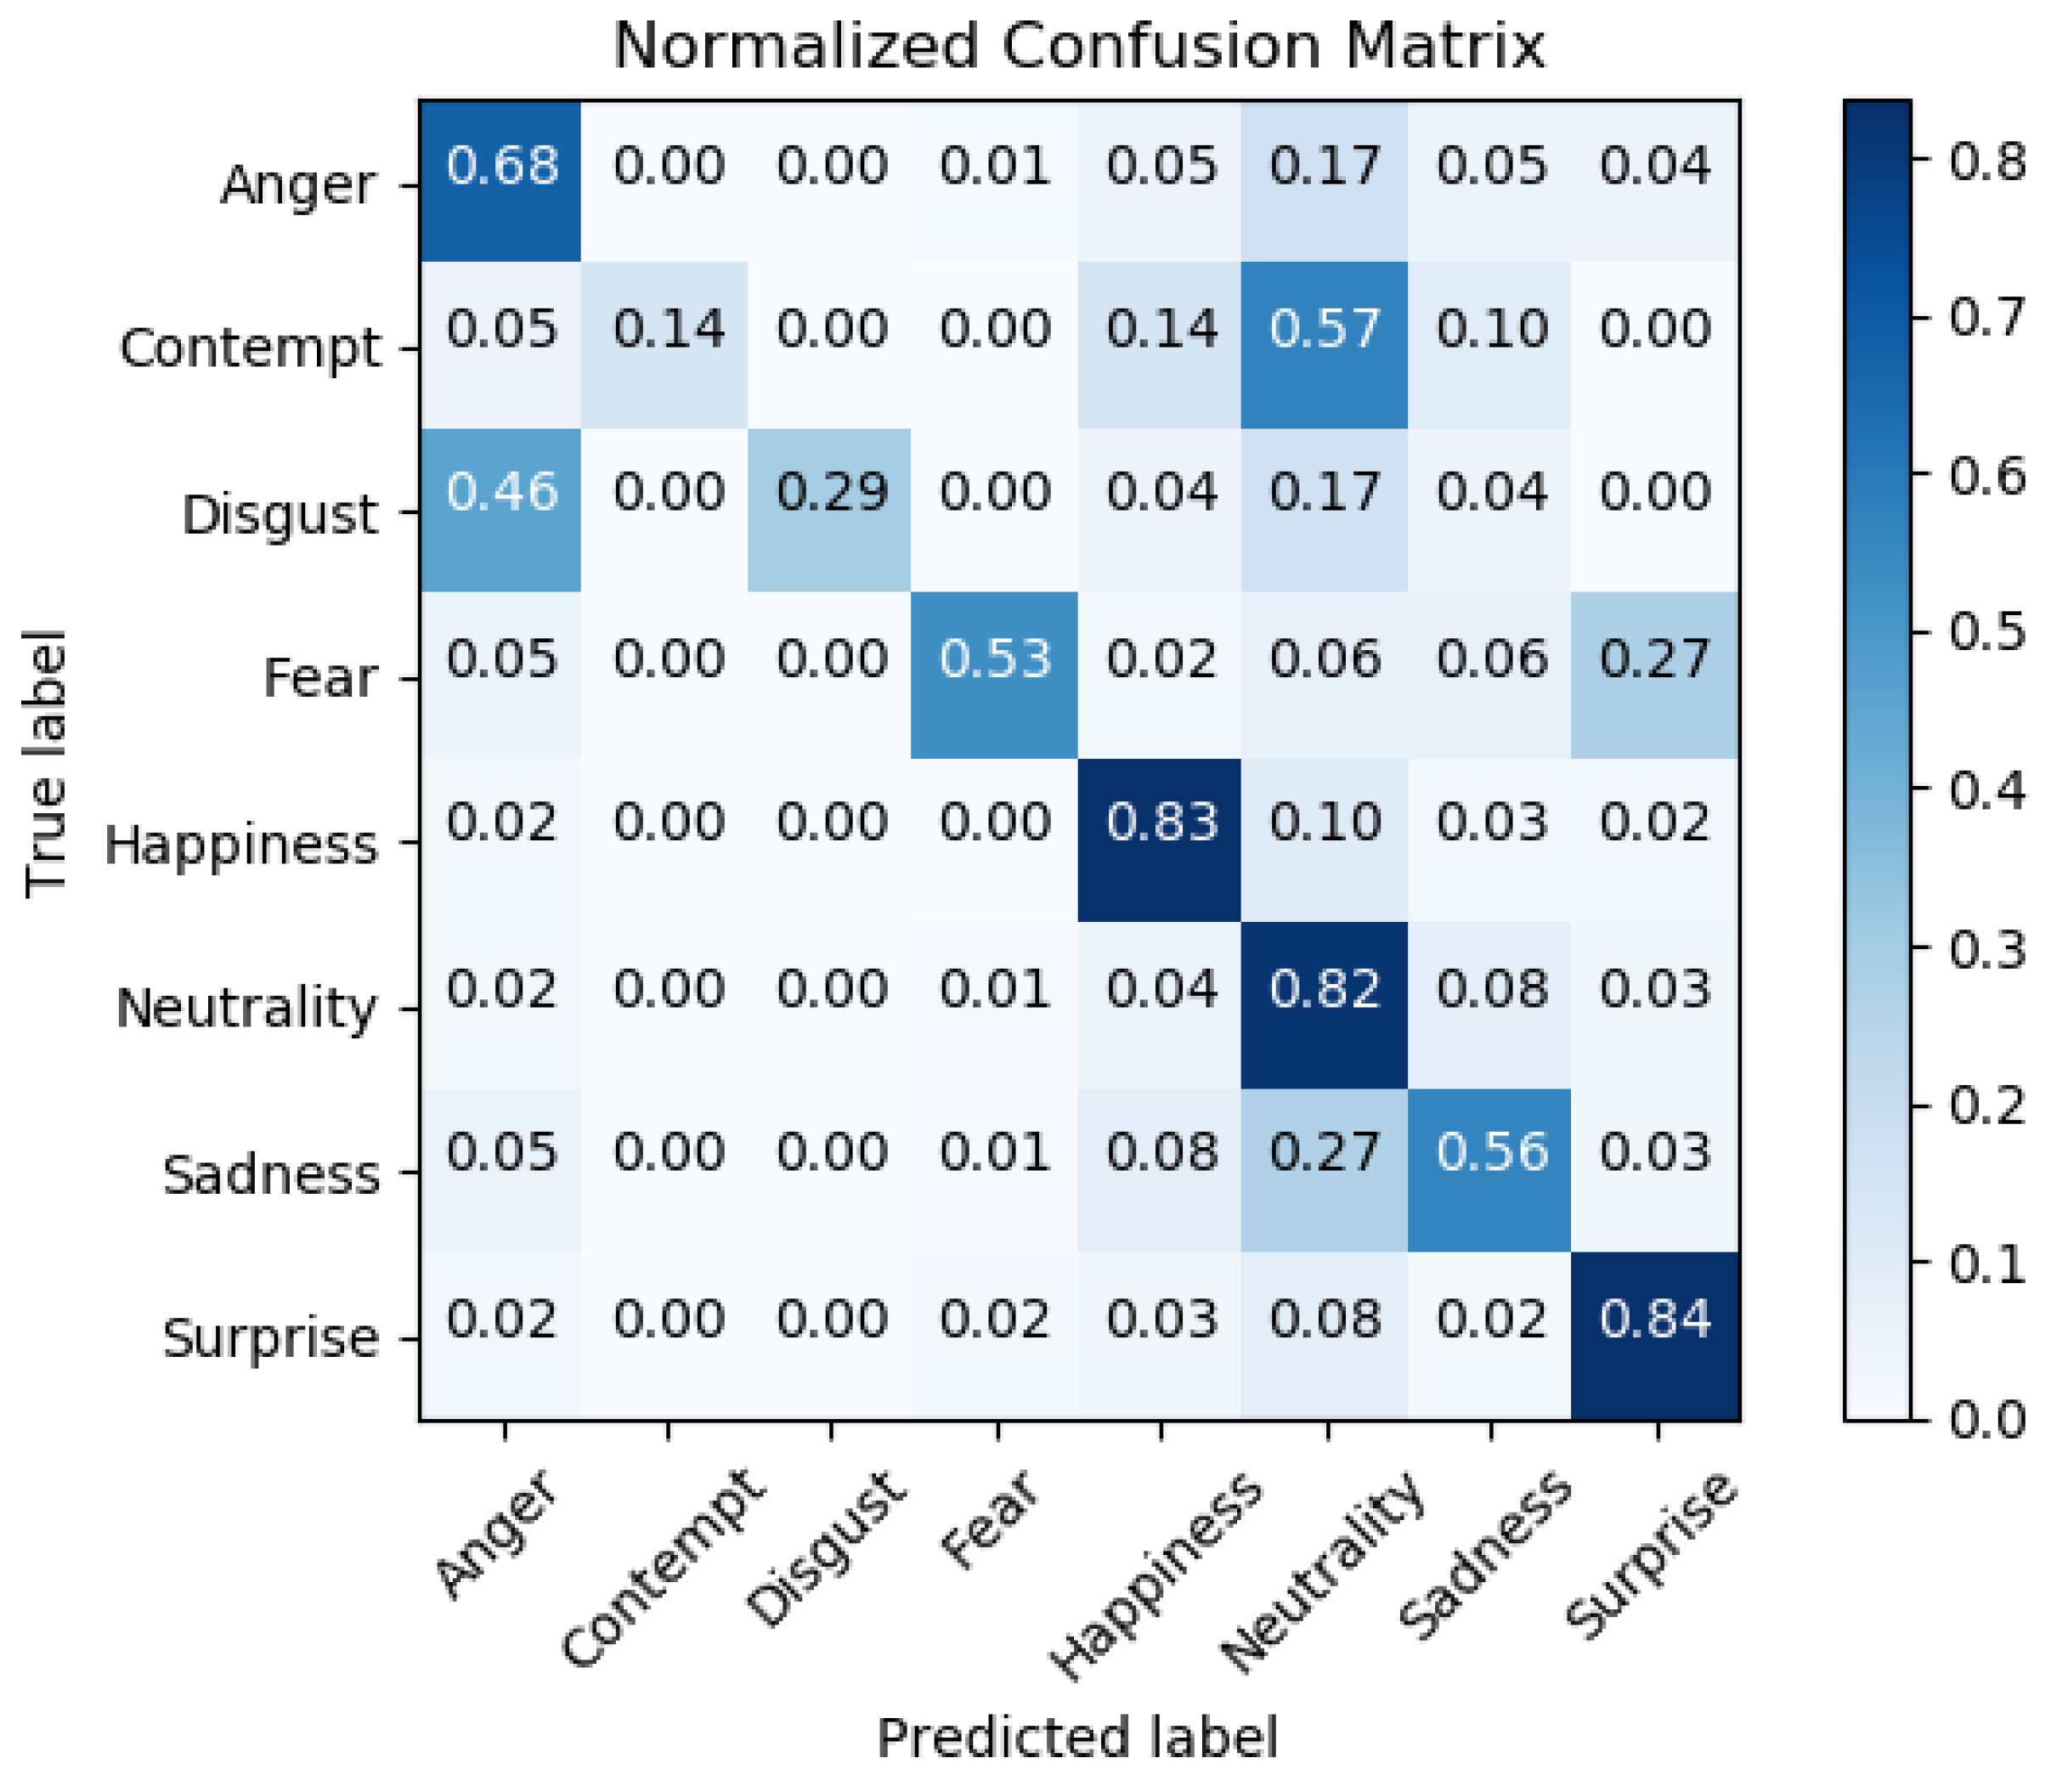
As shown by the confusion matrix (see
Figure 6), the trained network is quite good at detecting happiness, neutrality, and surprise, while it is weak at detecting fear and sadness. We also have poor performance in the recognition of contempt and disgust, but these emotions are not important for our purposes. Since FER2013 is known to be a not well-balanced database, and considering that also the network in [
22], trained with the same settings and on the same databases, presents a similar confusion matrix (see
Figure 7), our hypothesis is that the FER2013 database does not provide sufficient examples for contempt, disgust, and, more important for our application, fear and sadness classes.
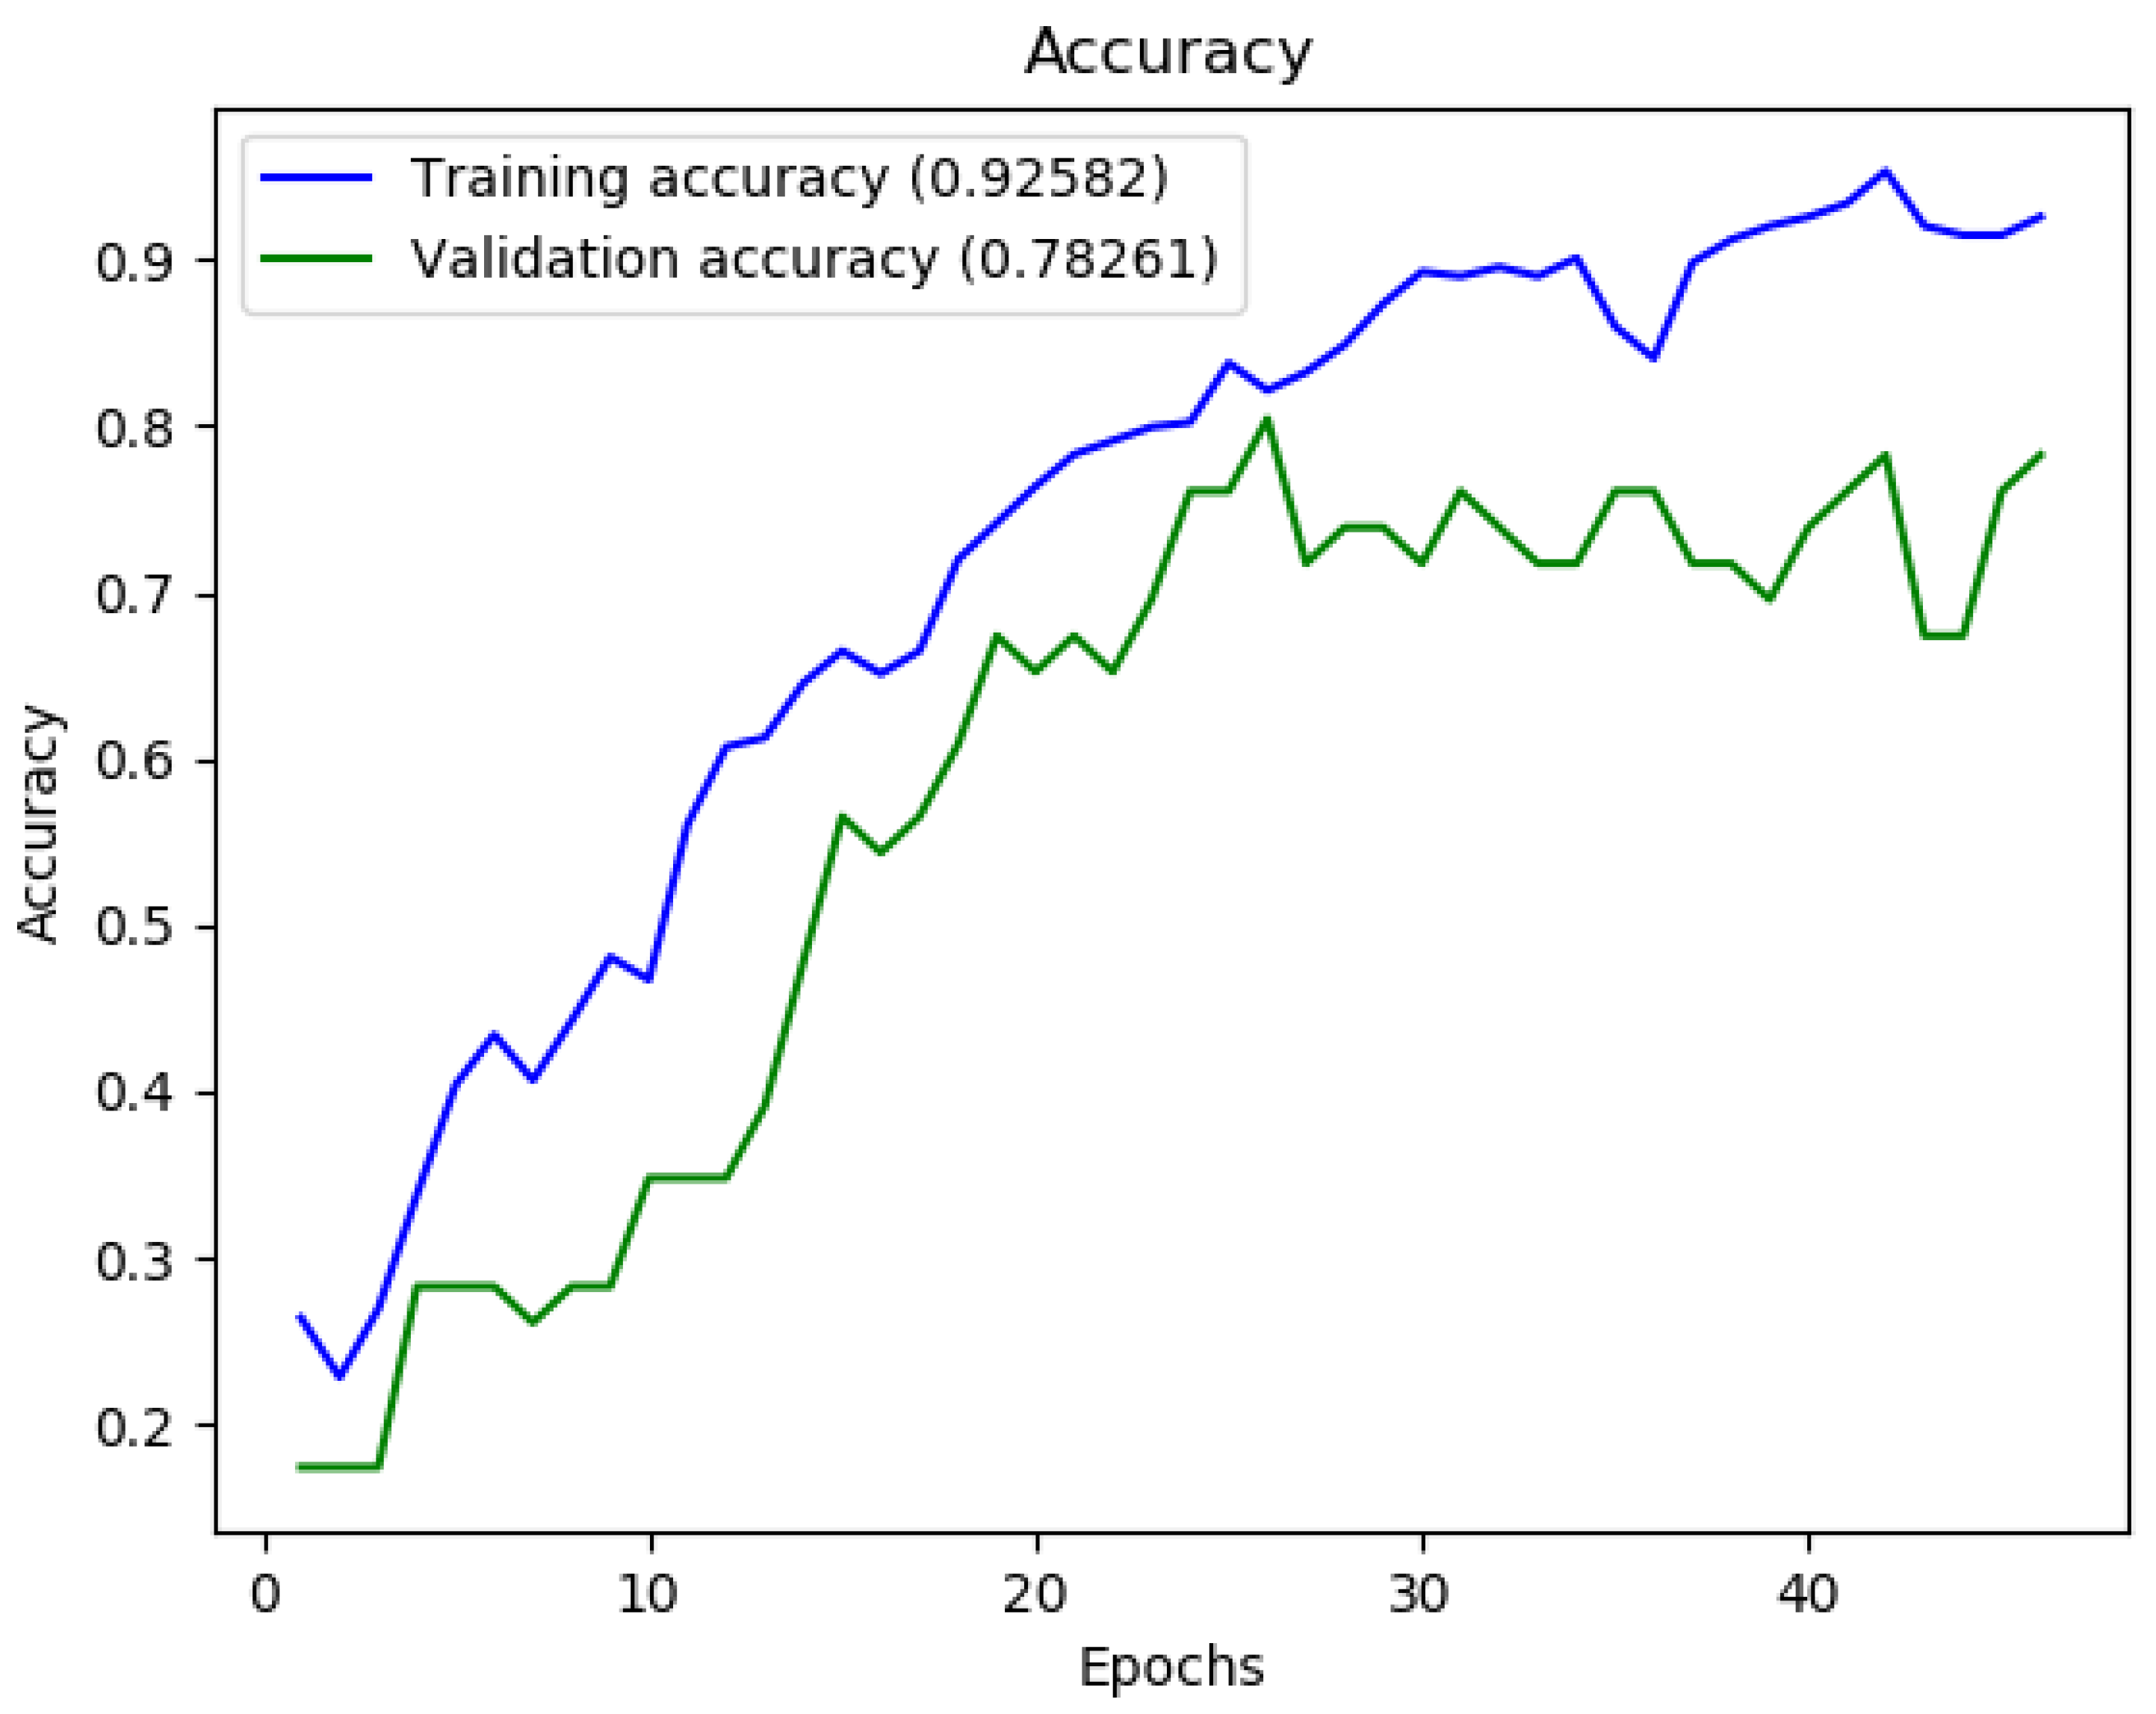
4.3.3. Database Ensembles
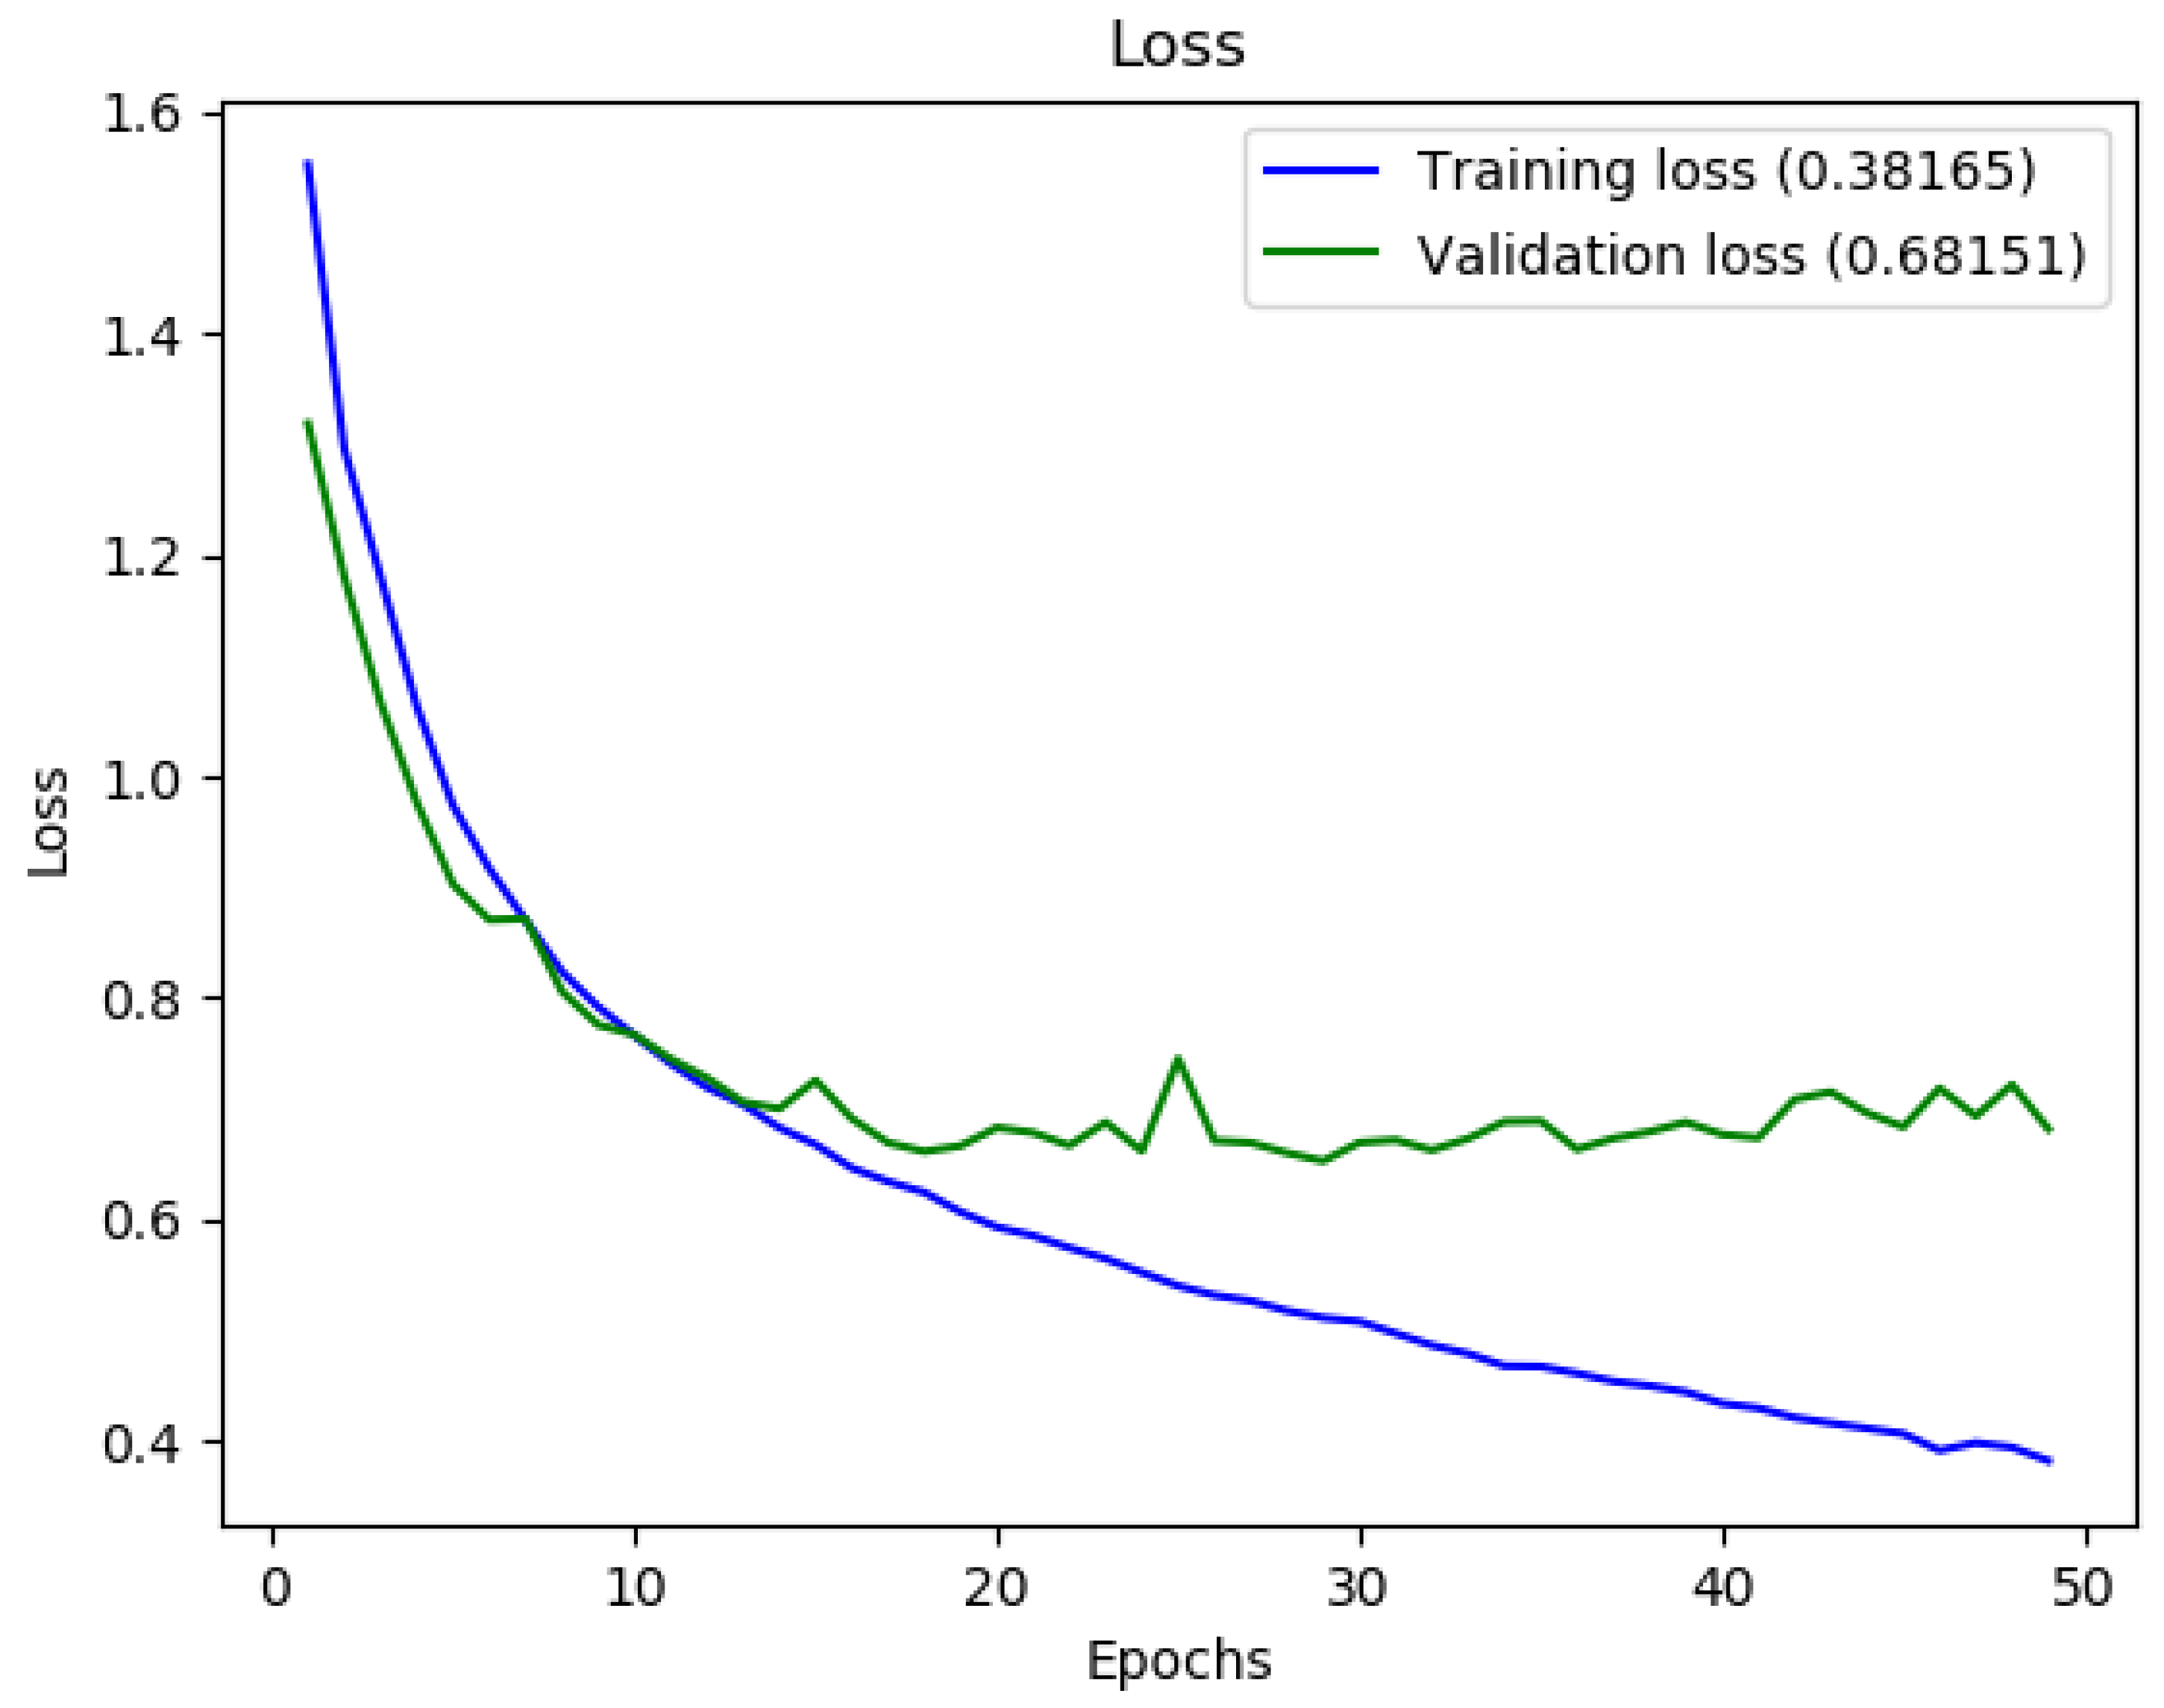
We decided to train again the neural networks using two different database ensembles: one containing the images, posed and spontaneous, of all the databases supported by FEDC and one containing only the posed ones. These were obtained using FEDC, applying a conversion to the grayscale color space and a face detection algorithm in order to crop the images on human faces. Both were created downscaling all the images to 48 × 48 pixels, in order to adapt them to those of the FER2013 database and to be able to compare the results of the two databases placed under the same conditions. For the FER2013 database, we chose to also use the FER+ annotations, because the improvement in accuracy due to their use is relevant.
The
Ensemble 1 database is composed of all the available images from the database supported, for now, by FEDC. Making use of the same subdivision procedure used in the previous examples, we obtained 35,212 images for training, 4402 for validation, and 4379 for testing. Results are shown in
Figure 8,
Figure 9 and
Figure 10.
The obtained results are better, in terms of classification errors, than those obtained using the databases individually, especially for the contempt and disgust classes, which had accuracies similar to random ones.
The Ensemble 2 database is a subset of Ensemble 1 composed only of posed images. Thanks to the FEDC subdivision procedure, we obtained 5847 images for training, 731 for validation, and 715 for testing.
4.4. Summary of Training Results
For reader convenience, we summarized the obtained results into two tables.
Table 2 contains the numbers of photos for training, validation, and test datasets, while
Table 3 contains the best training accuracies obtained per-database and neural network. The test accuracies of the cases shown in detail in the paper are in bold. In general, the network in [
21] requires more time for training, but has slightly better performance and, with the same image size, requires fewer parameters than the one in [
22]. Thus, if we had to choose a network, we would certainly pick the first one. Before continuing, it is important to make an observation: even if the test accuracies of the trainings made with the
Ensemble 2 database are better with respect to the ones obtained with
Ensemble 1, we expect better result on the field from the networks trained with the latter. This is because the spontaneous expressions are those that we can observe most commonly in everyday life, while those posed are more caricatural and deliberately exaggerated: this makes the interclass difference greater, but, at the same time, a network that is trained with these images will inevitably experience a bias between the images on which it is trained and those in which a prediction will actually be requested.
5. Experimental Results
5.1. Situations Preparation
We proposed five different calibrations of the autonomous driving algorithm in two different scenarios. By combining those calibrations and scenarios, we prepared 11 benchmark situations. The first six of them (identified in the following as Cn) involve as scenario a curve to the right in a suburban environment. The car can face it with three different calibrations, hence following three different trajectories: strictly keeping the right side (situations C1 and C4), keeping the center (situations C2 and C5) of the lane, or widening at the entrance of the curve to decrease the lateral accelerations (situations C3 and C6). Since in all these cases the vehicle remains within its lane, all these behaviors are allowed by the majority of road regulations.
The other five, instead (identified in the following as Tn), have as scenario a right turn inside an urban environment. In the road just taken, there is an obstacle that obstructs the rightmost lane. The road has two lanes for each direction of travel. With the first calibration (situations T1, T2, and T3), the car tries to stay at the right with a lot of decision, therefore it suddenly discards the obstacle. With the second calibration (situations T4 and T5), instead, the car decides to widen the turn in advance and to move to the right lane only after it passed the obstacle.
5.2. Criteria for Emotion Analysis
As described in
Section 3.3, for each of the considered
situations, we prepared a 3D representation. The most relevant emotion, when different from neutrality or sadness, was taken into consideration. We considered fear and surprise as negative emotions, while happiness as positive ones. Sadness and neutrality have been considered as middle values since the network appears to little appreciate the differences between these moods. In any case, if there was no other emotion than neutrality or sadness, the one with a greater number of sadness outcomes was considered worse with respect to ones that score more neutrality outcomes. Since the neural networks can recognize also anger, contempt, and disgust, we considered those outcomes as
experiment failures because these moods are not the ones we expected to obtain in our tests.
5.3. Experimental Campaign
We asked eight people, six males and two females, average ages 25 years, interval 23–31 years, to watch the situations, starting from a black screen and without describing what they would see to not interfere with their moods. We detected their emotions every 2 s.
We represented the situations in the order: T2-T4-T3-T1-T5-C1-C5-C2-C6-C3-C4. We chose to not mix the urban (T) and suburban (C) scenarios to not break the environments immersion. In the urban scenario, we placed the situations that we expected to provoke greater emotional reactions in the middle of the representation, while, in the suburban one, we started from the softer one moving to the most critical at the end.
For the tests, we used a flat projection screen to be able to choose the point of view, avoiding, in this way, that the tester could not be able to see the critical moments represented. The use of a virtual reality set could improve the environment immersion, but, since we were using an emotion recognition technique that requires to see the entire face, the use of a device of this kind is not possible.
5.4. Results Discussion
The experimental results in
Table 4 show that
situations T2 and C6 are the most stressful from the passengers’ points of view. In the urban
scenario, there are some positive reactions to the
situation T3, probably due to the capability of the vehicle to make the safest decision by keeping in the right lane and stopping in front of the obstacle. In addition, the
situation T4, which is the one that minimizes the lateral movement of the car, is appreciated. With traffic, the
calibrations shown in the
situations T1 and T5 appears to be equivalent. Regarding the curve
scenario, the
calibration shown in C3 and C6 is preferred when there is no traffic from the other direction (
situation C3). Oppositely, for the one where the car stays at the right side of its lane (C1 and C4), it is preferred the
situation C4 in which there is traffic in the other direction. The
calibration shown in C2 and C5 are not appreciated: in our opinion, this is due to the unnatural path that follows the centerline of the lane.
These preliminary results agree with the experiences reported by the testers when they were interviewed after the tests. In particular, asking about the situations C3 and C6, it emerged that the C3 one, in which the curve is traveled keeping the left side of the lane, is more appreciated without traffic in the opposite direction. Instead, following the same trajectory with traffic, as in the situation C6, causes inconveniences to the passengers.
6. Conclusions
This paper proposes a proof-of-concept way to smooth the transition towards autonomous vehicles. To improve the passengers’ trustiness on these vehicles, a delicate calibration of the driving functions should be performed, making the AV decisions closest to the ones expected by the passengers. We adopted machine learning techniques to recognize passengers’ emotions, making it possible to obtain an objective comparison between various driving algorithm
calibrations. To achieve this result, we chose two state-of-the-art neural networks, implemented, trained, and tested in different conditions. We developed two software tools, called Facial Expressions Databases Classifier and
Emotions Detector. The first, designed to generate large facial expressions pictures databases by merging and processing images from various databases, has been released under the MIT open-source license on GitHub [
20]. The second has been developed for internal use to analyze the testers’ emotions during the
situations representations. The proposed methodology has demonstrated itself able to help designers to choose between different calibrations of the trajectory planner when applied considering two different conditions.
As future work, we would like to improve our results by using an improved car simulator, with motion capabilities and a curved screen, to improve the immersion in the simulated environment, and by increasing the number of testers to obtain analysis with statistically-relevant results.


