Abstract
In this study, we present a swept source that can intelligently control its sweeping speed while satisfying the commercial stability and miniaturization standards. The source’s central wavelength of the output spectrum is 1300 nm and spectral width is greater than 100 nm. Meanwhile, the scan frequency can be adjusted to range from 20 to 100 kHz, and the stability degree of the optical capacity is less than 0.34%. Additionally, this study establishes a numerical model for the swept-source optical coherence tomography (SS–OCT) system and introduces a numerical simulation of the signal produced during the OCT imaging process. The simulation results are helpful to guide the design and construction of the future OCT systems.
1. Introduction
Optical coherence tomography (OCT) is a novel imaging technology that is rapidly developing in the fields of biophotonics and medicine and can be used to image fine biological tissue structures with high resolution by analyzing the backscattered light within the ocular tissue [1,2]. OCT mainly uses a detector to detect and gain the interference signal from the posterior scattered light of the sample arm and the reflected light of the reference arm to calculate the axial information of the reconstructed sample, where the amplitude of the interference signal indicates the strength information and the delay between the two signals indicates the depth positions. The two-dimensional cross-sectional image of the sample can be obtained via multiple axial scanning superpositions. Similarly, the three-dimensional image of the sample can be reconstructed via two-dimensional cross-sectional scanning superposition [3,4,5,6]. Swept source (SS)–OCT is the latest-generation OCT imaging technology, where the swept source is considered to be the core component. Additionally, the swept-source parameters directly determine the imaging quality of the SS–OCT system [7,8,9,10]. An ideal swept source must exhibit a fast sweep speed, wide sweep range, narrow instantaneous line width, and high power output stability degree.
Huber et al. proposed a Fourier domain mode locking (FDML) technology [11]. The length of the delay fiber can increase to become several kilometers by adding a delay fiber into the ring cavity. The delay fiber equalizes the driving period of the filter and the transit period of the photon to achieve the mode locking effect. Although this long-cavity FDML technology exhibits high-speed sweeps, the integration of several kilometers of optical fibers enlarges and convolutes the structure of the whole light source, which is not conducive for commercial miniaturization. Further, it is necessary to consider the dispersion introduced by long fibers, especially in the wave band in which the dispersion coefficient of the fibers is relatively large when compared with those in other wave bands. In contrast to the FDML swept laser, whose partial parameters cannot be changed, the short-cavity swept laser can flexibly change the speed of the swept source to tune the parameters of various factors, including the bandwidth to analyze the impact of different parameters on the image quality for obtaining the optimum parameters and satisfying the requirements of different optimal swept imaging lasers.
In this study, an improved swept-source that can intelligently control the sweeping speed of the swept laser source and satisfy the commercial stability and miniaturization standards is presented. We designed the driving circuit of the main devices in the swept source, the current stability is 0.013%, and the average temperature drift is 0.07 °C. The frequency-swept laser light source is highly stable at 1300 nm and exhibits adjustable speed. The scan frequency can be adjusted and ranges from 20 to 100 kHz, and the stability degree of the optical capacity is less than 0.34%. We also established a numerical model of the SS–OCT system and explore the elimination of image noise using the output-point diffusion function of the system. The observations can guide the design and construction of the OCT systems.
2. Methods
The swept sources generally comprise an optical resonator and a coupled output laser. The optical resonator primarily comprises a gain medium and a tuned optical filter. The amplified spontaneous emission (ASE) of the gain medium forms a series of beams with different central wavelengths after the filter is tuned. Further, the beam amplifies along the resonator to the gain medium and oscillates the times of the laser resonator. When the gain provided by the laser radiation exceeds the loss, the beam reaches the threshold condition of the laser and steadily oscillates and; the swept laser is subsequently provided as the output [12,13,14,15].
The structure of the all-fiber-ring short-cavity continuously tuned swept source is presented in Figure 1a. The semiconductor optical amplifier (SOA: Aeon SAO20r-03P31B) in the ring cavity acts as the gain medium to provide the required ASE background for the swept source. In addition to the constant-current drive circuit of the SOA, a temperature-control circuit is designed to ensure that the ASE background of the SOA can be continuously and steadily provided as the output at a constant temperature without interrupting the laser output. The isolators (ISOs: OPNETI IS-S-P-1310) at both the ends of the SOA are used to block the remaining reflected light in the cavity to protect one-way light transmission in the ring cavity. The driving signal originates from a signal generator and loads into both the ends of the fiber Fabry–Perot tunable filter (FFP–TF: LambdaQuest X767). Further, the frequency and offset voltage of the driving signal are adjusted to modulate the scanning range and speed of the filter. The voltage amplifier is designed to amplify the initial driving signal to widen the range of the filter’s transmission window because the signal generator’s maximum voltage can be only adjusted to 5 V. A polarization controller (PC: THORLABS FPC562) is used to adjust the polarization of the optical signal in the ring cavity, ensuring that the optical signal for different wavelengths can be uniformly amplified. A single-mode fiber coupler (OPNETI CP-W-P-1310) with a coupling ratio of 90:10 is used at the output end of the ring cavity to ensure that 90% of the light passes through the PC and returns to the SOA to continue resonating after filtering. Only 10% of the light passes through the SOA amplification outside the cavity and finally outputs. Following the output, a coupler converts 50% of the light into electrical signals by passing it through a high-speed photodetector (Model 1024). An oscilloscope (Teledyne LeCroy SDA 820Zi-B 20 GHz) is used to verify the output waveform in the time domain. Another 50% of the light enters the spectral analyzer (Yokogawa AQ6374) to verify the output spectrum of the swept laser.
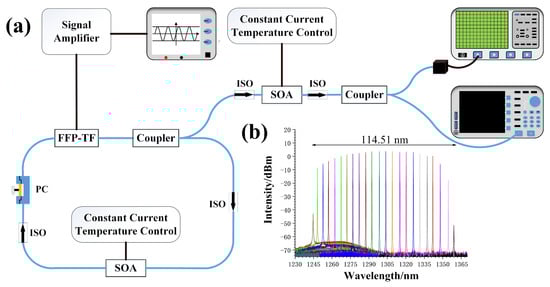
Figure 1.
(a) Experimental setup of the swept source; (b) Output spectrum of the swept source under different offset voltages.
3. Results
The data produced in the FFP–TF transmission window are collected under different offset voltages. Based on the structure presented in Figure 1a, the transmission window of FFP–TF is measured using a spectrometer by applying various offset voltages with equal-difference intervals. The measured results are displayed in Figure 1b. The transmission wavelengths of the FFP–TF vary linearly with a change in voltage.
The SOA driving circuit adopts the current series negative feedback principle and the thermoelectric cooler uses a MAX1978 [16] chip to read the internal temperature and control the semiconductor chiller in the SOA, protecting the SOA and allowing it to function in a stable state. The corresponding driving circuit is designed through model analysis and circuit simulation by following these design principles, as depicted in Figure 2a. In order to reduce the loss of the signal during transmission, and avoid the reflection, crosstalk and other problems that may occur during the signal transmission process. We have made reasonable calculations and developed layouts for the wiring and design of the circuit. Further, to reduce the amount of crosstalk as much as possible, we added a protective ground line to the periphery of the signal traces and the signal line to be protected is added in the middle. Simultaneously, one or several high-frequency decoupling capacitors are placed in the vicinity of each integrated circuit block. A nearby high-frequency channel is obtained for the transient current of the integrated circuit.
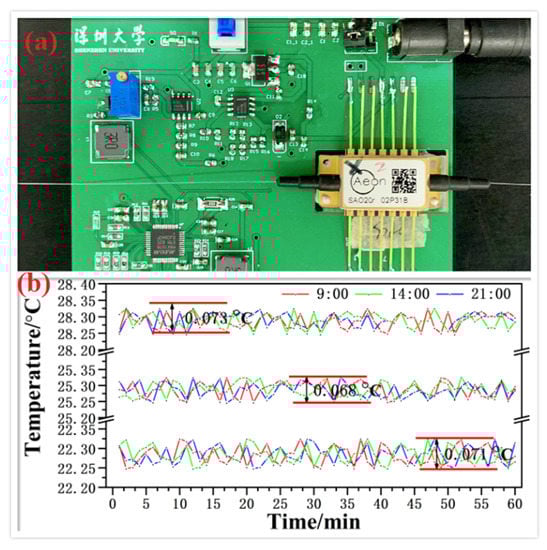
Figure 2.
(a) Driving circuit board of semiconductor optical amplifier (SOA); (b) Experimental results of the temperature-control circuit.
The temperature was preset to 22 °C, 25 °C, and 28 °C at different time intervals. The temperature change was verified by measurement at 9 am, 2 pm, and 9 pm every minute. Based on the experimental results depicted in Figure 2b, the average temperature drift was 0.07 °C, confirming that the temperature-control circuit provides effective temperature control for the SOA operation.
We verified the stability degrees of the optical capacity with respect to the output by applying a 980-nm wavelength from a semiconductor laser to the drive circuit. Further, the availability of the drive circuit was verified using similar practical methods. As shown in Figure 3, we separately tested the stability of the optical power with respect to the output for periods of 20 and 290 min. The stability degree and standard deviation of the optical capacity for a period of 20 min are 0.82% and 0.1438, respectively, whereas those for a period of 290 min are 1.17% and 0.28284, respectively. The designed driving circuit board of SOA ensures the stable working state of the swept source.
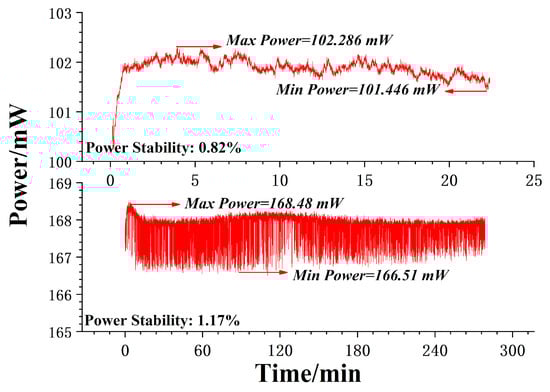
Figure 3.
Stability of optical power for periods of 20 and 290 min.
We dynamically tuned the FFP–TF, loaded the sinusoidal signal into the FFP–TF via the signal generator, and observed the influence of the peak-to-peak values of the external signal on the transmission spectrum of the swept laser when the DC bias voltage is certain to obtain a relation between the external driving voltages and the sweep output parameters. The sweep frequency was maintained constant at 50 kHz, when the DC bias of the sinusoidal signal was 2 V, the transmission spectra in the output of different peak-to-peak values were depicted as shown in Figure 4. When the DC bias voltage was fixed, the larger the peak-to-peak value, the wider was the transmission spectrum bandwidth of the swept laser and simultaneously, the output optical capacity reduced. Thus, the smaller the peak-to-peak value, the larger was the output optical capacity on the power meter. According to Figure 4, the continuous-output spectral diagrams can be obtained only when the signal tuning range loaded into the FFP–TF lies within a certain range. Otherwise, the output comprises two spectral maps with the central wavelength on one map being at a long distance from the central wavelength on the other, with specific peak-to-peak value ranges depending on FFP–TF and SOA.
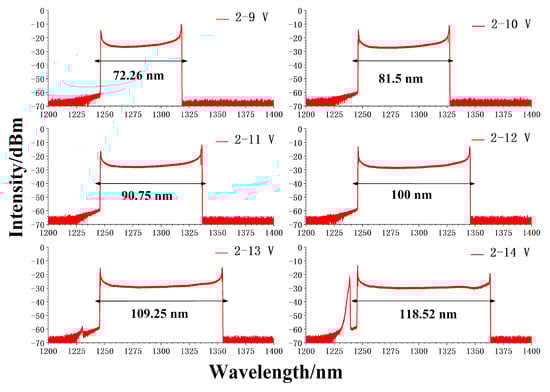
Figure 4.
Output spectra of the swept laser for different driving values.
The function generator and the adjustable signal amplifier were employed to generate sinusoidal signals with appropriate parameters for driving the FFP–TF. The frequency of the sinusoidal signals begins at 30 kHz, and the maximum rated tuning speed of the FFP–TF is observed at 100 kHz. The final output of the swept laser obtained through a photoelectric detector and oscilloscope is illustrated in Figure 5. The shape of the output wavelength was improved (i.e., made more symmetrical) by amplifying the outside SOA. The stability of the optical power in the output was separately tested at each frequency (30–100 kHz). The results are displayed in Figure 6. Within 10 min, the power stability degree of each sweep speed was less than 0.34% and the swept source maintained a highly stable working state.
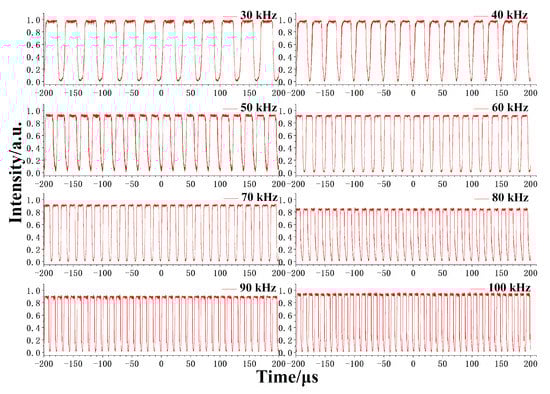
Figure 5.
The output temporal intensities of the swept laser after amplification by outside SOA.
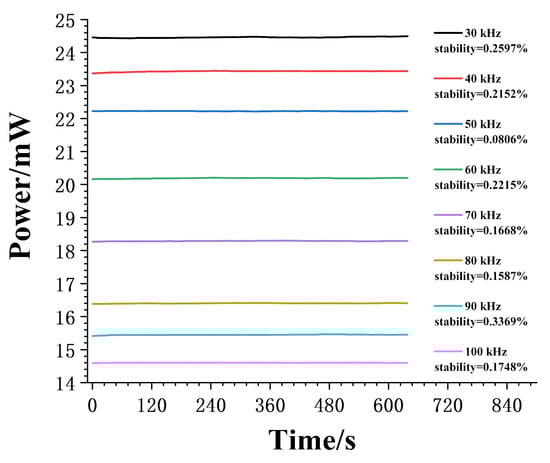
Figure 6.
Stability of the optical power of the swept source at different speeds.
The imaging quality of the OCT system is affected by the stability, spectral region, and dispersion matching rate of each device in the system. Therefore, to construct a frequency sweep system with high imaging quality, it is critical to model each device in the system. We have established a numerical model of the SS–OCT system to address the issues of noise and dispersion in the imaging optical path. This numerical model can be used to simulate the imaging process of an actual OCT system [17,18]. For example, there are six reflecting mirrors in the sample. The intervals between the six reflecting mirrors are 0.5 mm, the central wavelength is 1300 nm, and the spectral bandwidth is 120 nm. Based on the low-coherence interference principle, the swept OCT system uses an optical fiber Michelson interferometer to create an interference pattern based on the light returned by both the arms in the coupler and forms an interference spectrum. The system further detects the interference spectrum information via a balanced detector for data processing and image reconstruction. Figure 7 displays the simulation results of the SS–OCT system. Figure 7a,b denote the uniform distribution of the wavelength with time, whereas Figure 7c,d denote the uniform distribution of the wavenumber with time. Furthermore, Figure 7a,c demonstrate the interference signal obtained from the balanced detector. The sample depth coordinate, d and the wavenumber space, K constitute a Fourier transform pair. Thus, the transformation from the wavenumber space to the depth coordinate can be realized via Fourier transform. Figure 7b,d provide the point spread function of six points of the sample from which the axial resolution of the system can be measured. The mirror peak will not broaden with an increase in depth when the wavenumber is uniformly distributed with time. However, the mirror peak width will increase with the increasing depth of the sample, i.e., the resolution will decrease, when the output wavelength is uniformly distributed with time. This system is potentially applicable to imaging experiments with respect to biological tissues and other samples. It may also collect data from biological tissues for processing and reconstructing the two-dimensional cross sections in the depth direction.
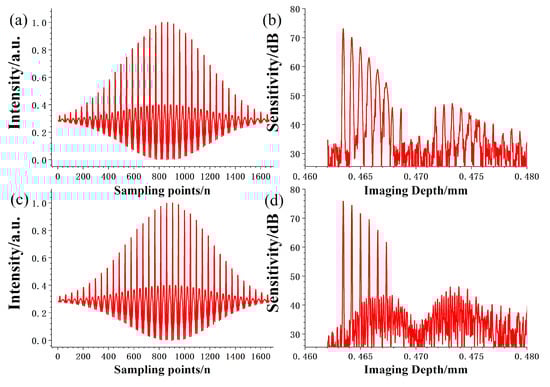
Figure 7.
Simulation result of the swept-source optical coherence tomography (SS–OCT) system: (a) interference signal obtained from a balanced detector under uniform distribution of the wavelength with time; (b) point spread function of the sample under uniform distribution of the wavelength with time; (c) interference signal obtained from a balanced detector under uniform distribution of the wavenumber with time; and (d) point spread function of a sample under uniform distribution of the wavenumber with time.
The envelope shape of the interference spectrum affects the imaging resolution ratio of the system. In particular, it affects the imaging ability of the system. The output spectrum of the swept source does not follow a Gaussian distribution. We can effectively improve the system’s resolution ratio and enhance its imaging quality by introducing a window function that shapes the spectrum and reduces the interference caused by the sidelobe [19,20,21]. A suitable window function was applied to the interference spectrum before the Fourier transform step to reduce the interference caused by the sidelobe and improve the image contrast. Different window functions exert different effects on the signal spectrum because they result in different leakage sizes and exhibit different resolving powers. As the windowing processing is performed on signals, the selected window function must be compatible with the signal properties and research objectives. The effects of window function on the spectral shape were evaluated using a plane mirror sample. Further, the interference spectral signal data were processed using several common window functions. The interference spectra obtained after spectral shaping in the simulation experiment are shown in Figure 8. In principle, the selected window function should maximize the amount of information and eliminate the integrated effect of the sidelobe. Therefore, the main lobe width in the window function frequency spectrum should be narrowed as far as possible to reduce the full width at half maxima (FWHM).
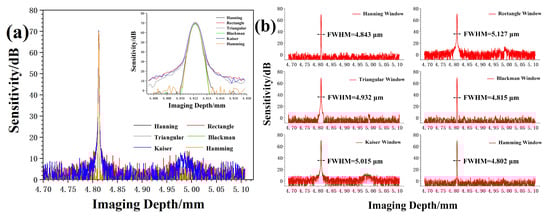
Figure 8.
(a) and (b) Effect of different window functions on the point diffusion function.
4. Conclusions
In this study, we investigate a high-performance and -flexibility swept source, which is the main operational technique for OCT imaging. Further, we describe the working principle of the all-fiber-ring short-cavity continuously tuned swept source, complete the construction of the light source, and present spectral information with respect to the final output of the source. The central wavelength of the scan spectrum is 1300 nm, and the tuning range of the scanning frequency is 20–100 kHz. Furthermore, we analyzed the manner in which the parameter of the external driving voltages affected the performance of the swept laser source. Subsequently, we established an interference model for the SS–OCT system and simulated the point spread function of the system based on the experimental results. The short-cavity swept source exhibits significant advantages with respect to its applicability and size, improving its application prospects in biological tissue imaging and early diagnosis of diseases.
Author Contributions
Conceptualization, X.W. and Z.Y.; Data curation, Z.Y.; Formal analysis, Z.Y. and X.W.; Funding acquisition, X.W. and S.R.; Investigation, H.S.; Methodology, Z.Y. and X.W.; Project administration, X.W. and S.R.; Resources, X.W. and S.R.; Software, Z.Y.; Supervision, H.S.; Validation, D.O.; Writing – original draft, Z.Y.; Writing – review and editing, X.W. and S.R.. All authors have read and agreed to the published version of the manuscript.
Funding
This research was funded by the basic Research Foundation of Knowledge Innovation Program of Shenzhen City under Grant JCYJ20180301171044707, and the university-enterprise cooperation research and development project of SZTU No 2018010802002, 2018010802005 and 2019310103001.
Conflicts of Interest
The authors declare no conflict of interest.
References
- Yasin Alibhai, A.; Or, C.; Witkin, A.J. Swept Source Optical Coherence Tomography: A Review. Curr. Ophthalmol. Rep. 2018, 6, 7–16. [Google Scholar] [CrossRef]
- Lee, E.C.W.; de Boer, J.F.; Mujat, M.; Lim, H.; Yun, S.H. In vivo optical frequency domain imaging of human retina and choroid. Opt. Express 2006, 14, 4403. [Google Scholar] [CrossRef] [PubMed]
- Yun, S.-H.; Boudoux, C.; Tearney, G.J.; Bouma, B.E. High-speed wavelength-swept laser for biomedical imaging. SPIE Photonics West 2004, 16, 293–295. [Google Scholar]
- Choma, M.A.; Hsu, K.; Izatt, J.A. Swept source optical coherence tomography using an all-fiber 1300-nm ring laser source. J. Biomed. Opt. 2005, 10, 044009. [Google Scholar] [CrossRef] [PubMed]
- Han, S.; Kwon, O.; Wijesinghe, R.E.; Kim, P.; Jung, U.; Song, J.; Lee, C.; Jeon, M.; Kim, J. Numerical-sampling-functionalized real-time index regulation for direct k-domain calibration in spectral domain optical coherence tomography. Electronics 2018, 7, 182. [Google Scholar] [CrossRef]
- Chong, C.; Morosawa, A.; Sakai, T. High-speed wavelength-swept laser source with high-linearity sweep for optical coherence tomography. IEEE J. Sel. Top. Quantum Electron. 2008, 14, 235–242. [Google Scholar] [CrossRef]
- Huo, T.; Zhang, J.; Zheng, J.; Chen, T.; Wang, C.; Zhang, N.; Liao, W.; Zhang, X.; Xue, P. Linear-in-wavenumber swept laser with an acousto-optic deflector for optical coherence tomography. Opt. Lett. 2014, 39, 247. [Google Scholar] [CrossRef] [PubMed]
- Pfäffle, C.; Spahr, H.; Hillmann, D.; Sudkamp, H.; Franke, G.; Koch, P.; Hüttmann, G. Reduction of frame rate in full-field swept-source optical coherence tomography by numerical motion correction [Invited]. Biomed. Opt. Express 2017, 8, 1499. [Google Scholar] [CrossRef] [PubMed]
- Yamanari, M.; Makita, S.; Yasuno, Y. Polarization-sensitive swept-source optical coherence tomography with continuous source polarization modulation. Opt. Express 2008, 16, 5892. [Google Scholar] [CrossRef] [PubMed]
- Lee, S.-W.; Song, H.-W.; Jung, M.-Y.; Kim, S.-H. Wide tuning range wavelength-swept laser with a single SOA at 1020 nm for ultrahigh resolution Fourier-domain optical coherence tomography. Opt. Express 2011, 19, 21227. [Google Scholar] [CrossRef] [PubMed]
- Huber, R.; Wojtkowski, M.; Fujimoto, J.G. Fourier Domain Mode Locking (FDML): A new laser operating regime and applications for optical coherence tomography. Opt. Express 2006, 14, 3225. [Google Scholar] [CrossRef] [PubMed]
- Huber, R.; Taira, K.; Wojtkowski, M.; Ko, T.H.; Fujimoto, J.G.; Hsu, K. High-speed frequency swept light source for Fourier domain OCT at 20 kHz A-scan rate. Coherence Domain Opt. Methods Opt. Coherence Tomogr. Biomed. IX 2005, 5690, 96. [Google Scholar]
- Huber, R.; Srinivasan, V.J.; Adler, D.C.; Gorczynska, I.; Fujimoto, J.G. Fourier domain mode locking (FDML) in the non-zero dispersion regime: A laser for ultrahigh-speed retinal OCT imaging at 236kHz line rate. In Proceedings of the 2007 Conference on Lasers and Electro-Optics (CLEO), Baltimore, MD, USA, 6–11 May 2007. [Google Scholar]
- Karpf, S.; Jalali, B. Fourier-domain mode-locked laser combined with a master-oscillator power amplifier architecture. Opt. Lett. 2019, 44, 1952. [Google Scholar] [CrossRef] [PubMed]
- Yamashita, S. 6-Dispersion-Tuned Swept Lasers for Optical Coherence Tomography. IEEE J. Sel. Top. Quantum Electron. 2018, 24, 1–9. [Google Scholar] [CrossRef]
- Range, T. MAX1978 Evaluation Kit Evaluates: MAX1978. 2000; 1–12. [Google Scholar]
- Biedermann, B.R.; Wieser, W.; Eigenwillig, C.M.; Klein, T.; Huber, R. Dispersion, coherence and noise of fourier domain mode locked (FDML) lasers. Opt. InfoBase Conf. Pap. 2009, 17, 88–92. [Google Scholar]
- Jirauschek, C.; Biedermann, B.; Huber, R. A theoretical description of Fourier domain mode locked lasers. Opt. Express 2009, 17, 24013. [Google Scholar] [CrossRef]
- Qin, C.; Yang, D. Numerical Simulation of Ring Cavity Wavelength-Swept Laser Based on Semiconductor Optical Amplifier. IEEE J. Quantum Electron. 2014, 50, 831–839. [Google Scholar]
- Tu, C.; Deng, Y.; Cai, M.; Huang, Z.; Li, Y.; Lu, F.; Li, E. Theoretical study on instantaneous linewidth of Fourier-domain mode-locked fiber lasers. Opt. Commun. 2012, 285, 5287–5292. [Google Scholar] [CrossRef]
- Pfeiffer, T.; Petermann, M.; Draxinger, W.; Jirauschek, C.; Huber, R. Ultra low noise Fourier domain mode locked laser for high quality megahertz optical coherence tomography. Biomed. Opt. Express 2018, 9, 4130. [Google Scholar] [CrossRef] [PubMed]
© 2020 by the authors. Licensee MDPI, Basel, Switzerland. This article is an open access article distributed under the terms and conditions of the Creative Commons Attribution (CC BY) license (http://creativecommons.org/licenses/by/4.0/).