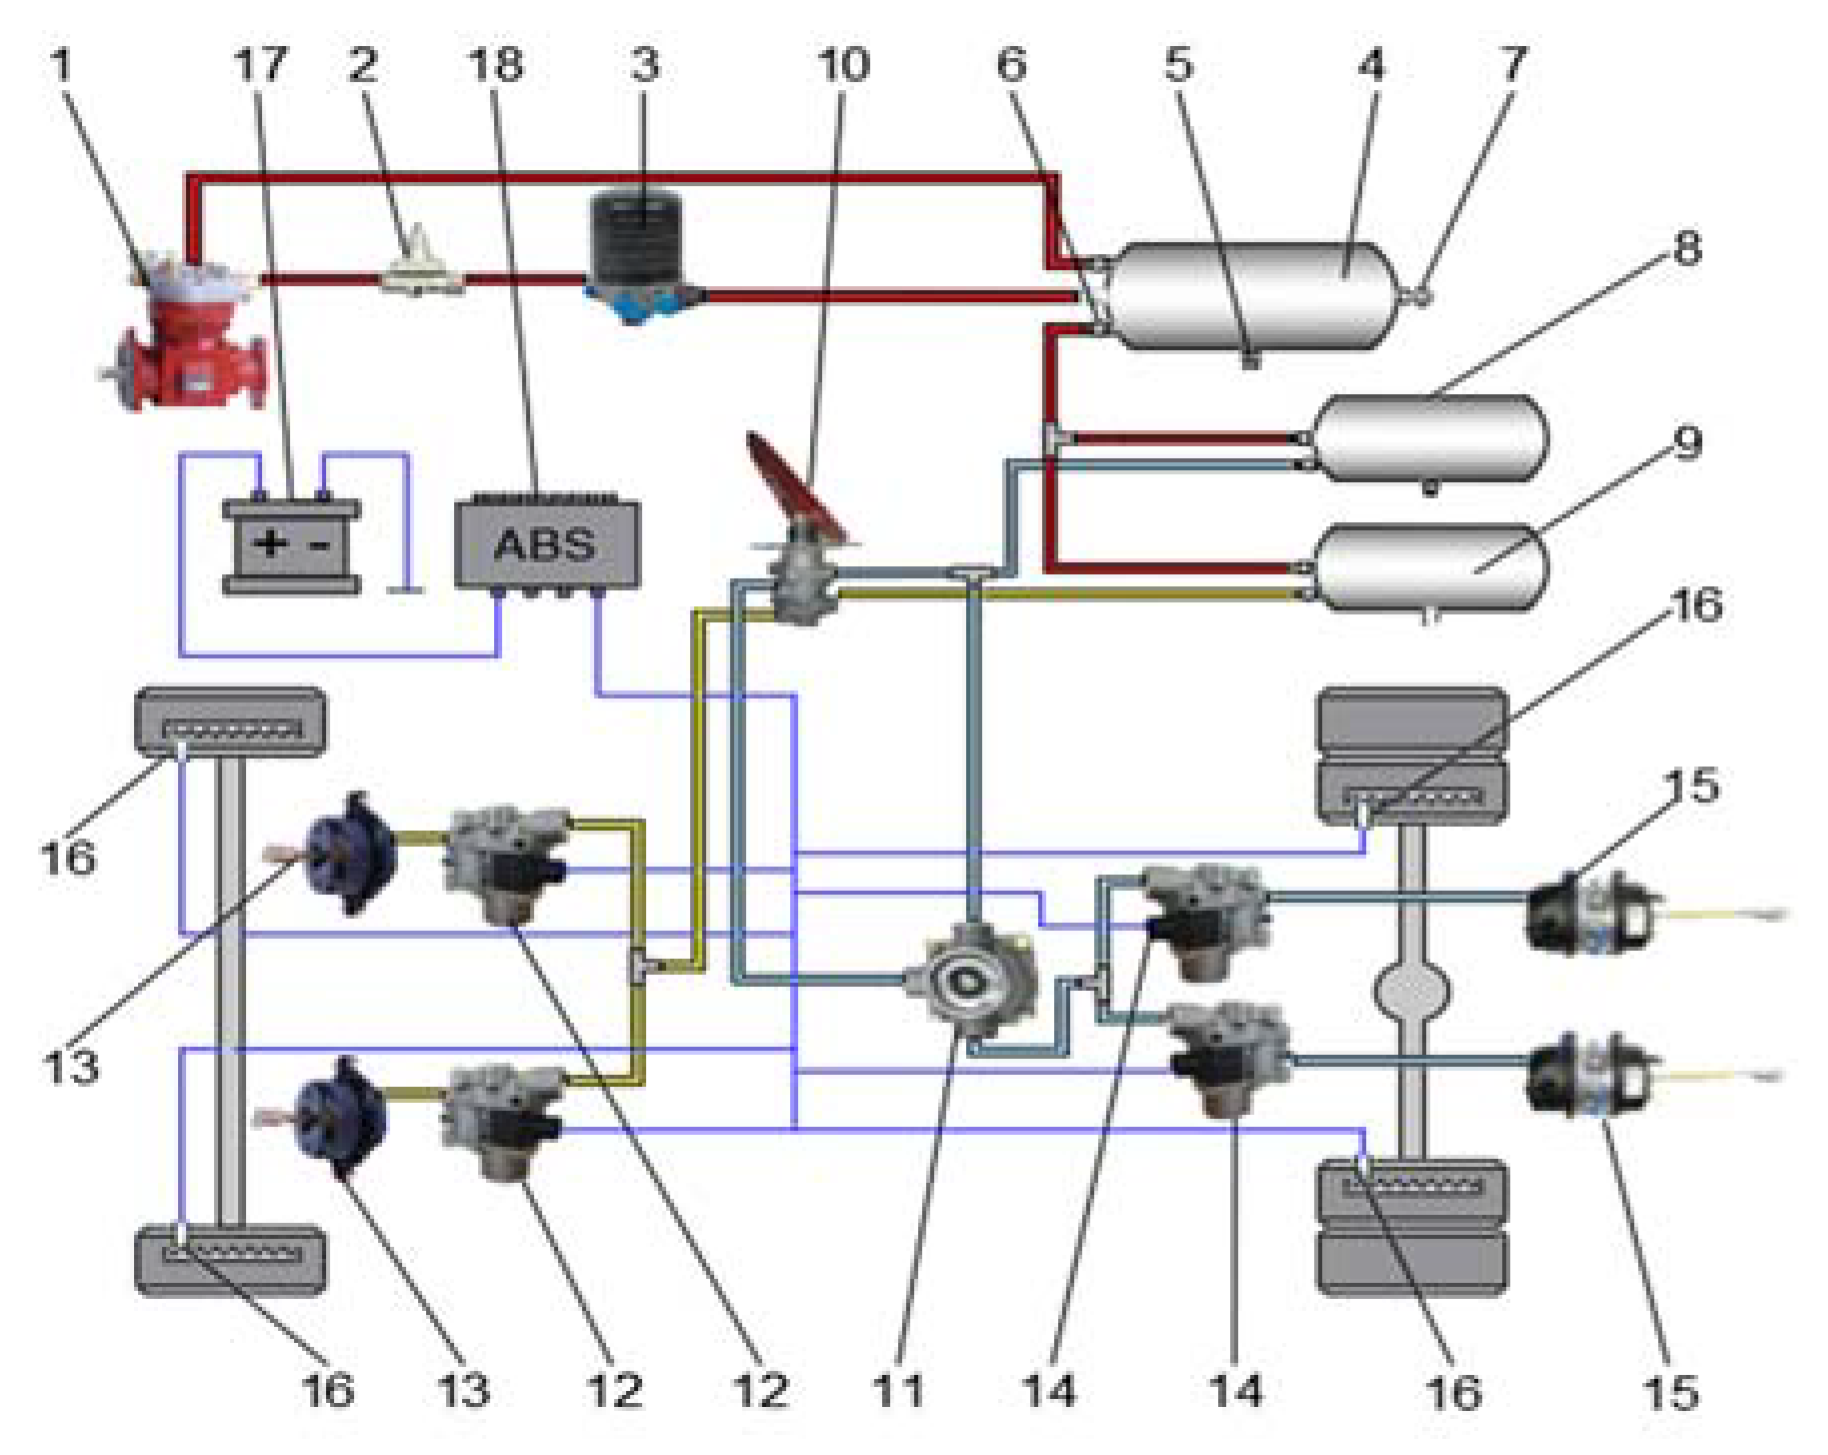
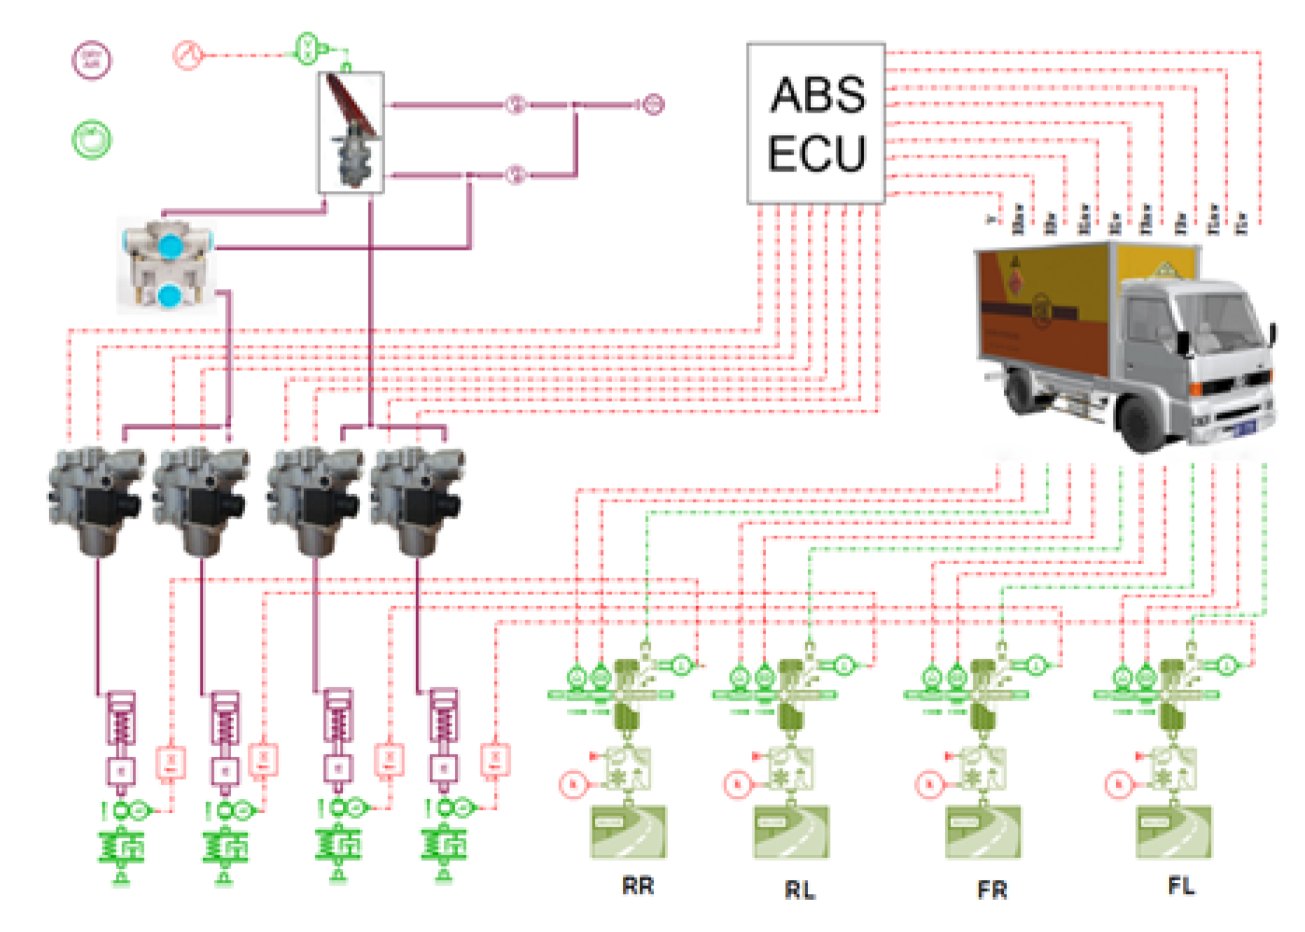
Figure 1.
Schematic diagram of the pneumatic anti-lock braking system (ABS). 1-air compressor; 2-pressure limiting valve; 3-air dryer; 4-primary air reservoir; 5-drainage valve; 6-one-way valve; 7-relief valve; 8-air reservoir for rear brake; 9-air reservoir for front brake; 10-series dual-chamber brake valve; 11-relay valve; 12-front pressure regulator; 13-front brake; 14-rear pressure regulator; 15-rear brake; 16-wheel rotary speed sensor; 17-power supply; 18-ECU (Electronic Control Unit).
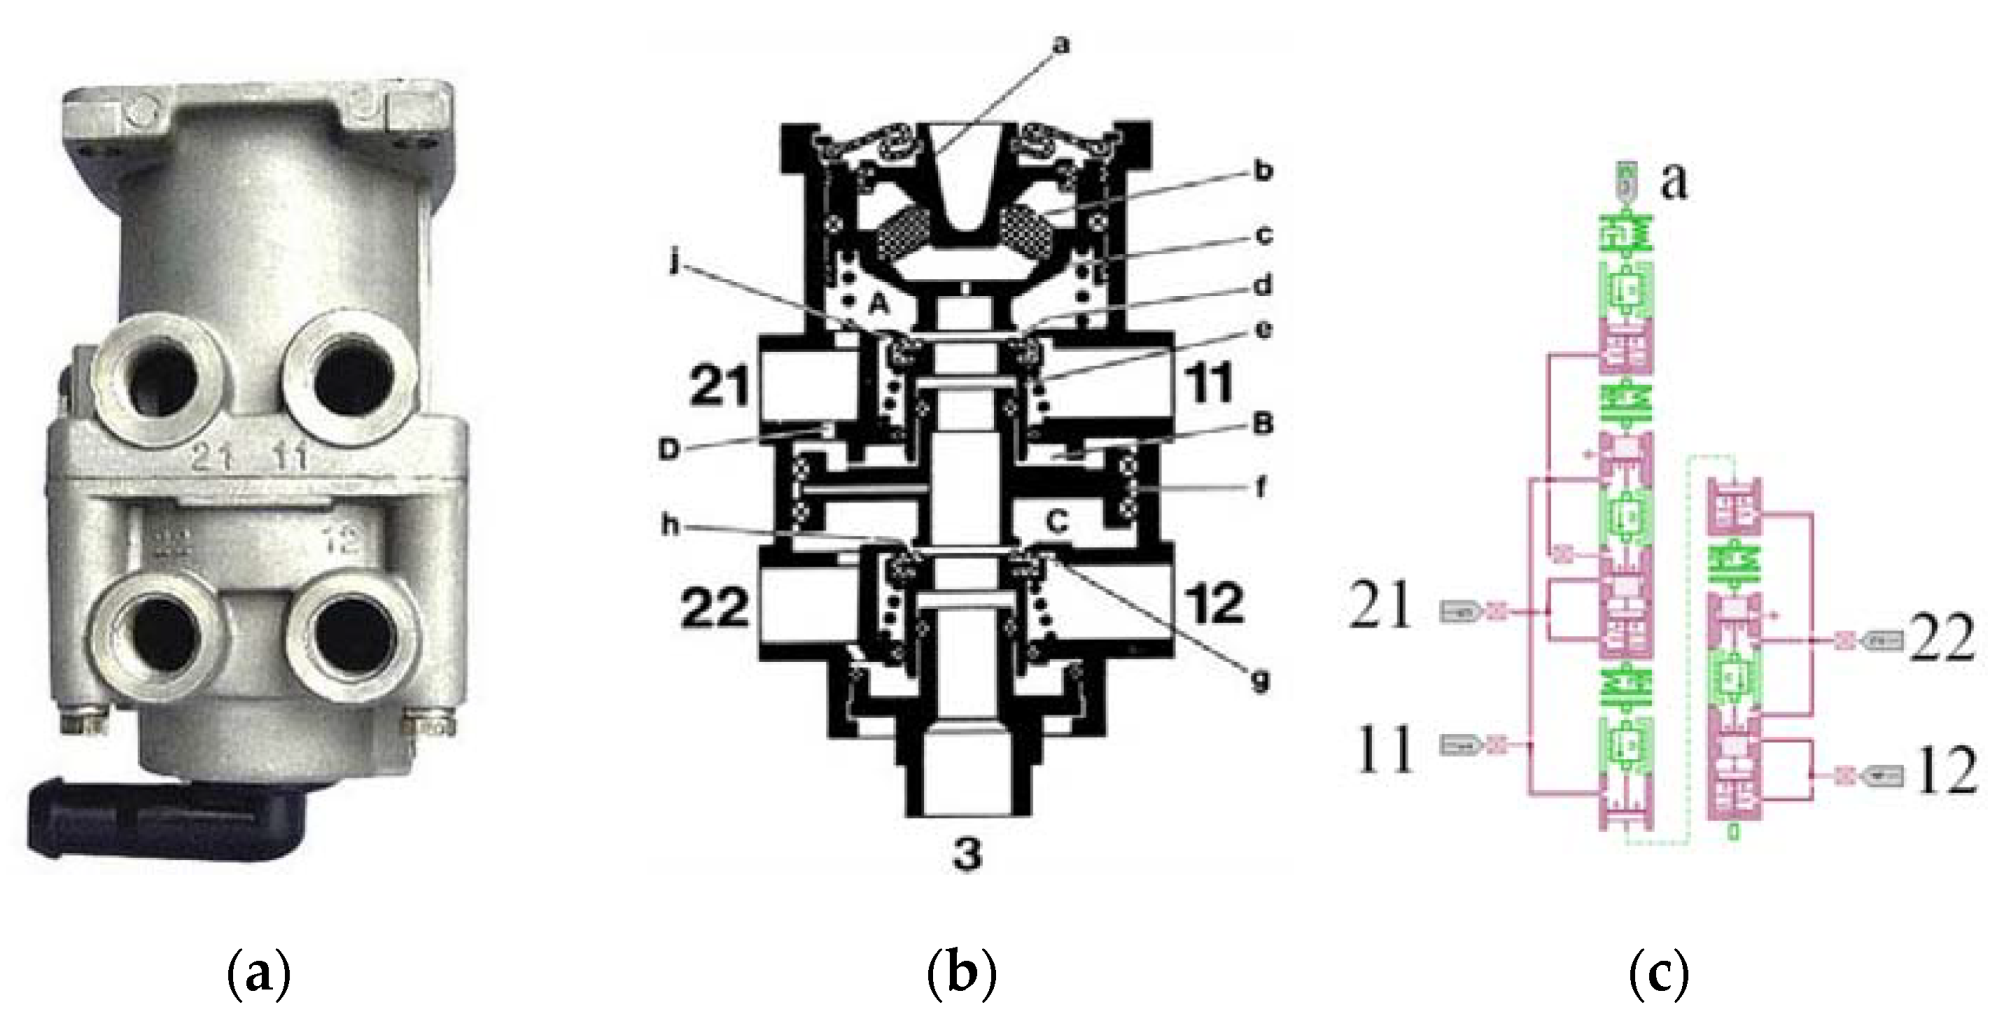
Figure 2.
Series dual-chamber air brake valve. (a) Appearance. (b) Schematic diagram. (c) Submodel in AMESim. In the schematic diagram: a-tappet seat; b-rubber spring; c-upper chamber piston; d-upper chamber exhaust port; e-valve stem; f-lower chamber piston; g-lower chamber inlet; h-lower chamber exhaust port; i-upper chamber inlet; A,B,C-chamber; D-flow hole; 11-upper chamber inlet port; 21-upper chamber outlet port; 12-lower chamber inlet port; 22-lower chamber outlet port; 3-exhaust port.
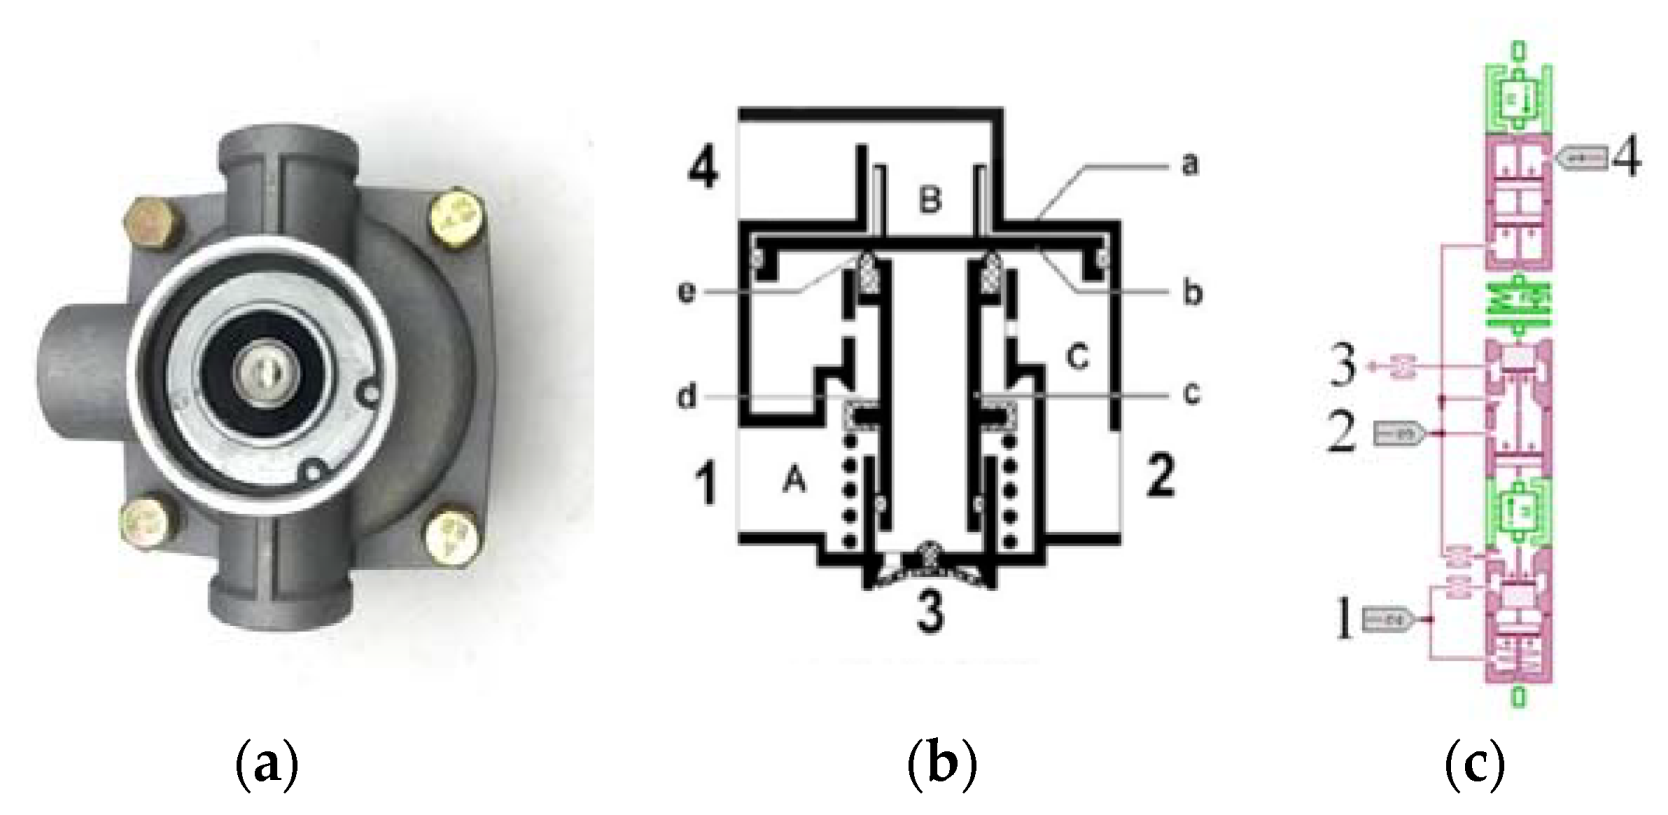
Figure 3.
Relay valve. (a) Appearance. (b) Schematic diagram. (c) Submodel in AMESim. In the Schematic diagram: 1-air inlet port; 2-air outlet port; 3-air exhaust port; 4-control port; a-valve body; b-piston; c-valve stem; d-inlet; e-exhaust valve; A-inlet chamber; B-control chamber; C-outlet chamber.
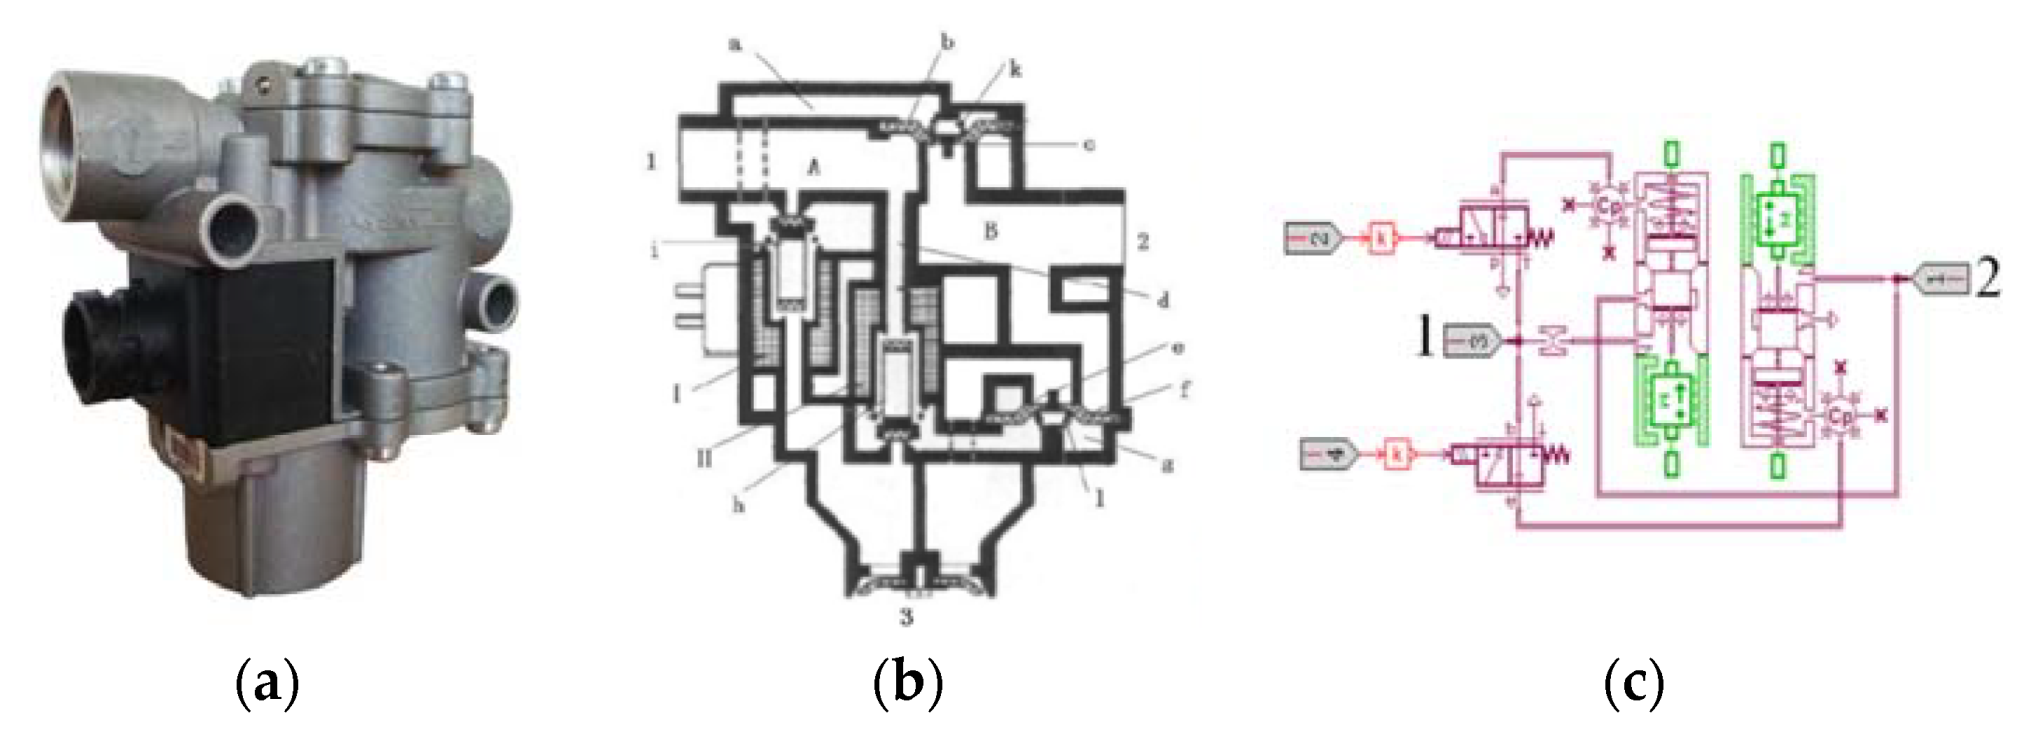
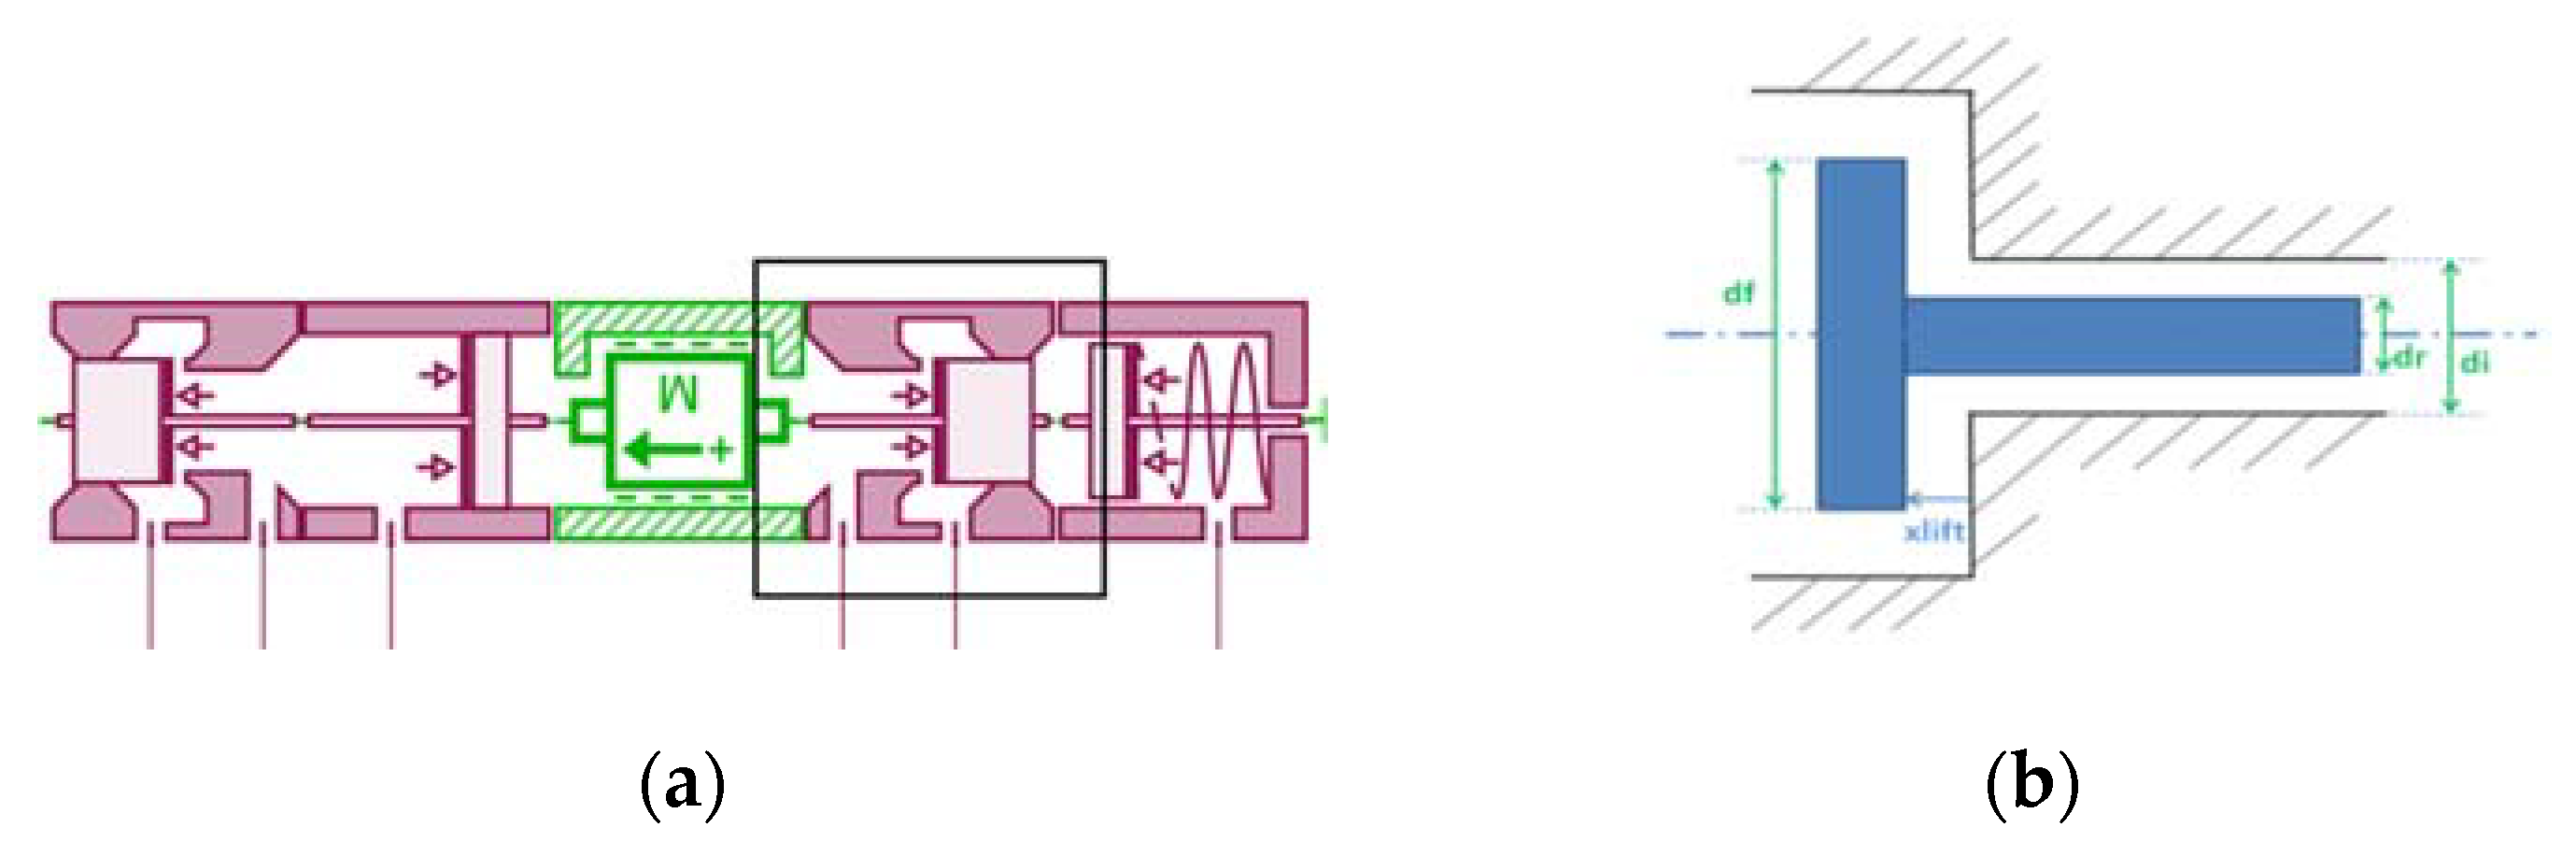
Figure 4.
Pneumatic ABS solenoid valve. (a) Appearance. (b) Schematic diagram. (c) AMESim submodel. In the schematic diagram: 1-from braking valve; 2-to braking chamber; 3-to atmosphere; a-pilot chamber(inlet valve); b-inlet valve diaphragm; c-inlet valve seat; d-air pilot passage; e-exhaust valve seat; f-exhaust valve diaphragm; g-pilot chamber(exhausted valve); h-pilot exhaust solenoid valve spool; i-pilot inlet solenoid valve spool; k-inlet valve spring; l-exhaust valve spring; Ⅰ,Ⅱ-solenoid; A-inlet chamber; B-outlet chamber.
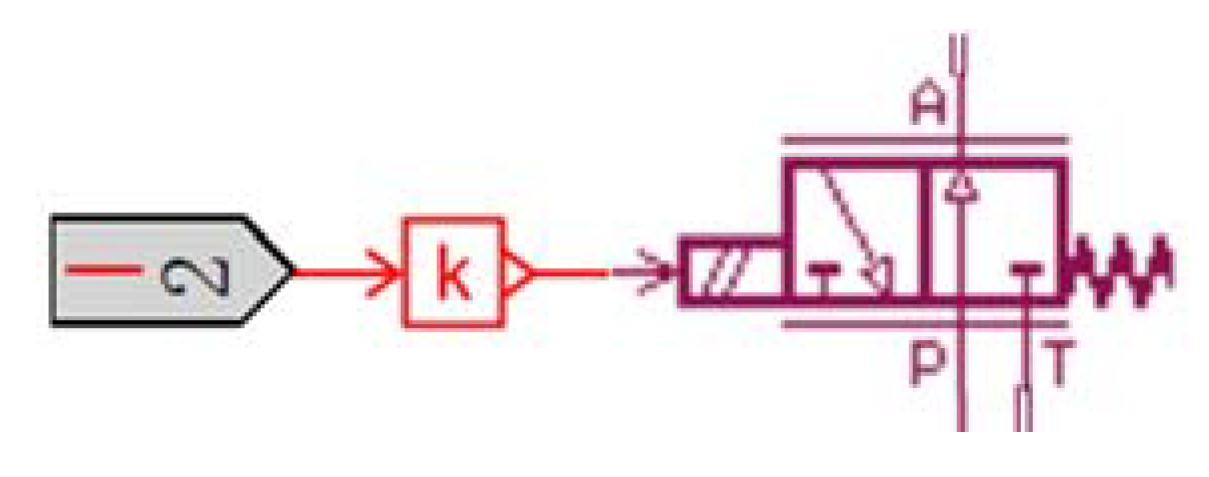
Figure 5.
Controller submodel of the pneumatic ABS in Simulink.
Figure 5.
Controller submodel of the pneumatic ABS in Simulink.
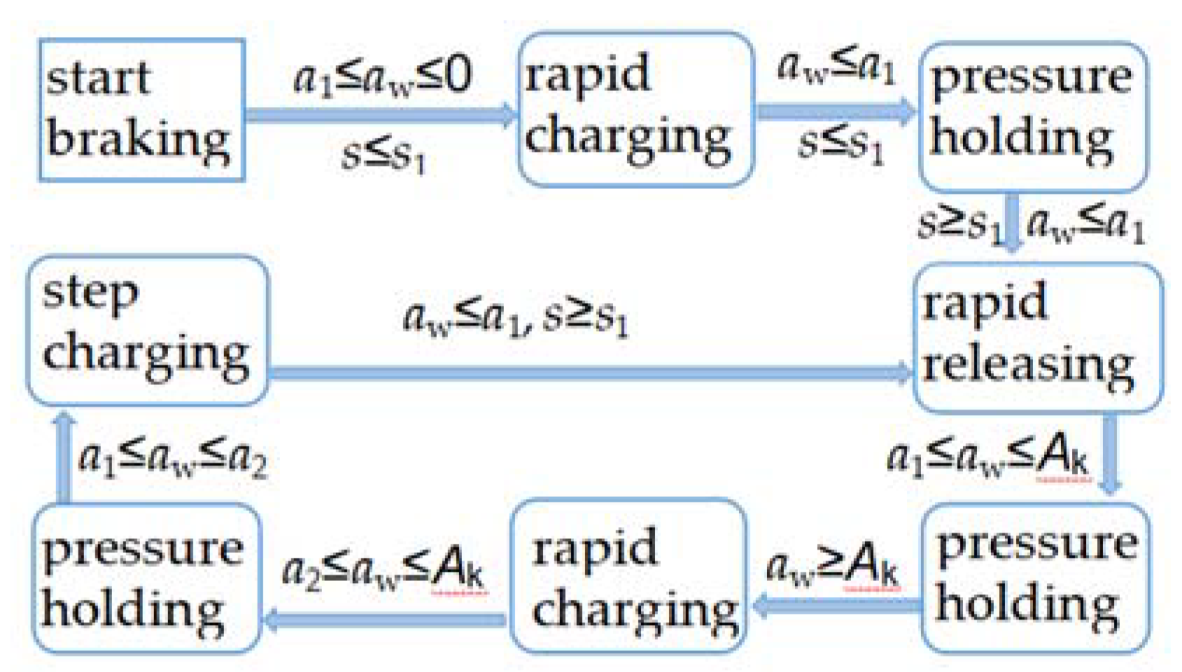
Figure 6.
ABS logic threshold method control logic. s1-slip ratio threshold, aw-angular acceleration, a1-first threshold of angular acceleration, a2-second threshold of angular acceleration, Ak-third threshold of angular acceleration.
Figure 6.
ABS logic threshold method control logic. s1-slip ratio threshold, aw-angular acceleration, a1-first threshold of angular acceleration, a2-second threshold of angular acceleration, Ak-third threshold of angular acceleration.
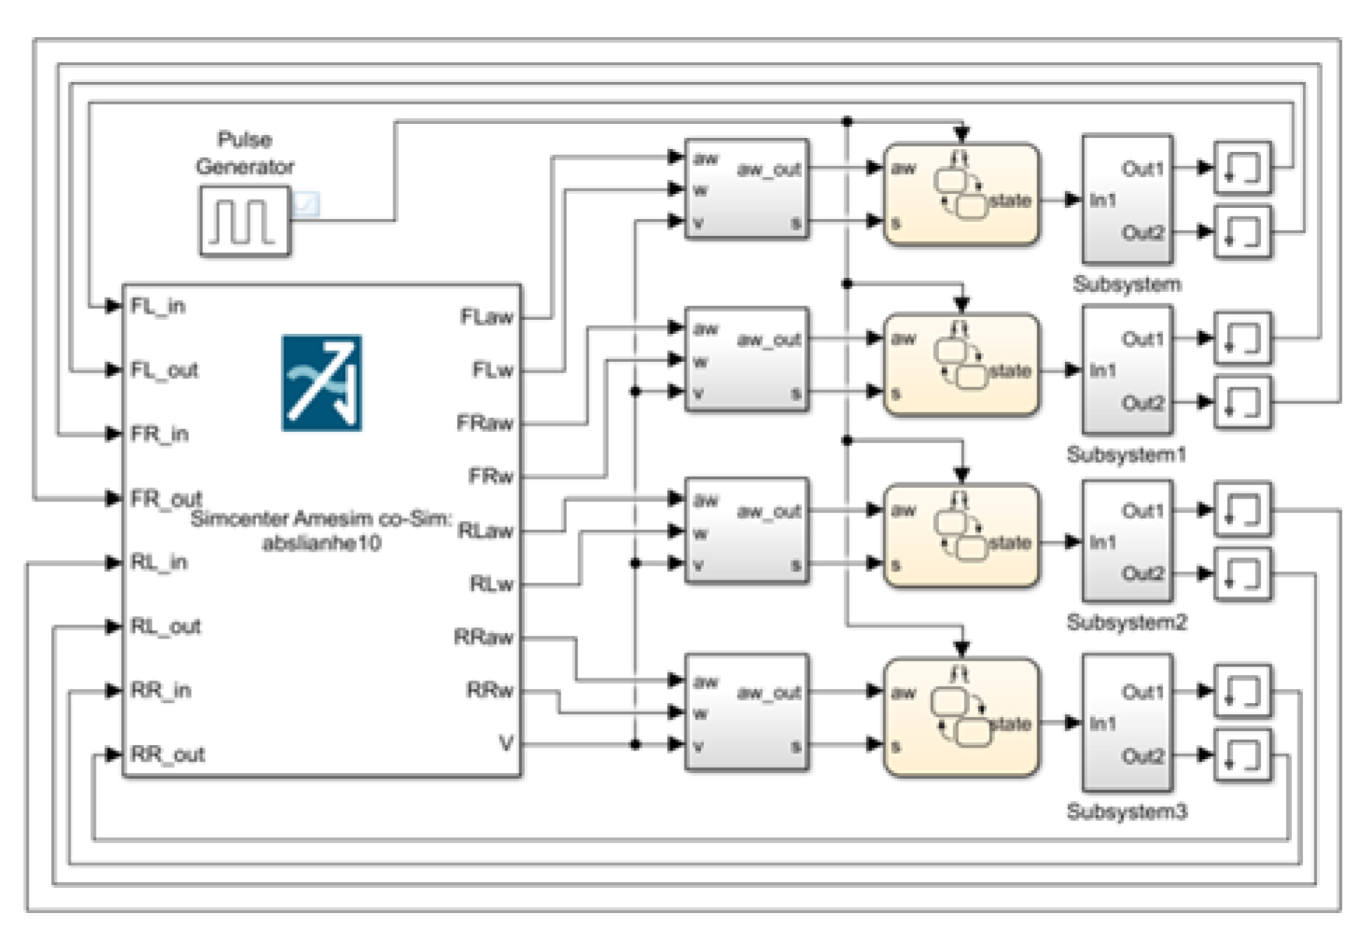
Figure 7.
Simulation model topology.
Figure 7.
Simulation model topology.
Figure 8.
Total model of simulation.
Figure 8.
Total model of simulation.
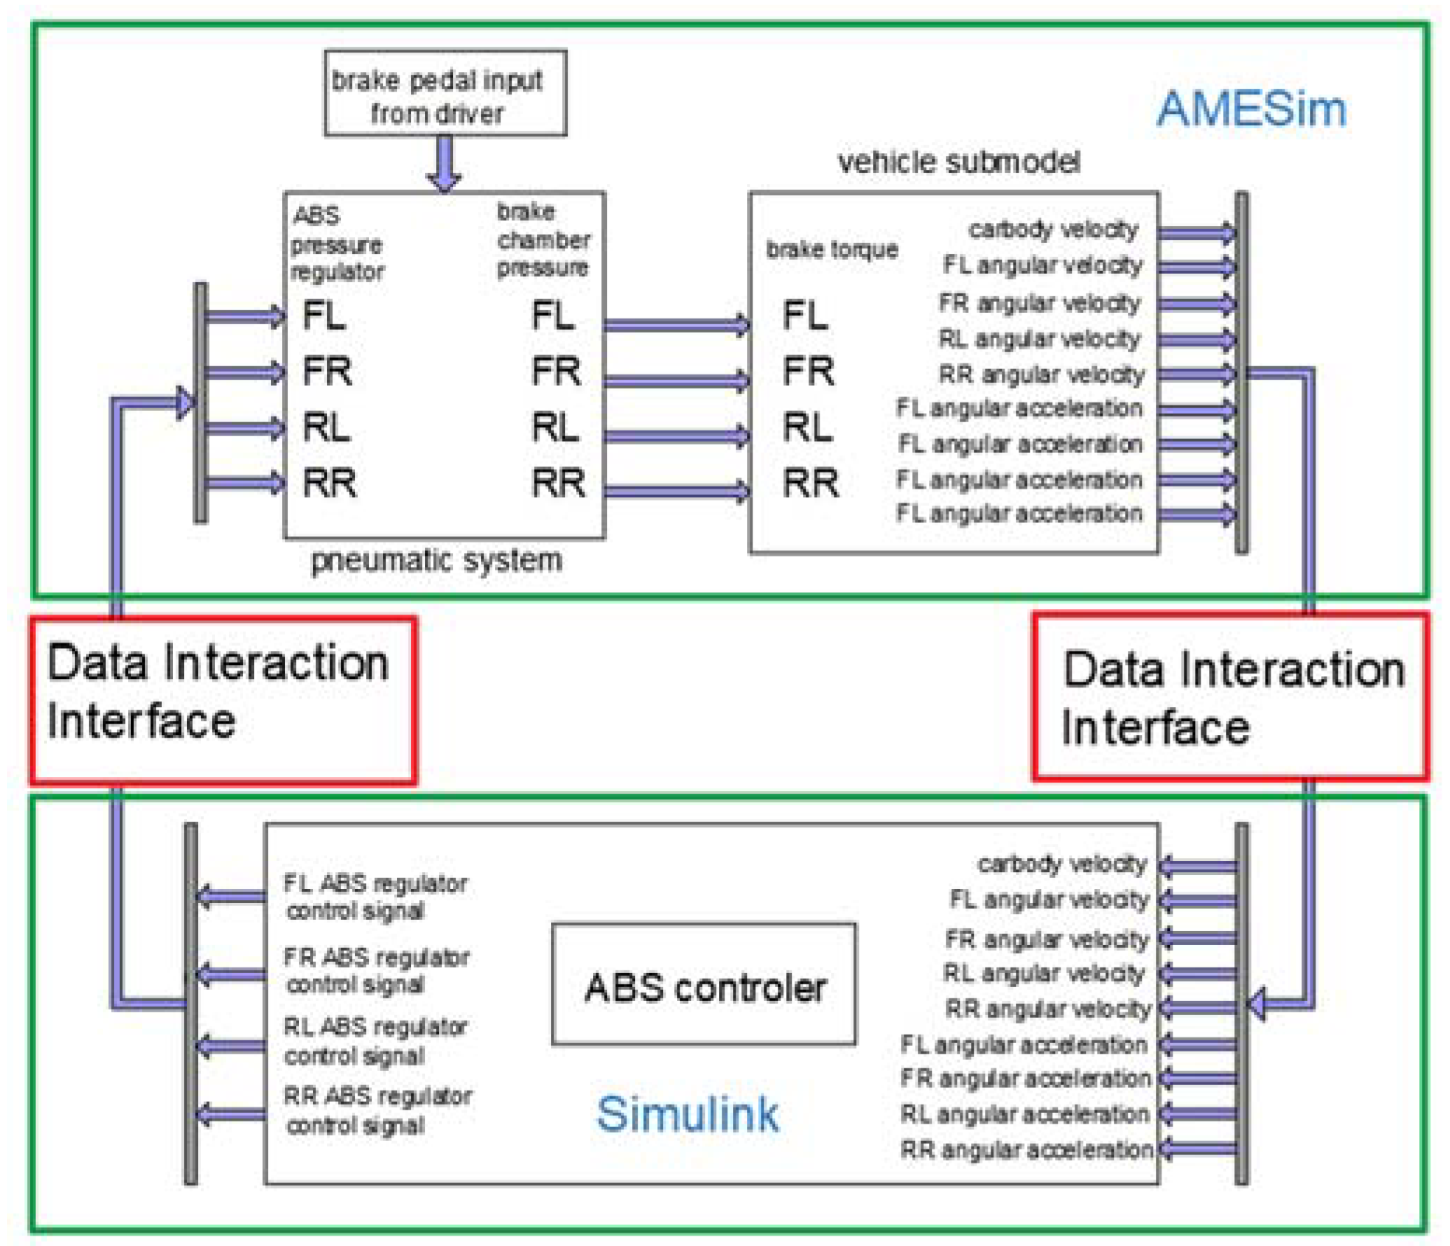
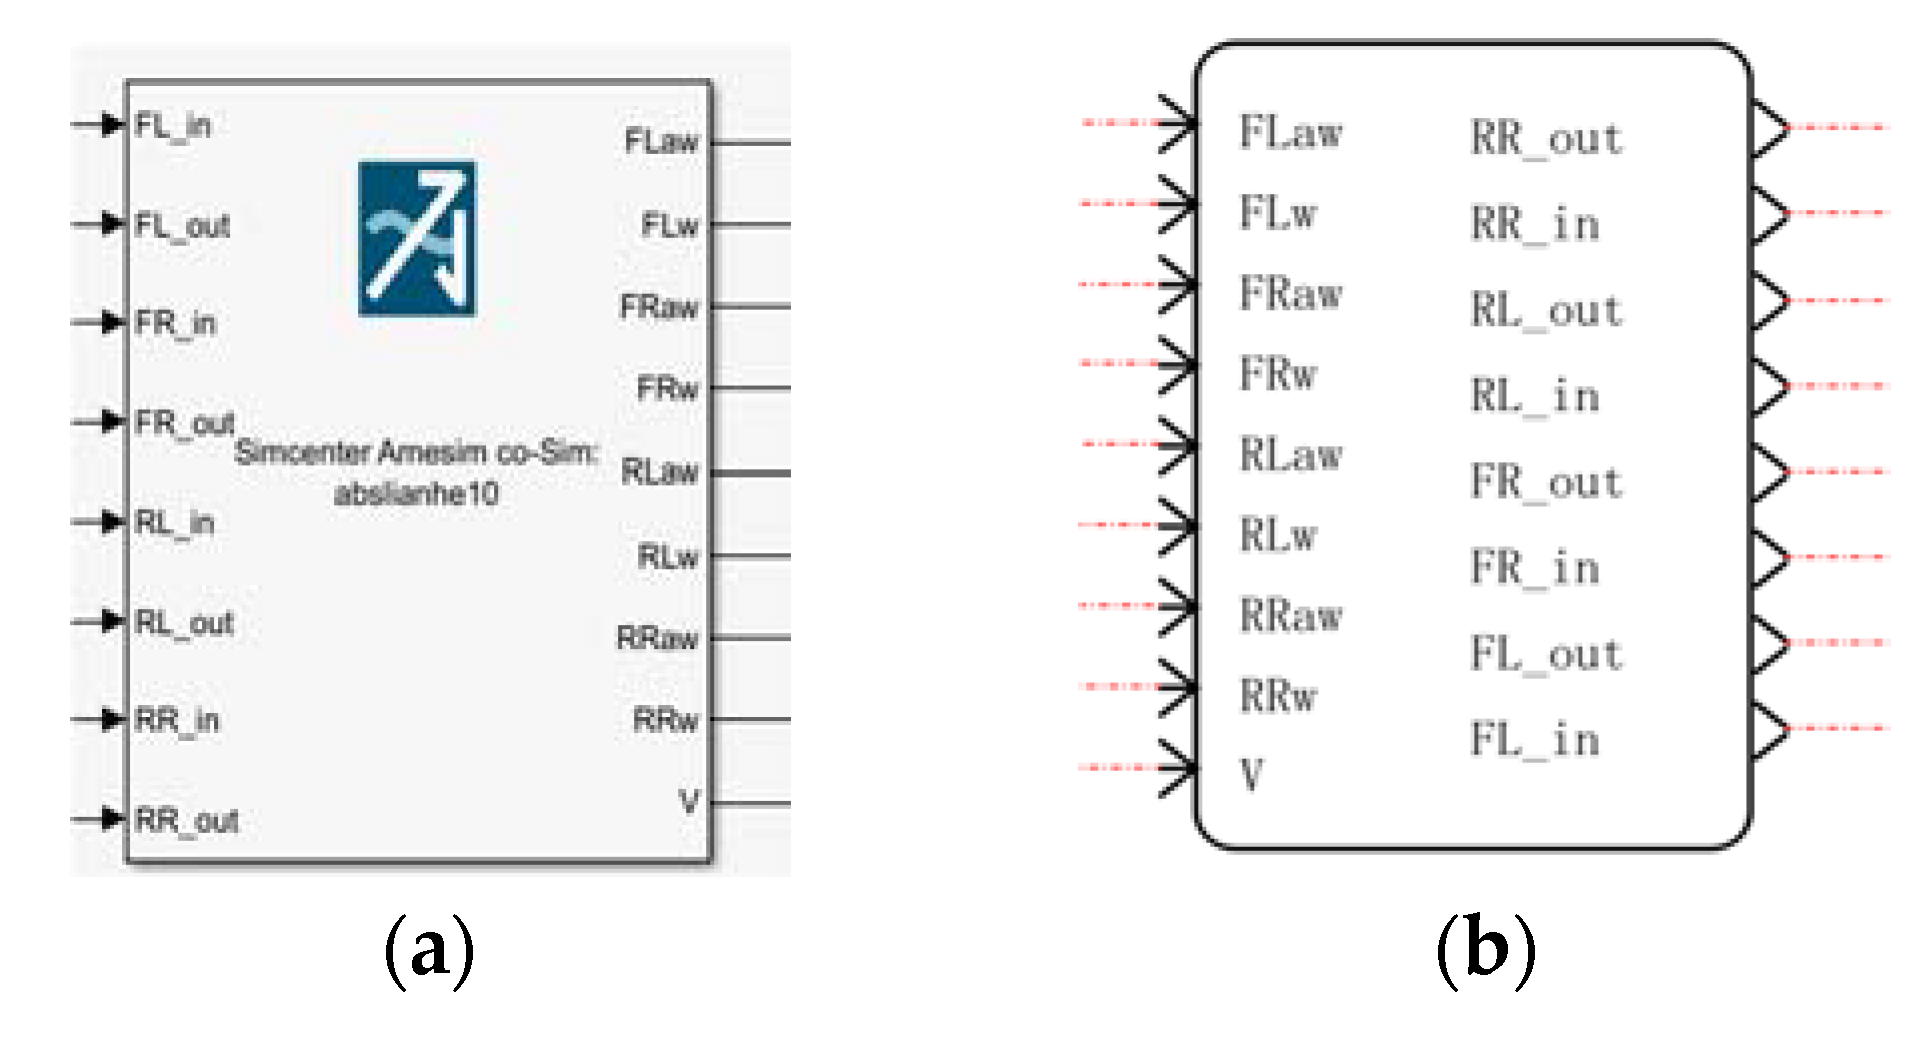
Figure 9.
Interface block of co-simulation. (a) Simcenter Amesim co-Sim Module in Simulink; (b) Interface block of SimuCosim in AMESim.
Figure 9.
Interface block of co-simulation. (a) Simcenter Amesim co-Sim Module in Simulink; (b) Interface block of SimuCosim in AMESim.
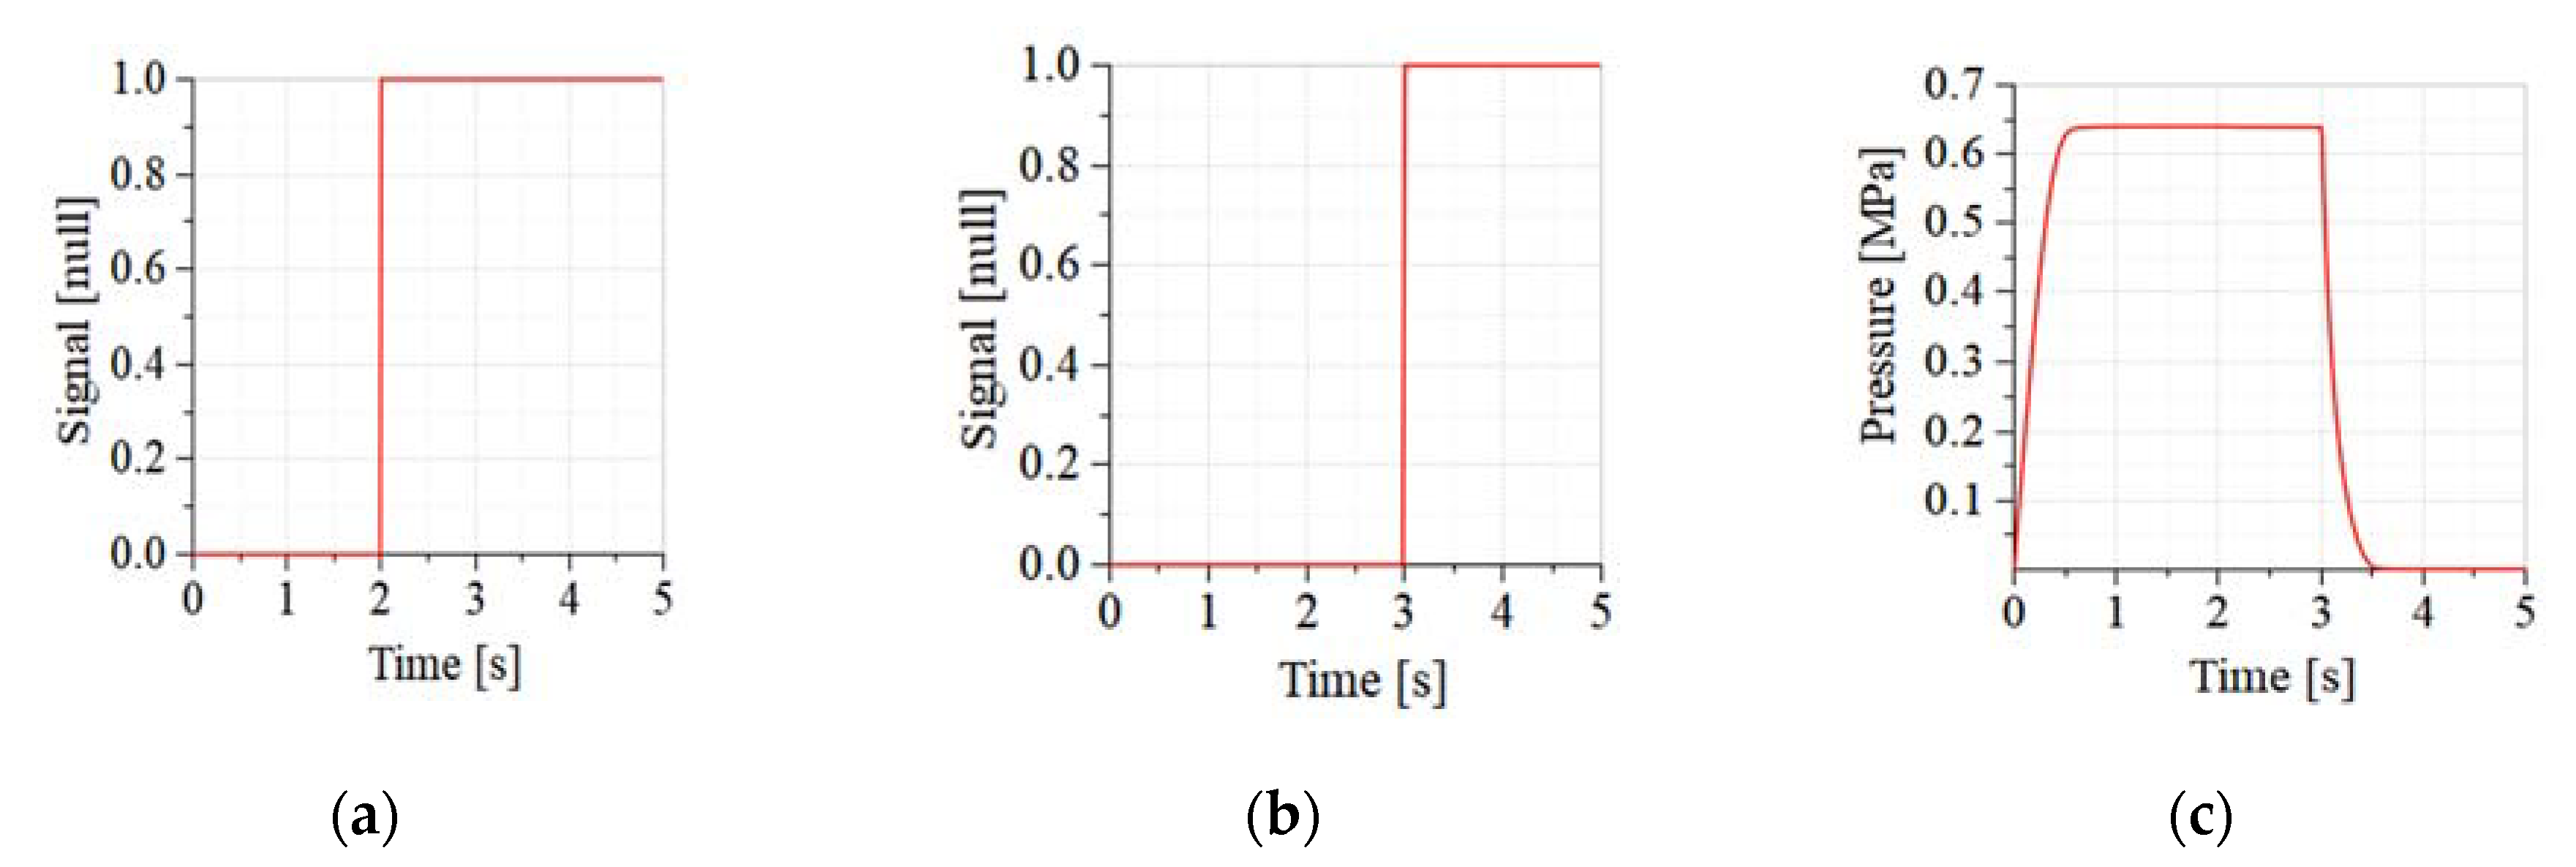
Figure 10.
Curves of ABS pressure regulator control signal and pressure response of brake chamber. (a) Control signal of the pilot inlet solenoid valve; (b) control signal of the pilot exhaust solenoid valve; (c) pressure of the brake chamber under control signals of (a,b).
Figure 10.
Curves of ABS pressure regulator control signal and pressure response of brake chamber. (a) Control signal of the pilot inlet solenoid valve; (b) control signal of the pilot exhaust solenoid valve; (c) pressure of the brake chamber under control signals of (a,b).
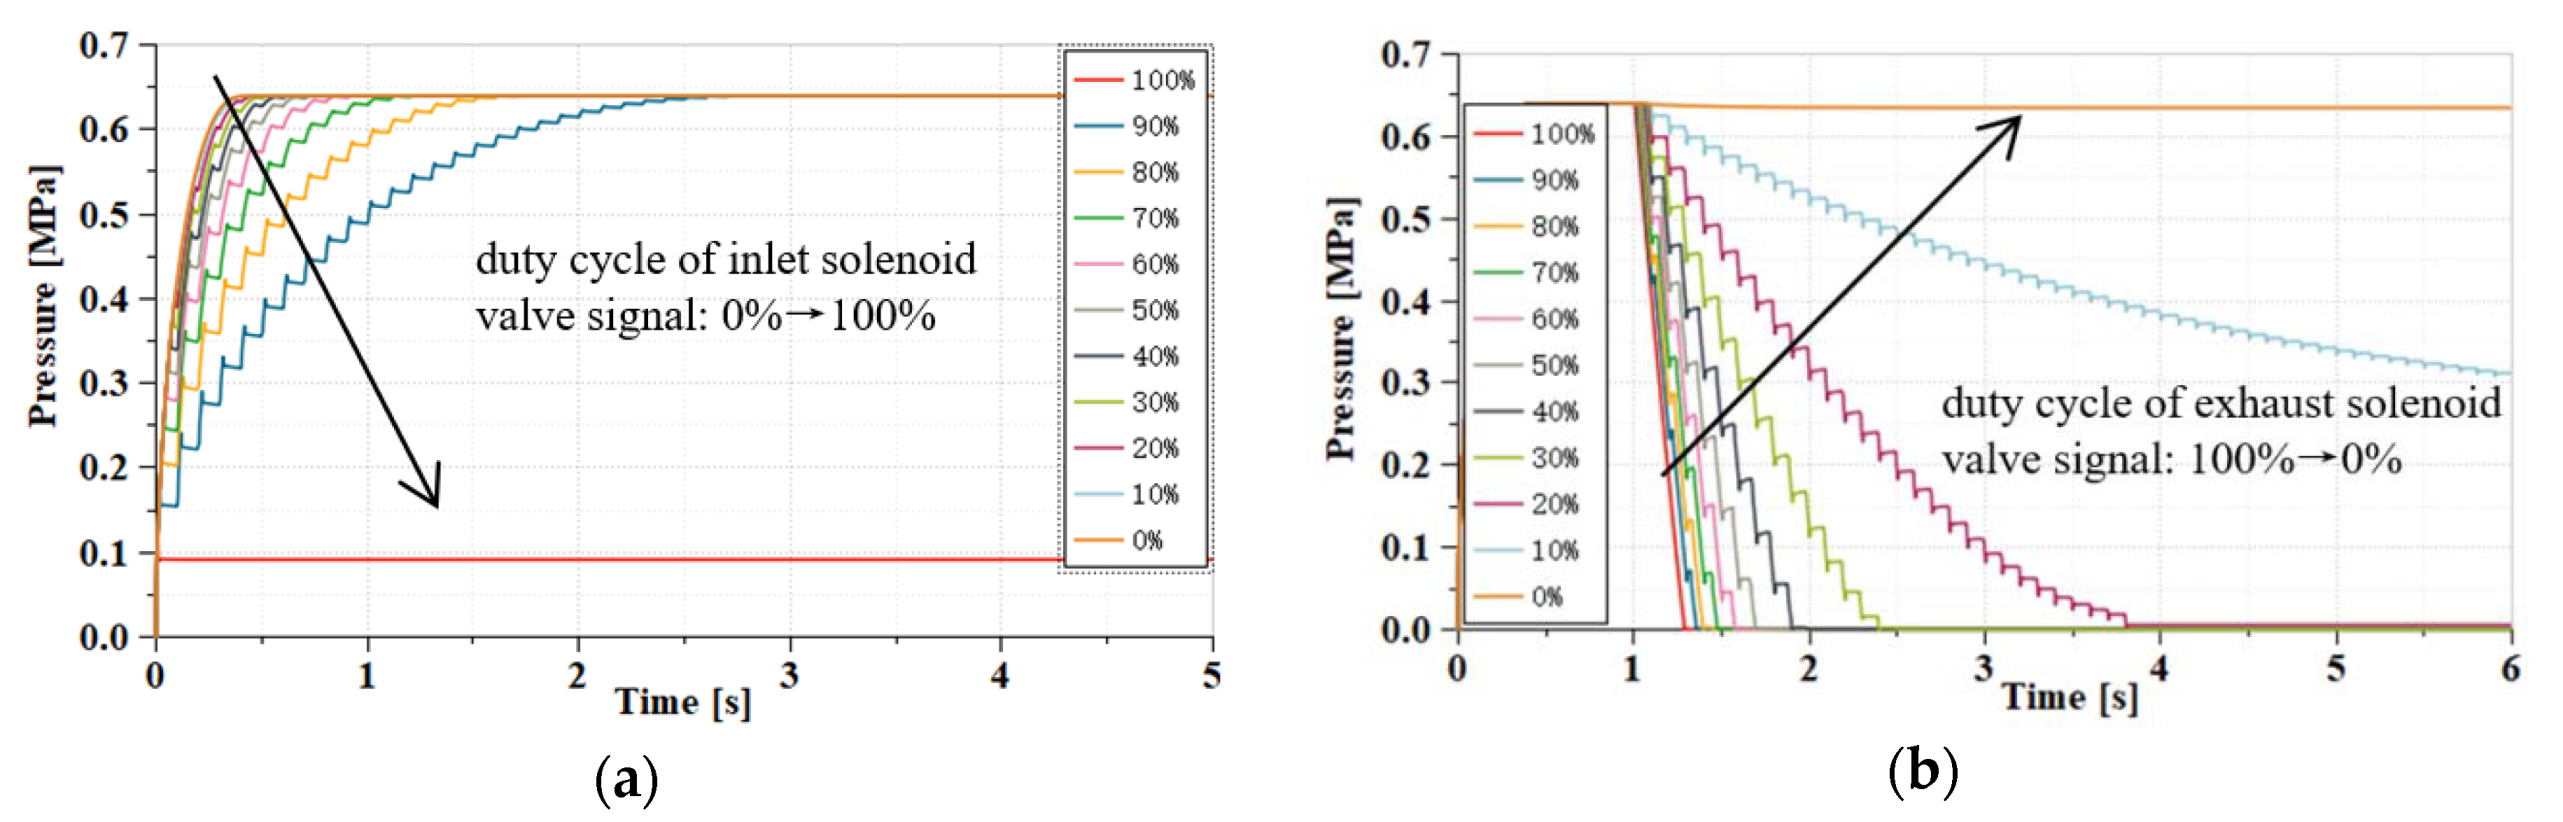
Figure 11.
Pressure response of brake chamber under the control of step charging and step releasing of ABS pressure regulator. (a) Pressure response of step charging; (b) pressure response of step releasing.
Figure 11.
Pressure response of brake chamber under the control of step charging and step releasing of ABS pressure regulator. (a) Pressure response of step charging; (b) pressure response of step releasing.
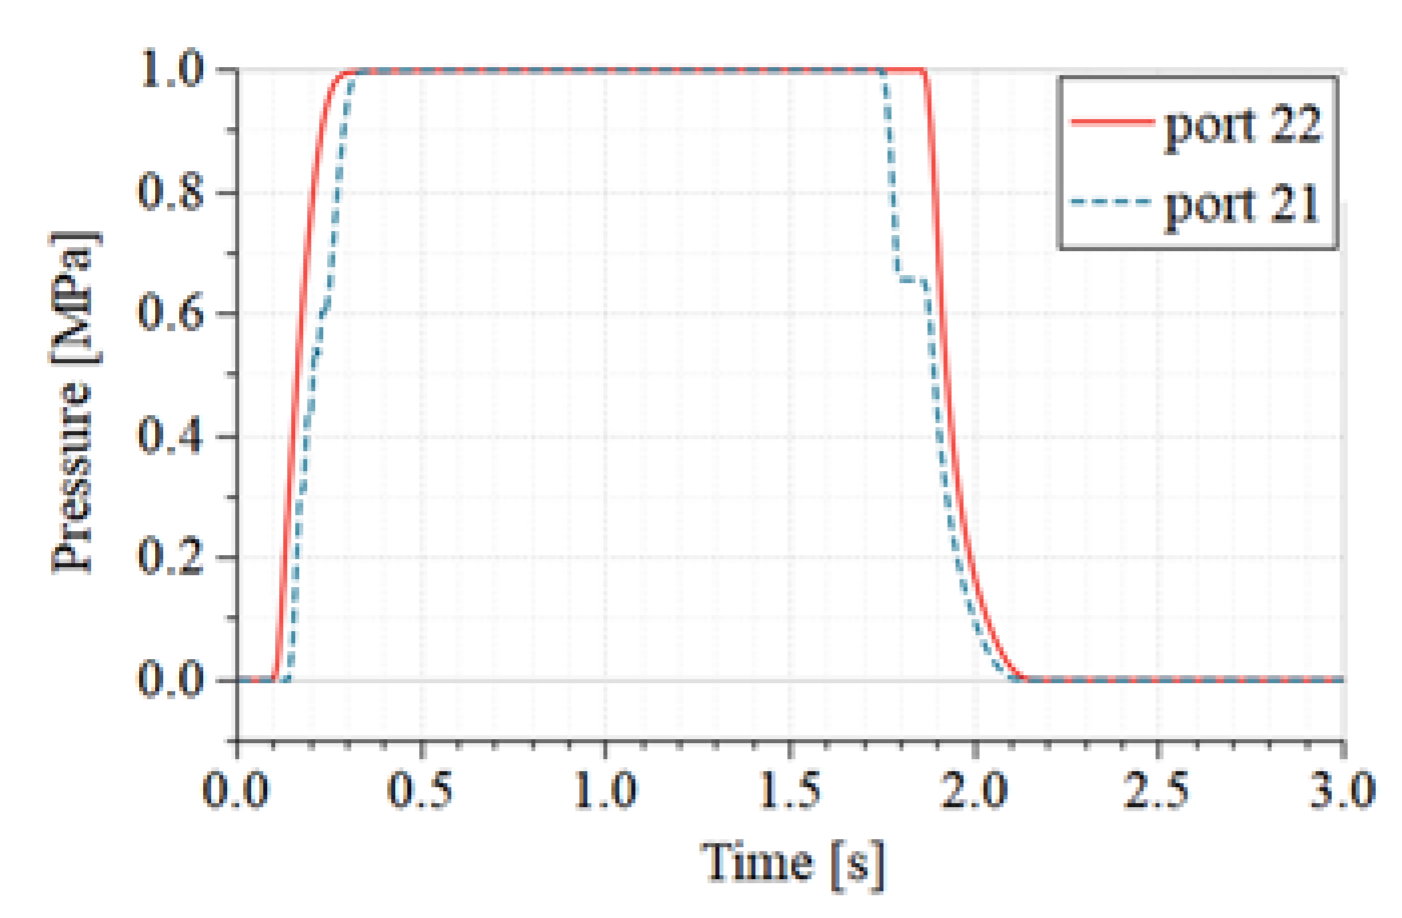
Figure 12.
Characteristic curves of series dual-chamber air brake valve. The port 21 is connected to the relay valve control port. The port 22 is connected to the front ABS pressure regulators’ inlets.
Figure 12.
Characteristic curves of series dual-chamber air brake valve. The port 21 is connected to the relay valve control port. The port 22 is connected to the front ABS pressure regulators’ inlets.
Figure 13.
Characteristic curves of the relay valve. (a) Pressure of the control port and the outlet port; (b) relationship of the outlet pressure and control pressure. Port 2 is the outlet port. Port 4 is the control port.
Figure 13.
Characteristic curves of the relay valve. (a) Pressure of the control port and the outlet port; (b) relationship of the outlet pressure and control pressure. Port 2 is the outlet port. Port 4 is the control port.
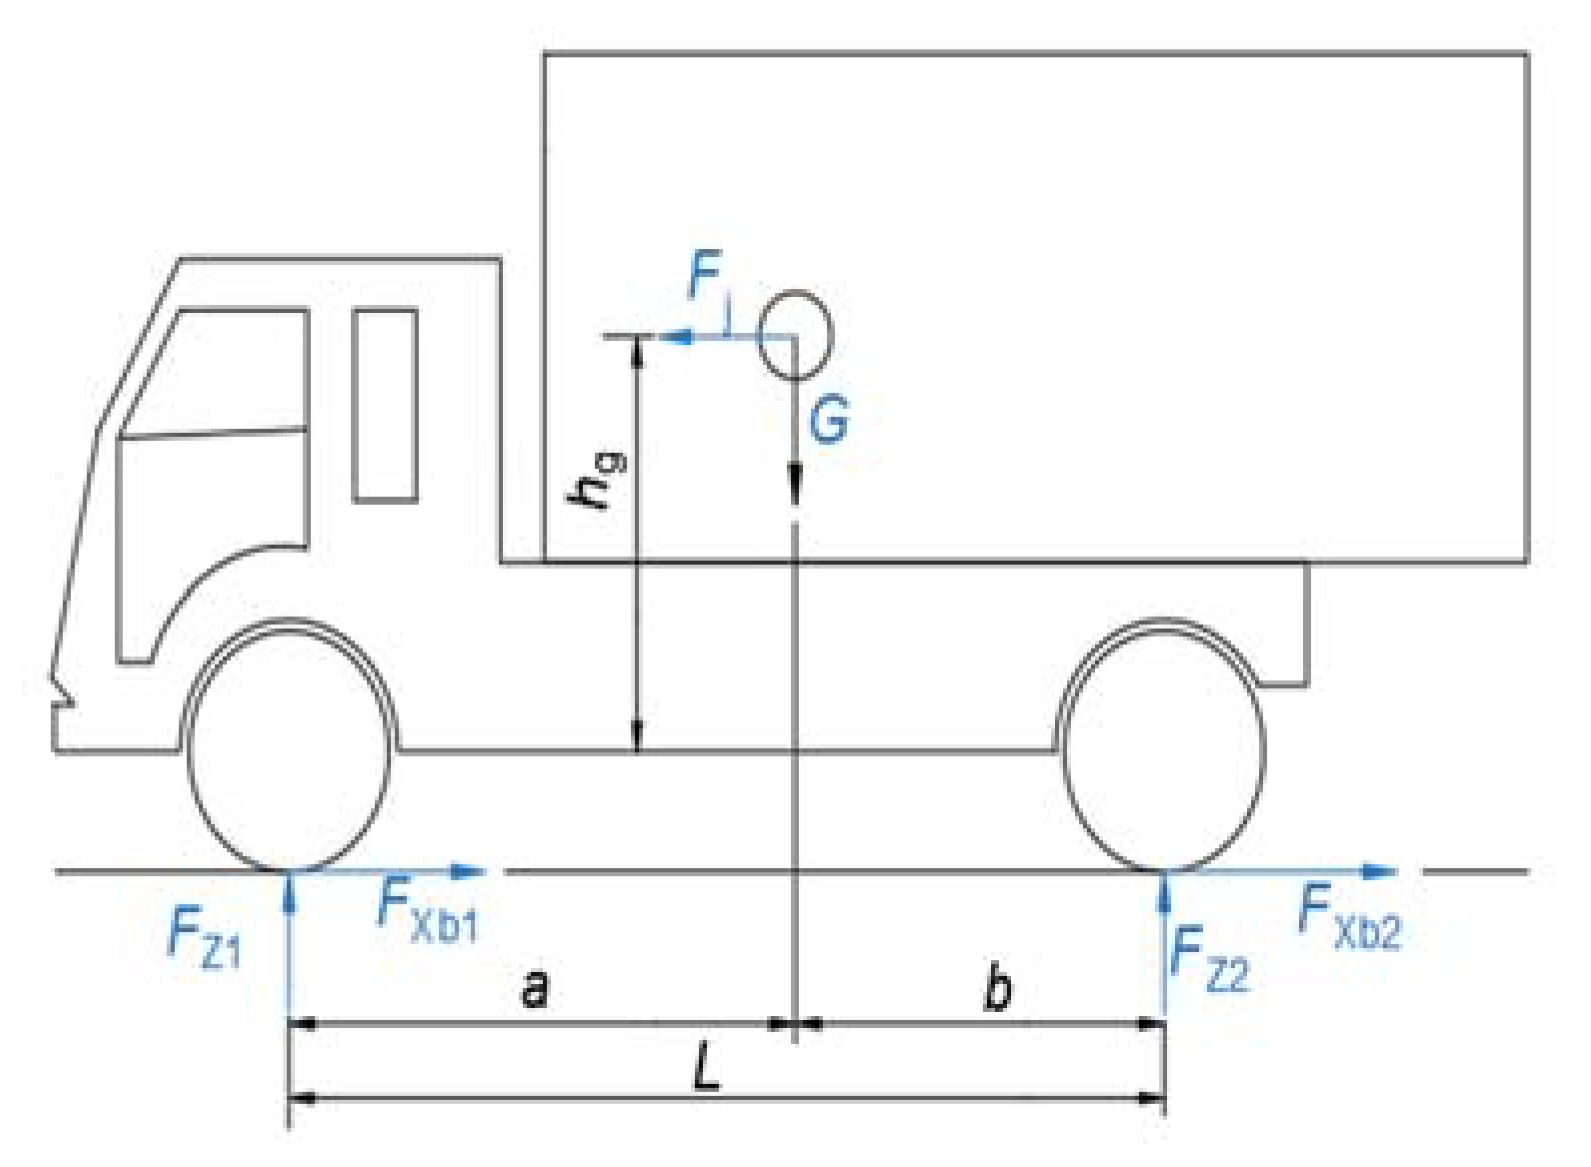
Figure 14.
Force diagram of the vehicle braking condition.
Figure 14.
Force diagram of the vehicle braking condition.
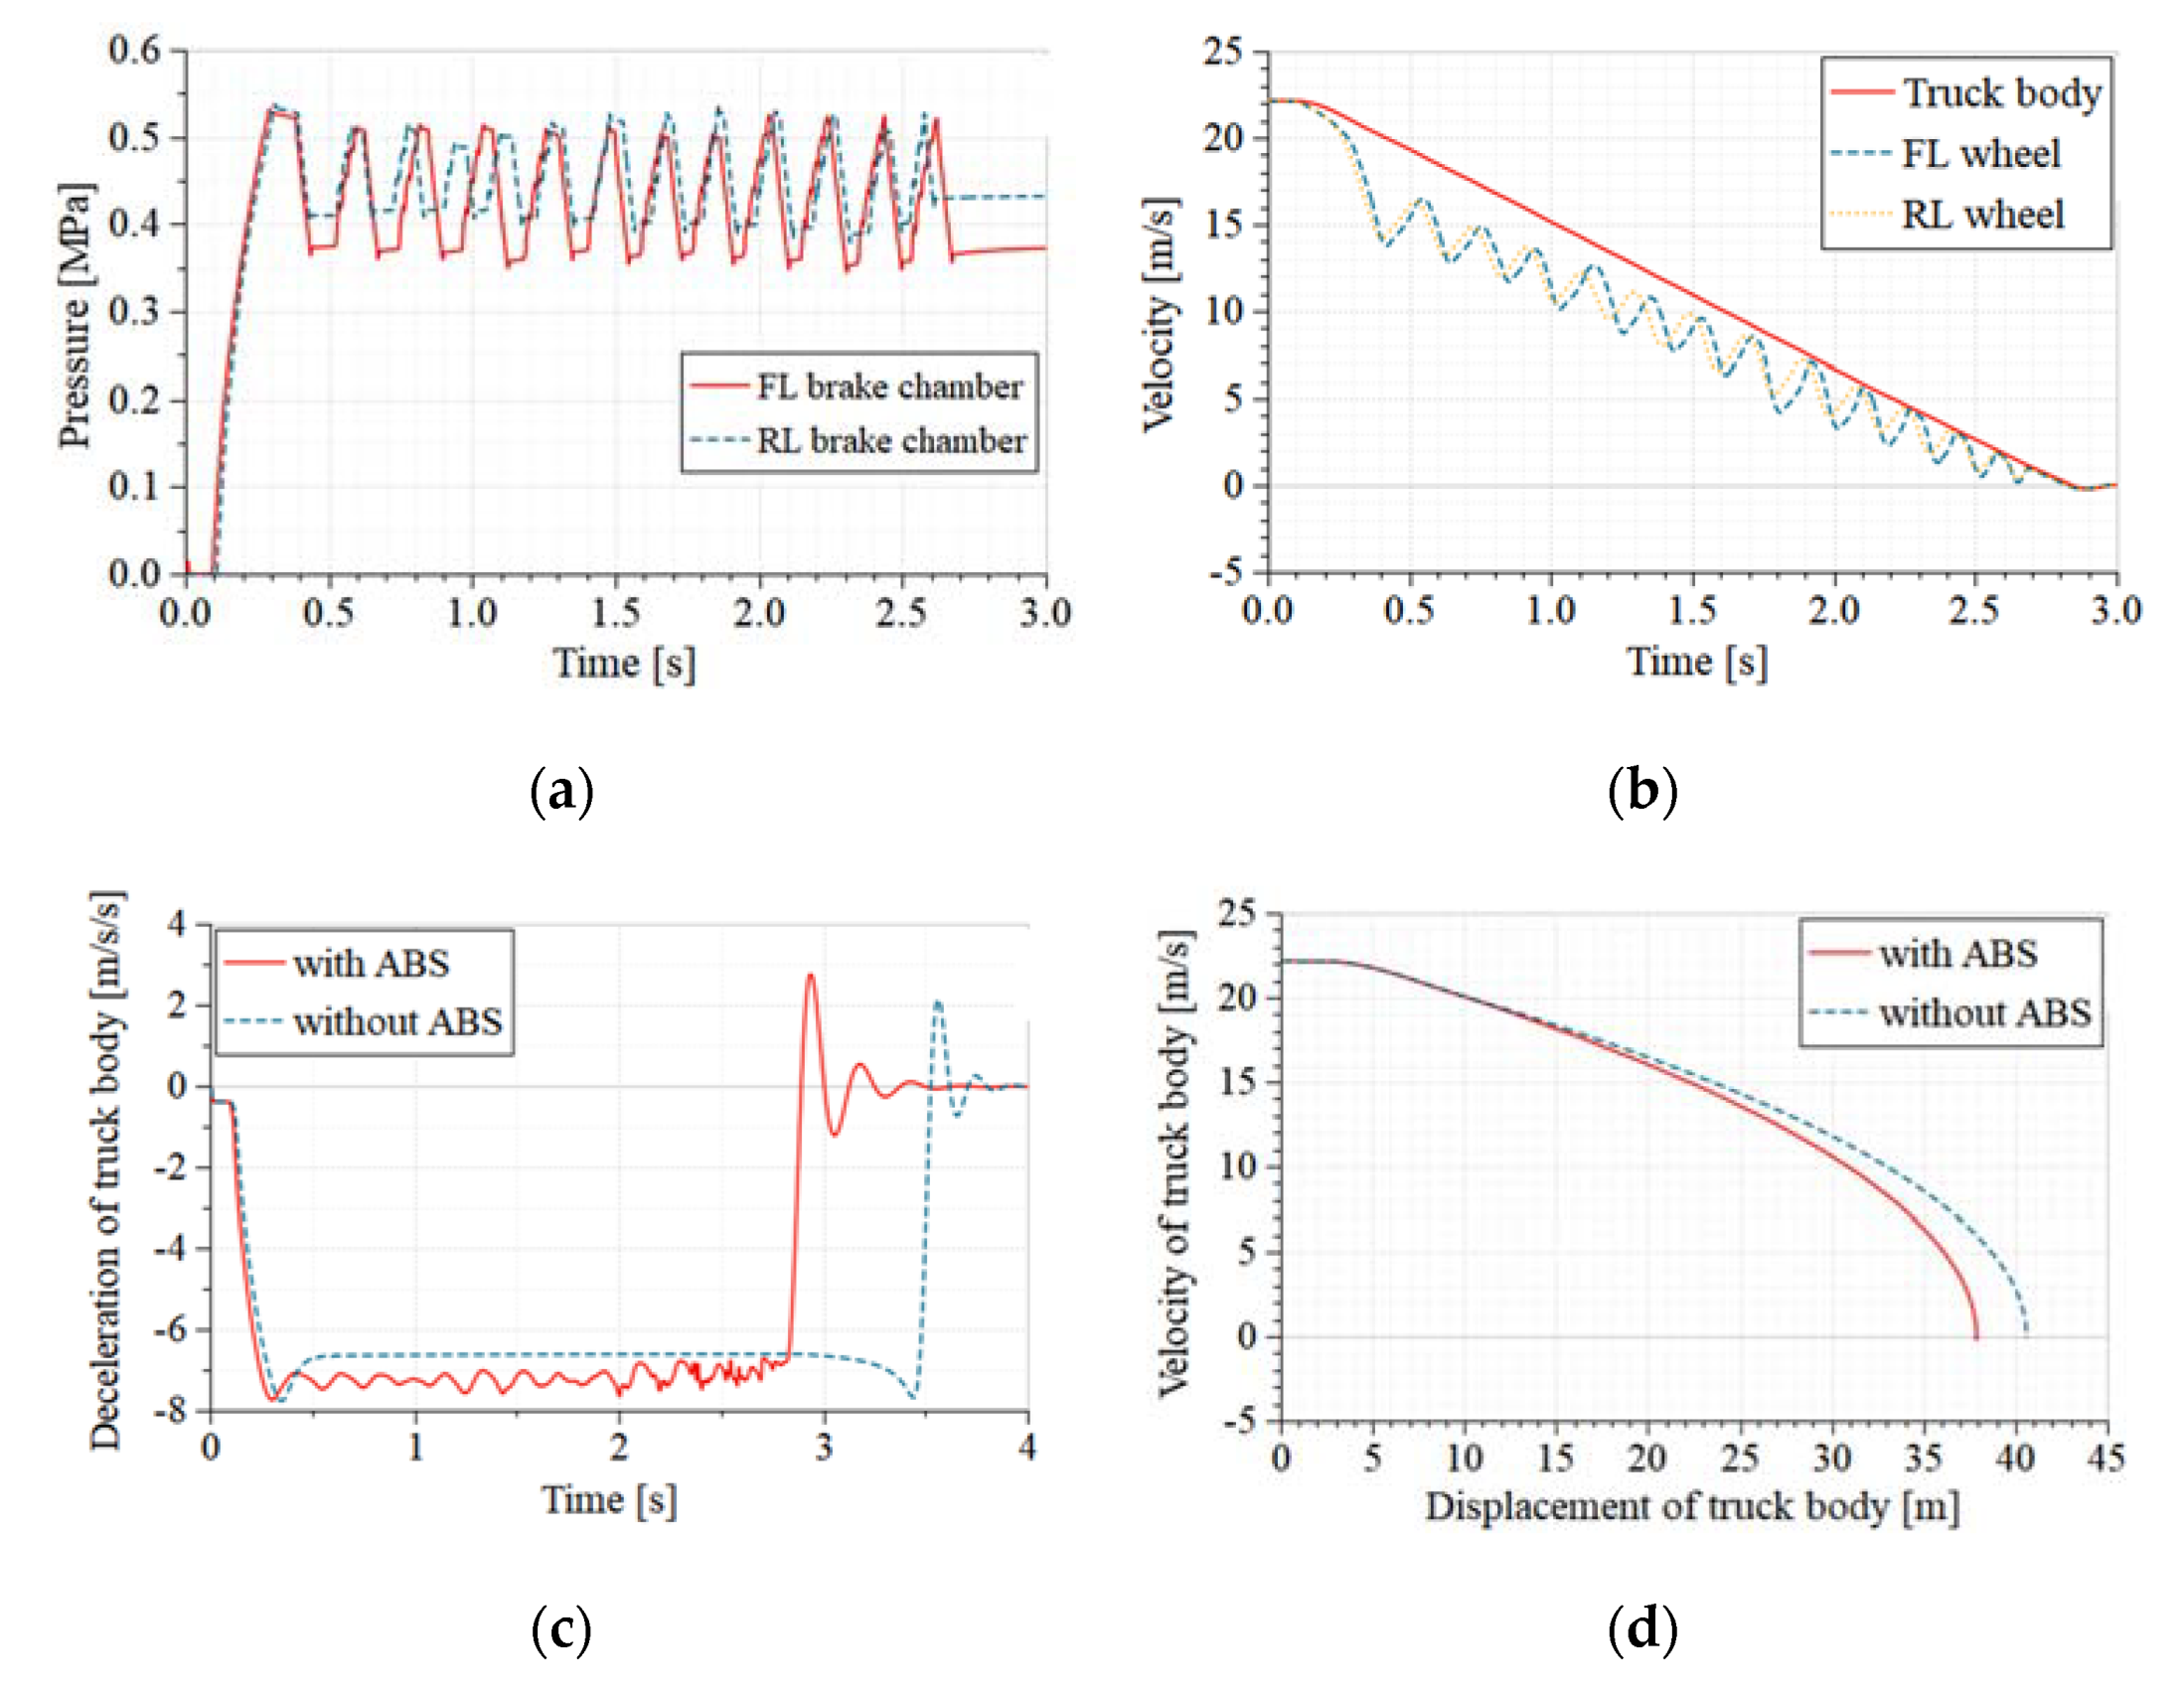
Figure 15.
Braking characteristics on the road with the adhesion coefficient 0.8. (a) Pressure of brake chamber; (b) velocity of truck body and wheels; (c) deceleration of truck body with ABS and without ABS; (d) velocity-displacement curves of truck body with ABS and without ABS.
Figure 15.
Braking characteristics on the road with the adhesion coefficient 0.8. (a) Pressure of brake chamber; (b) velocity of truck body and wheels; (c) deceleration of truck body with ABS and without ABS; (d) velocity-displacement curves of truck body with ABS and without ABS.
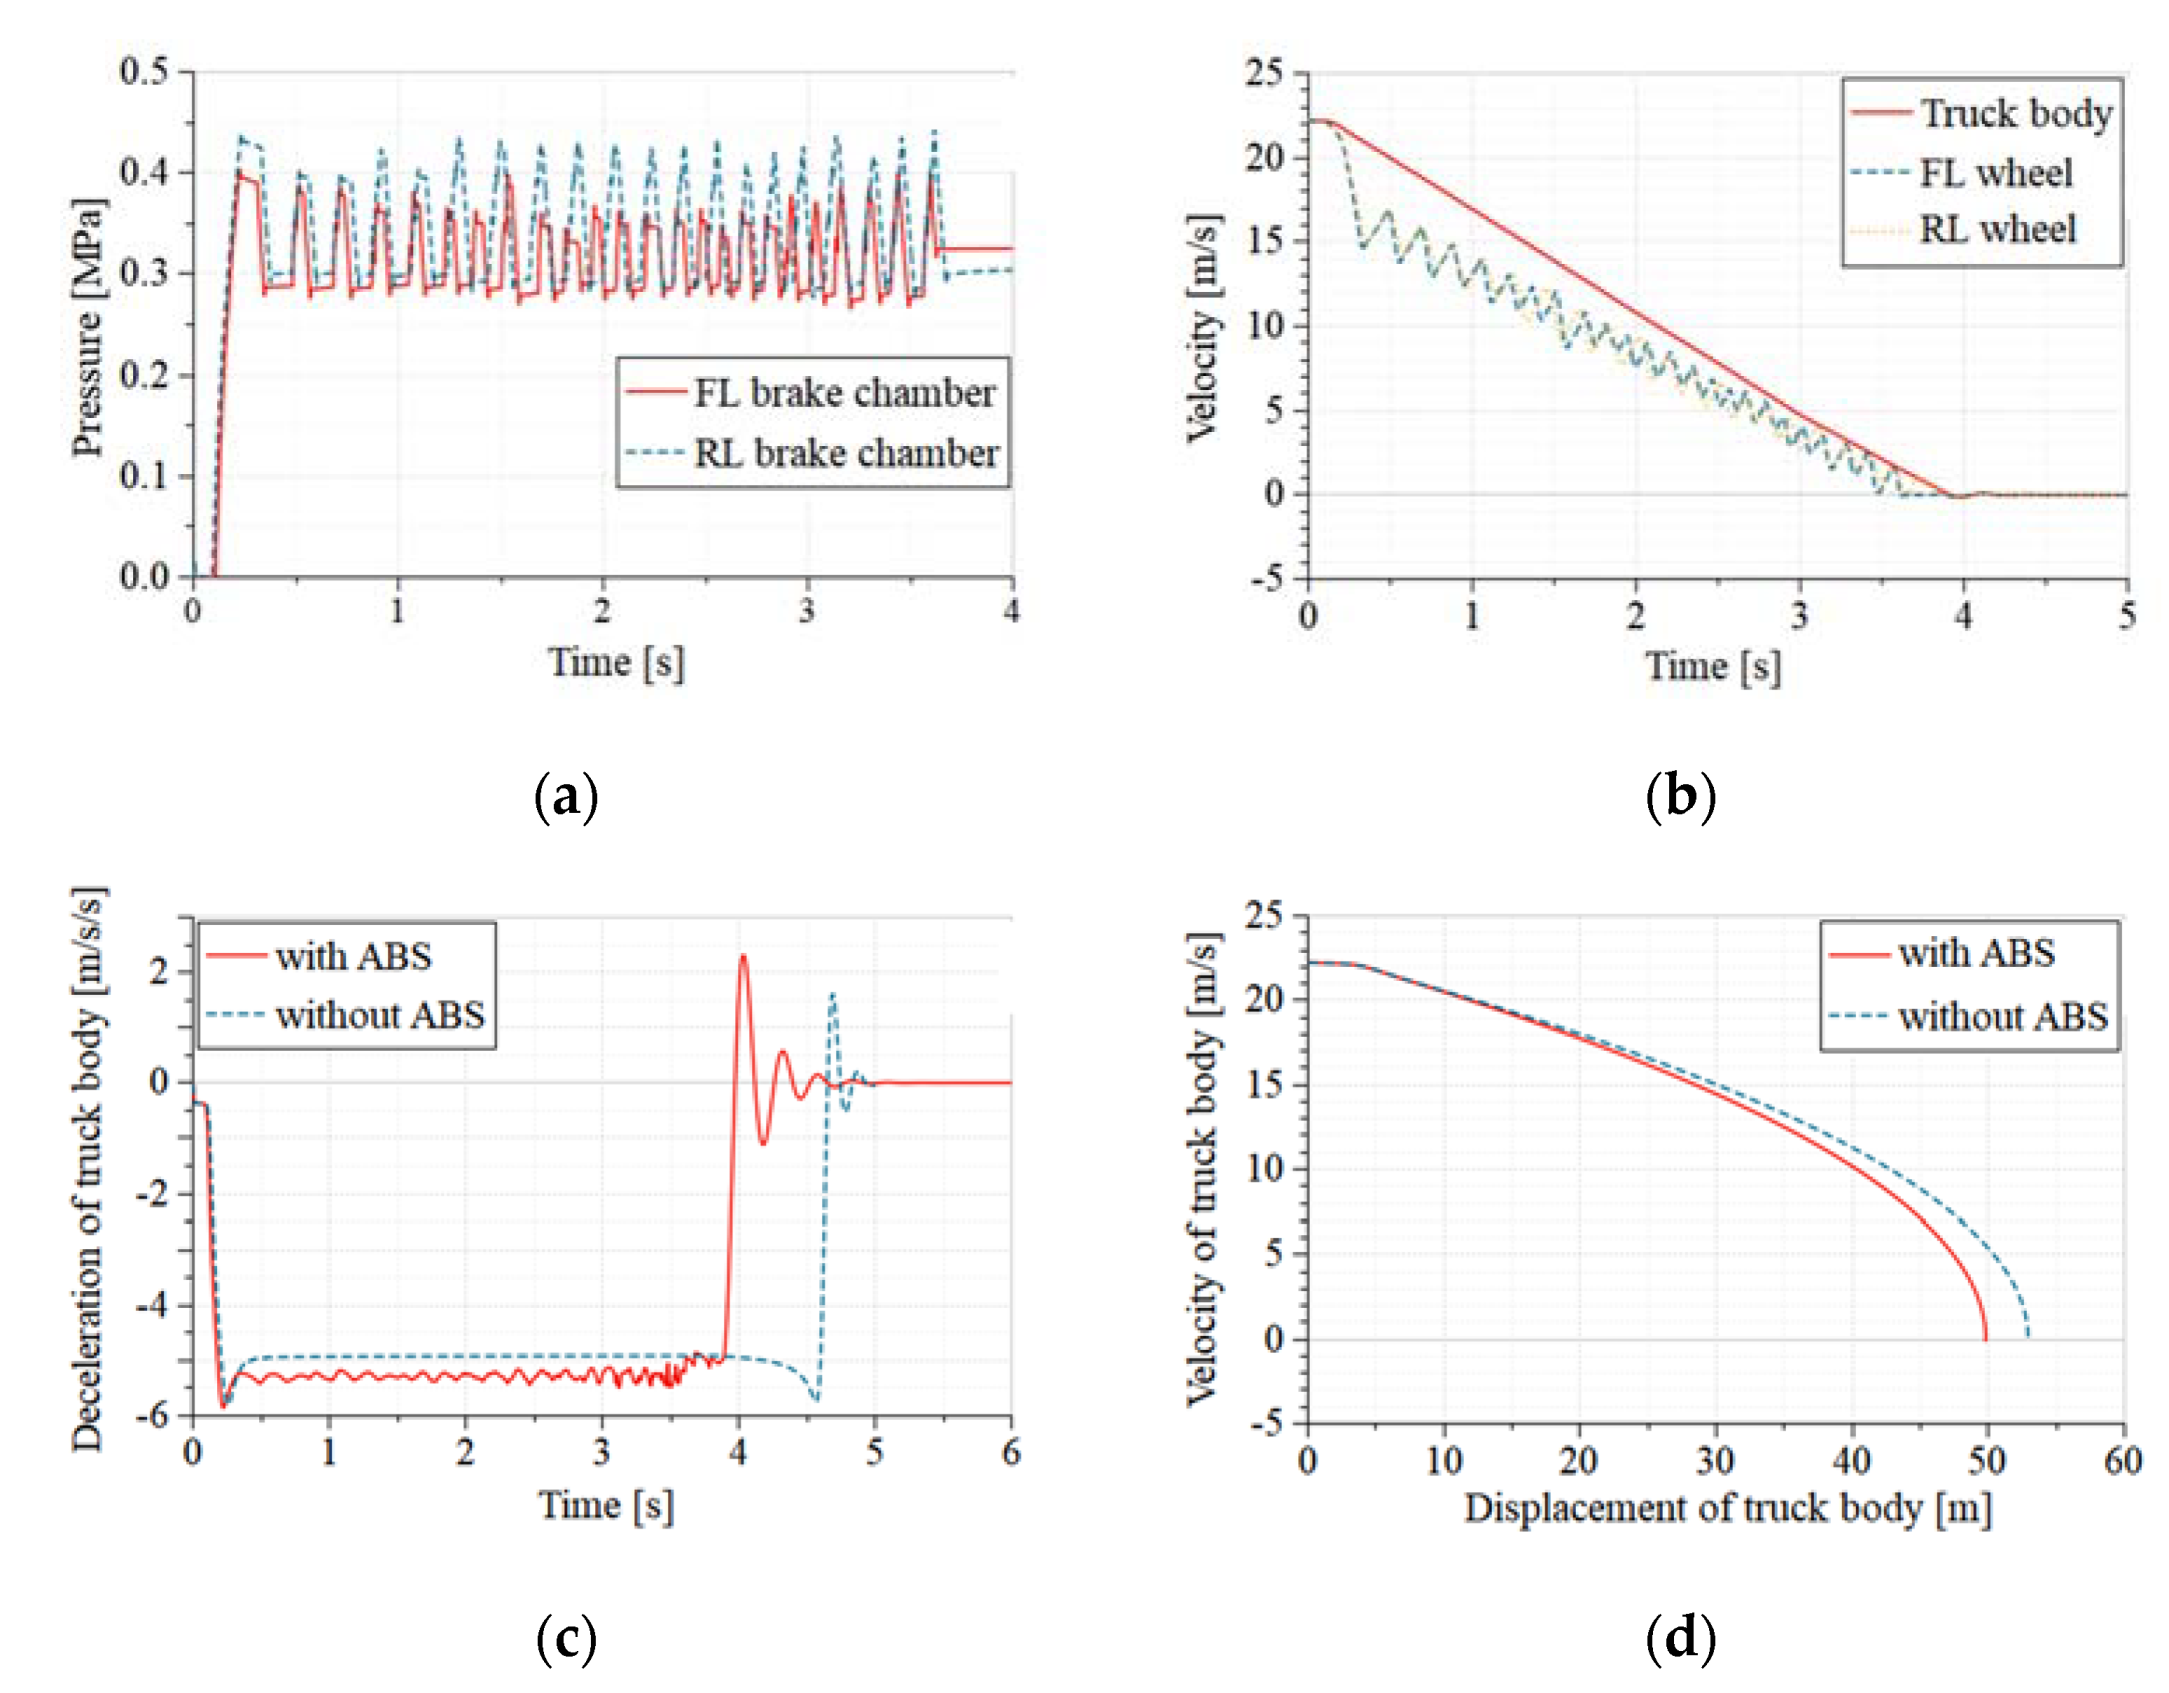
Figure 16.
Braking characteristics on the road with adhesion coefficient 0.6. (a) Pressure of brake chamber; (b) velocity of truck body and wheels; (c) deceleration of truck body with ABS and without ABS; (d) velocity-displacement curves of truck body with ABS and without ABS.
Figure 16.
Braking characteristics on the road with adhesion coefficient 0.6. (a) Pressure of brake chamber; (b) velocity of truck body and wheels; (c) deceleration of truck body with ABS and without ABS; (d) velocity-displacement curves of truck body with ABS and without ABS.
Figure 17.
Braking characteristics on the road with adhesion coefficient 0.2. (a) Pressure of brake chamber; (b) velocity of truck body and wheels; (c) deceleration of truck body with ABS and without ABS; (d) velocity-displacement curves of truck body with ABS and without ABS.
Figure 17.
Braking characteristics on the road with adhesion coefficient 0.2. (a) Pressure of brake chamber; (b) velocity of truck body and wheels; (c) deceleration of truck body with ABS and without ABS; (d) velocity-displacement curves of truck body with ABS and without ABS.
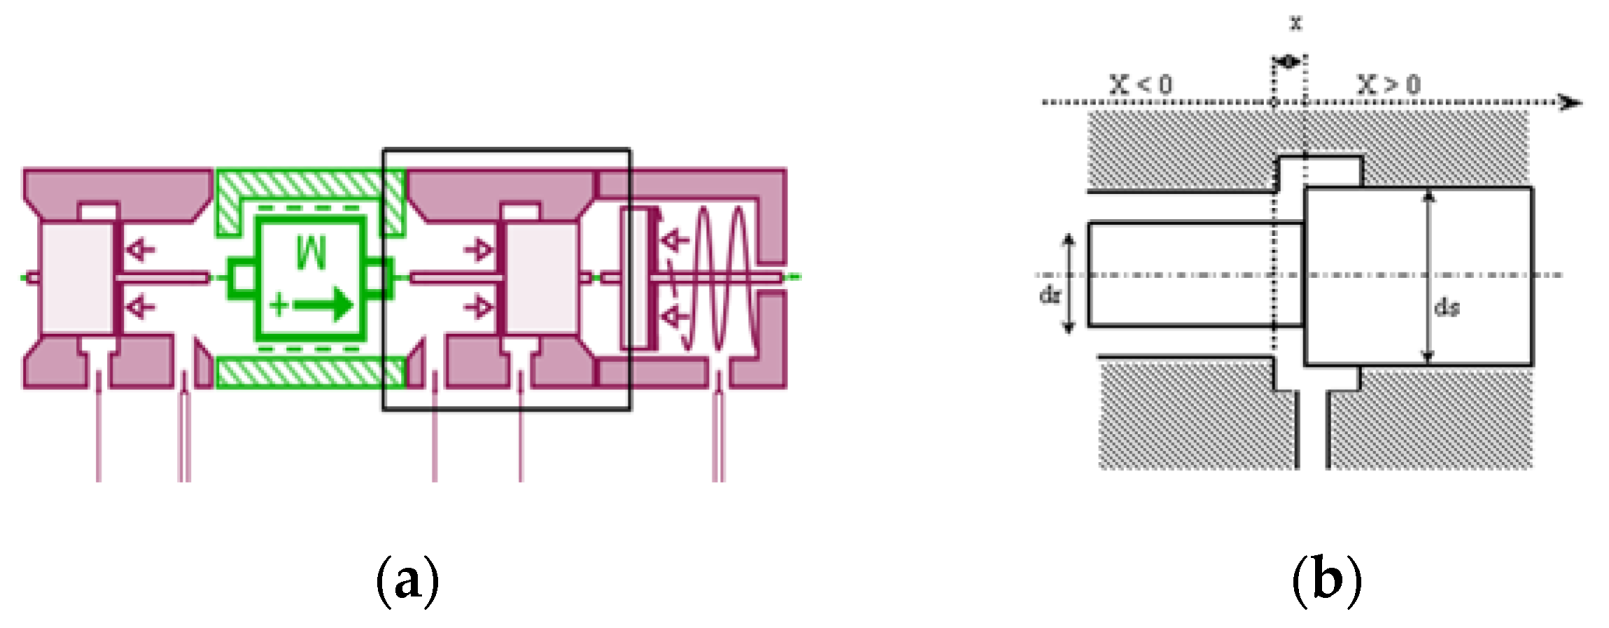
Figure 18.
AMESim submodel and structure diagram of the lower chamber of series dual-chamber air brake valve. (a) Submodel of the lower chamber of series dual-chamber air brake valve; (b) diagram of spool valve with annular orifice of PNAO001.
Figure 18.
AMESim submodel and structure diagram of the lower chamber of series dual-chamber air brake valve. (a) Submodel of the lower chamber of series dual-chamber air brake valve; (b) diagram of spool valve with annular orifice of PNAO001.
Figure 19.
AMESim submodel of relay valve and structure diagram of the component PNAP031. (a) Submodel of the relay valve; (b) structure diagram of the component PNAP031.
Figure 19.
AMESim submodel of relay valve and structure diagram of the component PNAP031. (a) Submodel of the relay valve; (b) structure diagram of the component PNAP031.
Figure 20.
AMESim submodel and structure diagram of pilot inlet and exhaust solenoid valves.
Figure 20.
AMESim submodel and structure diagram of pilot inlet and exhaust solenoid valves.
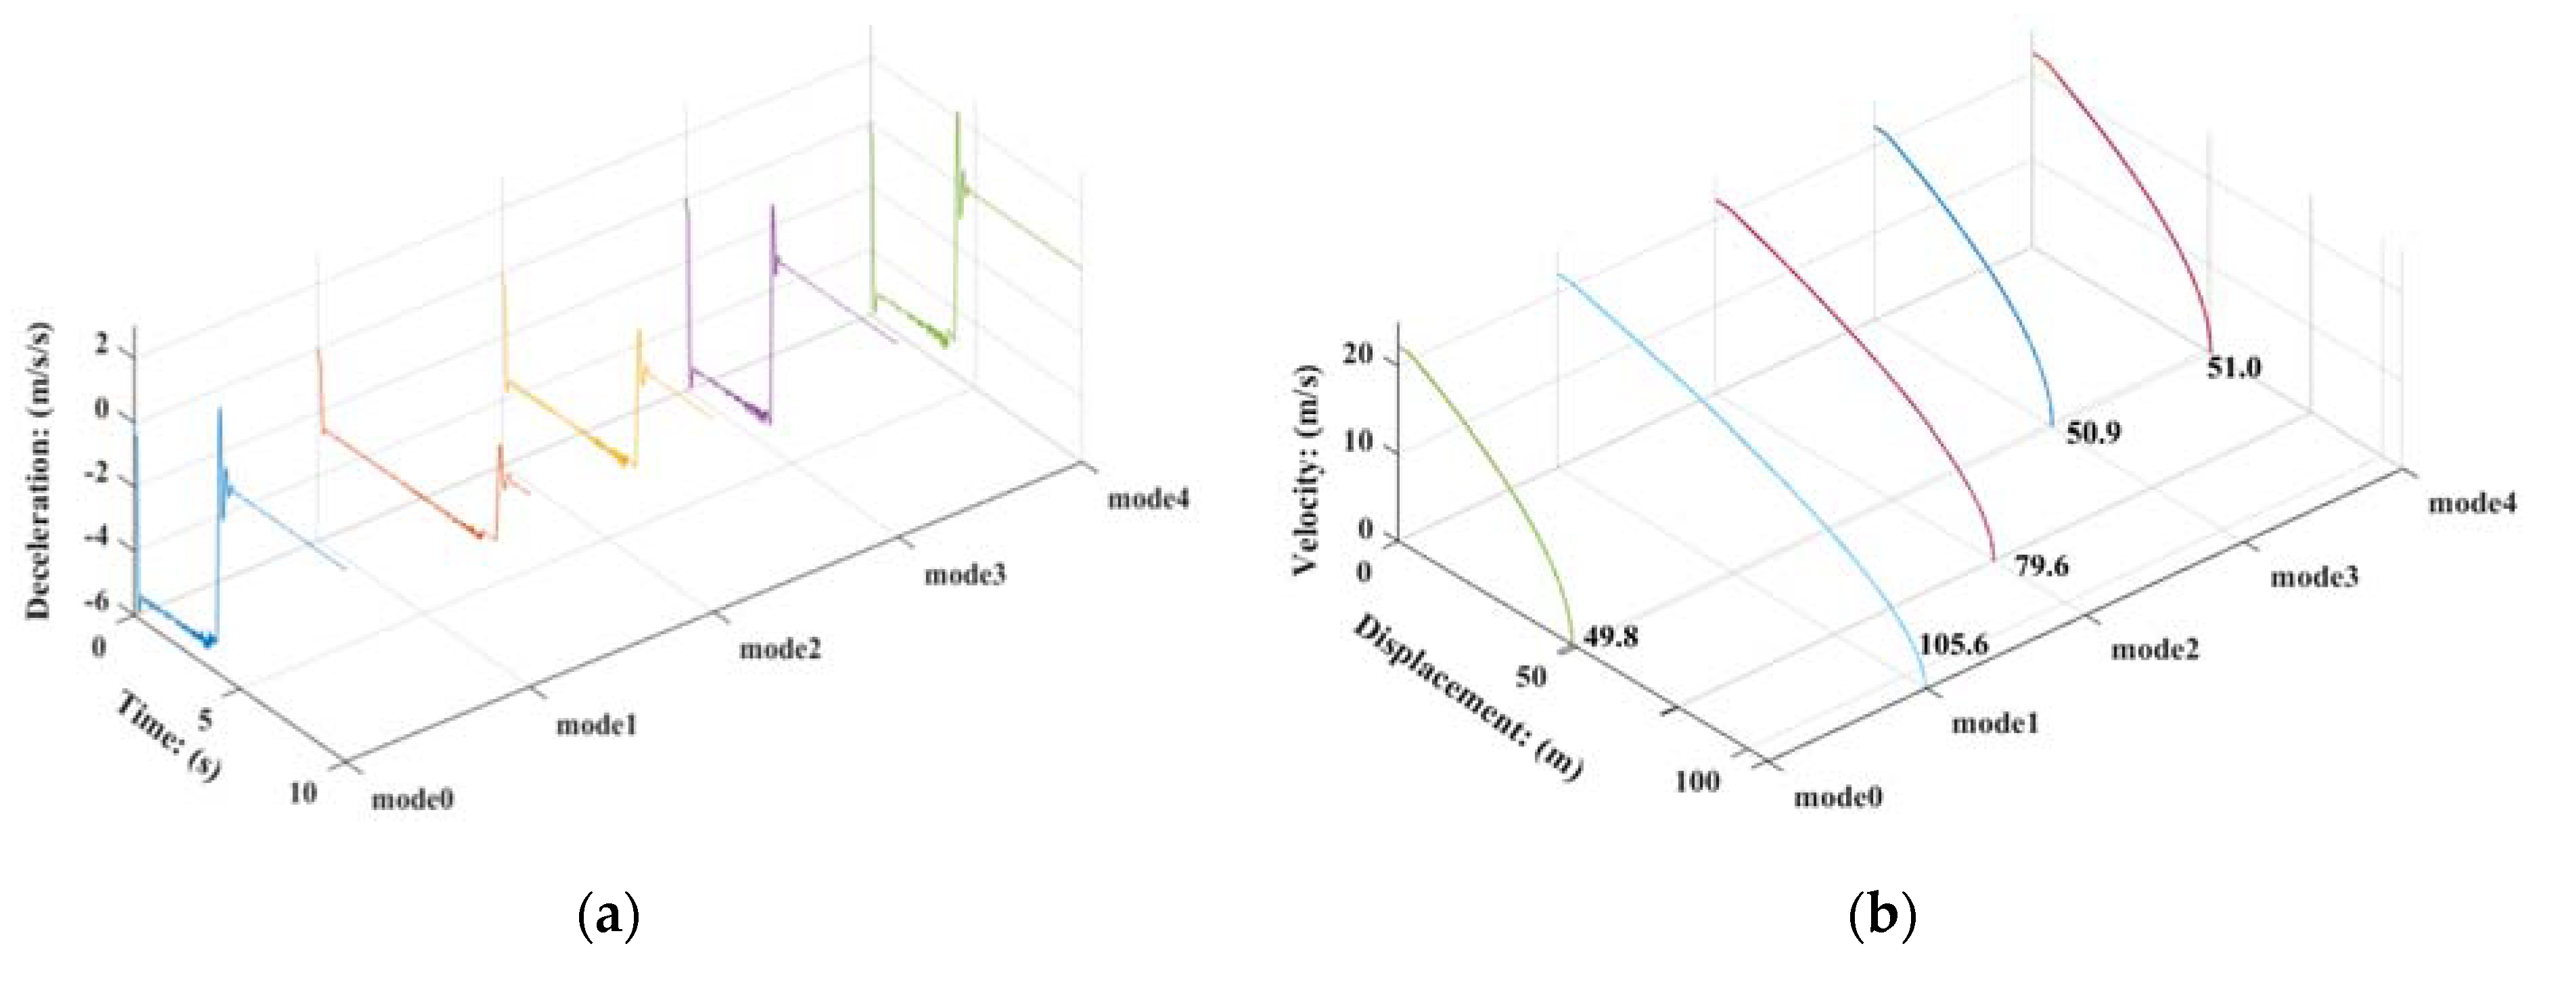
Figure 21.
Braking efficiency of mode0 and complete failure of mode1~4. (a) Deceleration of truck body; (b) velocity-displacement curves of truck body.
Figure 21.
Braking efficiency of mode0 and complete failure of mode1~4. (a) Deceleration of truck body; (b) velocity-displacement curves of truck body.
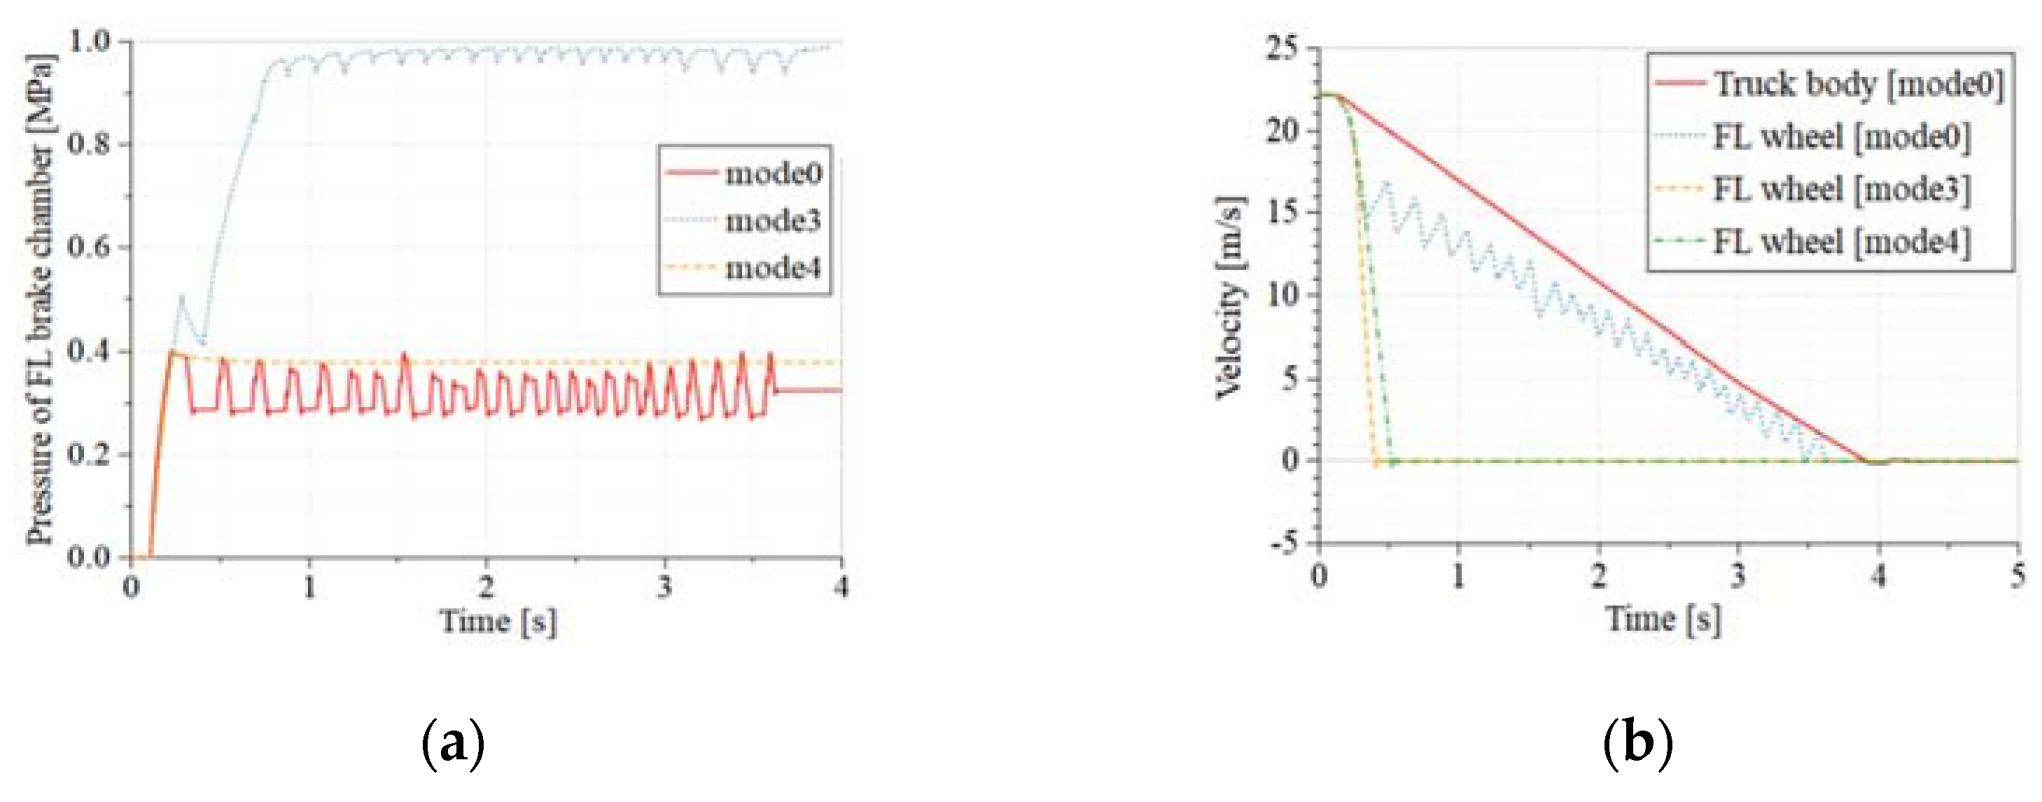
Figure 22.
(a) Pressure of brake chamber at mode0, mode3, and mode4; (b) velocity of the truck body and wheels at mode0, mode3, and mode4.
Figure 22.
(a) Pressure of brake chamber at mode0, mode3, and mode4; (b) velocity of the truck body and wheels at mode0, mode3, and mode4.
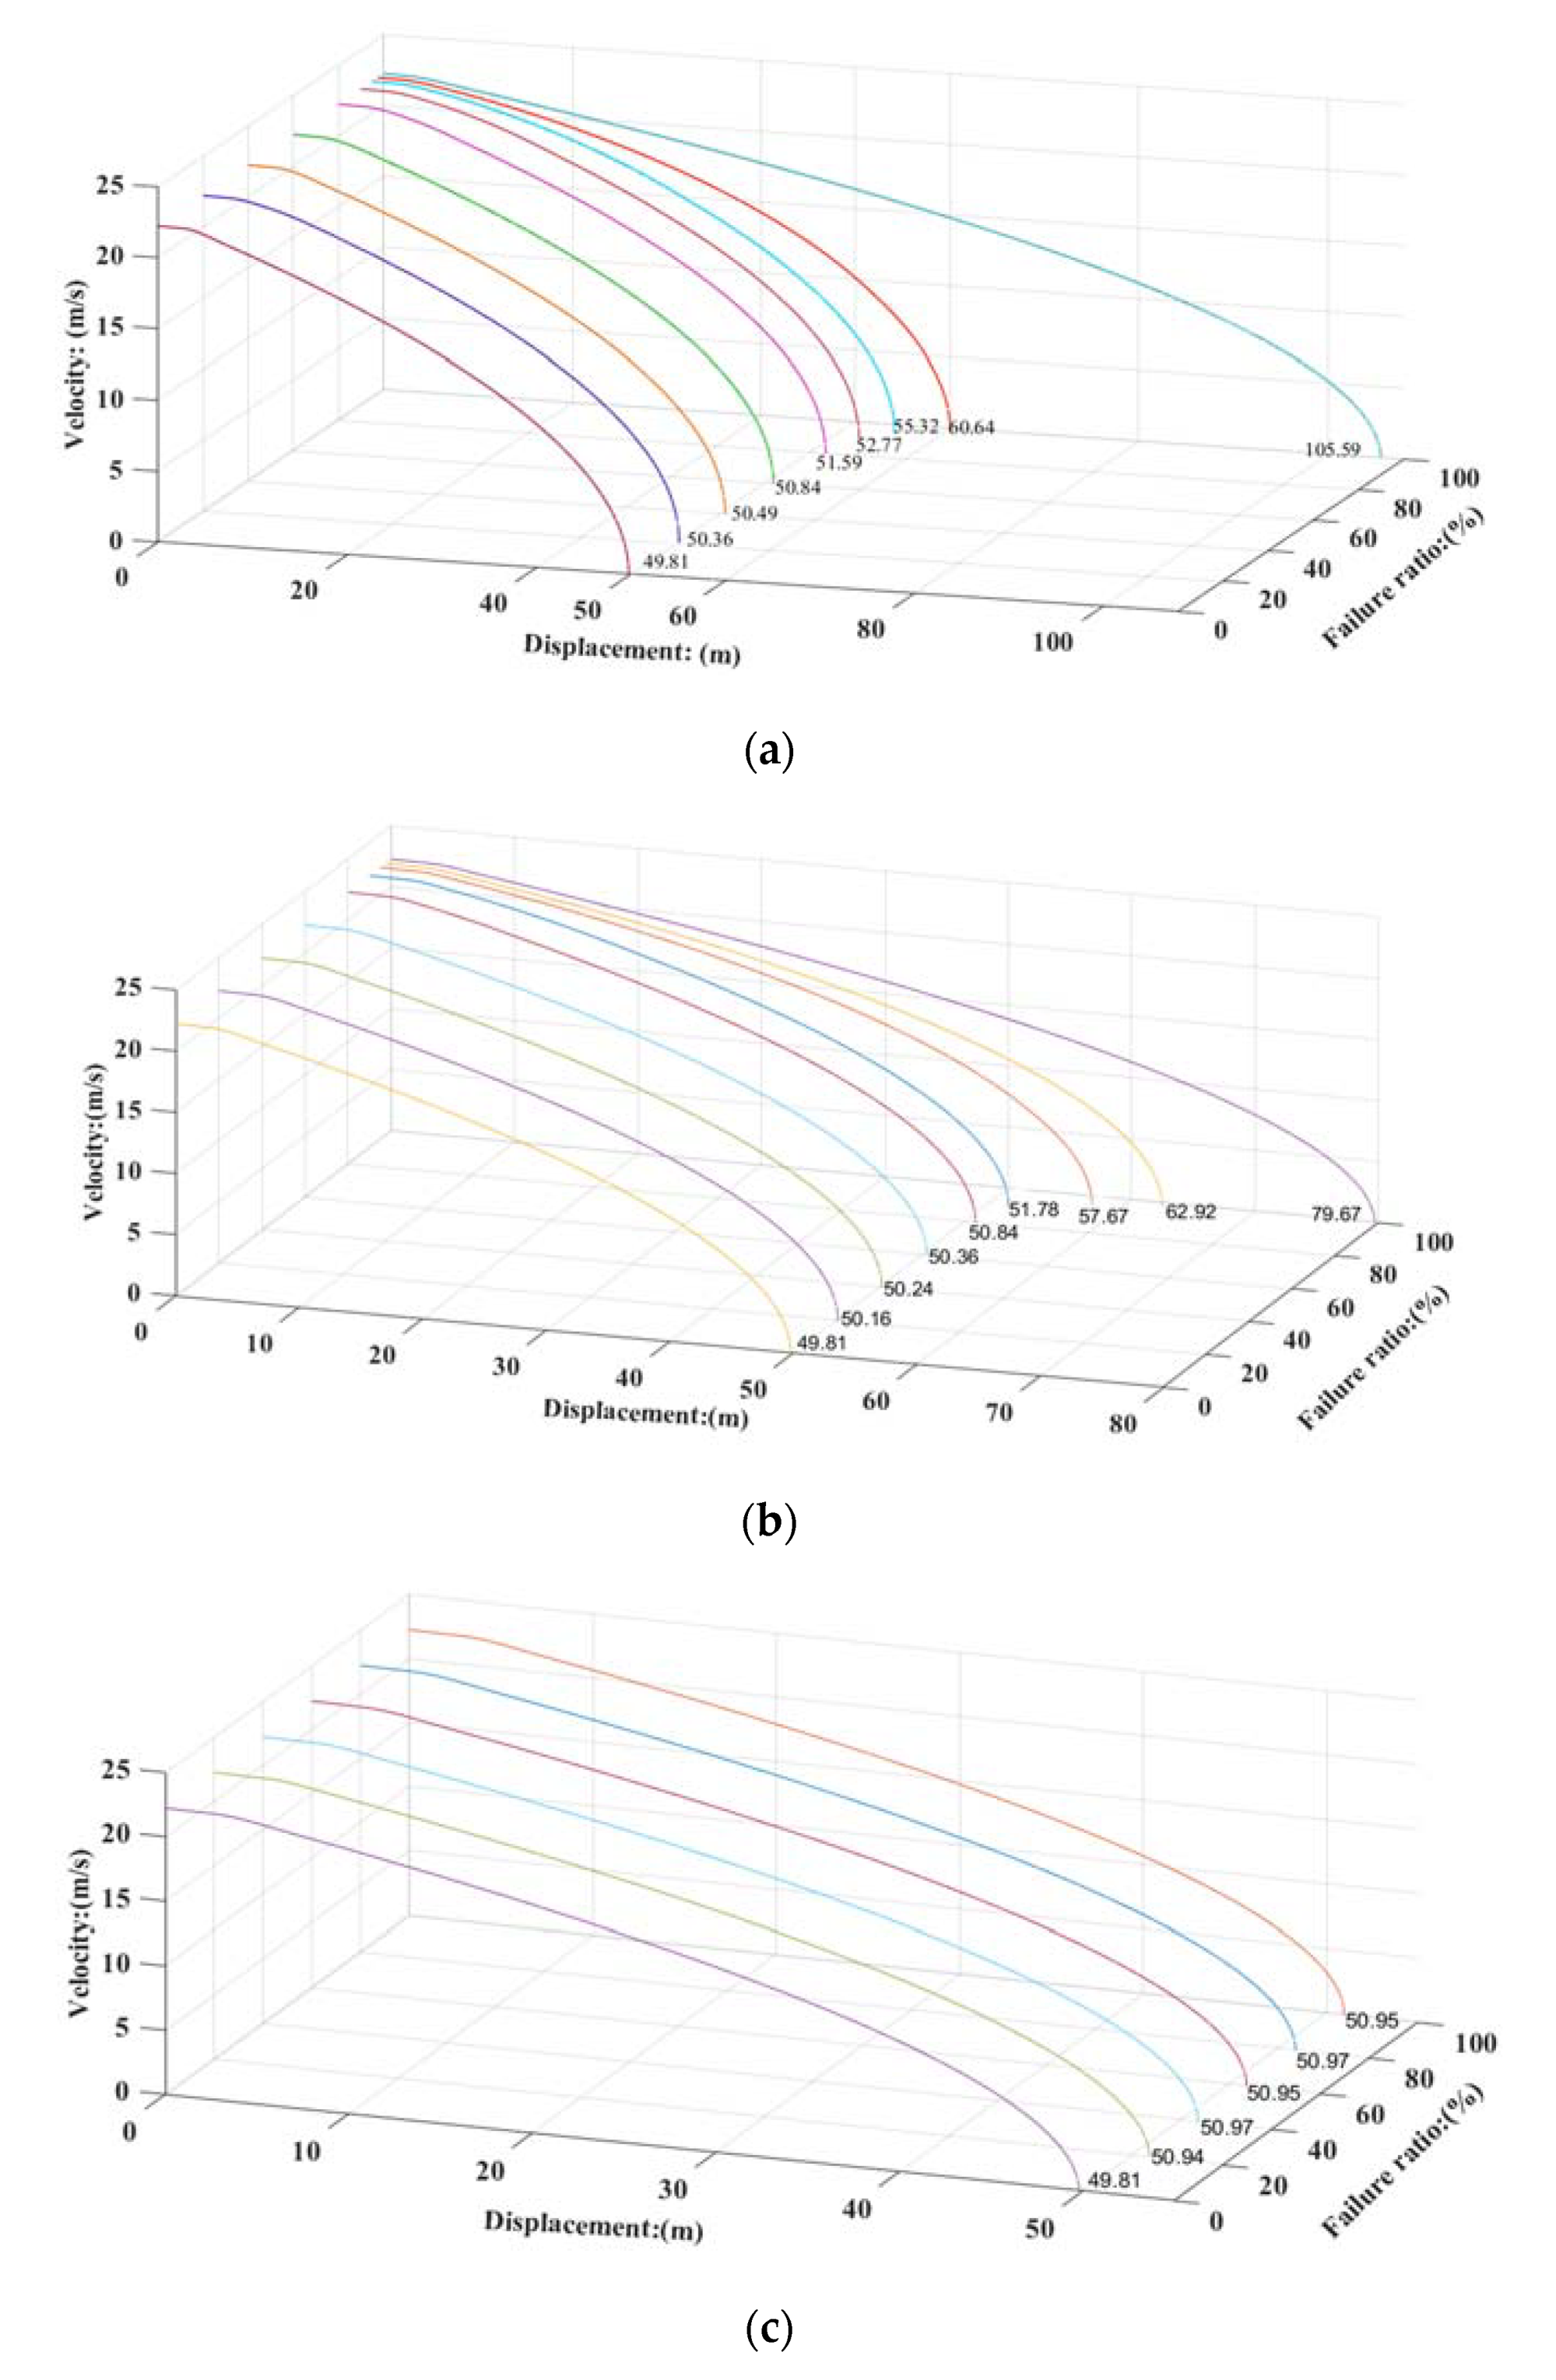
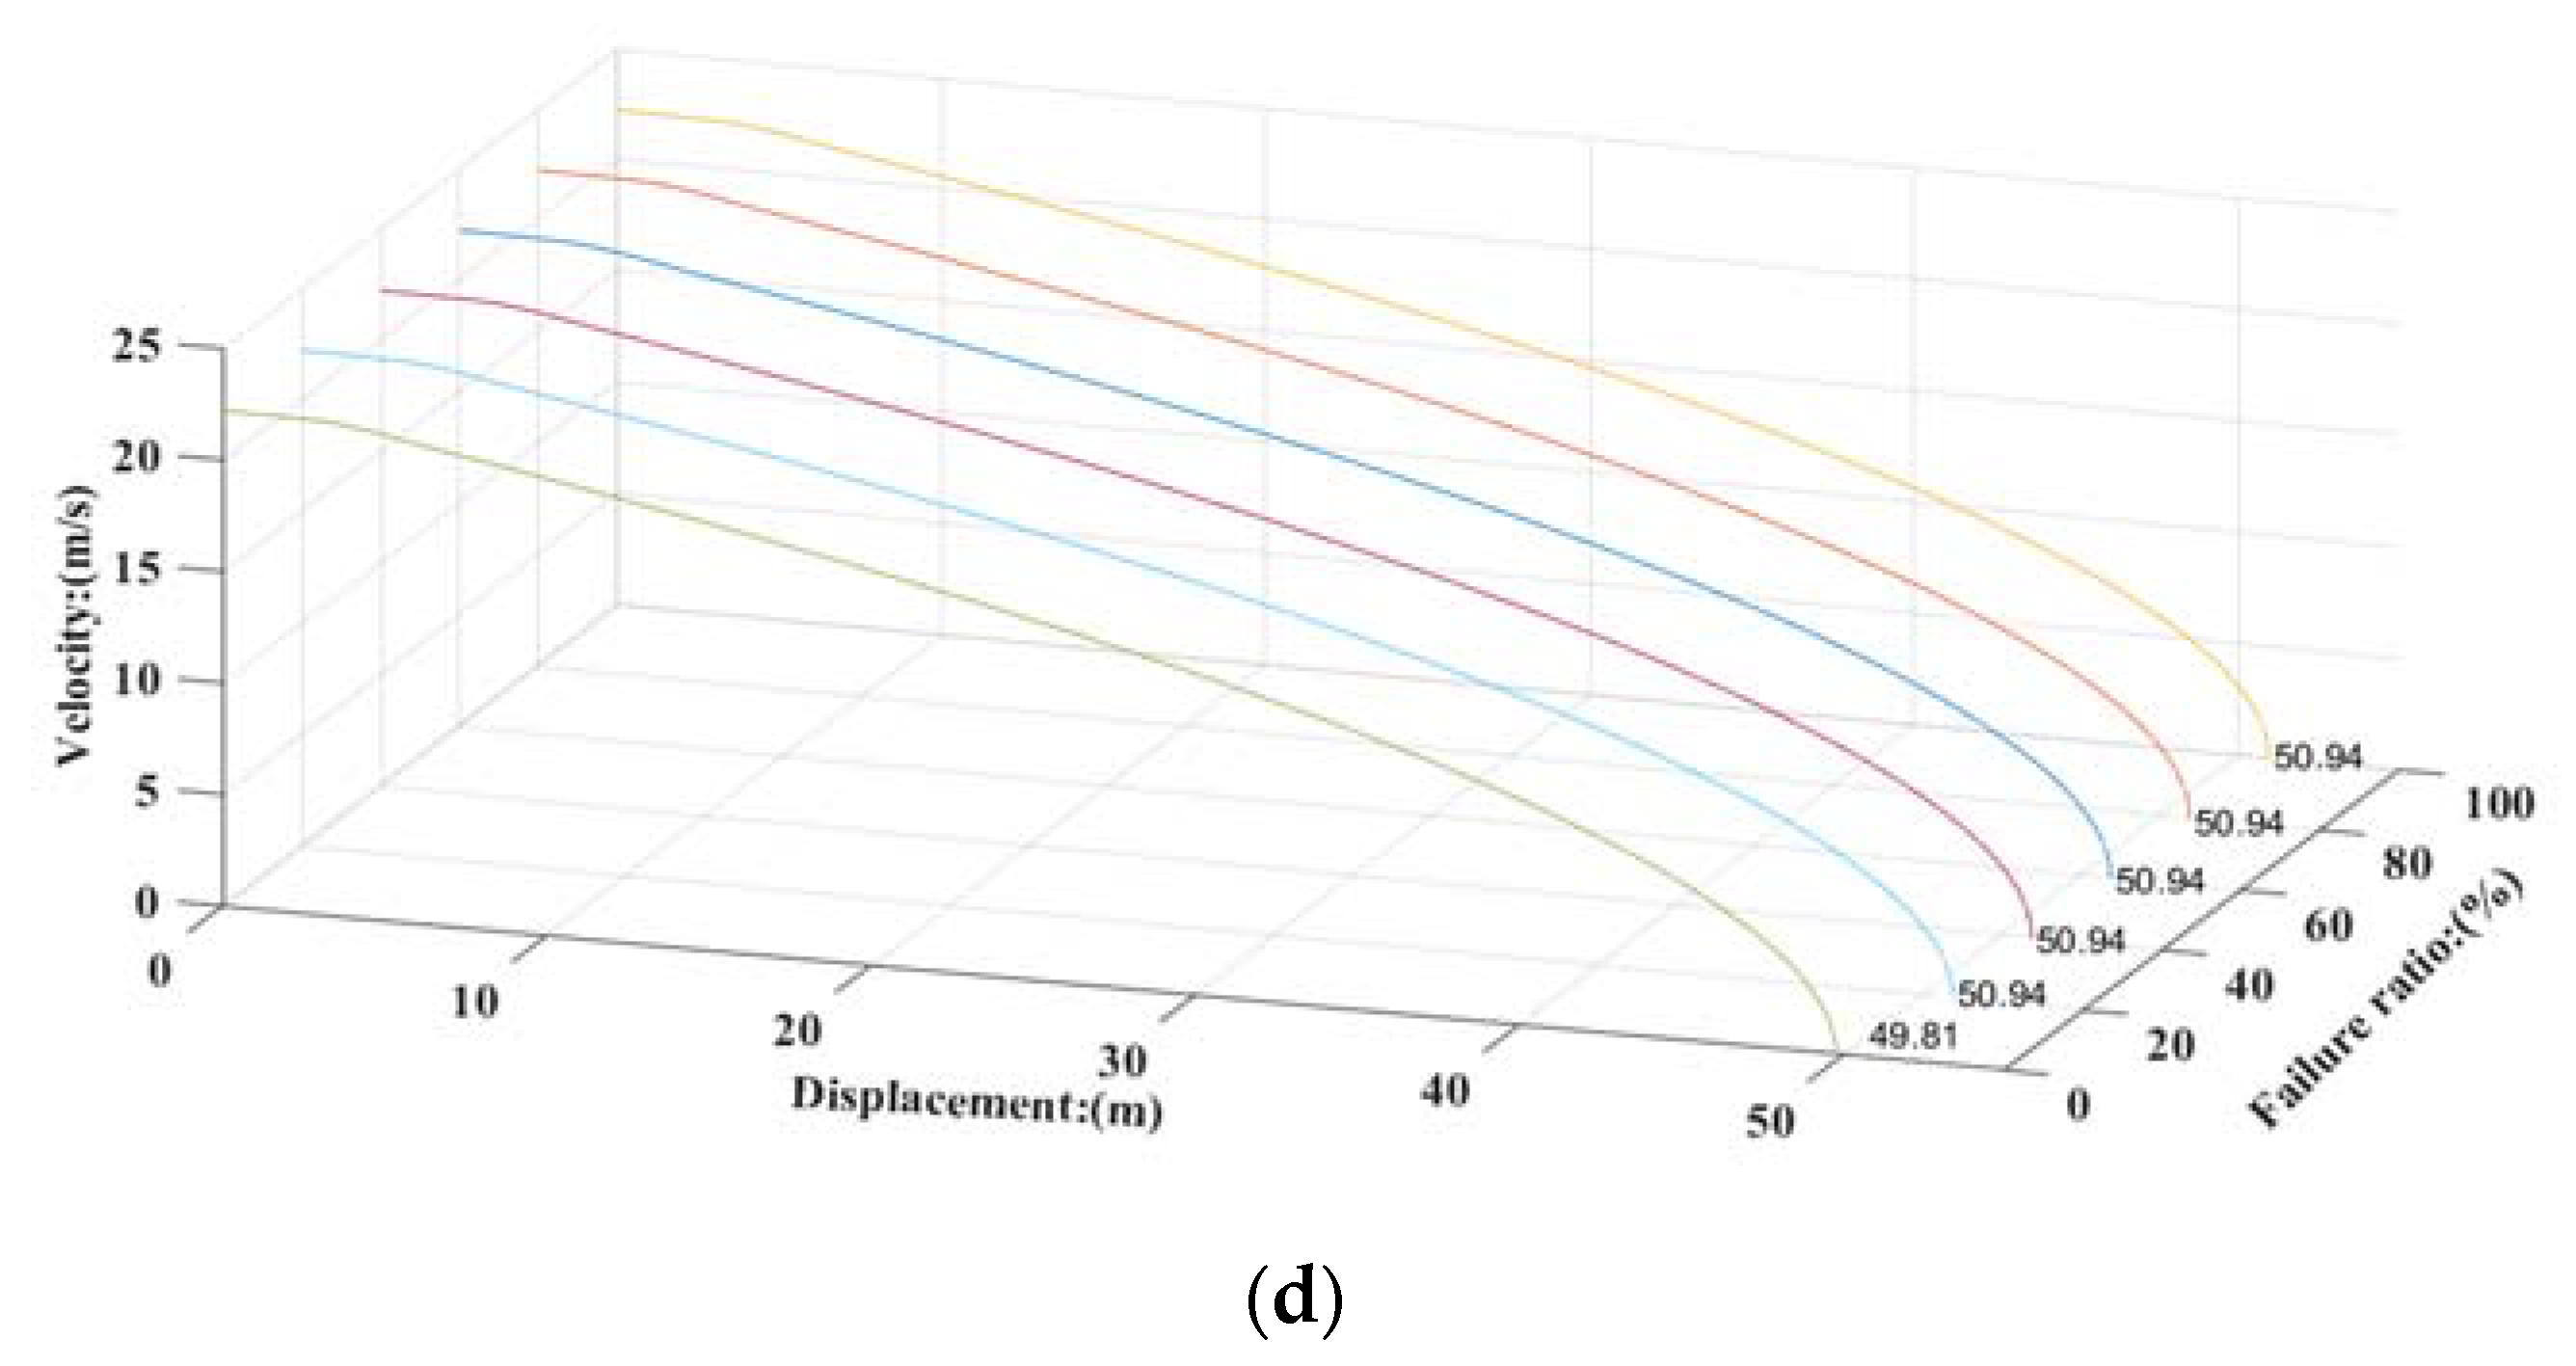
Figure 23.
Velocity-displacement curves of different failure ratios. (a) mode1; (b) mode2; (c) mode3; (d) mode4.
Figure 23.
Velocity-displacement curves of different failure ratios. (a) mode1; (b) mode2; (c) mode3; (d) mode4.
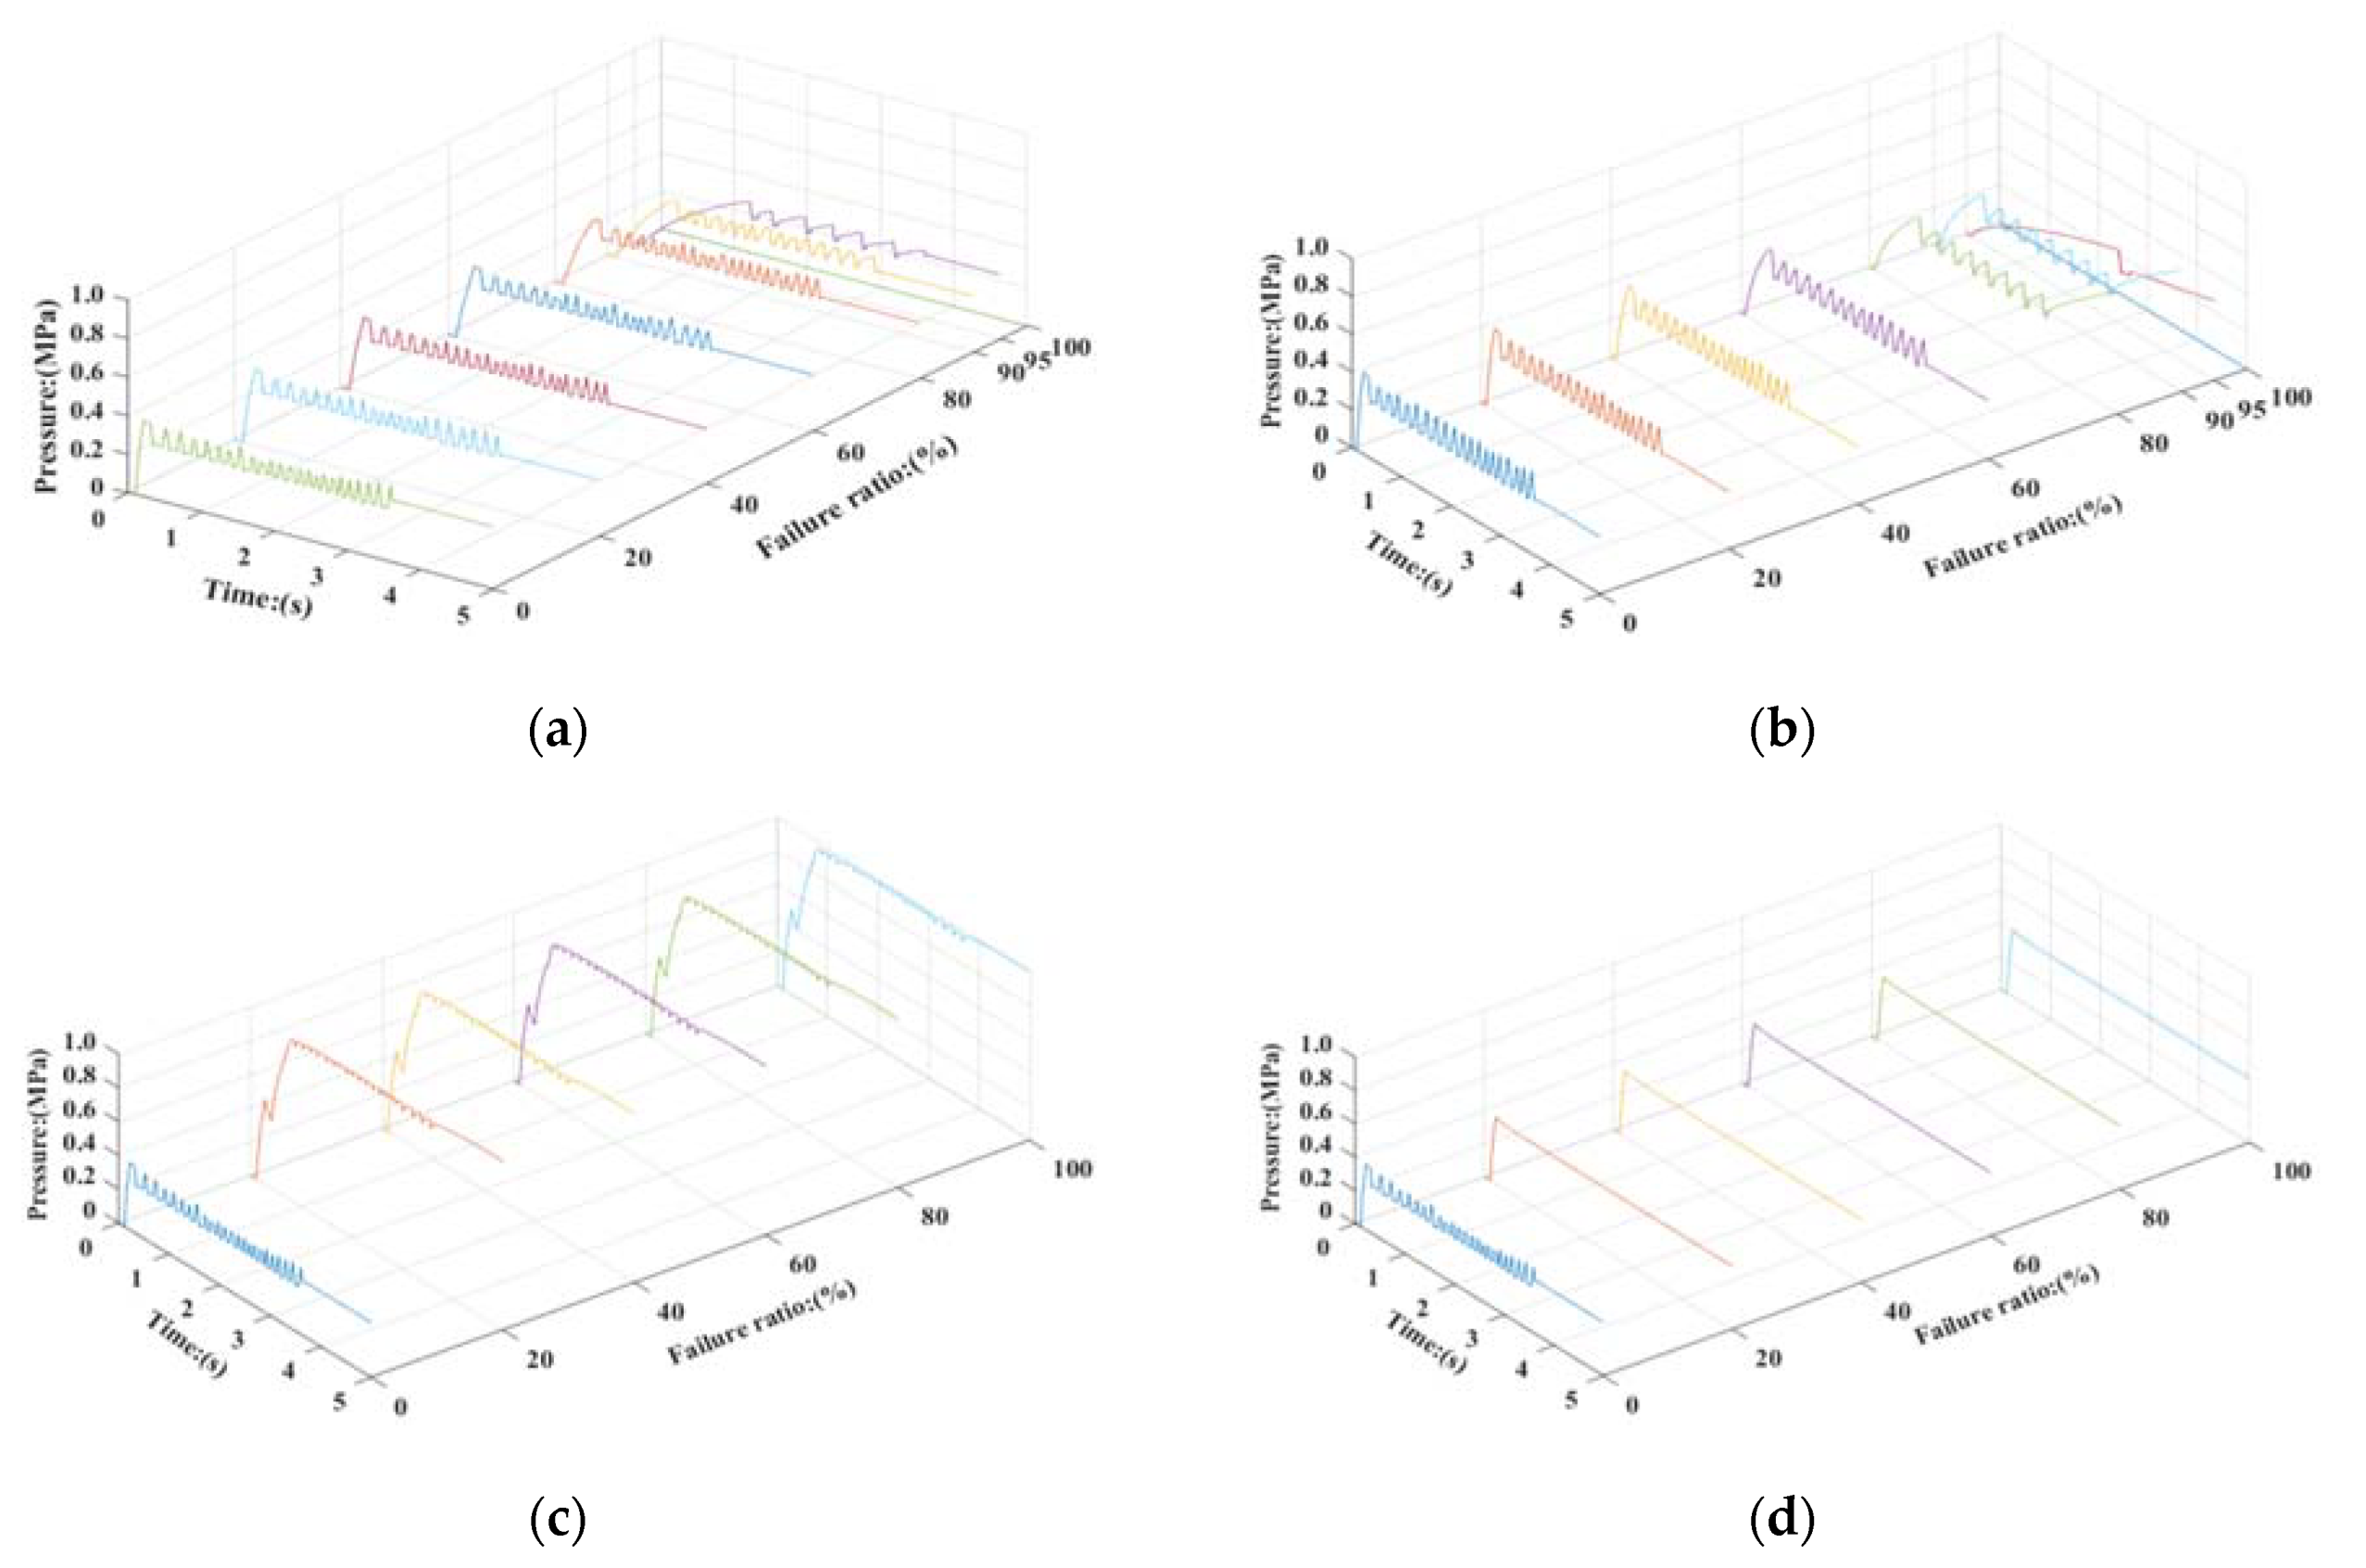
Figure 24.
Pressure of brake chamber of different failure ratios. (a) mode1(FL); (b) mode2(RL); (c) mode3(FL); (d) mode4(FL).
Figure 24.
Pressure of brake chamber of different failure ratios. (a) mode1(FL); (b) mode2(RL); (c) mode3(FL); (d) mode4(FL).
Table 1.
Working states of the pneumatic ABS pressure regulator.
Table 1.
Working states of the pneumatic ABS pressure regulator.
| Coil of Inlet Solenoid Valve/ State of Inlet Valve | Coil of Exhaust Solenoid Valve/State of Exhaust Valve | Brake Chamber Pressure |
|---|
| power off/open | power off/close | rapid charging |
| power on/close | power on/open | rapid releasing |
| power on/close | power off/close | pressure holding |
| pause power on/cycle open and close | power off/close | step charging |
| power on/close | pause power on/cycle open and close | step releasing |
Table 2.
Comparison of the simulation and test of rapid charging process.
Table 2.
Comparison of the simulation and test of rapid charging process.
| Time(s) | 0.05 | 0.1 | 0.15 | 0.2 | 0.25 | 0.3 | 0.35 | 0.4 | 0.45 | 0.5 | 0.55 | 0.6 |
|---|
| Simulation (MPa) | 0.087 | 0.169 | 0.249 | 0.328 | 0.403 | 0.470 | 0.527 | 0.571 | 0.604 | 0.623 | 0.633 | 0.639 |
| Test (MPa) | 0.090 | 0.180 | 0.270 | 0.340 | 0.420 | 0.480 | 0.540 | 0.580 | 0.610 | 0.630 | 0.640 | 0.640 |
| Relative error(%) | 3.3 | 6.1 | 7.8 | 3.5 | 4.0 | 2.1 | 2.4 | 1.5 | 1.0 | 1.1 | 1.1 | 0.2 |
Table 3.
Comparison of the simulation and test of rapid releasing process.
Table 3.
Comparison of the simulation and test of rapid releasing process.
| Time(s) | 0 | 0.05 | 0.1 | 0.15 | 0.2 | 0.25 | 0.3 | 0.35 |
|---|
| Simulation (MPa) | 0.639 | 0.472 | 0.295 | 0.187 | 0.116 | 0.068 | 0.035 | 0.011 |
| Test (MPa) | 0.640 | 0.460 | 0.270 | 0.170 | 0.100 | 0.060 | 0.030 | 0.010 |
| Relative error(%) | 0.2 | 2.6 | 9.3 | 10.0 | 16.0 | 13.0 | 16.7 | 10.0 |
Table 4.
Initial parameters of simulation.
Table 4.
Initial parameters of simulation.
| Parameter | Symbol | Unit | Value |
|---|
| Truck body mass | m | kg | 8830 |
| Free tire radius | r | mm | 522 |
| Height of mass center | hg | mm | 915 |
| x-position of truck body COG (Center of Gravity) | a | mm | 1542 |
| Wheel base | L | mm | 3880 |
| Front wheel inertia | Iwf | kg·m2 | 20 |
| rear wheel inertia | Iwr | kg·m2 | 25 |
| maximum pressure | Pmax | MPa | 1.0 |
Table 5.
Comparison of deceleration of simulation and experiment.
Table 5.
Comparison of deceleration of simulation and experiment.
| Adhesion Coefficient | Deceleration |
|---|
| Simulation (m/s2) | Experiment (m/s2) | Error (%) |
|---|
| 0.8 | 7.50 | 6.98 | 7.74 |
| 0.2 | 1.48 | 1.71 | 13.51 |
Table 6.
The MFDD of the truck on the roads with different adhesion coefficients.
Table 6.
The MFDD of the truck on the roads with different adhesion coefficients.
| φ | u0(km/h) | ub(km/h) | ue(km/h) | sb(m) | se(m) | MFDD(m/s2) |
|---|
| 0.8 | 80 | 64 | 8 | 16.01 | 37.50 | 7.27 |
| 0.6 | 80 | 64 | 8 | 19.86 | 49.33 | 5.28 |
| 0.2 | 60 | 48 | 6 | 31.54 | 84.54 | 1.65 |
Table 7.
Simulation result at different failure ratios.
Table 7.
Simulation result at different failure ratios.
| Failure Ratio (%) | 0 | 20 | 40 | 60 | 80 | 100 |
| Failure mode1 | Displacement (m) | 49.80 | 50.35 | 50.47 | 50.82 | 51.58 | 105.57 |
| MFDD (m/s2) | 5.30 | 5.298 | 5.298 | 5.290 | 5.284 | 2.40 |
| t (s) | 3.910 | 3.940 | 3.946 | 3.970 | 4.012 | 8.419 |
| Failure mode2 | Displacement (m) | 49.80 | 50.15 | 50.23 | 50.35 | 50.83 | 79.66 |
| MFDD (m/s2) | 5.30 | 5.29 | 5.28 | 5.28 | 5.28 | 3.23 |
| t (s) | 3.910 | 3.931 | 3.952 | 3.947 | 3.976 | 6.334 |
| Failure mode3 | Displacement (m) | 49.80 | 50.97 | 50.96 | 50.95 | 50.95 | 50.94 |
| MFDD (m/s2) | 5.30 | 5.170 | 5.168 | 5.167 | 5.169 | 5.168 |
| t (s) | 3.910 | 4.010 | 3.991 | 3.996 | 3.996 | 3.992 |
| Failure mode4 | Displacement (m) | 49.80 | 50.93 | 50.94 | 50.94 | 50.93 | 50.93 |
| MFDD (m/s2) | 5.30 | 5.167 | 5.167 | 5.167 | 5.167 | 5.167 |
| t (s) | 3.910 | 4.010 | 4.010 | 4.010 | 4.010 | 4.010 |


