Driver’s Social Relationship Based Clustering and Transmission in Vehicle Ad Hoc Networks (VANETs)


Abstract
1. Introduction
2. Materials and Methods
2.1. Social Network Group Generation Method
- (1)
- If the individual i becomes an isolated state (m = 0), then i will select another isolated individual j with the proportional probability of p(t, t). Connection between i and j will be established. m and m will be updated to 1, and g = g = min (i, j).
- (2)
- If the individual i is within a group (m = n > 1), then i will either leave the group with the probability of or introduce an isolated individual to the group with the probability of 1 − . If i leaves, then g = i, m = 1 and all other i within the group will also be updated to their corresponding group and member number. If i chose to introduce a new member j to its group, then, g = g, m + 1 and + 1, where k is the other number of nodes in the group of i:
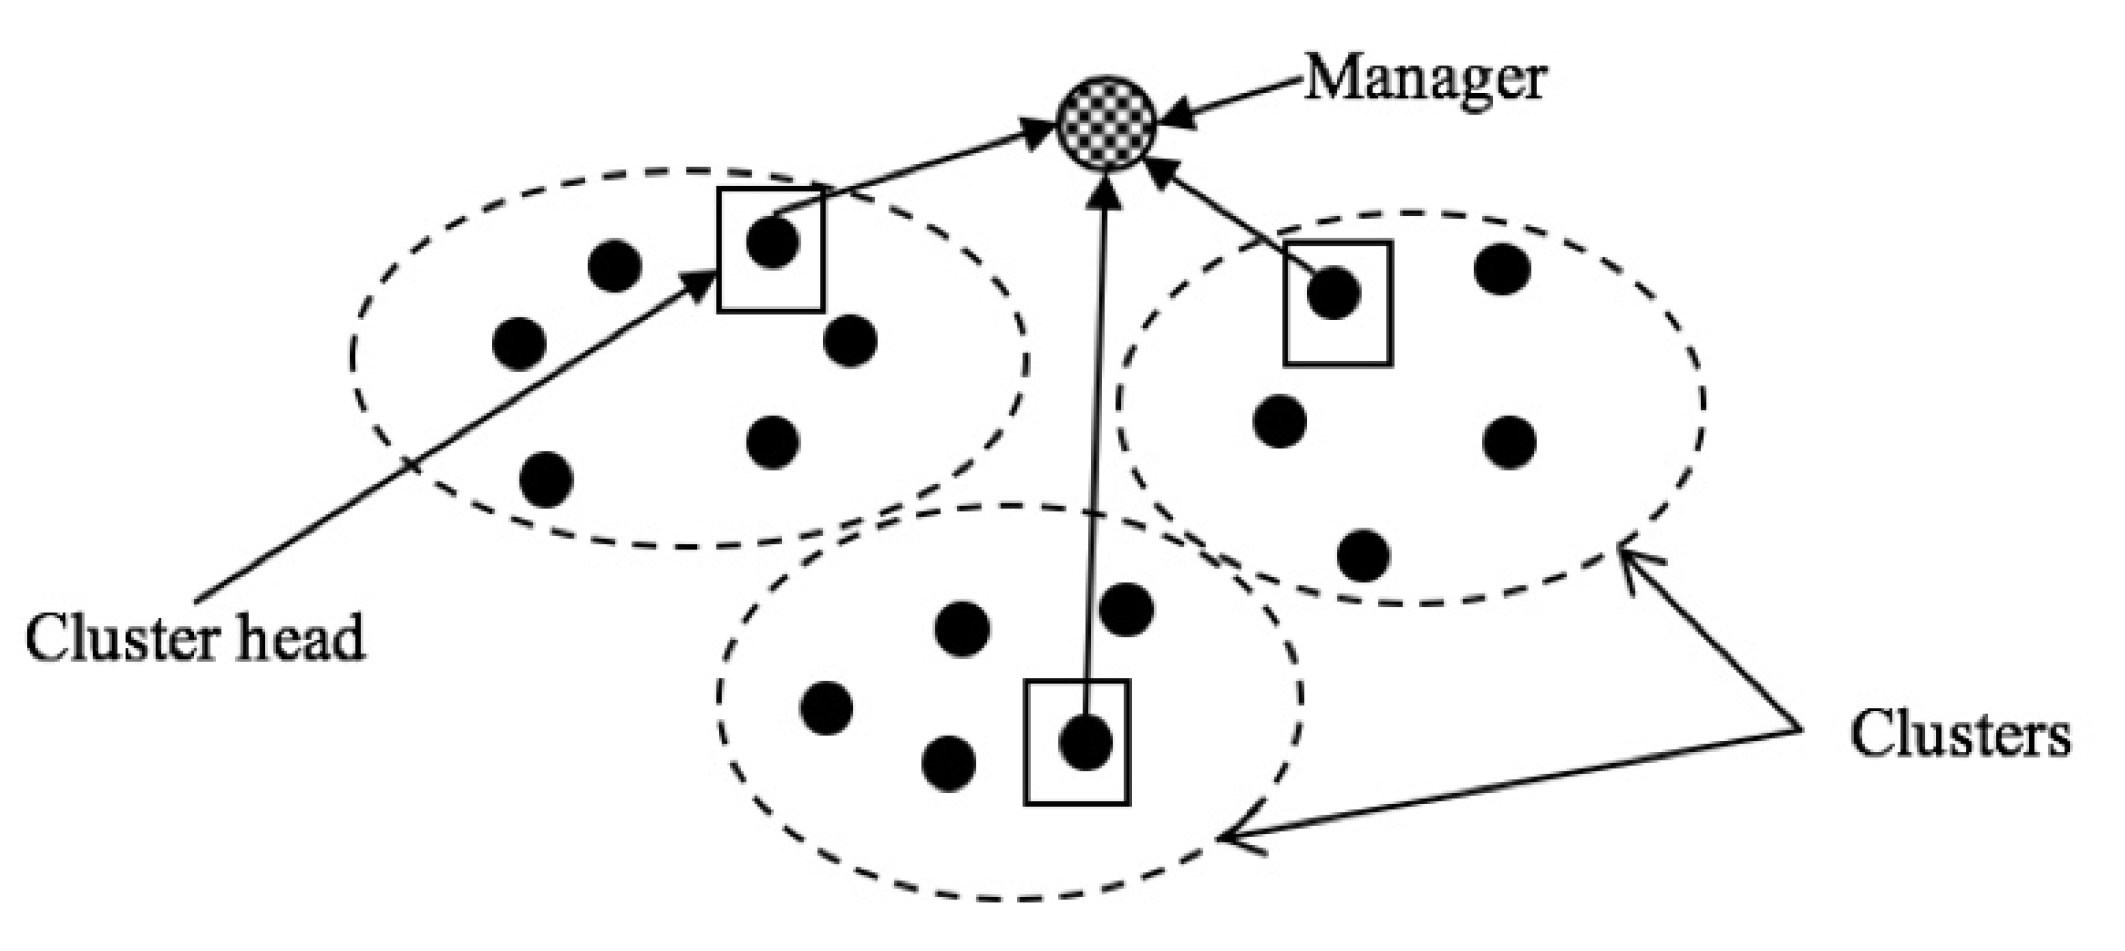
2.2. Clustering Method
2.3. Communication Process
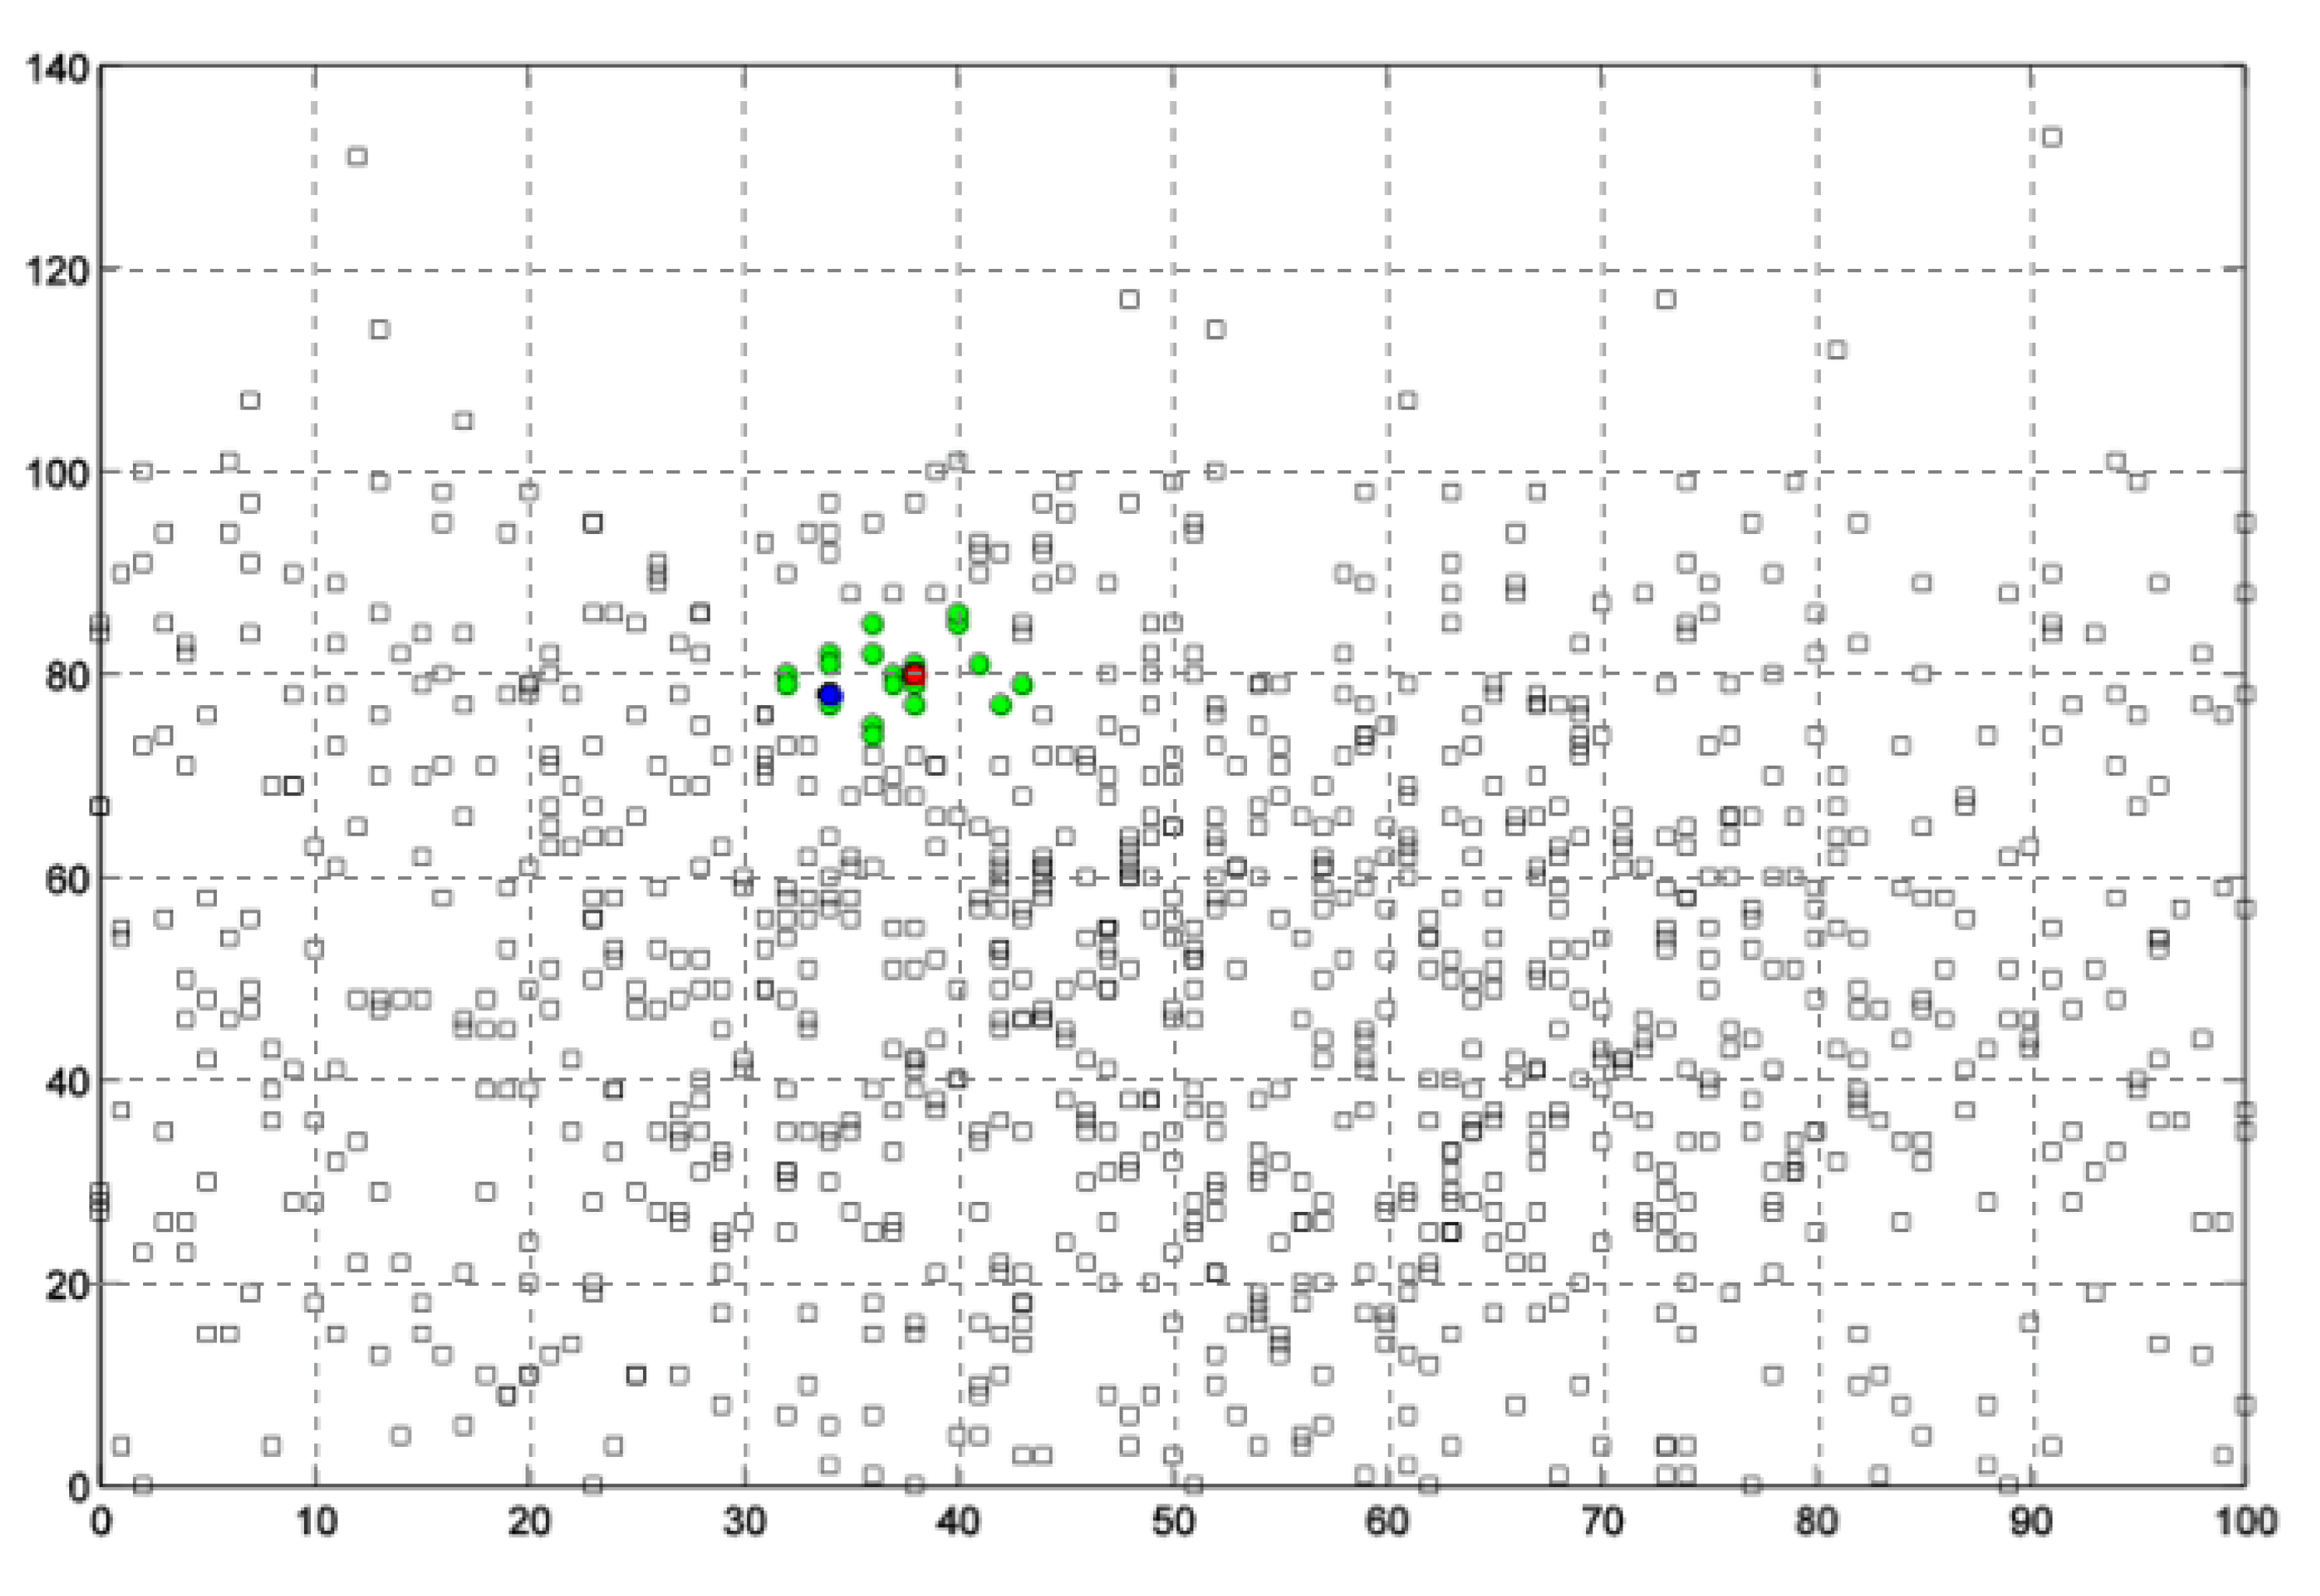
2.4. Simulations
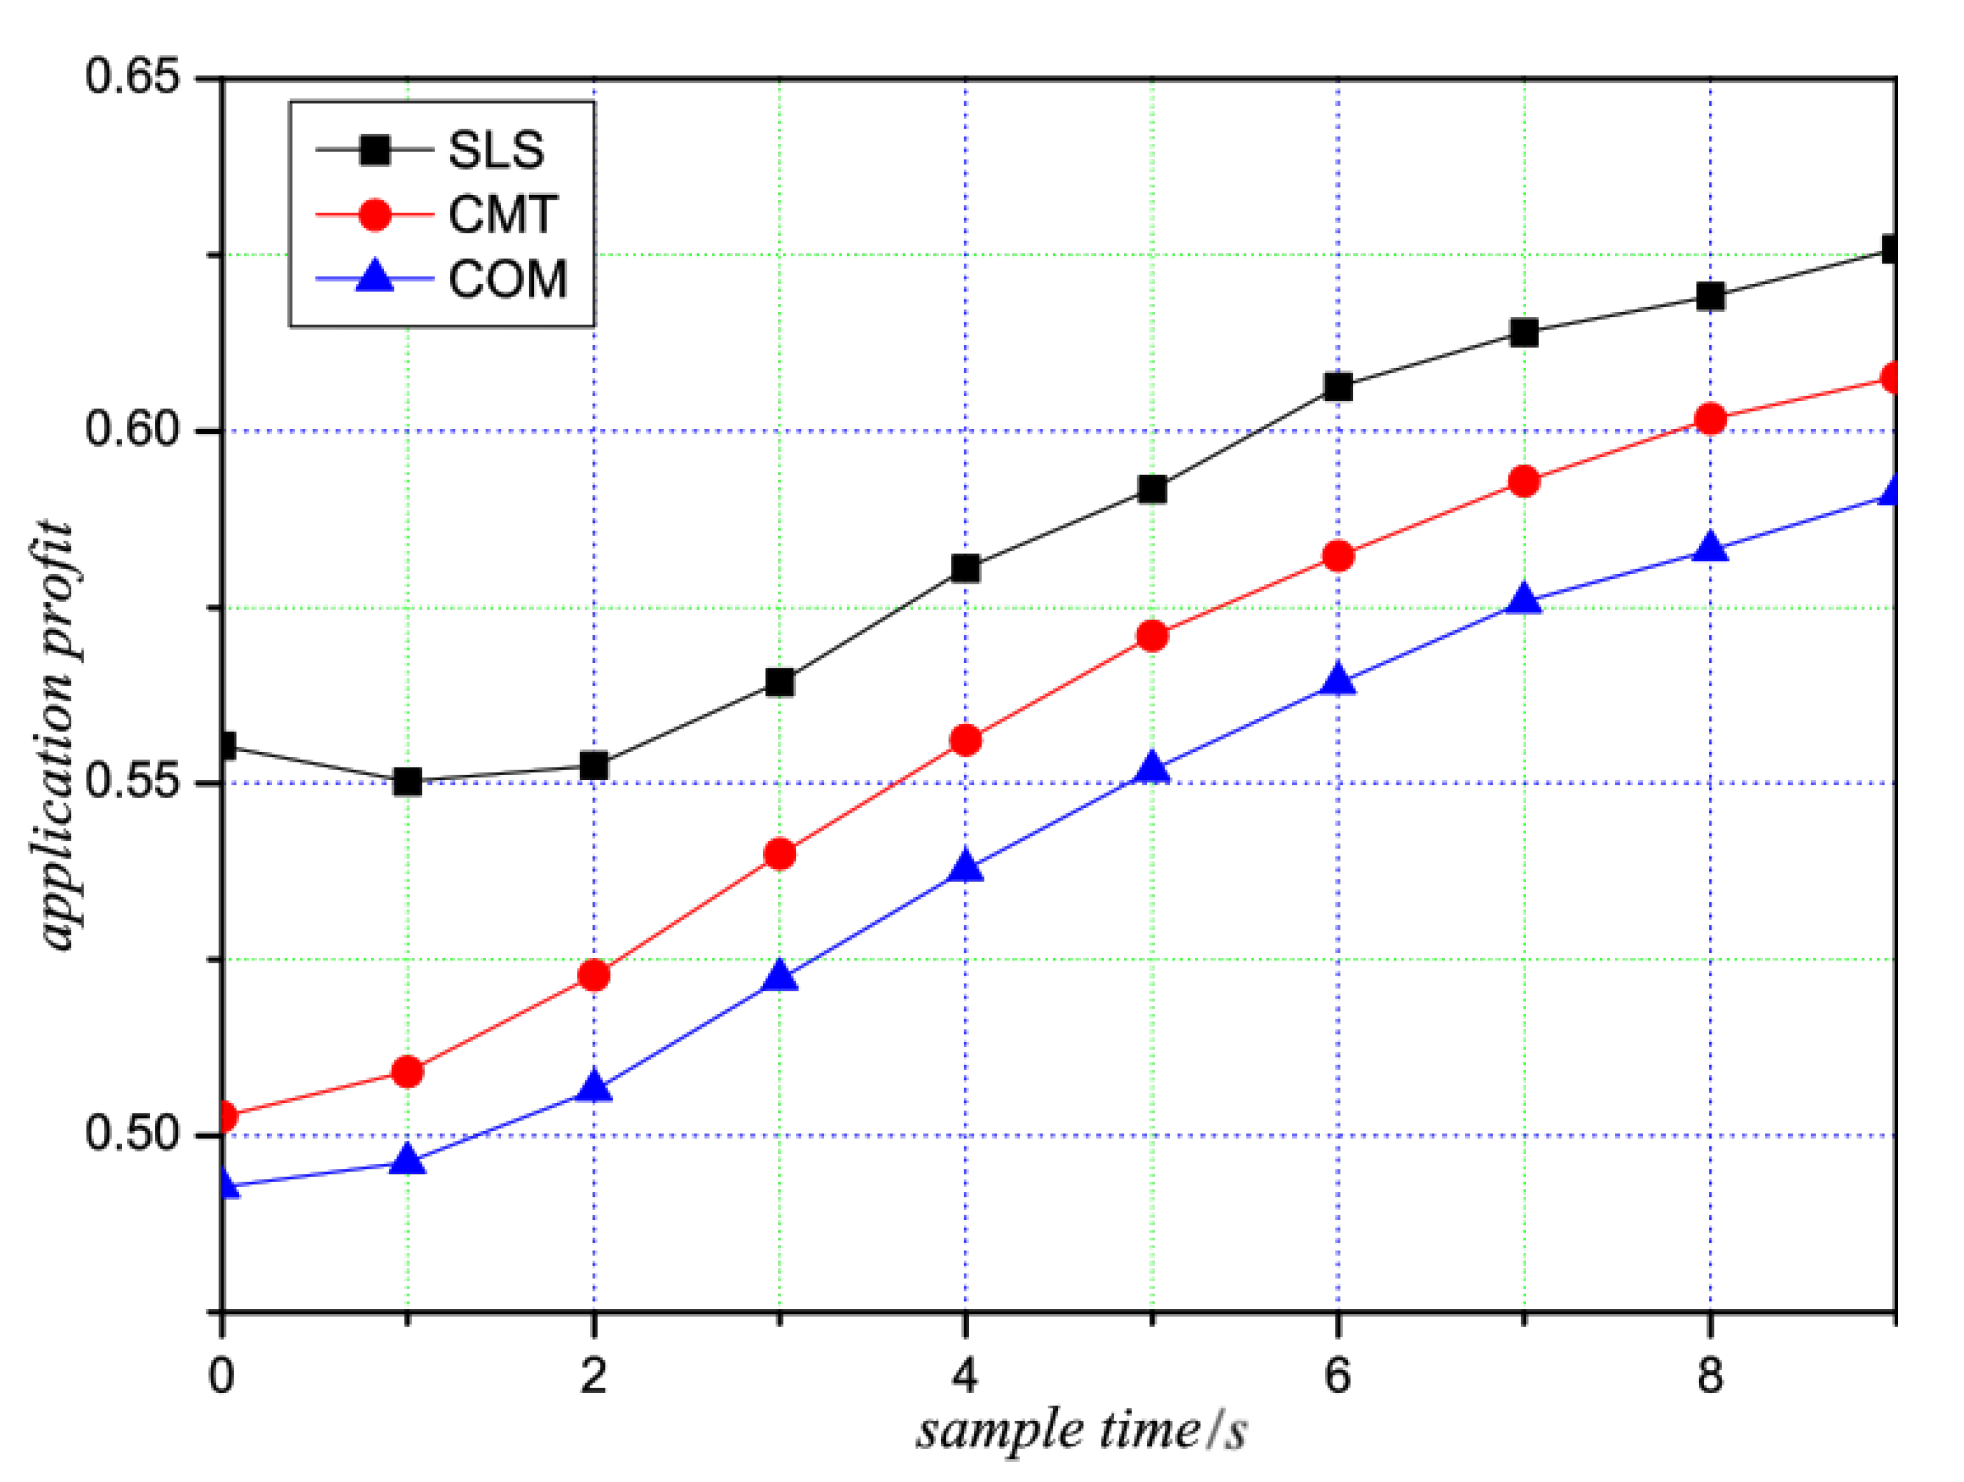
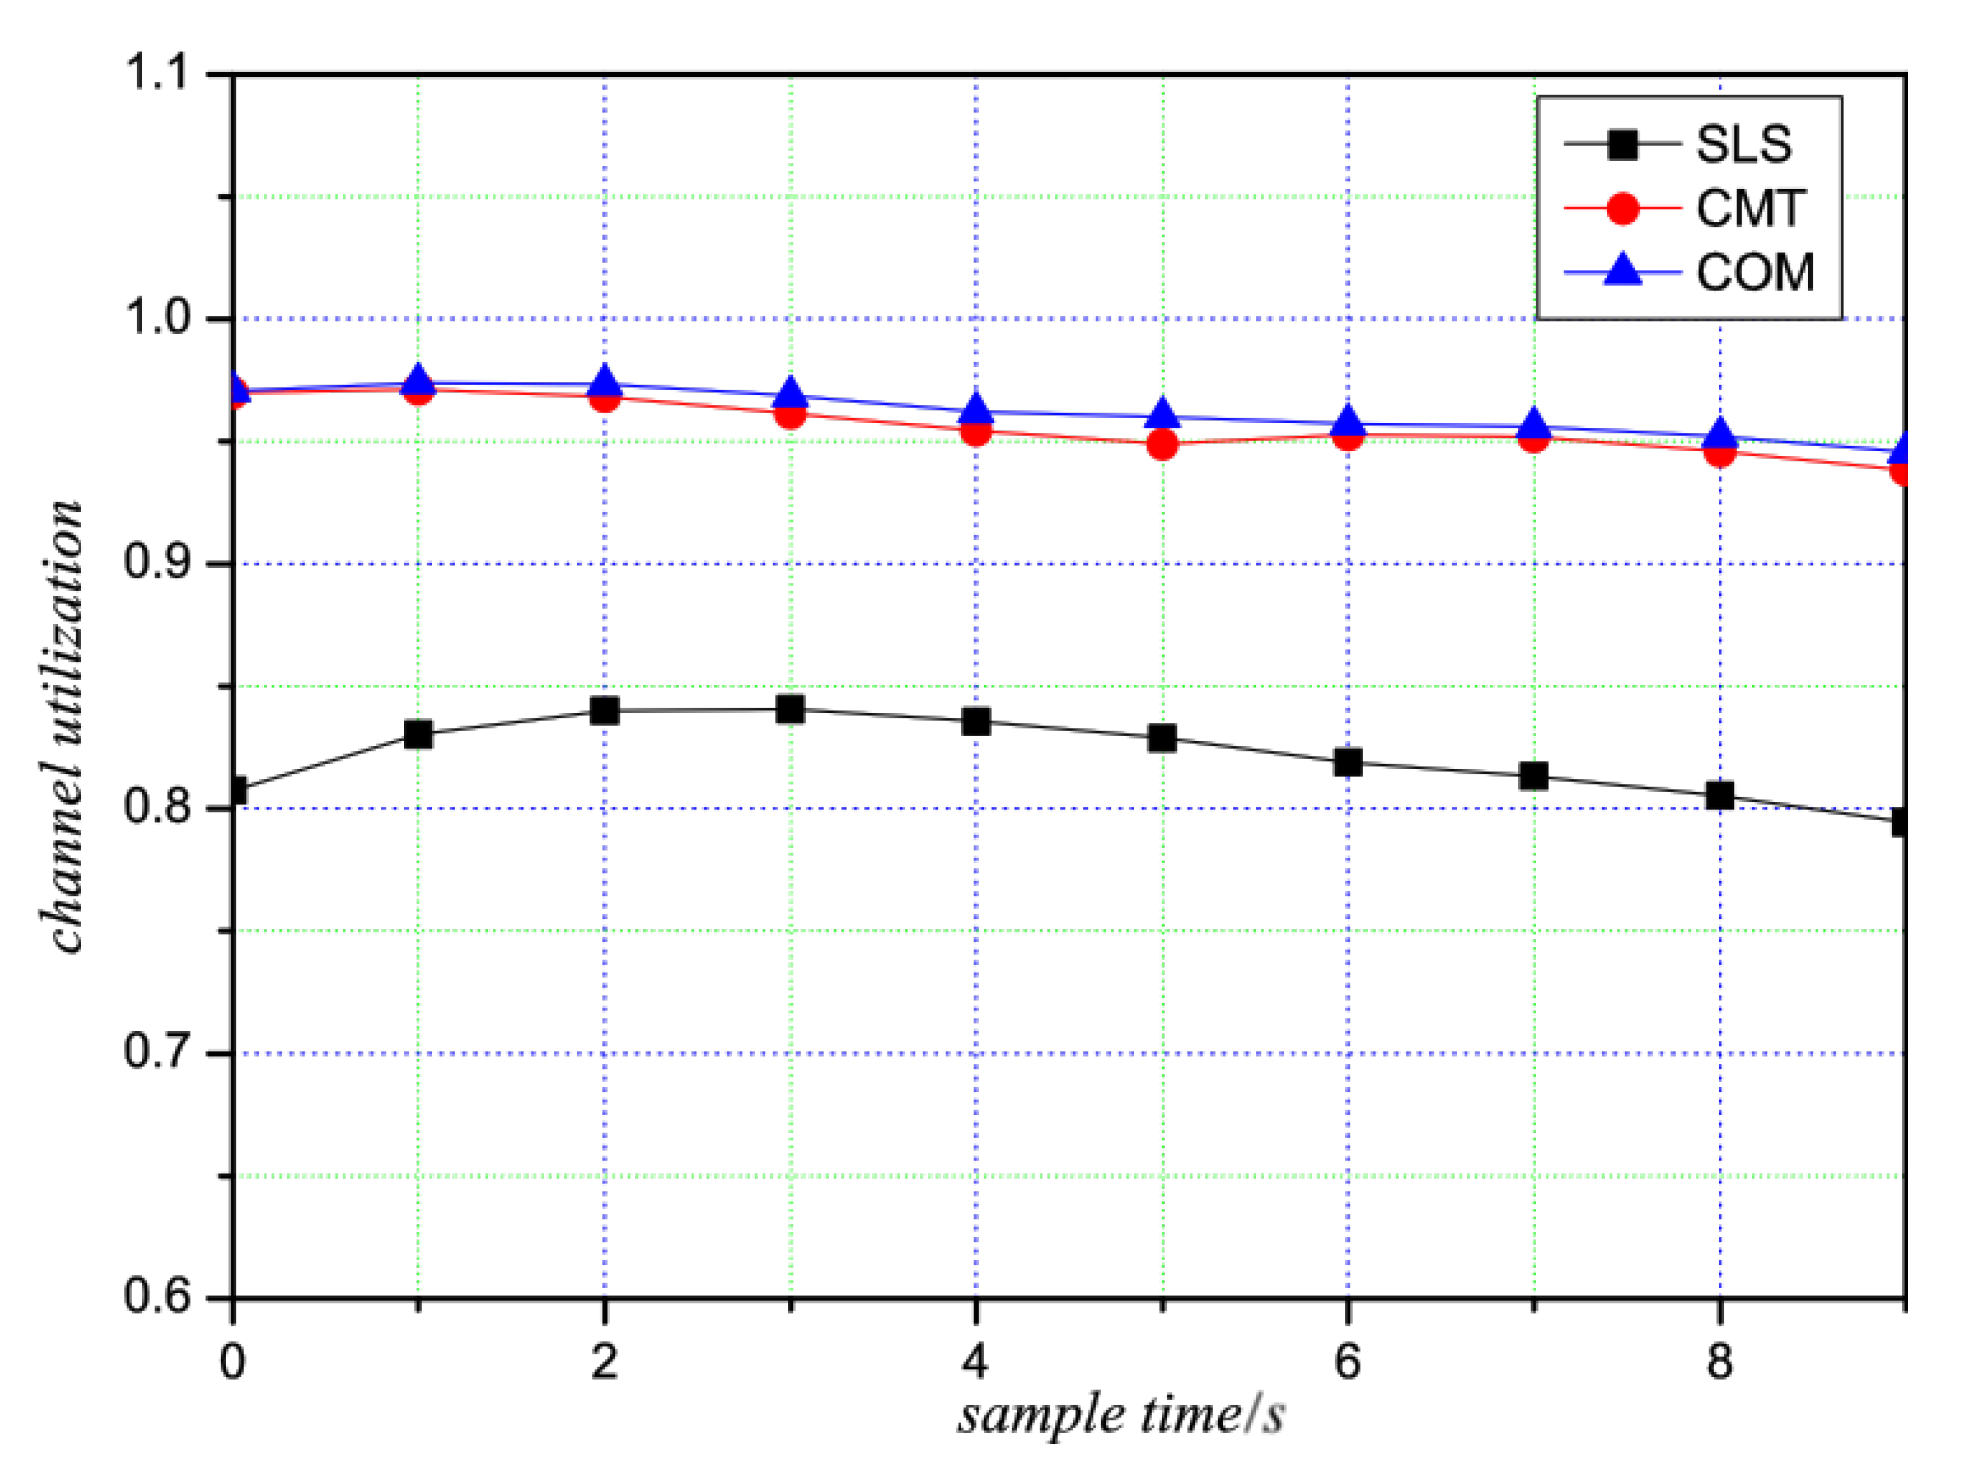
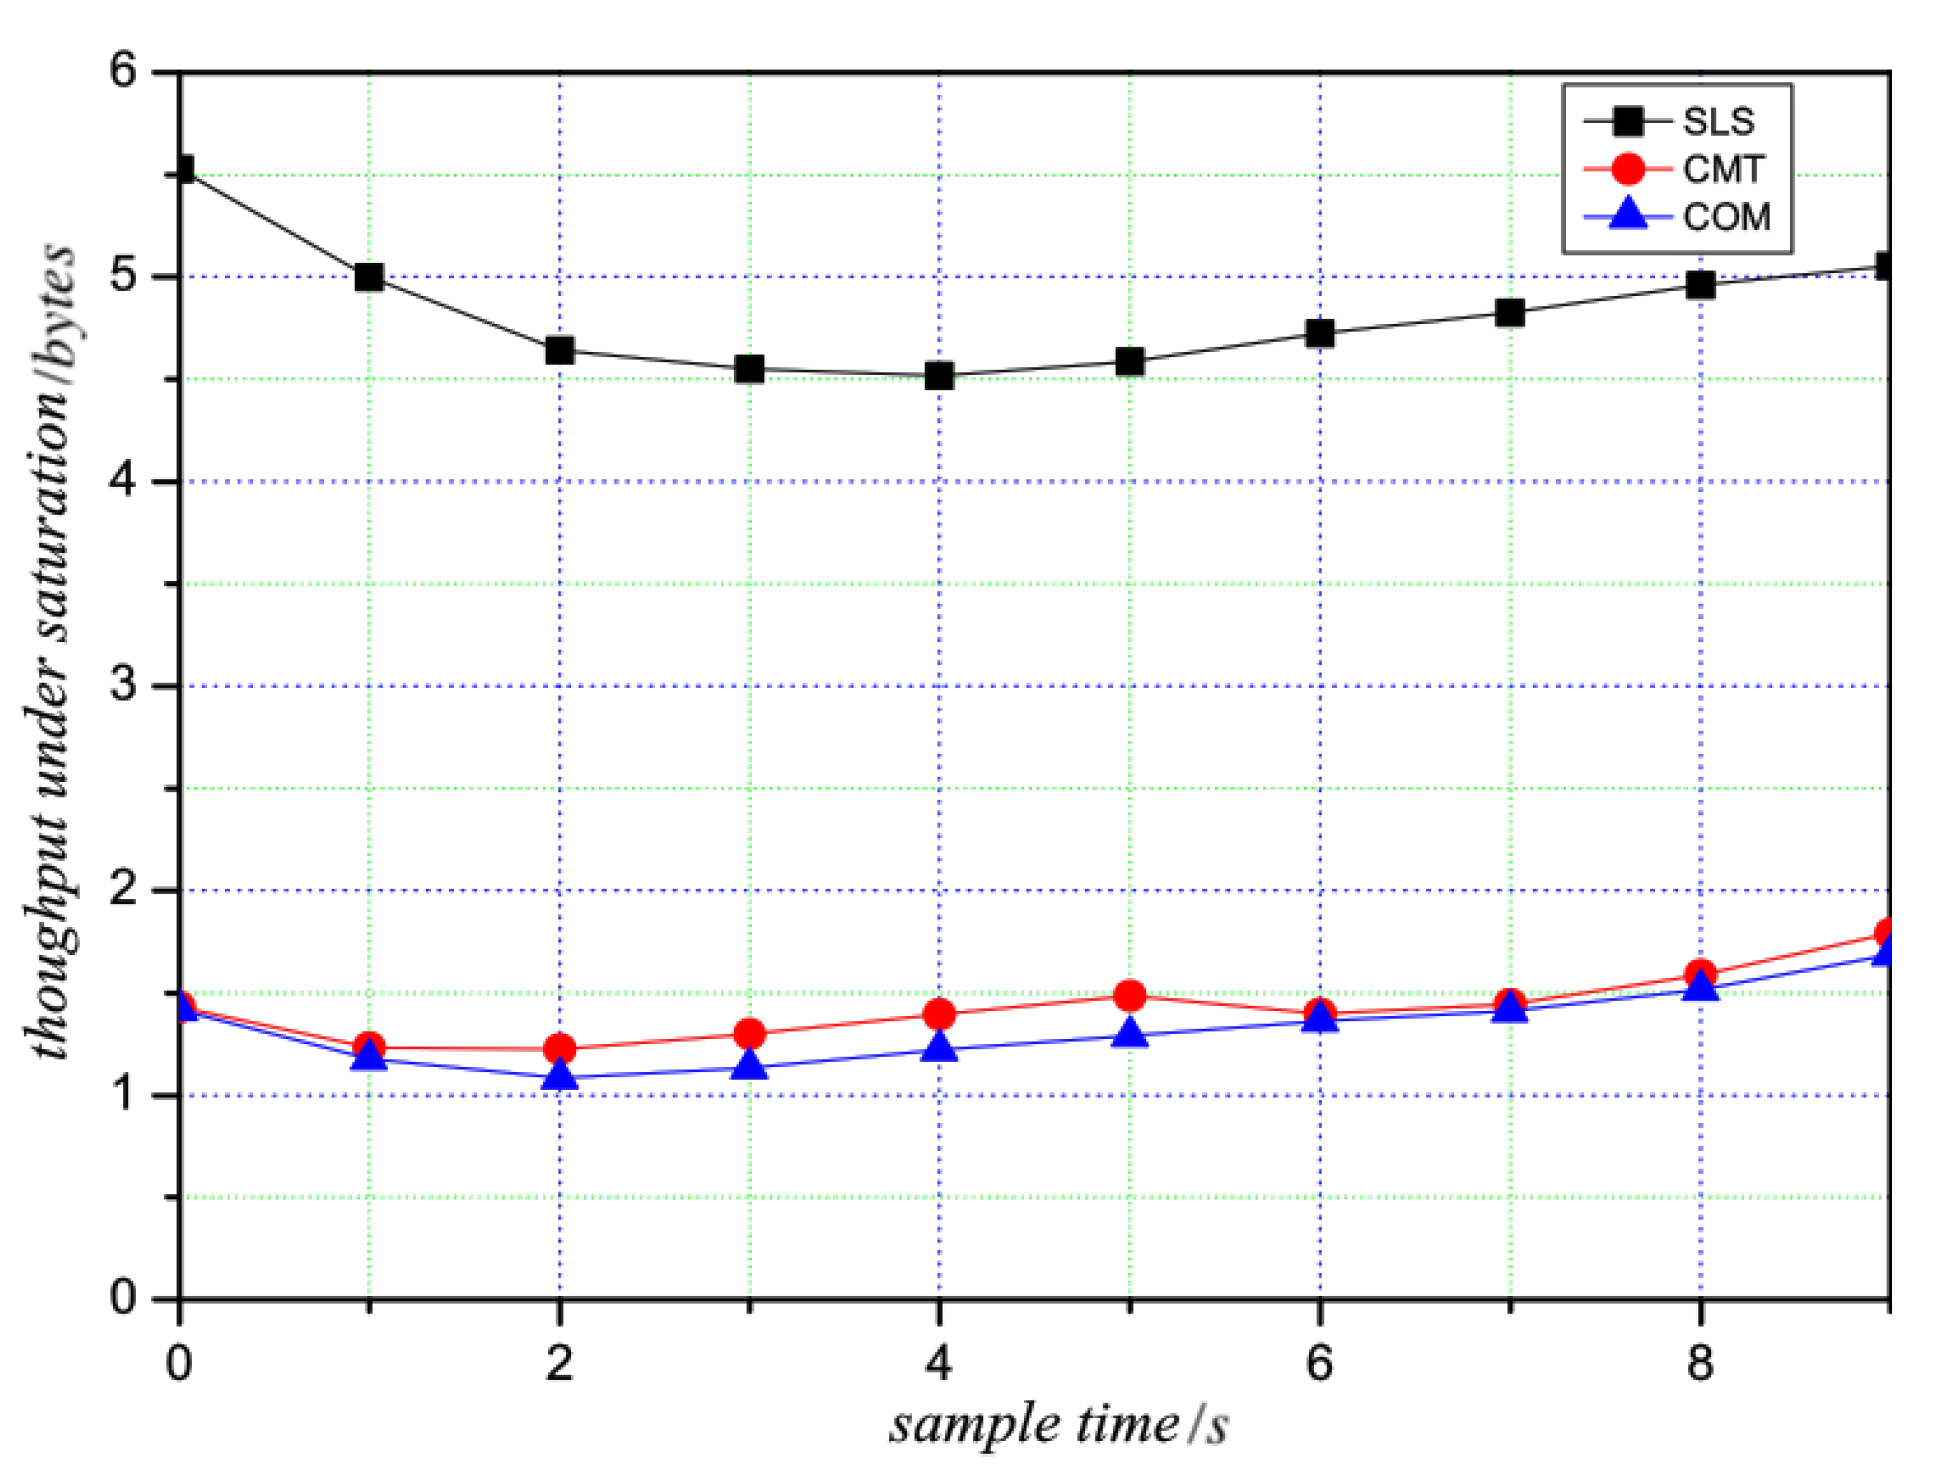
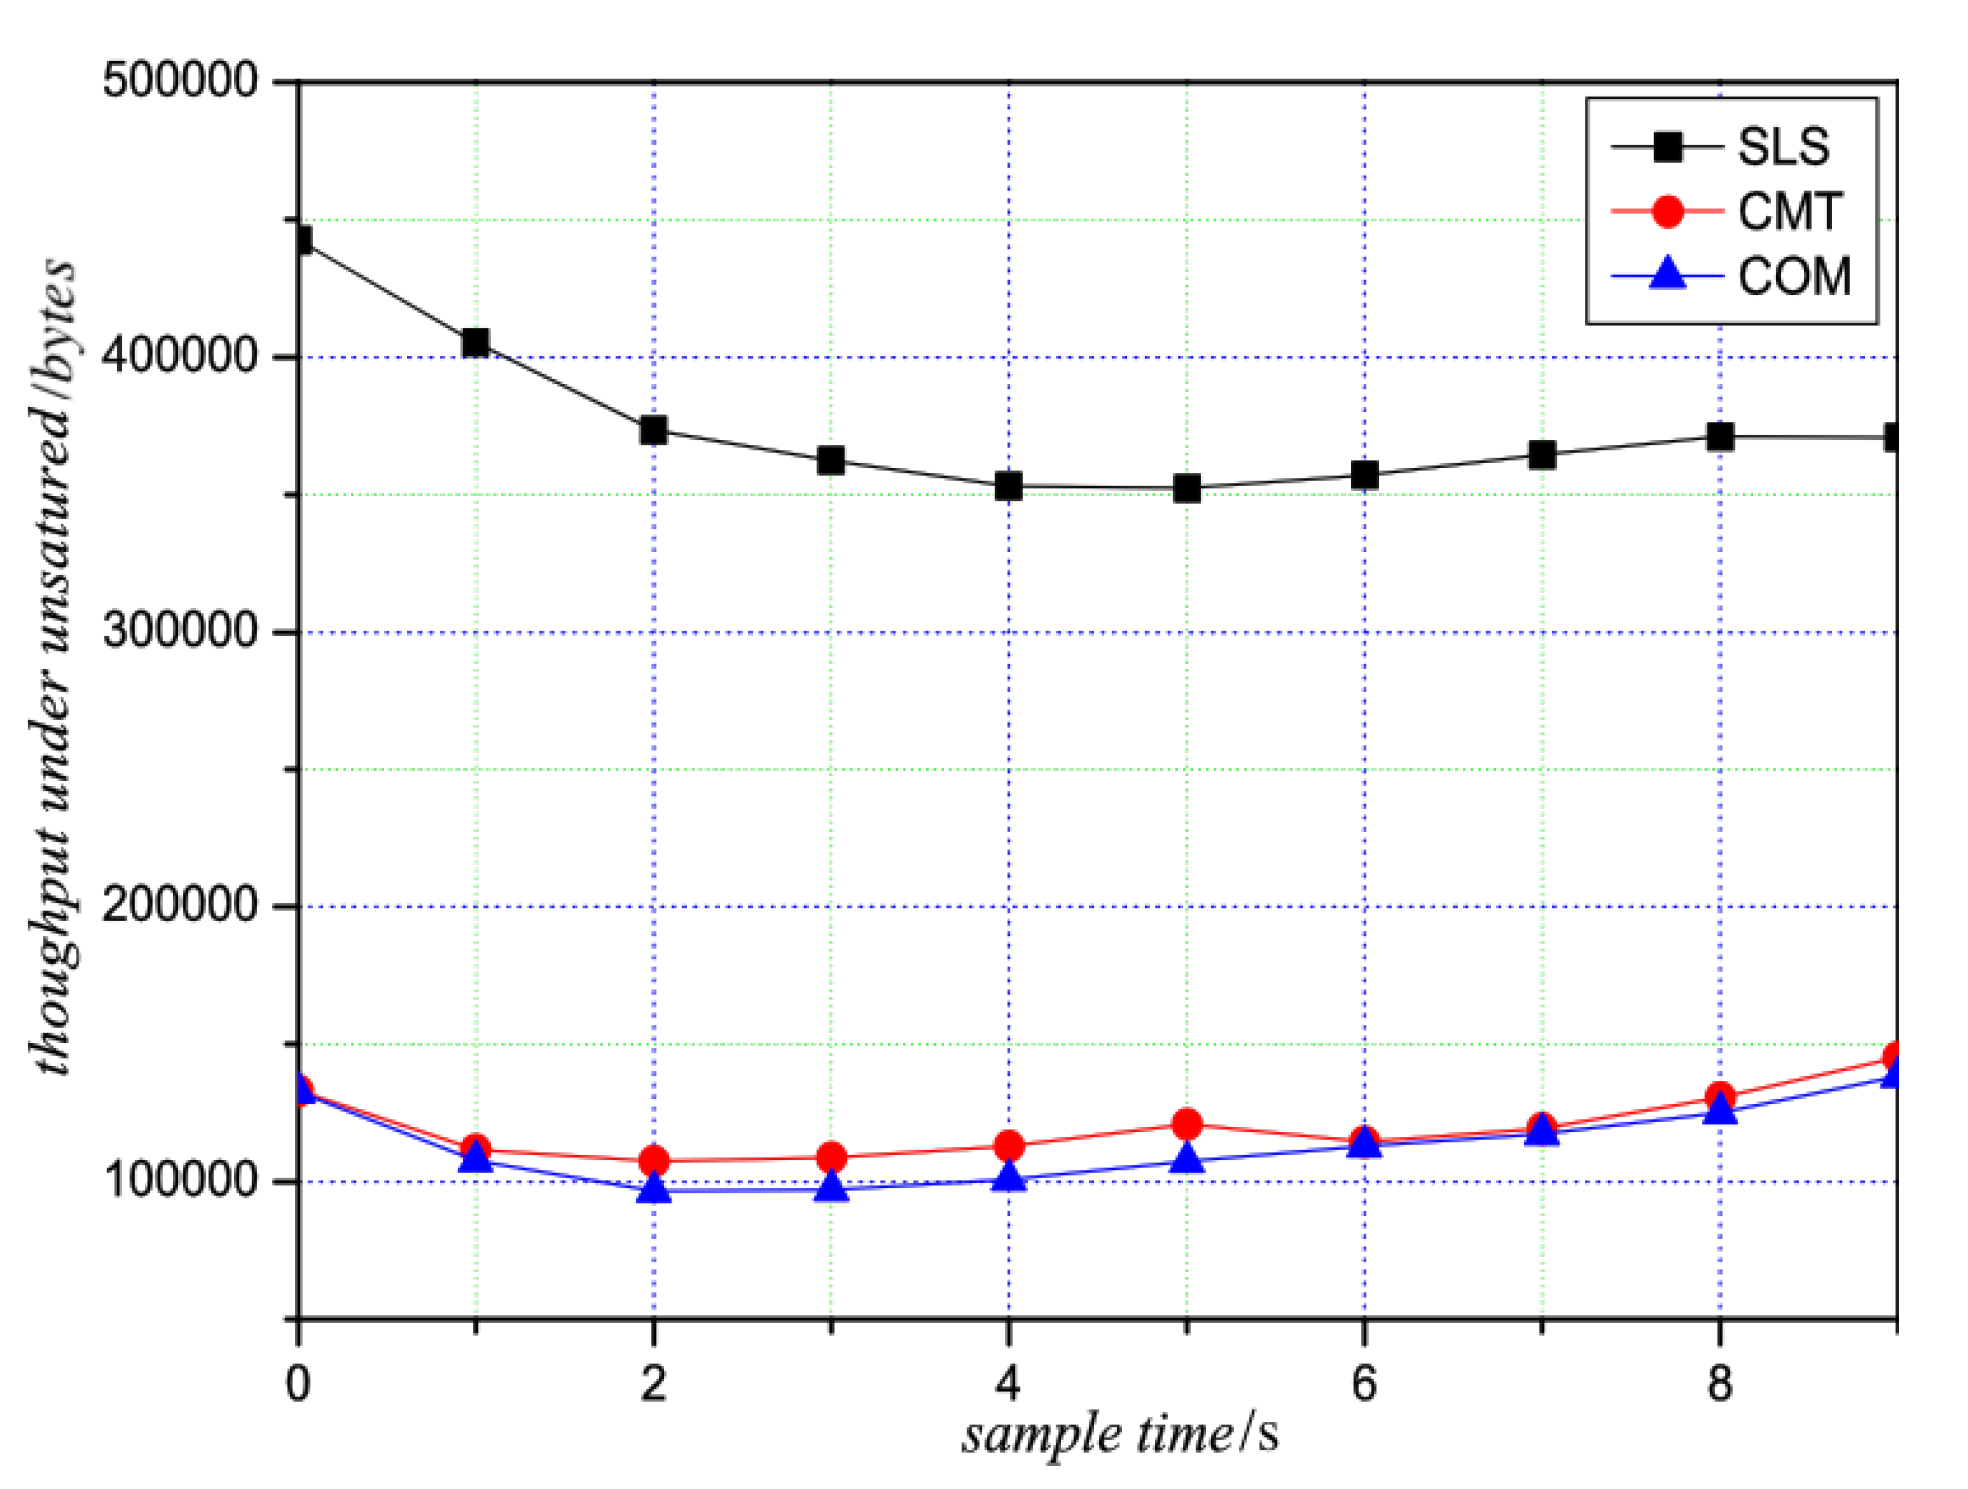
3. Results
4. Discussion
5. Conclusions
Author Contributions
Funding
Conflicts of Interest
References
- Arkian, H.R.; Atani, R.E.; Pourkhalili, A.; Kamali, S. A Stable Clustering Scheme Based on Adaptive Multiple Metric in Vehicular Ad-hoc Networks. J. Inf. Sci. Eng. 2015, 31, 361–386. [Google Scholar]
- Luoto, P.; Bennis, M.; Pirinen, P.; Samarakoon, S.; Horneman, K.; Latva-Aho, M. Vehicle clustering for improving enhanced LTE-V2X network performance. In Proceedings of the IEEE European Conference on Networks and Communications, Oulu, Finland, 12–15 June 2017. [Google Scholar]
- Fahad, M.; Aadil, F.; Zahoor-ur- Rehman; Khan, S.; Shah, P.A.; Muhammad, K.; Lloret, J.M.; Haoxiang, W.; Lee, J.W.; Irfan, M. Grey wolf optimization based clustering algorithm for vehicular ad-hoc networks. Comput. Electric. Eng. 2018. [Google Scholar] [CrossRef]
- Qiang, X.; Yao, S.S. Clustering algorithm for urban taxi carpooling vehicle based on data field energy. J. Adv. Transp. 2018, 1–8. [Google Scholar] [CrossRef]
- Makani, P.; Gupta, S. Protocols governing clustering in MANETS. Int. J. Adv. Res. Comput. Sci. 2014, 5, 202–205. [Google Scholar]
- Bednarczyk, W.; Gajewski, P. An enhanced algorithm for MANET clustering based on weighted parameters. Univers. J. Commun. Netw. 2013, 1, 88–94. [Google Scholar]
- Mylsamy, R.; Sankaranarayanan, S. Cluster Based Geographical Routing (CBGR) for MANETs. Appl. Mech. Mater. 2014, 550. [Google Scholar] [CrossRef]
- Jaballah, W.B.; Mauro, C.; Chhagan, L. A Survey on Software-Defined VANETs: Benefits, Challenges, and Future Directions. arXiv 2019, arXiv:1904.04577. [Google Scholar]
- Kanemaru, Y.; Matsuura, S.; Kakiuchi, M.; Noguchi, S.; Inomata, A.; Fujikawa, K. Vehicle clustering algorithm for sharing information on traffic congestion. In Proceedings of the 13th International Conference on ITS Telecommunications (ITST), IEEE, Tampere, Finland, 5–7 November 2013; pp. 38–43. [Google Scholar]
- Washio, N.; Matsuura, S.; Kakiuchi, M.; Inomata, A.; Fujikawa, K. A vehicle clustering algorithm for information propagation by inter-vehicle communications. In Proceedings of the IEEE International Conference on Pervasive Computing and Communication Workshops (PerCom Workshops), St. Louis, MO, USA, 23–27 March 2015; pp. 111–116. [Google Scholar]
- Ucar, S.; Ergen, S.C.; Ozkasap, O. VMaSC: Vehicular multi-hop algorithm for stable clustering in vehicular ad hoc networks. In Proceedings of the IEEE Wireless Communications and Networking Conference (WCNC), Shanghai, China, 7–10 April 2013; pp. 2381–2386. [Google Scholar]
- Li, Y.; Zhao, M.; Wang, W. Internode mobility correlation for group detection and analysis in vanets. IEEE Trans. Veh. Technol. 2013, 4590–4601. [Google Scholar] [CrossRef]
- Vodopivec, S.; Bešter, J.; Kos, A. A multihoming clustering algorithm for vehicular ad hoc networks. Int. J. Distrib. Sens. Netw. 2014, 10, 107085. [Google Scholar] [CrossRef]
- Yang, S.; Yang, X.; Zhang, C.; Spyrou, E. Using social network theory for modeling human mobility. IEEE Netw. 2010, 24, 6–13. [Google Scholar] [CrossRef]
- Dewei, Y.; Jinya, S.; Cunjia, L.; Wen-Hua, C. Trajectory clustering aided personalized driver intention prediction for intelligent vehicles. IEEE Trans. Ind. Inf. 2018. [Google Scholar] [CrossRef]
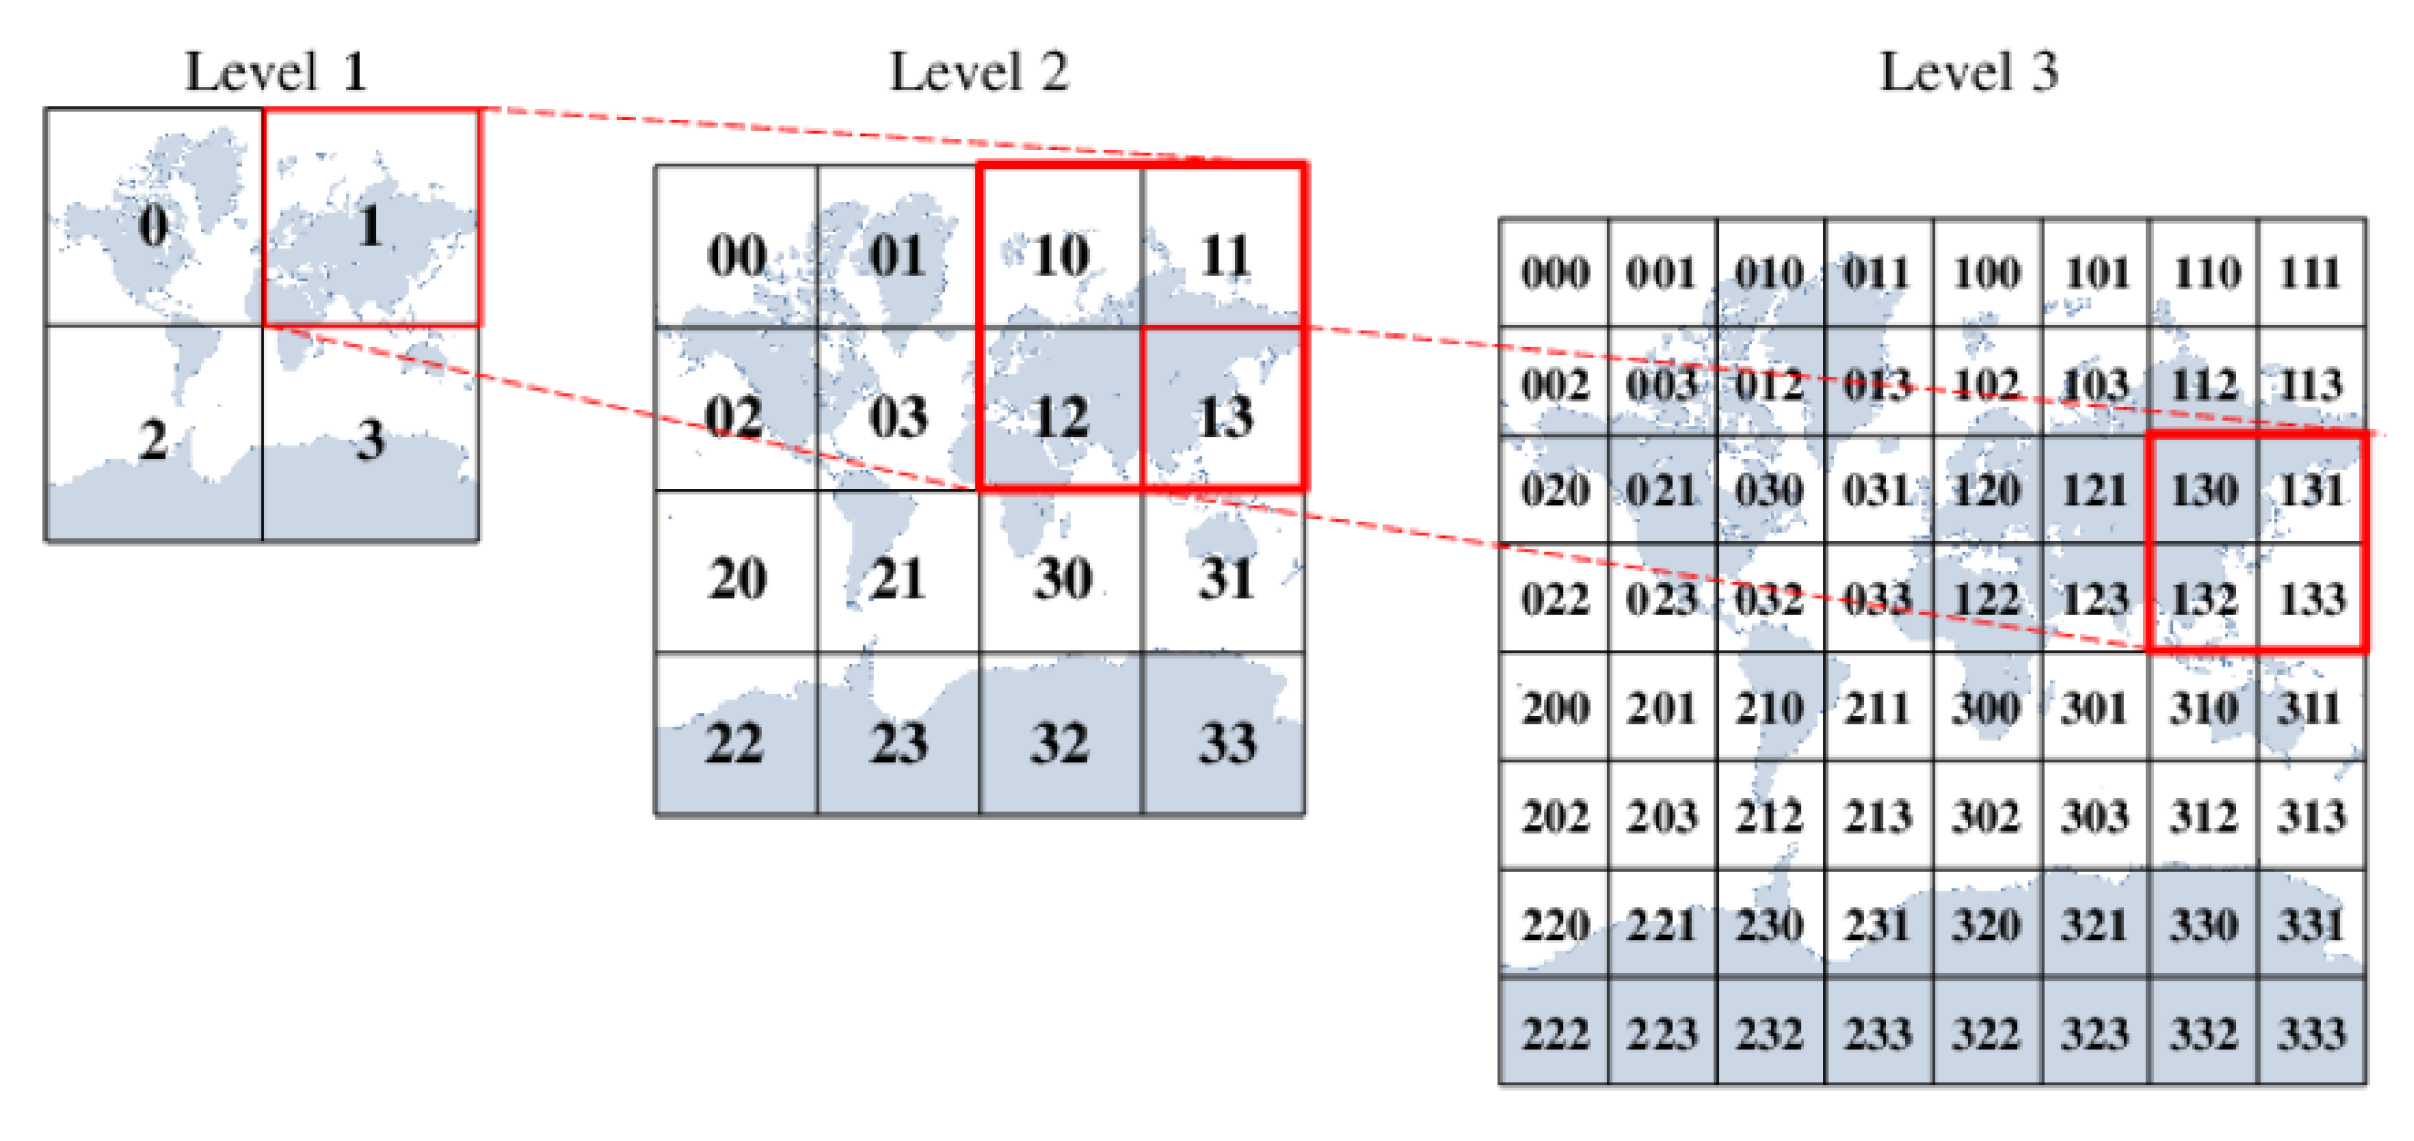
- Schwartz, J. Bing Maps Tile System. Microsoft Developer Network. 2009. Available online: http://msdn.microsoft.com/en-us/library/bb259689.aspx (accessed on 26 January 2020).
- Zhao, K.; Stehlé, J.; Bianconi, G.; Barrat, A. Social network dynamics of face-to-face interactions. Phys. Rev. E 2011, 83, 056109. [Google Scholar] [CrossRef] [PubMed]
- Ma, X.; Chen, X.; Refai, H.H. Unsaturated performance of IEEE 802.11 broadcast service in vehicle-to-vehicle networks. In Proceedings of the IEEE 66th Vehicular Technology Conference (VTC-2007 Fall), Baltimore, MD, USA, 30 September–3 October 2007; pp. 1957–1961. [Google Scholar]
- Chen, X.; Refai, H.H.; Ma, X. Saturation performance of IEEE 802.11 broadcast scheme in ad hoc wireless LANs. In Proceedings of the IEEE 66th Vehicular Technology Conference (VTC-2007 Fall), Baltimore, MD, USA, 30 September–3 October 2007; pp. 1897–1901. [Google Scholar]


| Parameter | Meaning | Value |
|---|---|---|
| DIFS | DCF inter-frame space | 58 s |
| Weight coefficient in S | 0.5 | |
| Influence coefficient | ||
| Accuracy coefficient | ||
| E[P] | Length of the packet data | bits |
| Length of the packet header | 8 bits | |
| Slot time | 1 s | |
| System transmission data rate | 6 Mbps |
© 2020 by the authors. Licensee MDPI, Basel, Switzerland. This article is an open access article distributed under the terms and conditions of the Creative Commons Attribution (CC BY) license (http://creativecommons.org/licenses/by/4.0/).
Share and Cite
Li, L.; Wang, W.; Gao, Z. Driver’s Social Relationship Based Clustering and Transmission in Vehicle Ad Hoc Networks (VANETs). Electronics 2020, 9, 298. https://doi.org/10.3390/electronics9020298
Li L, Wang W, Gao Z. Driver’s Social Relationship Based Clustering and Transmission in Vehicle Ad Hoc Networks (VANETs). Electronics. 2020; 9(2):298. https://doi.org/10.3390/electronics9020298
Chicago/Turabian StyleLi, Lin, Wenjian Wang, and Zhenhai Gao. 2020. "Driver’s Social Relationship Based Clustering and Transmission in Vehicle Ad Hoc Networks (VANETs)" Electronics 9, no. 2: 298. https://doi.org/10.3390/electronics9020298
APA StyleLi, L., Wang, W., & Gao, Z. (2020). Driver’s Social Relationship Based Clustering and Transmission in Vehicle Ad Hoc Networks (VANETs). Electronics, 9(2), 298. https://doi.org/10.3390/electronics9020298