Abstract
Recently, the difference and sum (diff-sum) coarray has attracted much attention in one-dimensional direction-of-arrival estimation for its high degrees-of-freedom (DOFs). In this paper, we utilize both the spatial information and the temporal information to construct the diff-sum coarray for planar sparse arrays. The diff-sum coarray contains both the difference coarray and the sum coarray, which provides much higher DOFs than the difference coarray alone. We take a planar coprime array consisting of two uniform square subarrays as the array model. To fully use the aperture-extending ability of the diff-sum coarray, we propose two novel configurations to improve the planar coprime array. The first configuration compresses the inter-element spacing of one subarray and results in a larger consecutive area in the coarray. The second configuration rearranges the two subarrays and introduces a proper separation between them, which can significantly reduce the redundancy of the diff-sum coarray and increase the DOFs. Besides, we derive the closed-form expressions of the central consecutive ranges in the coarrays of the proposed array configurations. Simulations verify the superiority of the proposed array configurations.
1. Introduction
Two-dimensional (2D) direction-of-arrival (DOA) estimation has attracted much attention recently for its wide applications in the fields of radar, sonar, communications and navigation, etc. Conventional research mainly focuses on the uniform rectangular arrays (URAs) [1,2], whose inter-element spacing between the adjacent sensors is no more than the typical half-wavelength . Although the URAs are easy to construct, the detection ability is limited by the number of sensors. The increasing sensor number brings higher hardware cost and computational complexity. Thus, it is significant to design arrays with sparse geometries and the ability to detect more sources than physical sensors.
In the past five years, numbers of novel one-dimensional (1D) sparse arrays with the concept of a coarray have been proposed to achieve a higher number of degrees-of-freedom (DOFs) than ULA. One of the most discussed sparse array configurations, named the nested array [3], is proposed to resolve sources with N sensors. The nested array has closed-form expressions of sensor locations and the DOFs. To further enhance the DOFs or to reduce the mutual coupling effects, a series of improved nested array configurations are proposed, such as the extended nested array [4], the augmented nested array [5], and the super nested arrays [6,7]. Another attractive sparse array configuration, named the coprime array [8,9], can resolve sources with physical sensors, where are a pair of coprime integer numbers. In order to extend the DOFs or to solve the high peak side lobe problems of the coprime array, various optimized geometries are proposed recently, such as the generalized coprime arrays [10], extended coprime arrays [11,12], and the multi-period coprime structures [13]. With these sparse array configurations, one can construct the difference coarray by applying the concept of the Khatri–Rao (KR) product to sparse arrays [3,4,5,8,9,10,11,12,13]. Finally, under-determined DOA estimation methods, such as the spatial smoothing based MUSIC (SS-MUSIC) method [3,14], can be applied to the resulting difference coarray to detect more sources.
Inspired by the 1D linear sparse arrays introduced above, many planar sparse array configurations have been proposed for 2D virtual aperture enhancement. The L-shaped arrays [15,16,17] have successfully overcome the ambiguity problem by comparing the results of the sparse subarrays and using fast spectral search methods. However, the number of detectable sources is not significantly increased. In order to obtain a hole-free virtual URA with higher DOFs, several geometries based on the difference coarray are proposed, such as the billboard arrays [18] and open-box arrays (OBA) [19]. Although the OBA geometry can effectively achieve high virtual DOFs, the mutual coupling effects brought by the dense sensor distribution on the boundaries can not be ignored. In order to reduce the mutual coupling effects, a series of improved array structures, for instance the partially open box arrays (POBA), half open box arrays (HOBA), half open box arrays with two layers (HOBA-2), and hourglass arrays [20,21] are proposed one after another. Among the optimized OBAs, the recently proposed half H array (HHA) and ladder array (LA) [22] can achieve the lowest DOA estimation error. On the other hand, a new class of 2D arrays with sensors on the lattice, named 2D nested arrays [23,24], is proposed, which can generate a hole-free difference coarray with much higher virtual DOFs. Besides, the concept of a coprime array is also extended to 2D cases due to the capability of reducing the mutual coupling effects and enhancing the resolution. Recently, a coprime planar array geometry consists of two square uniform planar subarrays [25] is utilized in conventional MUSIC algorithm for 2D DOA estimation. Although the spectral search method provides excellent DOA estimation performance, the computational complexity remains high in two dimensions. A generalized coprime planar array with two rectangular uniform subarrays [26] and the corresponding fast 2D DOA estimation approach [27] are proposed to reduce the complexity significantly. However, the above 2D coprime geometries only make use of the physical sensors to estimate DOAs and the superiority of coarray is not considered. To obtain dense coarrays with high virtual DOFs from sparse arrays, the theory of sparse coprime sensing in multiple dimensions [28,29] is proposed to provide basic configurations and applications of the coprime arrays on lattice. However, conventional array configurations are designed mainly based on the concept of difference coarray. In fact, the sum coarray can be utilized jointly with the difference coarray to further increase DOFs.
In this paper, we improve the vectorized conjugate augmented MUSIC (VCAM) algorithm [30,31] and apply it to 2D DOA estimation based on the second-order statistics. Firstly, we utilize both the spatial information and the temporal information to construct a conjugate augmented correlation vector. By vectorizing the covariance matrix of this vector, we can obtain a difference and sum (diff-sum) coarray, which make use of the complementary between the difference coarray and the sum coarray to construct a larger hole-free area. Based on the diff-sum coarray concept, we then propose two novel 2D coprime configurations. For the first configuration, the inter-element spacing of one subarray is compressed by a positive integer, which results in an array configuration named the coprime array with a compressed subarray (CAACS). The CAACS can acquire much higher DOFs than the prototype 2D coprime array as some of the holes in coarray can be filled up. For the second configuration named as coprime array with two separated subarrays (CATSS), sensors of the two subarrays are rearranged to be bilaterally symmetrical and a proper separation is introduced between the two subarrays. As a result, the diff-sum coarray is redistributed to constitute a central hole-free URA with significantly large number of contiguous virtual sensors. Simulations verify the effectiveness of our proposed methods on increasing the DOFs and improving the DOA estimation performance.
The rest of this paper is organized as follows. In Section 2, the 2D data model and the concept of difference coarray are overviewed. Then, the structure of prototype planar coprime array is introduced. In Section 3, the 2D VCAM algorithm is proposed to generate the diff-sum coarray. Two 2D coprime configurations, i.e., CAACS and CATSS, are introduced in Section 4 and Section 5. Simulations provided in Section 6 compare the DOA estimation performance of our proposed array configurations with other conventional 2D arrays based on the proposed 2D VCAM algorithm. The results demonstrate the validity of the proposed configurations. Section 7 concludes the paper.
Notations: We use lower-case (upper-case) bold characters to denote vectors (matrices), and double-line characters to denote sets. implies the transpose, whereas and denotes complex conjugation and complex conjugate transpose of a matrix or vector, respectively. denotes the vectorization operator that turns a matrix into a vector. denotes a diagonal matrix with the elements of as the diagonal elements, whereas denotes the determinant of a matrix . ⊗ implies the Kronecker product and ⊙ implies the KR product. We use × between two value ranges to denote the 2D value range, and after a value range to denote that the ranges are the same in two dimensions.
2. Preliminaries
2.1. Data Model
Suppose D narrowband, far-field, uncorrelated deterministic plane wave sources with power of for impinging to a planar array. Notice that the multipath effect is not considered. The planar array consists of N sensors located at , where for is an integer vector forming the sensor locations set , and is the unit interval between sensors with being the wavelength. denotes the reference of array and is set to be the origin (0,0). The ith signal () can be represented as where denotes the deterministic complex amplitude, and is a small frequency offset [32]. The received signal at the jth sensor can be expressed as:
where with and being the azimuth and elevation angles of the ith source, is the additive spatially white Gaussian noise with zero mean and variance . Note that and are uncorrelated. Rewriting Equation (1) in vector form, we have:
where , , , is the array manifold matrix, is the noise vector.
The covariance matrix of can be expressed as
where . In practice, the data covariance matrix can be estimated by collecting K snapshots of the received signal from the planar array, i.e.,
Vectorizing in Equation (3) yields
where , , and ⊙ represents the Khatri–Rao product. As the th entry in has the form , can be regarded as an equivalent signal vector received from a virtual difference coarray , with sensors located at the difference lags.
2.2. Prototype Planar Coprime Array
A prototype planar coprime array (PPCA) is illustrated in Figure 1, where and are coprime integers. Without loss of generality, we assume . The PPCA consists of two uniform square subarrays. Subarray has sensors with interval while subarray has sensors with interval .
Figure 1.
The prototype planar coprime array configuration.
Construct two base matrices and , which generate the base units of the two subarrays. Then, the PPCA sensors are located at
where and . In this paper, we use to represent the value ranges from to by step . For simplicity, we normalize the unit interval d to be one in the following representations. As and are coprime, the two subarrays share only one overlapped sensor at position (0, 0), and the total number of sensors is .
As there are two subarrays, the difference coarray can be separately considered as the self-difference coarray and the cross-difference coarray, where the cross-difference coarray can be further divided into forward and backward sets. The self-difference coarray, which is the union of the difference sets of the two subarrays themselves, has sensors at
where and . In addition, the forward cross-difference coarray has sensors at
where and . The corresponding mirrored backward cross-difference coarray has sensors at . In the consequence, the entire set of sensor positions in the difference coarray is
For the sake of evaluating the performance of arrays with the concept of coarray, the definition of DOFs in this paper is established as follows.
Definition 1
(Degrees of freedom). For a planar array with the concept of coarray, let denotes the corresponding coarray, and denotes the URA with the maximum number of consecutive virtual sensors in . Then, the cardinality of and is called DOFs and uniform DOFs (uDOFs) respectively.
An example of difference coarray of PPCA is illustrated in Figure 2, where and . The two largest URA areas (which have the same uDOFs) in the difference coarray are marked. The consecutive range is (denoted as ) or , and the uDOFs is 81. Note that there are some “holes” in the difference coarray, which limit the uDOFs. A main purpose of this paper is to improve the geometry of PPCA and obtain higher uDOFs.
Figure 2.
An example of the difference coarray of prototype planar coprime array (PPCA), where and .
3. 2D Vectorized Conjugate Augmented MUSIC Algorithm
In this section, we improve the Vectorized Conjugate Augmented MUSIC (VCAM) algorithm [30] and apply it onto 2D DOA estimation.
3.1. The Proposed Method and Coarrays
The first step is to construct the conjugate augmented correlation vector based on the second-order statistics, by utilizing both the temporal and spatial information of the received signals. By collecting K samples of the first sensor output and the jth sensor output with delay , we obtain the sample vectors and [32]. By calculating the time average function of and , we can obtain
Note that signals and noise are uncorrelated, which means the cross terms between them are 0. Therefore, can be simplified as
where , and . When and K is sufficiently large, . Besides, as is zero-mean white Gaussian noise, we have . Consequently, can be further simplified as
where .
Notice that has the same form as the source signal, it can be treated as an equivalent signal from the same direction as the original source with power of . By stacking all the vectors , we have
where and . is the array manifold matrix mentioned before in Section 2.1. Then we invert to and take the conjugate to get
The conjugate augmented correlation vector can be constructed by combining Equations (13) and (14) as
where with .
Suppose that we take pseudo snapshots with the pseudo sampling interval , which is set to satisfy the sampling theorem, we can construct the pseudo-data matrix of as [33]
where and with .
Similar to Equation (4) in Section 2, the covariance matrix of can be estimated by:
where the th entry of the resulting matrix of has the form . Let , and notice that, when and is sufficiently large, . Then we have .
Vectorizing in Equation (17) yields
where . The ith column of has the form
where is the same as the ith column of in Equation (5), while is the conjugate form. They contain the information of difference coarray. As for and , each element has the form of for , which contains the information of the sum coarray, defined by the following definition:
Definition 2
(Sum Coarray). Suppose a 2D planar array whose sensors are specified by . The sum coarray consisting of both the positive and the negative summation of each sensor pairs in is defined as
The sum coarray can be considered as the union of self-sum coarray and cross-sum coarray.
Consequently, behaves like the equivalent signals received from a virtual array with array manifold . The virtual array has both the difference and the sum coarray, defined by:
Definition 3
(Diff-sum Coarray). Suppose a 2D planar array whose sensors are specified by , its diff-sum coarray is the union of both the difference coarray and the sum coarray:
Similarly, the diff-sum coarray can be divided into the self-diff-sum coarray and the cross-diff-sum coarray.
3.2. 2D SS-MUSIC Method
Note that the rank of is one. The subspace based DOA estimation methods, such as MUSIC and ESPRIT, fail to get correct results. In order to solve this problem, we apply the spatial smoothing method [8] to restore the rank. As this method requires a consecutive virtual array, we take average of all the repeated lags in Equation (19) and sort the resulting lags in ascending order. Then, we extract all the consecutive lags of in the range . As a result, we obtain a new vector denoted as
where is a matrix. can be treated as the array manifold of a URA ranging in . Divide this virtual URA into subarrays, , for and , each with virtual sensors located at . Finally, we can apply the subspace based DOA estimation methods, like MUSIC and ESPRIT, to the following full rank covariance matrix
to estimate the DOAs of the signals.
3.3. Complexity Analysis
The computation of the proposed algorithm can be divided into the following three stages:
(1) Construct and the corresponding . For each time delay , can be obtained by the time average function with K snapshots, taking operations. Thus, the conjugate augmented correlation vector needs operations to construct. By collecting pseudo snapshots of , the pseudo data matrix needs operations to construct. The total complexity of the corresponding covariance matrix is . Since we take , the total complexity is .
(2) Establish by 2D spatial smoothing method. According to Equation (23), is implemented by the spatial smoothed subarray . Let and so that is a URA. Since each term in Equation (23) takes multiplications, the total cost for establishing is .
(3) MUSIC spectra. For 2D MUSIC algorithm, since we have obtained the covariance matrix , the major computational complexity of it is caused by an Eigen-Value Decomposition (EVD) step, and a spectral search step. According to [25], the computational complexity of 2D MUSIC is given as , where J denotes the number of spectral points of the total field-of-view.
As a consequence, the total computational complexity of 2D VCAM is . In the 2D spectral based methods, we usually have , which means the complexity of spectral search is much heavier than that of constructing . Therefore, the complexity of 2D VCAM can be approximately given as .
Table 1 illustrates the computational complexity comparison of different 2D DOA estimation methods applied on PPCA, including the 2D MUSIC algorithm, the total spectral search (TSS) method [25], the partial spectral search (PSS) method [25], and the proposed 2D VCAM. Since refers to the size of the diff-sum coarray, which should be much larger than the PPCA, the complexity of 2D VCAM might be heavier than the other methods. However, the generated virtual array brings much higher uDOFs that can enhance the performance of DOA estimation.
Table 1.
Computational complexity comparison.
4. Coprime Array with a Compressed Subarray
As illustrated in Figure 2, there are many “holes” in the difference coarray of PPCA. To remedy these holes, we propose two novel array configurations to improve increase the consecutive aperture. The first configuration named coprime array with a compressed subarray (CAACS) is presented in this section, whereas the second configuration named coprime array with two separated subarrays (CATSS) is provided in Section 5.
Based on the PPCA geometry, we suppose two subarrays with and sensors respectively, where and are coprime. Besides, we require either or not to be a prime number. Similar with the CACIS configuration [10], we introduce a positive integer compression factor p to change the inter-element spacing of one subarray. We assume that can be treated as the product of p and another positive integer , i.e.,
where . It is obvious that is also coprime with since and share no common factors other than unity. Figure 3 shows an example of the concept of CAACS configuration, where . It can be seen that, in this array configuration, subarray still has elements with interval of , whereas subarray has elements with interval . As a result, the coprime array in this configuration can be considered that the sensor interval of one subarray of the original coprime array is compressed by an integer factor of p, which leads to the proposed CAACS.
Figure 3.
The compression process of a coprime array with a compressed subarray (CAACS) configuration, where , and .
In this configuration, the self-difference set of the two subarrays becomes
where and . The forward cross-difference set between the two subarrays becomes
where and . denotes the base matrix generated by .
According to the definition of the sum coarray, the entire set of sensor positions can be represented as
where and denote the positive and the negative self-sum coarrays, whereas and denote the positive and the negative cross-sum coarrays.
The positive self-sum coarray has virtual sensors located at
where and . In addition, the positive cross-sum coarray has virtual sensors located at
where and . and have sensors located at the mirrored positions of and , respectively.
Meanwhile, the corresponding diff-sum coarray can be represented as
The properties of the difference coarray and the sum coarray are summarized respectively in the following propositions.
Proposition 1.
The following facts hold for the difference coarray of CAACS:
(a) There are different 2D integers in the set and respectively.
(b) contains a URA area that consists of all the consecutive 2D integers in the set . contains a URA located at the mirrored positions.
(c) The self-difference in the first and third quadrants and that on the X and Y axis form a subset of the cross-difference.
(d) There are “holes” in the range of located at , where are integers.
The proof of Proposition 1 is provided in Appendix A. Figure 4a shows an example of the difference coarray of CAACS with . In this case, the forward cross-difference set consists of 144 unique 2D integers, among which 100 integers in are consecutive. The backward cross-difference set have the same number of unique 2D integers with consecutive ones in the range . The two URAs of the cross-difference coarray are marked by solid rectangles. Compared with Figure 2, the uDOFs increase from 81 to 100. We can make use of these enlarged hole-free virtual URAs to execute DOA estimation and get better performance.
Figure 4.
An example of coarrays of CAACS, where , and . (a) The difference coarray. (b) The sum coarray. (c) The cross-diff-sum coarray.
As for the sum coarray of CAACS, it turns out to be:
Proposition 2.
The following facts hold for the sum coarray of CAACS:
(a) There are different 2D integers in set and set . and have only one overlapped point, i.e., the origin (0, 0).
(b) contains a URA area that consists of all the consecutive 2D integers in set . contains a URA located at the mirrored positions.
(c) The positive self-sum coarray contains all the elements of the physical array, .
(d) There are “holes” in the range of located at , where are integers.
The proof of Proposition 2 is provided in Appendix B. Figure 4b shows an example of the sum coarray of CAACS with . There are 144 unique virtual sensors in the positive cross-sum coarray and 100 of them are consecutive, ranging in . The negative cross-sum coarray is symmetric with the positive cross-sum coarray about the origin.
We can draw a conclusion from the above two propositions that for specific coprime integers and , smaller values of (or in other words, larger values of p) result in a larger URA area, which also means higher uDOFs in the coarray. The maximum value that p can take is , and the Sensor Configuration I of the 2D nested array structure in [23] is the special case of the CAACS configuration.
Remark 1.
It can be seen that the self-diff coarray and self-sum coarray make little contribution to increasing the range of the URA area. As mentioned in the previous section, we intend to utilize the contiguous sensors to execute subspace-based DOA estimation, and we only take the cross-coarrays into account in the rest of this paper. Figure 4c illustrates the cross-diff-sum coarray of the CAACS configuration. The cross-diff coarray and the cross-sum coarray have the same construction, in particular, the same size of consecutive areas. Although the URAs in the cross-sum coarray fail to complement the URAs in the cross-diff coarray as we expected, the distribution of the diff-sum coarray of CAACS inspires us with another novel array configuration to utilize those DOFs, which is introduced in detail in Section 5. Note that in the simulation of CAACS, we use the URA in to conduct DOA estimation.
5. Coprime Array with Two Separated Subarrays
In Section 4 we have found that all the cross-coarrays of CAACS contain hole-free URAs. It is obvious that the diff-sum coarray of CAACS can increase the DOFs and the antenna aperture significantly in comparison with PPCA. However, as we can see in Figure 4c, the cross-coarrays distribute diagonally with only part of their sensors overlapped. Although the total number of consecutive virtual sensors increases, we still fail to make full use of the diff-sum coarray. Note that the four coarrays have the same geometry, which inspires us to rearrange them properly so that an even larger virtual URA can be acquired. This leads to the following array configuration named coprime array with two separated subarrays (CATSS).
Based on the configuration of CAACS, the following steps can further optimize the array geometry. First, all the sensors in are moved vertically by to make and be on opposite sides of the axis as illustrated in Figure 5a. Next, move the sensors of horizontally in the positive direction until the entire physical array is bilaterally symmetrical, as demonstrated in Figure 5b. We rebuild the plane coordinate system as follows: (1) let the line where the lower edge of falls in be the axis; (2) let the symmetry axis of and be the axis; (3) so that the cross point of them is the new origin O. From now on, we use to denote coarrays of CATSS.
Figure 5.
Translation process of the coprime array with two separated subarrays (CATSS) configuration, where , , and . (a) Step 1: Move by vertically. (b) Step 2: Move horizontally to make the whole array bilaterally symmetrical. (c) Step 3: Move by l vertically.
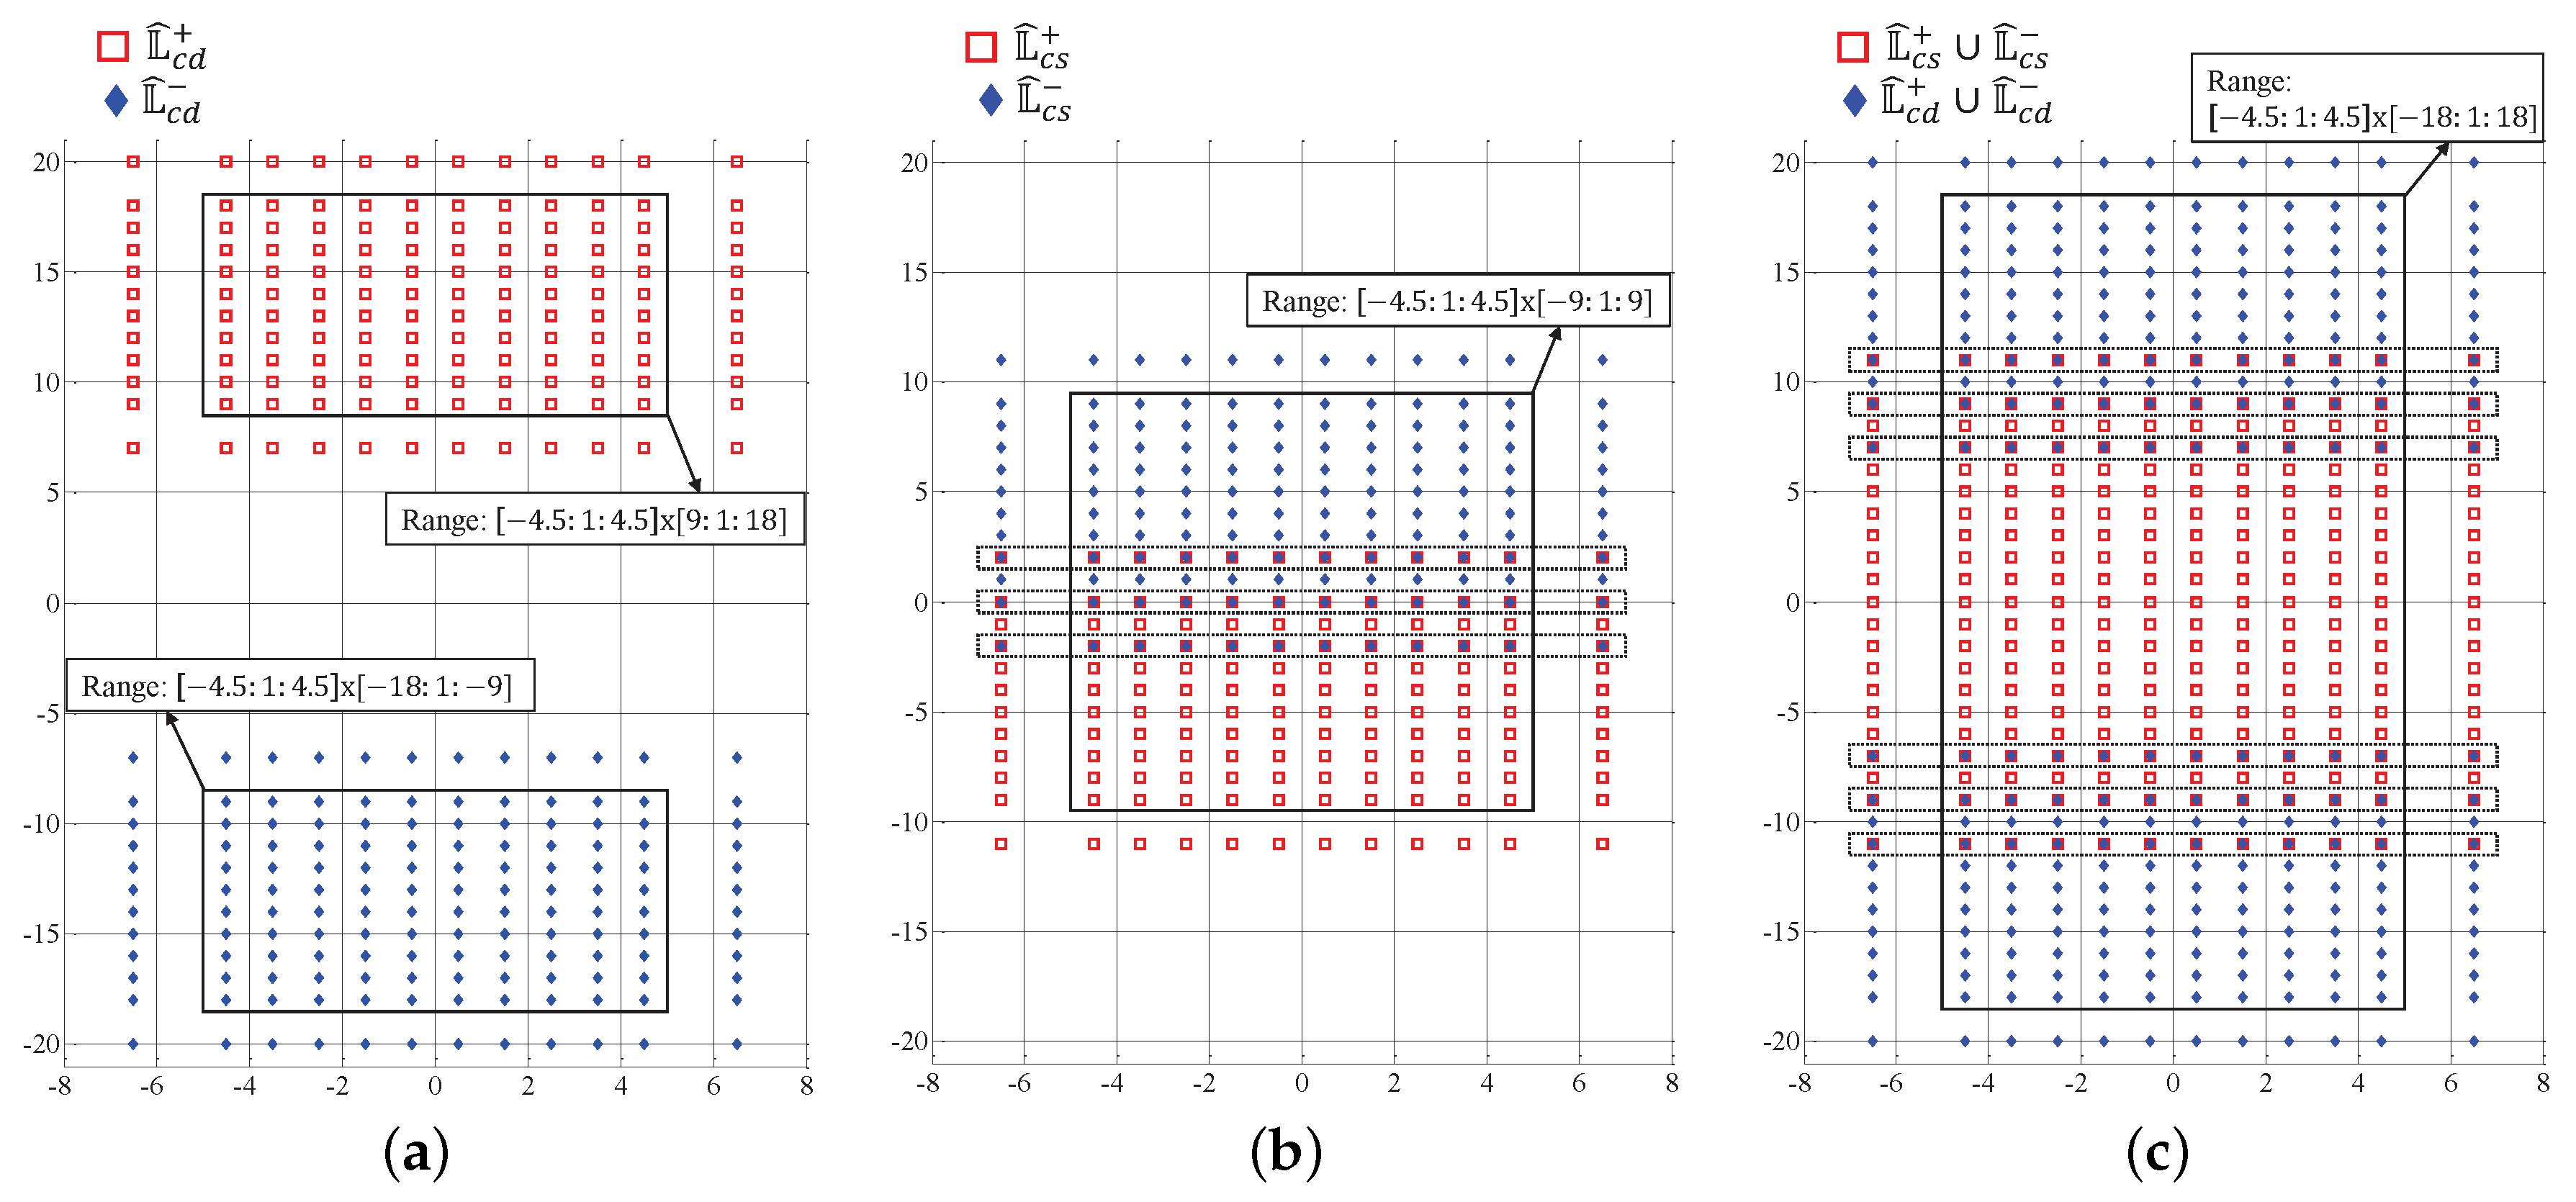
Figure 6 shows an example of the resulting cross coarrays of CATSS. It can be seen that the four cross coarrays are moved to the center of the coordinate plane and are aligned with the same horizontal distribution. and locate at the opposite side of the axis. The range of the virtual URA in is demonstrated in Figure 6a. Besides, the virtual URAs in and overlap around the axis and form a new consecutive area, as shown in Figure 6b. Consequently, the resulting cross-diff-sum coarray contains a central URA which is joined by all four cross coarrays, as illustrated in Figure 6c. The new central URA has 230 contiguous virtual sensors located at , which is a significant enhancement comparing with the CAACS configuration in Figure 4.
Figure 6.
Cross coarrays of CATSS, where , , , and . (a) The cross-difference coarray. (b) The cross-sum coarray. (c) The cross-diff-sum coarray. Dashline boxes mark the overlapped area of the coarrays in each subfigure.
Despite the fact that the cross coarrays have already been joined together to construct a central URA, there is still a large number of overlapped virtual sensors in the URA area. The overlapped areas between and are marked by dashed rectangles in Figure 6b, while the overlapped areas between the cross-difference coarray and the cross-sum coarray are also marked in Figure 6c. By introducing a proper integer separation l between the two subarrays, the overlap can be reduced so that the DOFs of the resulting cross-diff-sum coarray can be further increased. Specifically, keep unchanged, while is shifted along the axis by l in the negative direction. Note that must be held to keep the central URA consecutive. Figure 5c shows this operation and Figure 7 illustrates the corresponding cross coarrays with , , and the separation . As shown in Figure 7a, it is clear that the cross-difference coarray has no overlap between and . Meanwhile, the overlap between and has been reduced to only three lines as illustrated in Figure 7b. It can be readily verified that the resulting cross-diff-sum coarray in Figure 7c contains more unique virtual sensors and a much larger central URA in comparison with the cross-diff-sum coarray in Figure 6c. Note that the overlap between cross-difference coarray and cross-sum coarray has been reduced to only six lines.
Figure 7.
Cross coarrays of CATSS, where , , and . (a) The cross-difference coarray. (b) The cross-sum coarray. (c) The cross-diff-sum coarray. Dashline boxes mark the overlapped area of the coarrays in each subfigure.
In the CATSS configuration and under the new coordinate system, sensors of the two subarrays are located at
where , and .
Thus, the self-difference set of the two subarrays is
where , The forward cross-difference set between the two subarrays becomes
where and . denotes the mirrored backward cross-diff set. Moreover, the positive self-sum set and the positive cross-sum set are changed into
and
where , , , and . is the mirrored negative self-sum set and is the mirrored cross-sum set.
We also summarize the properties of the difference coarray and the sum coarray of CATSS in the following proposition.
Proposition 3.
The following facts hold for CATSS:
(a) There are different elements in set and respectively.
(b) When , , and have a sole overlapped row on the horizontal axis, whereas when they are completely apart.
(c) contains all the consecutive 2D integers in set
while contains all the consecutive 2D integers in set
(d) When either or is even, ; when both and are odd, is partly overlapped with .
(e) The holes in the range of are located at
while the holes in the range of are located at
where and are integers.
The proof of Proposition 3 is provided in Appendix C. Proposition 3c shows that sensors in all the cross coarrays have the same distribution in the horizontal direction. Proposition 3d and its proof illustrates that sensors in the self coarrays are sparsely distributed in both x and y coordinates. Besides, they either fall only 0.5d apart from the cross sensors, or are partly overlapped in the consecutive range. This infers that the self coarrays make no contribution to increase the uDOFs. From Proposition 3e we can deduce that the adjacent cross coarrays can complement their holes with each other. The above facts guarantee that the diff-sum coarray of CATSS contains a hole-free central URA formed by all cross coarrays. Figure 7 provides a direct example of Proposition 3. All four cross coarrays have virtual sensors consecutive in the range . Meanwhile, and are completely apart while and are continuous with only three lines of overlap. Moreover, it can be find that the lower bound of the y range in Figure 7b is the upper bound of the y range of in Figure 7a. This fact means that the URAs in cross-diff coarray and cross-sum coarray can be joined together without any holes. Figure 7c shows the resulting cross-diff-sum coarray, which contains a significantly large central URA with 370 virtual sensors consecutive in .
Note that the sensor positions in the vertical direction and the final range of the central URA are relevant to the value of the separation l, which leads to the following proposition:
Proposition 4.
The CATSS configuration yields a virtual diff-sum coarray such that:
(a) Holes below can be complemented by , while holes upon can be complemented by .
(b) When integer separation l takes value in the range , and form a hole-free URA whose range increases as l grows. When l grows to , a “broken rows” of holes appears at axis between and .
(c) When l takes a proper value in the range of (b), the cross-diff-sum coarray contains all the consecutive 2D integers in the range
The proof of Proposition 3 is provided in Appendix D. Proposition 3a denotes that the difference coarray and its adjacent sum coarray of CATSS always keep their complementarity so that their consecutive areas can always be joined together. In general, the overlap between two sum coarrays decreases as the separation l increases, which also means that the final range of the central URA increases. However, when l exceeds a certain bound, the adjacent sum coarrays would lose their complementarity, and a row of holes would appear between and . Figure 8 gives an example of the property (b) of the above proposition. Compared with Figure 7b, a row of holes appears between and when , since the upper bound of l is 7 in this example.
Figure 8.
Broken row (or row of holes) appears between and , when .
6. Simulation Results
6.1. DOF Comparison
In this sub-section, we provide the comparison of uDOFs of our proposed array configurations and several other 2D array configurations. The selected array configurations are difference coarray of PPCA, difference coarray of 2D nested array Configuration II [23], difference coarray of CAACS, and diff-sum coarray of CATSS.
Table 2 lists the uDOFs expressions of the above array configurations and the generated uDOFs when the number of physical sensors vary from 24 to 144. Figure 9 illustrates the results of the simulation of uDOFs. It can be seen that the diff-sum coarray of CATSS generates the highest uDOFs in all cases, followed by the difference coarray of 2D nested array. This result comes from the fact that CATSS combines the consecutive part of all difference and sum coarrays, and that 2D nested array combines its positive and negative difference coarrays with only one overlapped line. As the number of sensors increases, the uDOFs of CATSS are significantly enhanced. Note that when the number of sensors is 96, CAACS and CATSS can have two kinds of configurations as the value of compression factor p varies. We select the configuration that generates the highest uDOFs in the simulation. This simulation verifies the increasing of uDOFs from PPCA to our proposed CAACS and CATSS.
Table 2.
Uniform degrees of freedom (uDOFs) comparison of different array configurations.
Figure 9.
Uniform DOFs (uDOFs) comparison of different array configurations.
6.2. DOA Estimation
In this sub-section, we take several numerical experiments to demonstrate the superiority our proposed planar coprime array configurations. Assume uncorrelated sources with 2D directions distributed at impinge onto the PPCA, 2D nested array in [23], CAACS, and CATSS, respectively. For a fair comparison, we set the total number of physical sensors for all array configurations as . Thus, the two subarrays are of size and . The compression factor for CAACS and CATSS is and the separation for CATSS is . The corresponding uDOFs for difference coarray of PPCA, difference coarray of 2D nested array, difference coarray of CAACS, and diff-sum coarray of CATSS are 324, 4005, 1369, and 5661 (found in Table 2). Different DOA estimation methods are applied to these array configurations. We use the SS-MUSIC method to work with the difference coarray of PPCA, CAACS, and 2D nested array, while CATSS is with the proposed 2D VCAM algorithm. The searching steps for all spectral searching methods are set to be , so that the number of spectral points is .
Firstly, we compare the DOA estimation results of the six array configurations above. We sample snapshots of the received signals from the physical sensors of the arrays, and the pseudo snapshots for 2D VCAM satisfy . The SNR of the signals is set to be 0 dB. We take Monte-Carlo trials in these experiments, and Figure 10 shows the average DOA estimation results of these trials. As Figure 10a shows, the difference coarray of PPCA fails to estimate some DOAs due to its low uDOFs. In Figure 10b–d, we can see that all of 2D nested array, CAACS, and CATSS can hit the true DOAs precisely.
Figure 10.
The estimated 2D direction-of-arrivals (DOAs) (denoted by ∘) and the true 2D DOAs (denoted by *) for (a) the difference coarray of prototype planar coprime array (PPCA), (b) the difference coarray of 2D nested array, (c) the difference coarray of CAACS, and (d) the diff-sum coarray of CATSS. The SNR is 0 dB. The number of snapshots is .
Next, we study the RMSE performance of these array configurations under different SNRs in the setting with snapshots at each SNR. We also study the RMSE performance under different number of snapshots with the SNR fixed as 0 dB. The Cramér–Rao bound (CRB), computed according to formulas provided in [34], is plotted as the benchmark. Note that the RMSE here is defined as
where and are the estimates of and for the ith Monte-Carlo trial, . Here we take independent Monte-Carlo trials for both experiments.
Figure 11 represents the RMSE results of the different array configurations examined at different SNRs. The SNR varies from −10 dB to 10 dB. The difference coarray of PPCA performs the worst due to its low uDOFs. In contrast, the 2D nested array and both the proposed CAACS and CATSS outperform the PPCA configuration since their uDOFs are much higher. CAACS and CATSS begin to get better performance than the 2D nested array when the SNR is greater than 0 dB. The performance of the proposed CATSS improves obviously as the SNR gets larger, and is close to its corresponding CRB. Therefore, our proposed array configurations are proved to be effective when the SNR is greater than 0 dB.
Figure 11.
RMSE as a function of SNR for different array configurations with , . The number of snapshots is , and the pseudo snapshots satisfy .
Figure 12 represents the RMSE results of the different array configurations examined at different numbers of snapshots. The SNR is set to be 0 dB in this experiment. The number of snapshots K varies from 100 to 500 by a step of 100. The difference coarray of PPCA still fails to obtain satisfying performance even if the snapshots become as large as 500. The RMSE of both CAACS and 2D nested array remains almost the same as K increases. CAACS performs a little better than 2D nested array when . Besides, CATSS outperforms all the other configurations and its performance is close to the corresponding CRB. This should be due to the great uDOFs of CATSS as well as both the spatial and temporal information used in the 2D VCAM method. This simulation verifies the superiority of our proposed configuration once again.
Figure 12.
RMSE as a function of snapshots for different array configurations with , . The SNR is 0 dB, and the pseudo snapshots satisfy .
Remark 2.
The simulation results above have verified the superiority of the CATSS configuration with the 2D VCAM method used. It should be noted that the 2D VCAM method might be applied to not only non-cooperative radar systems, but also cooperative settings, to estimate directions of multiple simple pulse radars. In a cooperative radar system, there are Q tags to be localized, which can be instructed by a central control node to actively transmit mutually orthogonal sinusoidal waveforms with constant amplitude, frequency, and phase. By choosing a set of appropriate frequencies for these signals, the performance of 2D VCAM method can be improved. Thus, a cooperative radar system might make full use of the outstanding performance and high DOFs brought by the 2D VCAM method.
7. Conclusions
In this paper, we have utilized the 2D VCAM algorithm to generate a diff-sum coarray and proposed two improved array configurations to enhance the performance of the 2D coprime array, namely compressing the inter-element spacing of one subarray, and introducing a proper separation between two subarrays. The first configuration yields hole-less coarrays with larger consecutive areas, whereas the second configuration rearranges the coarrays to make them fill up the holes of each other and constitute an impressively large consecutive area. The properties of the proposed array configurations are analyzed and the performance of DOA estimation are examined together with the PPCA and 2D nested array. The simulation results shows that both the two operations supply significant improvement to the performance of the array. The CATSS configuration achieves the lowest DOA estimation error and the best performance among all examined array configurations.
Author Contributions
Methodology, G.W.; investigation and validation, G.W. and Z.F.; data curation and formal analysis, G.W. and S.R.; supervision, Z.F.; writing—original draft preparation, G.W. and S.R.; writing—review and editing, X.L. All authors have read and agreed to the published version of the manuscript.
Funding
This research was supported by the National Natural Science Foundation of China (Grant No. 61801024).
Conflicts of Interest
The authors declare no conflict of interest.
Appendix A. Proof of Proposition 1
(a) Since the two subarrays and have and elements respectively, the forward cross-difference coarray consists of virtual elements. We then prove it using contradiction. Denote and as two arbitrary points in set , where , , , . Had been held, we would have
Since and , Equation (A1) cannot be held due to the coprimality of and , i.e., and cannot be equal. Thus, there are different integer elements in set . For the mirrored backward cross-different coarray , we can have the same conclusion through the similar way.
(b) Given an arbitrary integer point in set satisfying
Our purpose is to prove that there exist integer vectors and such that holds. The requirement can be rewritten as , which is equivalent to
This relationship can be equally expressed as , which implies . Because is an integer vector, Equation (A4) is equivalent to , which is satisfied in .
(c) Because the two subarrays share the first sensor at the origin, the self-differences in the first and third quadrants and that on the X and Y axis can be taken as the cross-differences between every sensor of one subarray and the first sensor of the other subarray. Thus, .
(d) We use contradiction to prove the sufficiency of this property. Suppose holds for some integer vectors and . When where and , the relationship
must be valid. Since and , we have . Due to the comprimality between and , there is no such integer that satisfies Equation (A5). Similarly, when , the relationship
must be valid. Since and due to the comprimality between and , there is no such integer that satisfies Equation (A6). Same results can be obtained for the y coordinate. Therefore, the assumption cannot be hold, i.e., there are holes located at .
As for the necessity, we need to prove that contains all holes within the boundary of . Equivalently, we need to check the number of elements in . From the expression of and Proposition 1a, it is easy to know that the total number of holes within the boundary of is
According to the expression of and Proposition 1b, we need to verify how many pairs of exist in the inequation and , where , . The two inequations above can be simplified to the same form as
Combining Equation (A8) and the condition , we have . Assume that and then it becomes . If , we have . Here, means the integer no more than the expression inside. Absolutely, there are pairs of in this case. If , we have so that there are pairs. By putting the above two cases in pair, we can find pairs of satisfy Equation (A8). Similarly, and are also in pair to generate pairs of . When is even, there are in total pairs of . When is odd, then must be odd. In this case, pairs of exist with left. When , we have . As such, we have in total pairs of .
The same result can be easily obtained when by considering a we can acquire on condition that b changes in the range . In this situation, and are in pair. The final total number of pairs of can be verified to be as well.
Consequently, the total nunmber of holes in is four times the number of pairs of above, except for the repeats caused by the cross points of in , i.e.,
It can be easily verified that above is equvalent to in Equation (A7) which has proved the necessity of the property.
Appendix B. Proof of Proposition 2
(a) Similar to Proposition 1, there are virtual elements in and respectively. We still use contradiction to achieve the following proof. Denote and as two arbitrary points in set , where , , , . Had been held, we would have
Since and , Equation (A10) cannot be held due to the coprimality of and , i.e., and cannot be equal. Thus, there are different integer elements in set . For the mirrored negative cross-sum coarray , we can have the same conclusion through the similar way.
Besides, according to the definition of the sum coarray, we can easily find that the 2D coordinates of all points in are not negative, while the 2D coordinates of all points in are not positive. Thus, and have no overlapped point other than the origin (0, 0).
(b) Given an arbitrary integer point in set satisfying
We intend to prove that there exist integer vectors and such that holds. The requirement can be rewritten as , which is equivalent to
This relationship can be equally expressed as , which implies . Because is an integer vector, Equation (A13) is equivalent to , which is satisfied in .
(c) As shown in Equations (6) and (28), the expression of sensor positions of the physical array and that of the positive cross-sum coarray have the same formation, while the ranges of vector and are different. Because and , the positive cross-sum set contains all elements in the physical array set, i.e.,
(d) We use contradiction to prove the sufficiency. Suppose holds for some integer vectors and . When where and , the relationship
must be valid. Since and , we have . Due to the comprimality between and , there is no such integer that satisfies Equation (A14). Similarly, when , the relationship
must be valid. Since and due to the comprimality between and , there is no such integer that satisfies (A15). Same results can be obtained for the y coordinate. Therefore, the assumption cannot be hold, i.e., there are holes located at .
The necessity can be proved in the similar way of Proposition 1d. It is easy to know that the total number of holes within the boundary of is the same as in Equation (A7). We need to verify how many pairs of exist in the inequation and , where , . The above two inequations can be simplified to the same form as Equation (A8). Thus, the rest of the proof is completely the same as Proposition 1d.
Appendix C. Proof of Proposition 3
(a) This property can be directly obtained from Proposition 1a and Proposition 2a.
(b) As , , and , we calculate the value range of y axis of . The result turns out to be
Therefore, the mirrored has
As , and overlap on the axis if and only if . When , the value range of their y axis are completely apart.
(c) By analyzing the constuction process of CATSS, we can figure out that is derived from with all its elements moving by vector . Thus, the consecutive range of can be expressed as
Similarly, the consecutive range of can be derived from Proposition 2b, i.e.,
It is easy to find that , and that when , . We can also confirm that the union of all self- coarrays is still a sparse array in both x and y coordinates.
According to Equations (33) and (35), when either or is even, elements in , , and fall in the positions whose x coordinates are 0.5d away from the integers. However, from Equations (32) and (34) we know that elements in the self- coarrays fall in the integer positions. Thus, .
When both and are odd, elements in , , and also fall in the integer positions. Note that has virtual sensors located at the integer positions around the origin with inter-element spacing or , and the boundary of and is larger than that of the consecutive part in Proposition 3c. There must be elements in falling in the range of the consecutive part in the cross- coarrays. Thus, is partly overlapped with .
(e) Holes in can be easily obtained by shifting the holes in CAACS (Proposition 1d) with . Meanwhile, holes in can also be easily obtained by shifting the holes in CAACS (Proposition 2d) with .
Appendix D. Proof of Proposition 4
(a) The first half of this property means that given an arbitrary integer point satisfying
we intend to prove that there exist integer vectors and such that holds. Actually, we only need to prove
holds. By simplifying Equation (A19) we can get . Absolutely, we can find integer and to satisfy this relationship.
As for the second half of this property, we intend to prove that there exist integer vectors and such that holds, where satisfies
We only need to prove
holds. By simplifying Equation (A21) we can get . Since and , we can find integer and to satisfy this relationship.
(b) According to Proposition 3c, the upper bound of y coordinate in the consecutive range of is . Meanwhile, the lower bound of y coordinate in the consecutive range of is . Obviously, when , the consecutive range of and are partly overlapped. When l grows to , only one overlapped row remains so that the hole-free URA reaches the largest range.
When , holes below are falling in the set . Since and , holes fall in the axis. For the mirrored , holes also fall in the axis. Thus, a broken row appears.
(c) This property can be easily obtained by combining the consecutive range of and in Proposition 3c. Since the four cross- coarrays complement their neighbors according to (a) and (b), the URA in the final diff-sum coarray ranges from the lower bound of to the upper bound of , i.e.,
References
- Zhang, W.; Liu, W.; Wang, J.; Wu, S. Computationally efficient 2-D DOA estimation for uniform rectangular arrays. Multidimens. Syst. Signal Process. 2014, 25, 847–857. [Google Scholar] [CrossRef]
- Heidenreich, P.; Zoubir, A.M.; Rubsamen, M. Joint 2-D DOA estimation and phase calibration for uniform rectangular arrays. IEEE Trans. Signal Process. 2012, 60, 4683–4693. [Google Scholar] [CrossRef]
- Pal, P.; Vaidyanathan, P.P. Nested Arrays: A Novel Approach to Array Processing With Enhanced Degrees of Freedom. IEEE Trans. Signal Process. 2010, 58, 4167–4181. [Google Scholar] [CrossRef]
- Shen, Q.; Liu, W.; Cui, W.; Wu, S. Extension of nested arrays with the fourth-order difference co-array enhancement. In Proceedings of the 2016 IEEE International Conference on Acoustics, Speech and Signal Processing (ICASSP), Shanghai, China, 20–25 March 2016; pp. 2991–2995. [Google Scholar]
- Liu, J.; Zhang, Y.; Lu, Y.; Ren, S.; Cao, S. Augmented nested arrays with enhanced DOF and reduced mutual coupling. IEEE Trans. Signal Process. 2017, 65, 5549–5563. [Google Scholar] [CrossRef]
- Liu, C.L.; Vaidyanathan, P. Super nested arrays: Linear sparse arrays with reduced mutual coupling—Part I: Fundamentals. IEEE Trans. Signal Process. 2016, 64, 3997–4012. [Google Scholar] [CrossRef]
- Liu, C.L.; Vaidyanathan, P. Super nested arrays: Linear sparse arrays with reduced mutual coupling—Part II: High-order extensions. IEEE Trans. Signal Process. 2016, 64, 4203–4217. [Google Scholar] [CrossRef]
- Pal, P.; Vaidyanathan, P.P. Coprime sampling and the MUSIC algorithm. In Proceedings of the 2011 IEEE Digital Signal Processing Workshop and IEEE Signal Processing Education Workshop (DSP/SPE), Sedona, AZ, USA, 4–7 January 2011; pp. 289–294. [Google Scholar]
- Vaidyanathan, P.P.; Pal, P. Sparse Sensing With Co-Prime Samplers and Arrays. IEEE Trans. Signal Process. 2011, 59, 573–586. [Google Scholar] [CrossRef]
- Qin, S.; Zhang, Y.D.; Amin, M.G. Generalized Coprime Array Configurations for Direction-of-Arrival Estimation. IEEE Trans. Signal Process. 2015, 63, 1377–1390. [Google Scholar] [CrossRef]
- Adhikari, K.; Buck, J.R.; Wage, K.E. Extending coprime sensor arrays to achieve the peak side lobe height of a full uniform linear array. EURASIP J. Adv. Signal Process. 2014, 2014, 148. [Google Scholar] [CrossRef]
- Shen, Q.; Liu, W.; Cui, W.; Wu, S. Extension of co-prime arrays based on the fourth-order difference co-array concept. IEEE Signal Process. Lett. 2016, 23, 615–619. [Google Scholar] [CrossRef]
- Wang, W.; Ren, S.; Chen, Z. Unified coprime array with multi-period subarrays for direction-of-arrival estimation. Digit. Signal Process. 2018, 74, 30–42. [Google Scholar] [CrossRef]
- Liu, C.L.; Vaidyanathan, P. Remarks on the spatial smoothing step in coarray MUSIC. IEEE Signal Process. Lett. 2015, 22, 1438–1442. [Google Scholar] [CrossRef]
- Tayem, N.; Kwon, H.M. L-shape 2-dimensional arrival angle estimation with propagator method. IEEE Trans. Antennas Propag. 2005, 53, 1622–1630. [Google Scholar] [CrossRef]
- Niu, C.; Zhang, Y.; Guo, J. Interlaced double-precision 2-D angle estimation algorithm using L-shaped nested arrays. IEEE Signal Process. Lett. 2016, 23, 522–526. [Google Scholar] [CrossRef]
- Dong, Y.Y.; Dong, C.X.; Zhu, Y.T.; Zhao, G.Q.; Liu, S.Y. Two-dimensional DOA estimation for L-shaped array with nested subarrays without pair matching. IET Signal Process. 2017, 10, 1112–1117. [Google Scholar] [CrossRef]
- Hoctor, R.T.; Kassam, S.A. The unifying role of the coarray in aperture synthesis for coherent and incoherent imaging. Proc. IEEE 1990, 78, 735–752. [Google Scholar] [CrossRef]
- Greene, C.R.; Wood, R.C. Sparse array performance. J. Acoust. Soc. Am. 1978, 63, 1866–1872. [Google Scholar] [CrossRef]
- Liu, C.L.; Vaidyanathan, P. Two-dimensional sparse arrays with hole-free coarray and reduced mutual coupling. In Proceedings of the 2016 50th Asilomar Conference on Signals, Systems and Computers, Pacific Grove, CA, USA, 6–9 November 2016; pp. 1508–1512. [Google Scholar]
- Liu, C.L.; Vaidyanathan, P.P. Hourglass Arrays and Other Novel 2-D Sparse Arrays With Reduced Mutual Coupling. IEEE Trans. Signal Process. 2017, 65, 3369–3383. [Google Scholar] [CrossRef]
- Ren, S.; Li, X.; Luo, X.; Wang, W. Extensions of Open Box Array with Reduced Mutual Coupling. IEEE Sens. J. 2018, 18, 5475–5484. [Google Scholar] [CrossRef]
- Pal, P.; Vaidyanathan, P. Nested arrays in two dimensions, part I: Geometrical considerations. IEEE Trans. Signal Process. 2012, 60, 4694. [Google Scholar] [CrossRef]
- Pal, P.; Vaidyanathan, P. Nested arrays in two dimensions, part II: Application in two dimensional array processing. IEEE Trans. Signal Process. 2012, 60, 4706–4718. [Google Scholar] [CrossRef]
- Wu, Q.; Sun, F.; Lan, P.; Ding, G.; Zhang, X. Two-dimensional direction-of-arrival estimation for co-prime planar arrays: A partial spectral search approach. IEEE Sens. J. 2016, 16, 5660–5670. [Google Scholar] [CrossRef]
- Zheng, W.; Zhang, X.; Zhai, H. Generalized coprime planar array geometry for 2-D DOA estimation. IEEE Commun. Lett. 2017, 21, 1075–1078. [Google Scholar] [CrossRef]
- Zhang, X.; Zheng, W.; Chen, W.; Shi, Z. Two-dimensional DOA estimation for generalized coprime planar arrays: A fast-convergence trilinear decomposition approach. Multidimens. Syst. Signal Process. 2019, 30, 239–256. [Google Scholar] [CrossRef]
- Vaidyanathan, P.; Pal, P. Sparse coprime sensing with multidimensional lattice arrays. In Proceedings of the 2011 Digital Signal Processing Workshop and IEEE Signal Processing Education Workshop (DSP/SPE), Sedona, AZ, USA, 4–7 January 2011; pp. 425–430. [Google Scholar]
- Vaidyanathan, P.; Pal, P. Theory of sparse coprime sensing in multiple dimensions. IEEE Trans. Signal Process. 2011, 59, 3592–3608. [Google Scholar] [CrossRef]
- Wang, X.; Chen, Z.; Ren, S.; Cao, S. DOA estimation based on the difference and sum coarray for coprime arrays. Digit. Signal Process. 2017, 69, 22–31. [Google Scholar] [CrossRef]
- Chen, Z.; Ding, Y.; Ren, S.; Chen, Z. A Novel Nested Configuration Based on the Difference and Sum Co-Array Concept. Sensors 2018, 18, 2988. [Google Scholar] [CrossRef]
- Shan, Z.; Yum, T.S. A conjugate augmented approach to direction-of-arrival estimation. IEEE Trans. Signal Process. 2005, 53, 4104–4109. [Google Scholar] [CrossRef]
- Xu, G.; Kailath, T. Direction-of-arrival estimation via exploitation of cyclostationary-a combination of temporal and spatial processing. IEEE Trans. Signal Process. 1992, 40, 1775–1786. [Google Scholar] [CrossRef]
- Mathews, C.P.; Zoltowski, M.D. Eigenstructure techniques for 2-D angle estimation with uniform circular arrays. IEEE Trans. Signal Process. 1994, 42, 2395–2407. [Google Scholar] [CrossRef]
© 2020 by the authors. Licensee MDPI, Basel, Switzerland. This article is an open access article distributed under the terms and conditions of the Creative Commons Attribution (CC BY) license (http://creativecommons.org/licenses/by/4.0/).