1. Introduction
Hybrid electric vehicles (HEVs) and electric vehicles (EVs) are worthy alternatives to the conventional, gasoline-only powered vehicles. As per a recent International Energy Agency (IEA) report on global EV outlook, these eco-friendly alternatives grew to represent 4% of the global vehicle market share from 2013 to 2018 and are expected to go beyond 40% by 2030 [
1]. A relatively low net energy density amongst HEVs and EVs makes the efficient and optimal utilization of energy necessary. Energy management algorithms enable these vehicles to perform efficiently and at optimal operation points within certain constraints.
HEVs have more than one source of propulsive energy, which makes energy management imperative and challenging. Variation in powertrain architectures among HEVs further diversifies the usable energy management strategies. In this article, we focus on an extended range electric vehicle (EREV) for energy management optimization research. An EREV can operate both as an EV and an HEV based on its battery or energy storage system’s (ESS) state of charge (SoC) [
2]. The SoC value represents the available energy in the ESS relative to its maximum energy storage capacity. While operating as an EV, the EREV utilizes only the ESS for its energy demands and operates in a charge depleting (CD) mode. Whereas, during its operation as an HEV, the EREV uses both the ESS and the range extender (REx) system to supply the required energy and operates in a charge sustaining (CS) mode. EREVs either have an on-board REx system or a trailer-mounted detachable REx system [
3]. The trailer-mounted detachable REx system allows the user to use REx only for long-distance journeys, thus increasing the opportunities for lower levels of fuel consumption and emissions [
4,
5].
As mentioned earlier, a distinct CD and CS operating mode is the conventional EREV energy management approach. Implementations of this strategy with a rule-based (RB) algorithm are well documented in the literature [
6,
7]. Researchers have extended this work by determining optimal operating points through offline optimization schemes [
8,
9,
10,
11,
12,
13]. To further improve system efficiency and operate close to optimal performance, real-time online optimization strategies have also been evaluated. The energy consumption minimization strategy (ECMS) is one such well documented and validated strategy [
14]. This strategy has proven useful for EREV energy management in the CS mode. In-production EREVs like the BMW i3 Rex and Chevrolet Volt also implement the distinct CD and CS strategy with an additional load-following strategy in CS mode. Moura et al. presented the blended CD/CS strategy as an alternative to the distinct CD/CS strategy [
15]. Here, the optimization algorithm determines the feasible combination of ESS and REx operation points which satisfy the cost function and additional constraints. Moura et al. also evaluated stochasticity in driving behavior and concluded that a blended strategy consistently provided a better fuel economy (in a range from 3.2% to 11.8%) over the conventional CD/CS strategy for the different driving behaviors. With no state feedback, this approach had limited real-time online implementation [
16,
17,
18]. For real-time online implementation, a combination of Markov decision process (MDP) and stochastic dynamic programming (SDP) has been implemented and validated in the model-in-loop (MiL) environment. The outcome of this approach showed ∼24% improvement over a simple RB strategy but was ∼4% worse than DP [
19,
20]. Recently published research has leveraged machine learning techniques to obtain optimal solutions for HEV energy management. Son et al. proposed an advanced RB mode control strategy for plug-in HEVs that used DP results for training and forming a predictive mode control map for real-time applications [
21]. Vatanparvar et al. [
22] developed a context-aware NARX (Nonlinear Autoregressive Exogenous) model to predict driver behavior for energy management, and Wang et al. [
23] implemented deep reinforcement learning on RB strategies for EREVs. Both of these research publications and other similar works have improved energy management algorithm functionality for real-time applications when there is limited future drive information. Chen et al. presented a dynamic programming and neural network-based energy management strategy which was evaluated in simulation for known and unknown driving distance and duration conditions [
24]. Xi et al. improved on this method and were also able to adjust the strategy for changes in driving distance during the drive [
25].
On the basis of our review, the majority of existing solutions are suboptimal. To obtain a global optimal solution, dynamic programming is the most sought after approach. However, as a result of its requirement for a priori information, a real-time online implementation is challenging. Stochastic approaches to estimate a priori information have enabled real-time online usage but estimation errors seldom result in a suboptimal solution. Estimations can be improved using machine learning techniques by training models using vehicle data. However, the initial computational expense and any future retraining of models for other scenarios poses a scalability challenge for in-vehicle implementation. Therefore, a method that can provide a good estimate of future driving behavior and can adapt to changes in real time while being close to the optimal solution is required. Additionally, the solution needs to be computationally inexpensive relative to more sophisticated techniques like machine learning.
To meet these requirements we propose a real-time online implementable energy management algorithm based on the adaptive real-time dynamic programming (ARTDP) approach. The proposed algorithm uses a forward propagating dynamic programming technique along with Google Directions application programming interface (API) to determine the average speed trajectory for the upcoming drive. The algorithm performs reoptimization calculation when the vehicle behavior deviates from the initial estimate. We tested our proposed algorithm on an average speed trajectory obtained from Google and its variants. Thus, the aim for our EREV energy management research is to (i) achieve the maximum feasible driving distance without recharging or refueling, and (ii) maintain the minimum feasible net energy consumption. The novelty in our proposed approach is in the implemented variant of ARTDP, which uses a driving distance constraint and integration of Google Direction API for future speed estimate.
This article is arranged as follows.
Section 2 provides an in-depth description of the EREV power loss model and its validation. This is followed by an evaluation and comparison of prominent EREV energy management algorithms in
Section 3; this section also presents our proposed algorithm in detail. In
Section 4, the results from our study and their interpretation and implications are discussed. Finally, a summary of the results draws a conclusion to this article in
Section 5.
2. EREV Modeling Methodology
The experimental research EREV referenced in this article is based on the 2016 Chevrolet Camaro platform.
Figure 1 represents the vehicle system architecture as implemented on the experimental research EREV. The key features of this vehicle are (i) independent dual-motor rear wheel drive with a custom gearbox, and (ii) 0.8L motorcycle engine retrofitted to run on E85 fuel [
26].
Table 1 lists the modeled operating parameters for the propulsion system components on the vehicle. The experimental research EREV modeled in this study performs within operational limits on its traction motors and REx system.
The model-based design approach is extensively used for the control development of complex systems. This process is an integral step in vehicular system control formulation. For the presented work, both the model-in-loop (MiL) and software-in-loop (SiL) simulation environment were used in the development, verification, and validation stages of the process. A power loss model for the EREV as shown in
Figure 2 was developed on the MATLAB/Simulink platform to simulate the key propulsion and energy storage systems on the research EREV. The model discards effects of the tires and propulsion system dynamics to reduce computational complexity. This approach is deemed sufficient as the core premise to effectively model power flow relative to the power demand during the simulated drive cycle.
The power flow model accepts the vehicle speed target (
) in
, and the road grade (
) in % as inputs to compute the total road load forces that the propulsion system needs to overcome. Equations (
1) and (
2) show the discrete-time road load equations in terms of power, as used in this model.
where,
is the net power demand from the propulsion system.
is the traction power required to achieve the target speed.
is the aerodynamic resistance power.
is the tire rolling resistance power.
is the climbing resistance power.
is the gross weight of the vehicle.
is the net passenger weight for two passengers.
is the drive cycle generated target speed.
is the drag coefficient.
is the density of air at Normal Temperature and Pressure.
is the frontal area of the vehicle.
is the rolling resistance coefficient.
- g
is the acceleration due to gravity.
is the road elevation angle.
As mentioned earlier, an EREV has an all-electric final propulsion to the wheels. Thus, the actual electric power demand from the ESS, i.e.,
, was computed as per Equation (
3). Here,
i.e., the propulsion system efficiency, is an estimated combined efficiency of the propulsion motor and the custom planetary gearbox used in the research vehicle. The efficiency map was developed as a function of motor torque (
) and motor speed (
). Details of this efficiency map estimation are provided in
Section 2.2.
The range extension on an EREV is feasible as a result of the REx system that serves as an auxiliary power unit (APU). The research vehicle referenced in this study uses an E85 fueled 0.8L ICE which is directly coupled to a Bosch SMG 180 electric motor/generator. This REx system supplies additional power to the electric traction motors and ESS to meet the electric power demand denoted by
and/or recharge the ESS. Electric power from REx, i.e.,
can be formulated in terms of the fuel power (
) used to generate it. Equation (
4) shows the correlation between these two power terms.
With the limited
data available and the feasible value being in the range of
,
was assumed to be a constant at 0.86 in this model. It was infeasible to obtain the engine efficiency or a brake specific fuel consumption (BSFC) map for the E85 fueled engine on an engine dynamometer due to integration limitations. To circumvent this obstacle, REx electric power data and tail-pipe emissions data obtained during in-vehicle operation were used to estimate the BSFC map. The details of this method and validation of the estimated fuel flow rate is explained in
Section 2.1. Additionally, low-voltage auxiliary electric loads were noted to have a significant impact on the ESS energy levels. The auxiliary electric power, i.e.,
, was modeled as a constant power demand of 520 W with additive noise. A signal-to-noise ratio (SNR) of 25 was used for the model and determined from auxiliary power load tests on the vehicle.
Finally, the ESS model used in this study was derived from discharge and charge data collected during vehicle operation. The earlier version of this model was based on the zeroth order equivalent circuit as shown in
Figure 3a and represented by Equation (
5). In this study, we used a dual polarization battery model as show in
Figure 3b and Equation (
6). In the case of the zeroth order equivalent circuit, if internal resistance (
) is considered a constant, then Equation (
5) is linear in voltage. Alternatively, in the dual polarization battery model, the additional resistance and capacitance representing the electrochemical and concentration polarization, is capable of capturing the transient behavior during charge and discharge cycles as well as due to ESS SoC nonlinear variation. A comparison of these two models showed that the dual polarization battery model captures variation in battery voltage more accurately than the zeroth order battery model during discharge and charge current transients [
27,
28]. This variation was observed to have an impact on the battery SoC estimation. The dual polarization battery model is represented as per Equation (
6) and the resistance and capacitance values were estimated using the System Identification Toolbox in MATLAB.
The ESS SoC computation is based on the coulomb counting method as per Equation (
7), where the discharge current is considered positive and the charge current negative. Available ESS power limits were noted to be a function of ESS SoC and the ESS operating temperature. Thermal effects in ESS were considered to be invariant in this study. Hence, the available ESS power limits were modeled as constants. Furthermore, the available range of ESS SoC was modeled between
and
SoC, i.e., SoC
with an ESS EPO limit at
. These limits were set to accurately model the available energy as observed during vehicle evaluation tests.
2.1. Engine Efficiency Map Estimation
The limited performance information of the 0.8L engine used in the REx system posed a challenge in terms of accurately modeling the power flow. In addition to this, the engine was retrofitted to operate with E85 fuel instead of gasoline. In our earlier work [
26], engine efficiency was considered to be a constant due to unknown system state values. In this article, we present an estimate of the engine efficiency or BSFC for its region of operation.
As mentioned earlier, the engine was directly coupled to a motor/generator in this research vehicle. This setup is quite similar to an engine dynamometer and was useful in determining engine output power. The fuel power corresponding to the output was determined by estimating the input fuel flow rate deduced from the tail-pipe emissions. The E85 fuel used is an oxy-hydrocarbon that is 85% ethanol and 15% gasoline which has an equivalent chemical formula of
. The key tail-pipe emissions measured for E85 fuel combustion were
, and
. For this estimate, the amount of
emissions were considered negligible and the associated terms were not considered in the simplified combustion equation as shown in Equation (
8).
Equating the amount of C,H,O, and N atoms amongst reactants and products provided the relationship between
and
. With the goal to estimate the amount of E85 consumed, the only important relationship for estimation is the one between E85 (
) and
, as per Equation (
9). This being a molar relationship, it was converted into a mass-based relationship by including molar masses as per
Table 2 and considering
, i.e., 1 mol. Without loosing the equality relationship and considering the mass conservation of the carbon atoms, the resulting relationship is provided in Equation (
10). The mass of carbon in a mole of E85 fuel as well as
and
is correlated to determine the mass flow rate of E85 fuel.
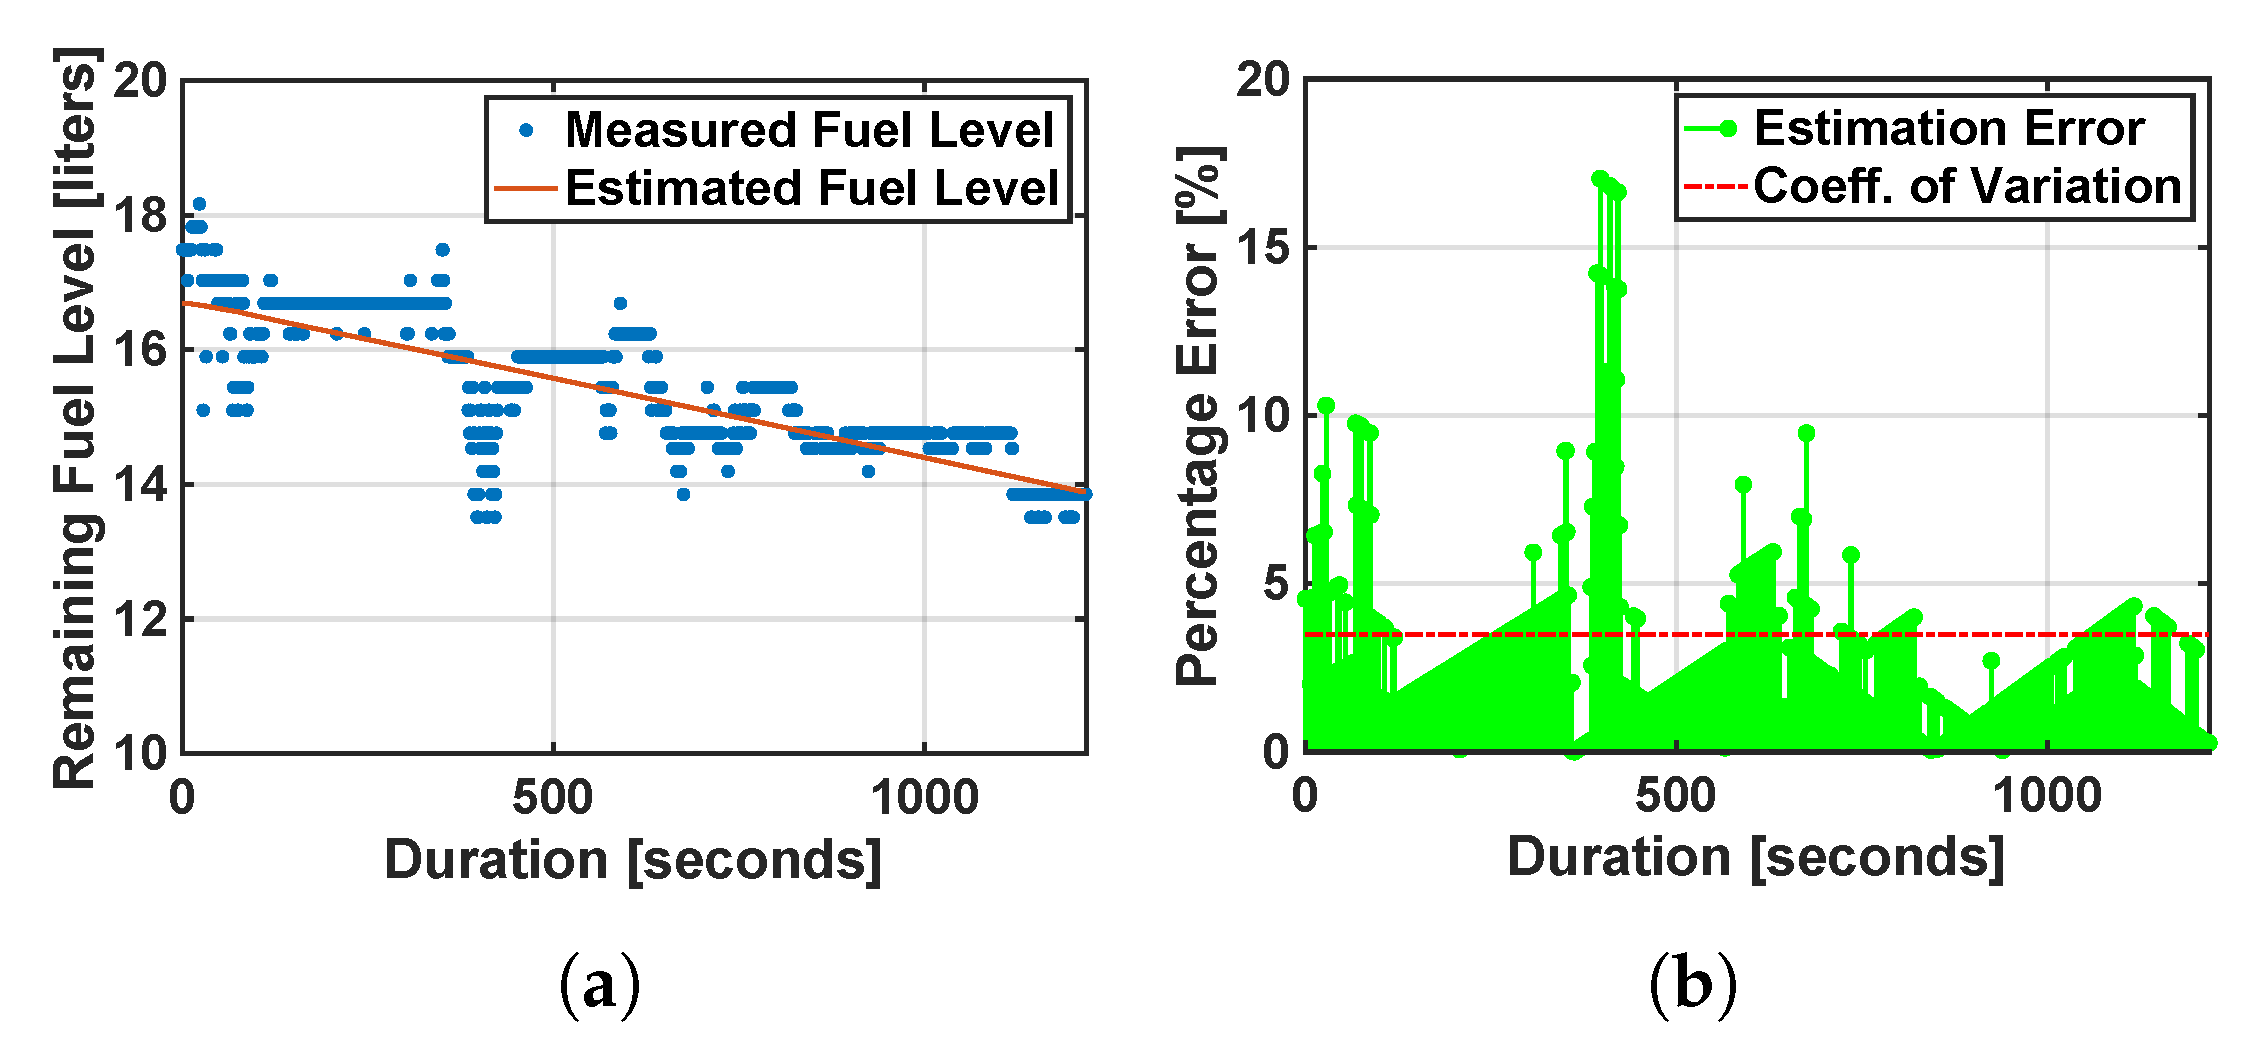
The REx system operating power data along with the corresponding tail-pipe emissions 10 Hz modal dataset were used to generate the estimated brake specific fuel consumption map for the engine. The estimated fuel flow rate as per Equation (
10) was validated against net fuel consumption measured from the fuel tank level sensor in the research vehicle.
Figure 4 shows the comparison between measured and estimated volume of fuel in the tank. The mean estimation error was computed to be within
, with an RMSE of
. The estimated fuel mass flow rate was thus deemed valid and was subsequently used to generate the BSFC map for the engine.
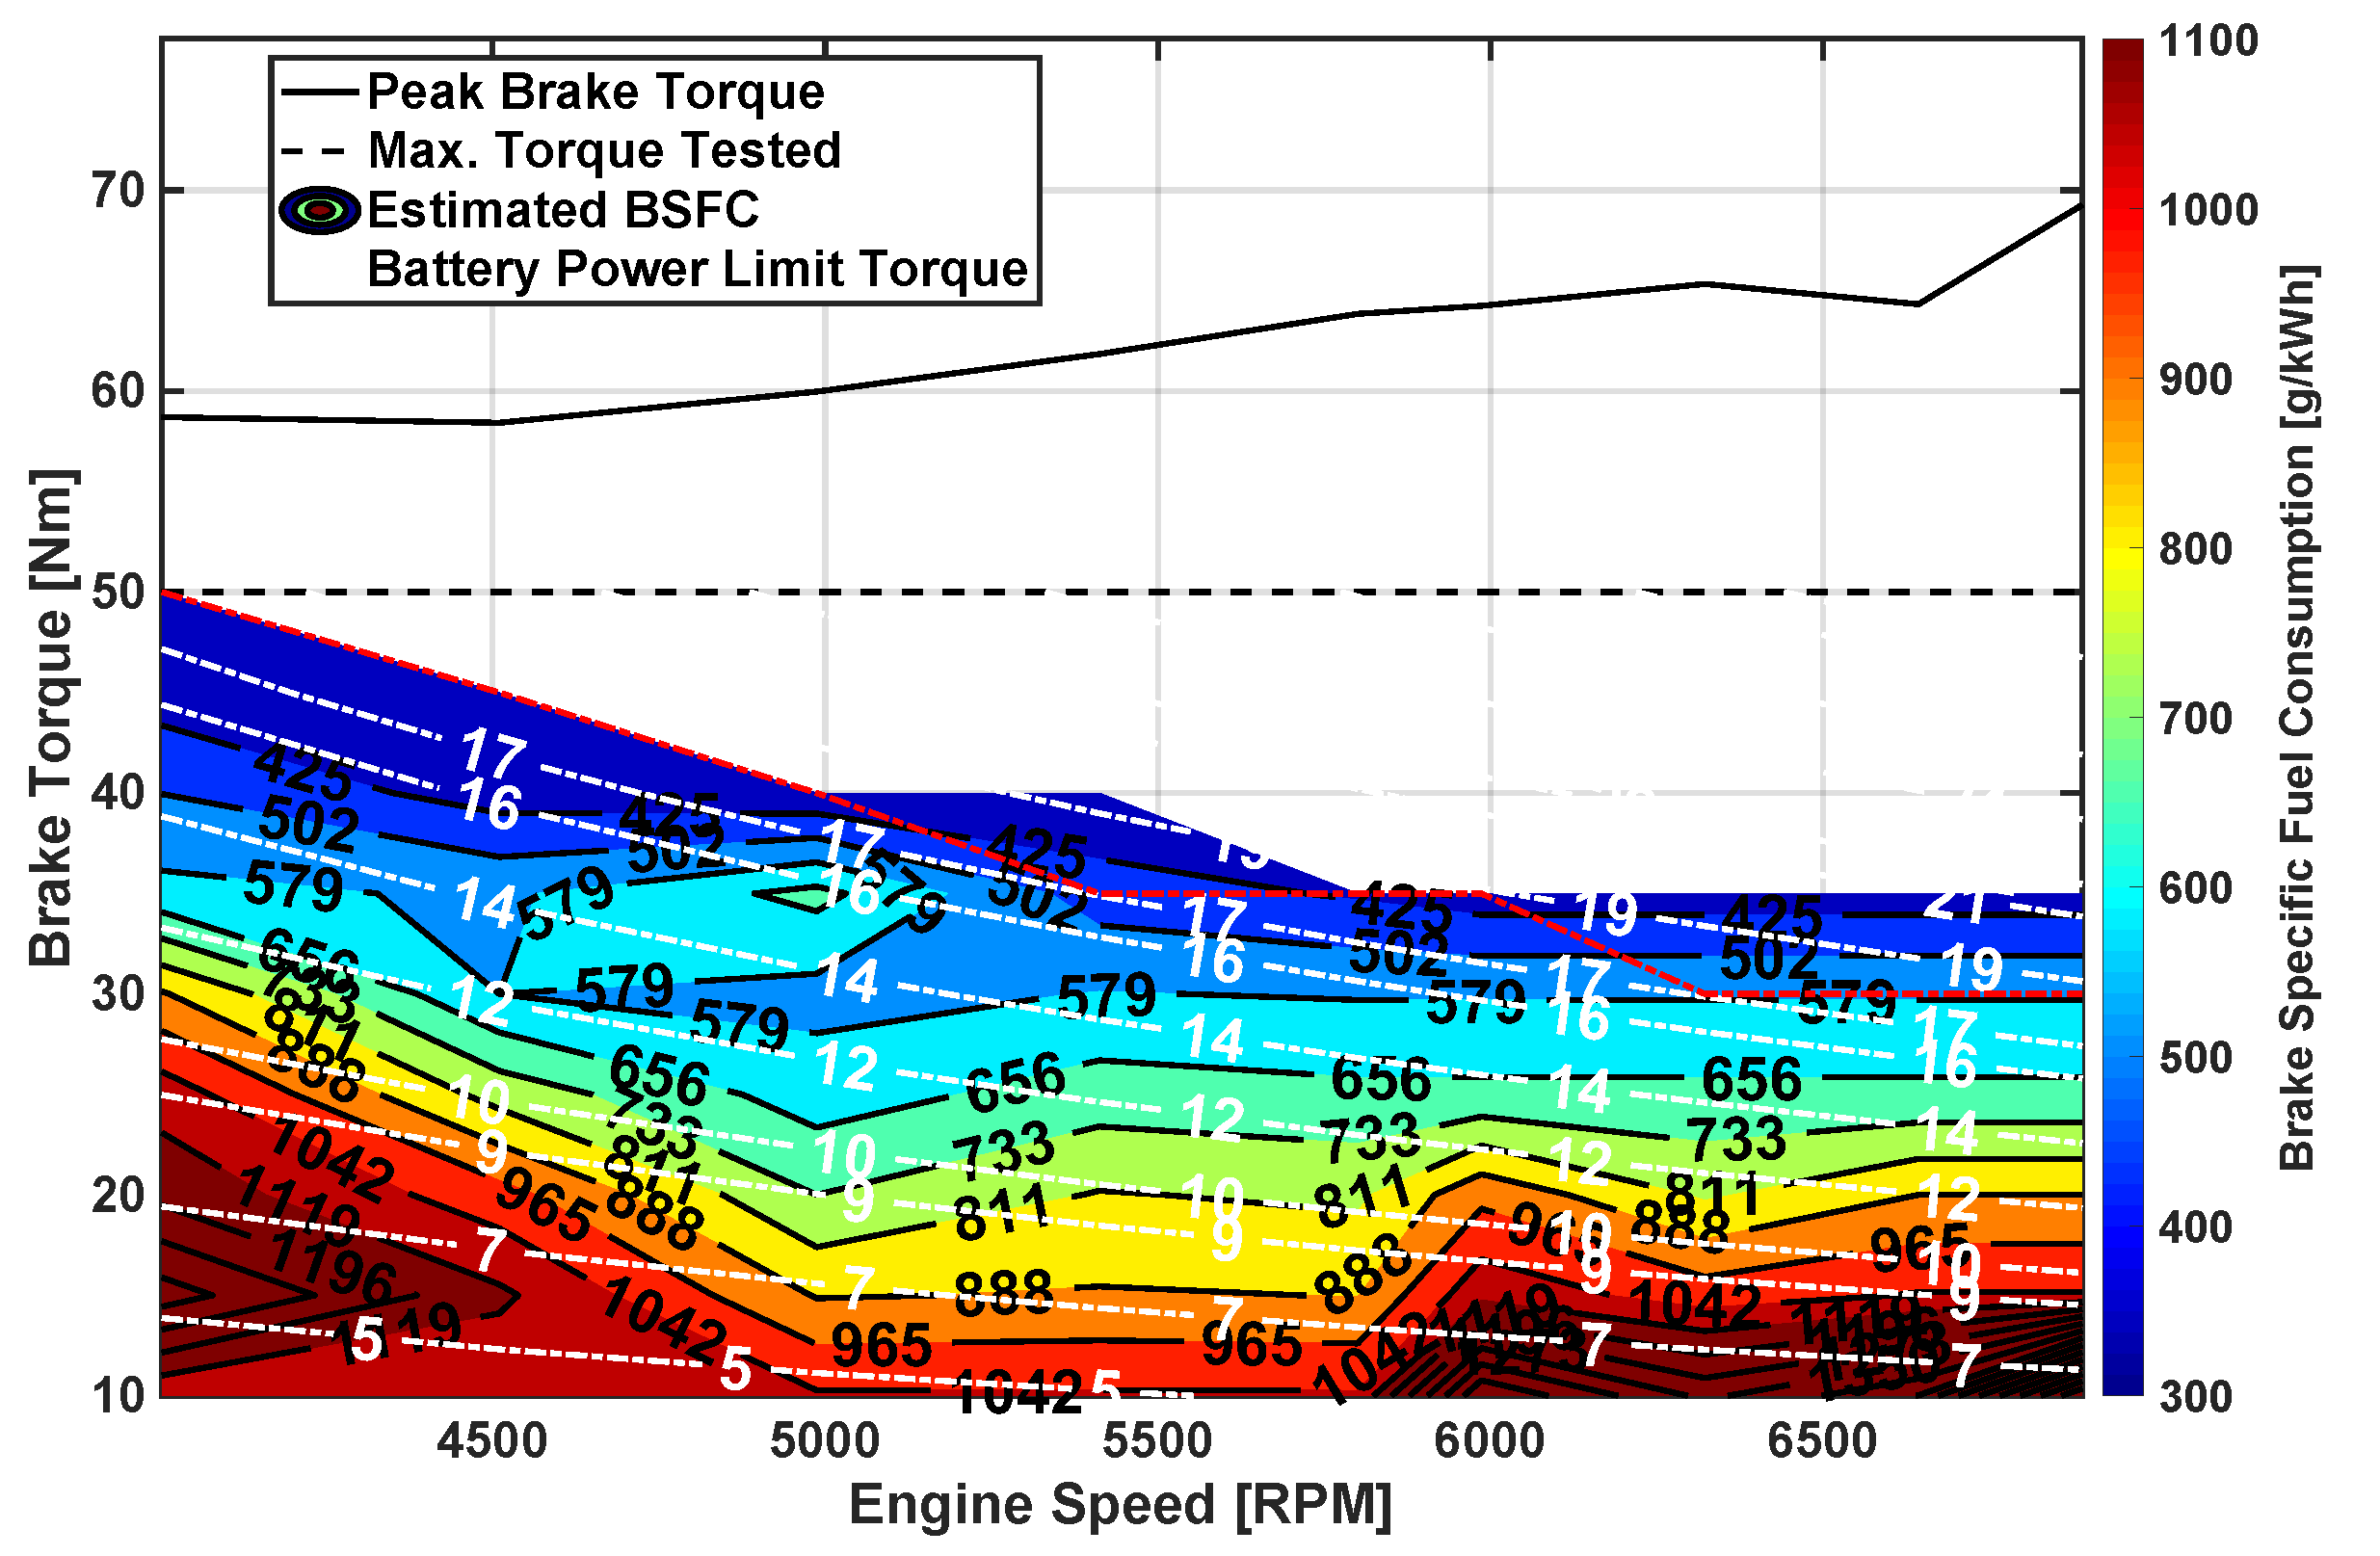
The estimated BSFC map for the E85 fueled VFR800 engine is shown in
Figure 5. The REx system was operated within power limits defined by [0, 17.5] kW in the research vehicle. This limit was primarily defined by the continuous charge power limit of the ESS. The operating speed of the engine was bounded between [4000, 7000] RPM while the load torque bounds were [0, 50] Nm.
Figure 5 also denotes the engine peak brake torque, the maximum operating torque, and the torque associated with the ESS power limit. The map shows the lowest BSFC values in the high-torque and low-speed region which coincide with the maximum operating power, as shown by the dashed white curves. Thus, for the lowest fuel consumption rate, the REx system must operate near the maximum operating power with high torque and low speed.
2.2. Transmission Efficiency Map Estimation
The propulsion system on the EREV research vehicle represented a rear-wheel-drive architecture, as shown in
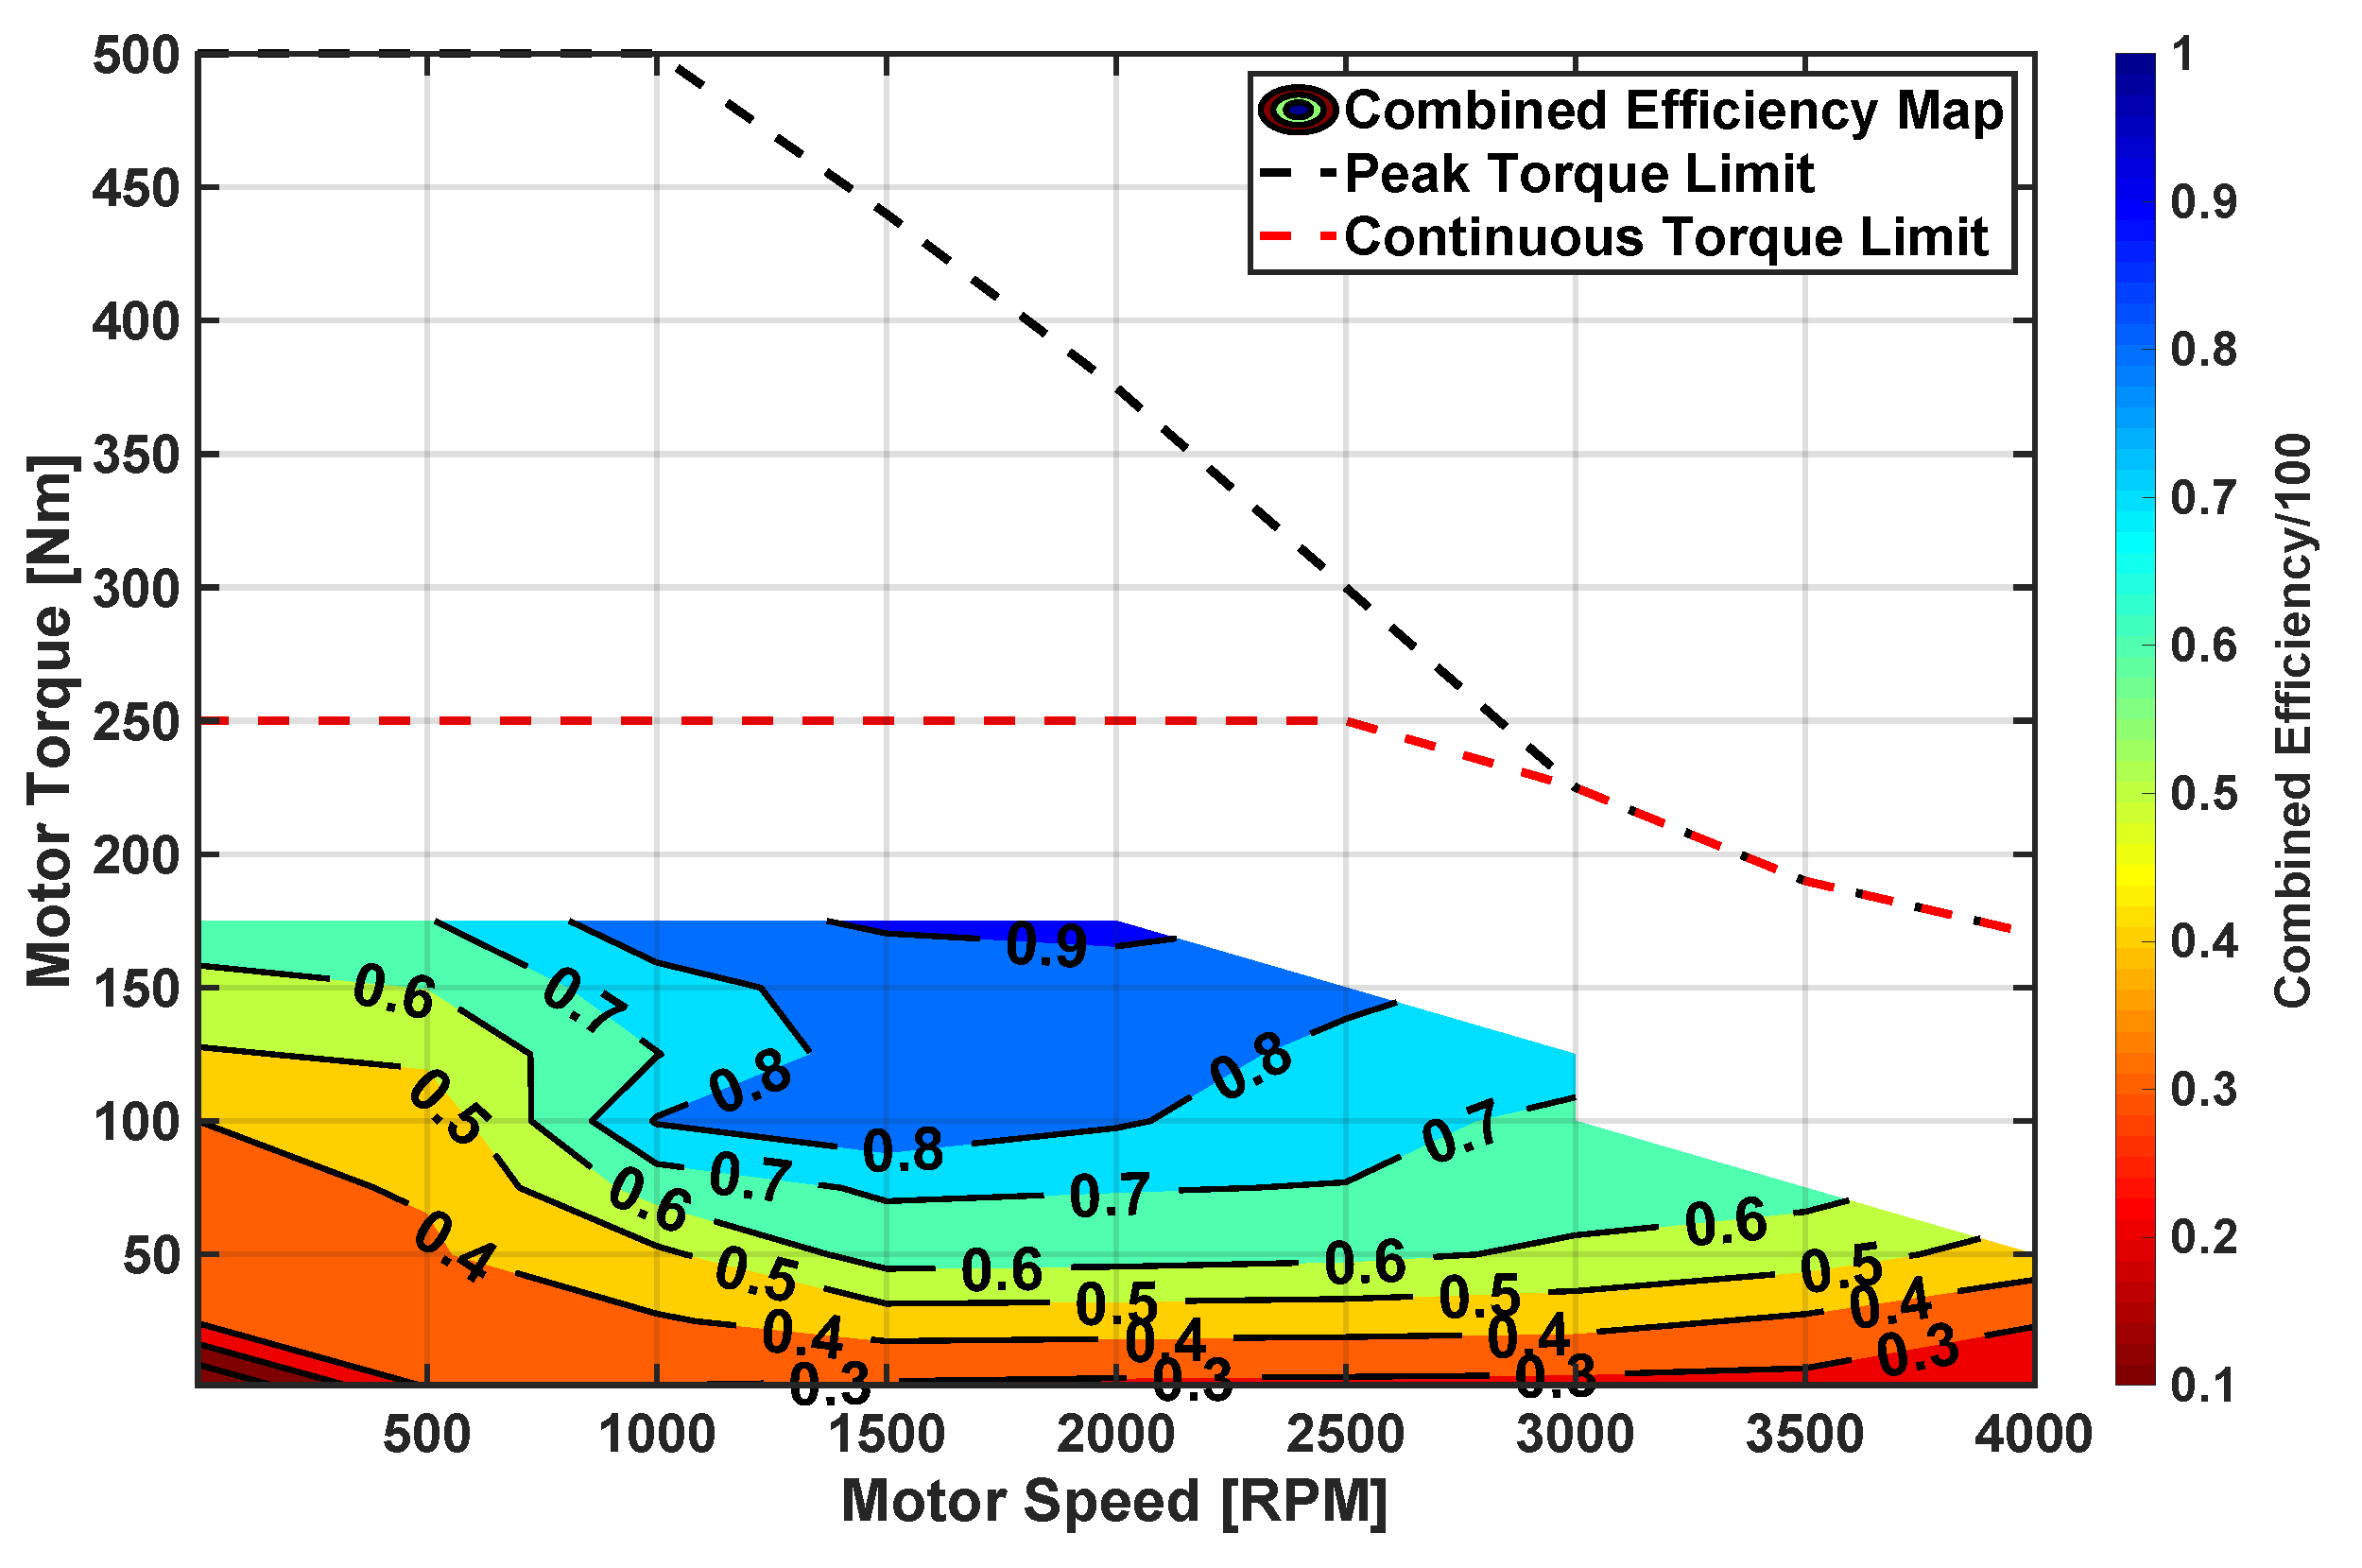
Figure 1. The system includes two independent motors, one on each of the rear wheels, coupled to a custom single speed straight cut planetary gearbox. The output from the individual gearboxes is connected to the corresponding rear wheel through a half-shaft. The total power loss in this system is due to the inefficiencies in the motor and the custom gearbox. Constant efficiency assumptions for the system reduced the model accuracy and resulted in it underestimating the net energy consumption for low-speed drive cycles. Chassis dynamometer testing results were used to estimate a combined efficiency map for the motor and gearbox assembly on the vehicle.
The propulsion system efficiency (
) was computed using the power flow relationship, as shown in Equation (
3). Here, the motor electric power (
) was determined from the ESS discharge current and voltage while operating in charge depleting mode. The power output at the wheels (
) was obtained from the chassis dynamometer. By aggregating recorded data from several dynamometer runs, the combined efficiency map as shown in
Figure 6 was obtained. Half-shaft safety and ESS continuous power discharge limits prevented it from exceeding a commanded maximum torque of ≈180 Nm. This resulted in a partial estimation of the efficiency map for the propulsion system.
2.3. EREV Power Flow Model Validation
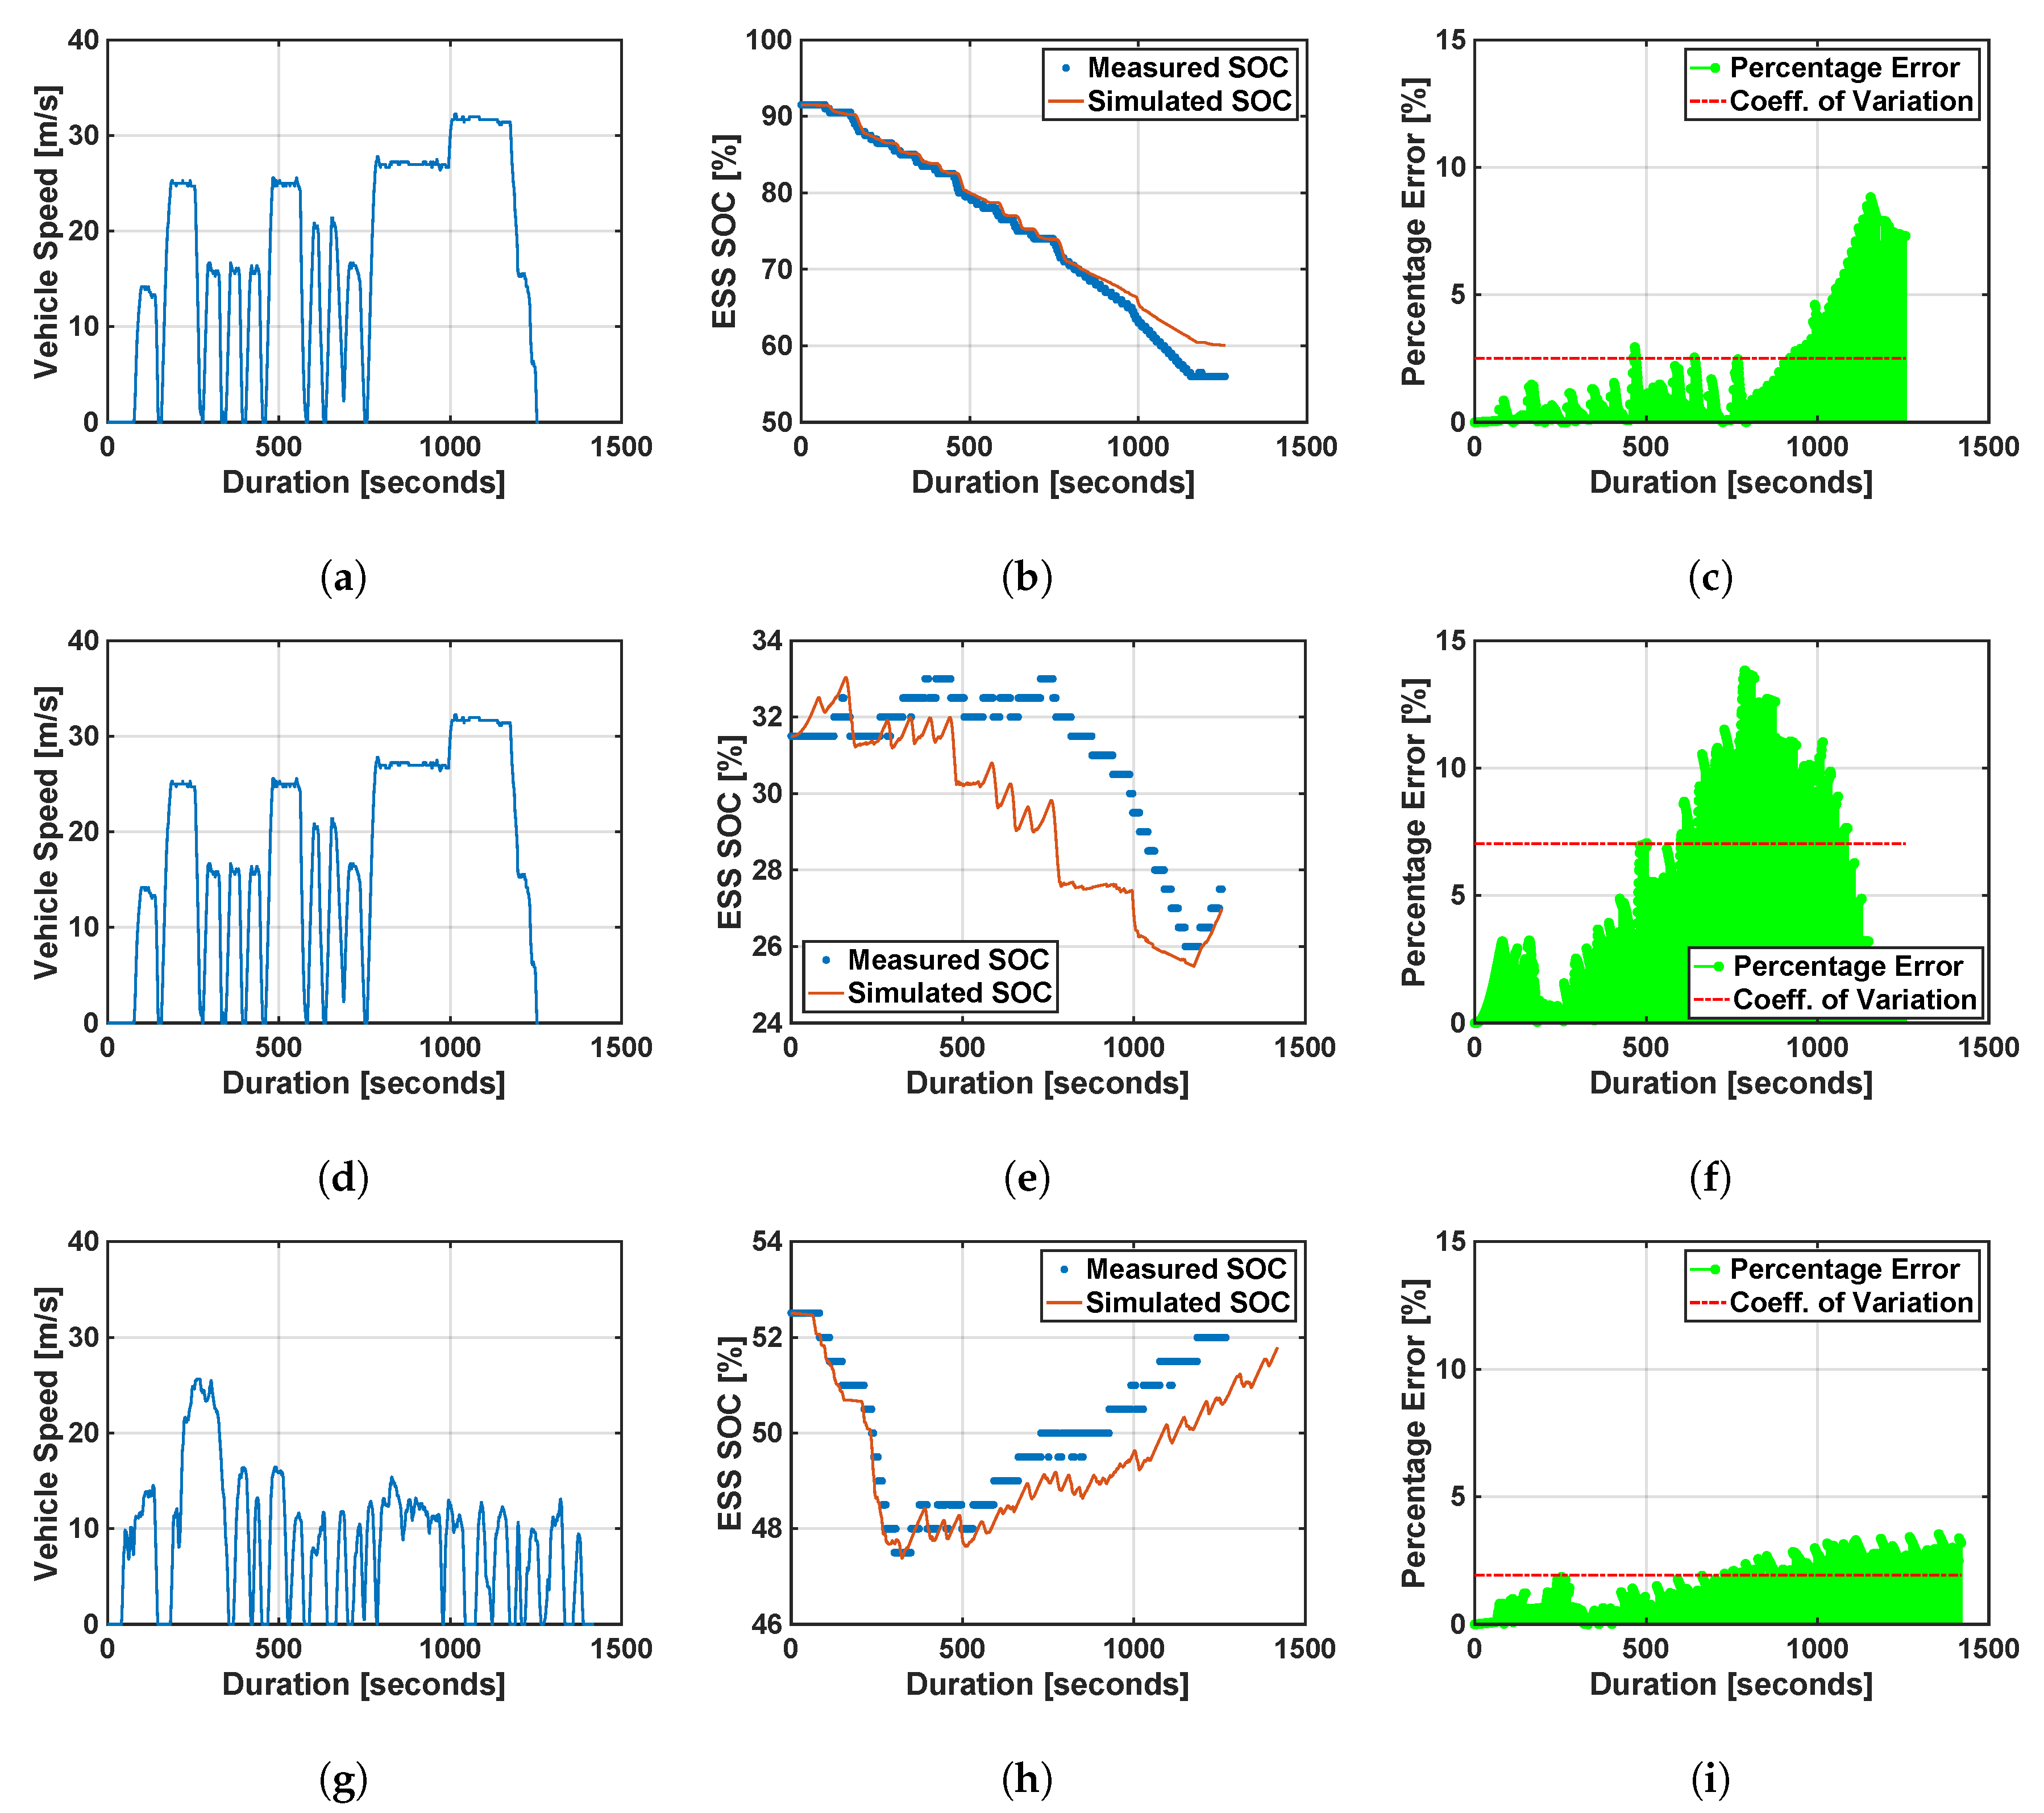
The EREV model discussed in the previous subsections was validated against measured power flow and energy consumption data from the EREV research vehicle. As ESS SoC is the main energy consumption state variable for an EREV, the validation process compares the measured and model-simulated ESS SoC data.
Figure 7 shows these comparisons for emissions and energy consumption (EEC) cycle in charge depleting (CD) mode, charge sustaining (CS) mode and urban dynamometer driving schedule (UDDS) cycle in a combined charge depleting/charge sustaining (CD/CS) mode. The simulation time step was observed to effect model accuracy. The time step was varied in the range of 0.05, 0.1, 0.2, 0.5, and 1.0 s. The accuracy was found to deteriorate with increasing time steps. A time step of 0.2 s was chosen to balance out the simulation time and model accuracy values.
ESS SoC (State of Charge) comparison for the EEC cycle-CD as per
Figure 7a establishes the presented EREV model with a high accuracy. The percentage error was computed as per Equation (
11) for all validation scenarios presented and is shown in the bottom subplots in
Figure 7. Coefficient of variation (C.V.) is also calculated as per Equation (
12) and is shown as a dotted red line overlay.
C.V. computed for the validation simulation results ranged between 1.9% and 7.0%. A larger deviation in the model accuracy was observed during the charge sustaining mode in the drive. Discharge current comparison between measured and simulated values for CD and CS modes showed a better accuracy in CD mode than CS. Thus, the deviation can be attributed to battery charge dynamics. As the computed C.V. values are still low, the model was considered validated for our study. In the next section, we present our work on energy management optimization for the EREV research vehicle.
3. Energy Management Optimization Algorithm
An EREV is capable of operating in two different energy modes, CD and CS, as mentioned earlier. Both the literature and in-production EREVs show either a well-defined transition between these two modes or a blend of these as an energy management strategy. The intention of the on-board REx system is to only extend the driving range when required. An investigation of widely used energy management optimization algorithms was conducted for this EREV research vehicle. It showed that to attain the minimal energy consumption solution, one had to compromise on the feasible driving distance. Contrarily, to obtain the maximum driving distance, the energy consumption was found to be suboptimal.
A dynamic programming algorithm was used to determine global optimal solution for net energy consumption using the EREV research vehicle model. This algorithm is generally defined as backward propagating, where for
n equally spaced time intervals between
k stages, the process is started at the
k-th stage and traversed backwards. We implemented this algorithm in the forward propagating sense where the process started at the zeroth stage and traversed forwards. Equation (
13) shows the optimal cost function (
) used in dynamic programming, called the Hamilton–Jacobi–Bellman equation in discrete time [
29]. Here,
and
correspond to the state and control variables corresponding to stage
k, while
represents the cost associated with traversing from stage
to
k, and
represents the net cost associated until stage
. In this study, we use a time increment of 1.0 seconds for optimization, hence stage
k also represents the time step.
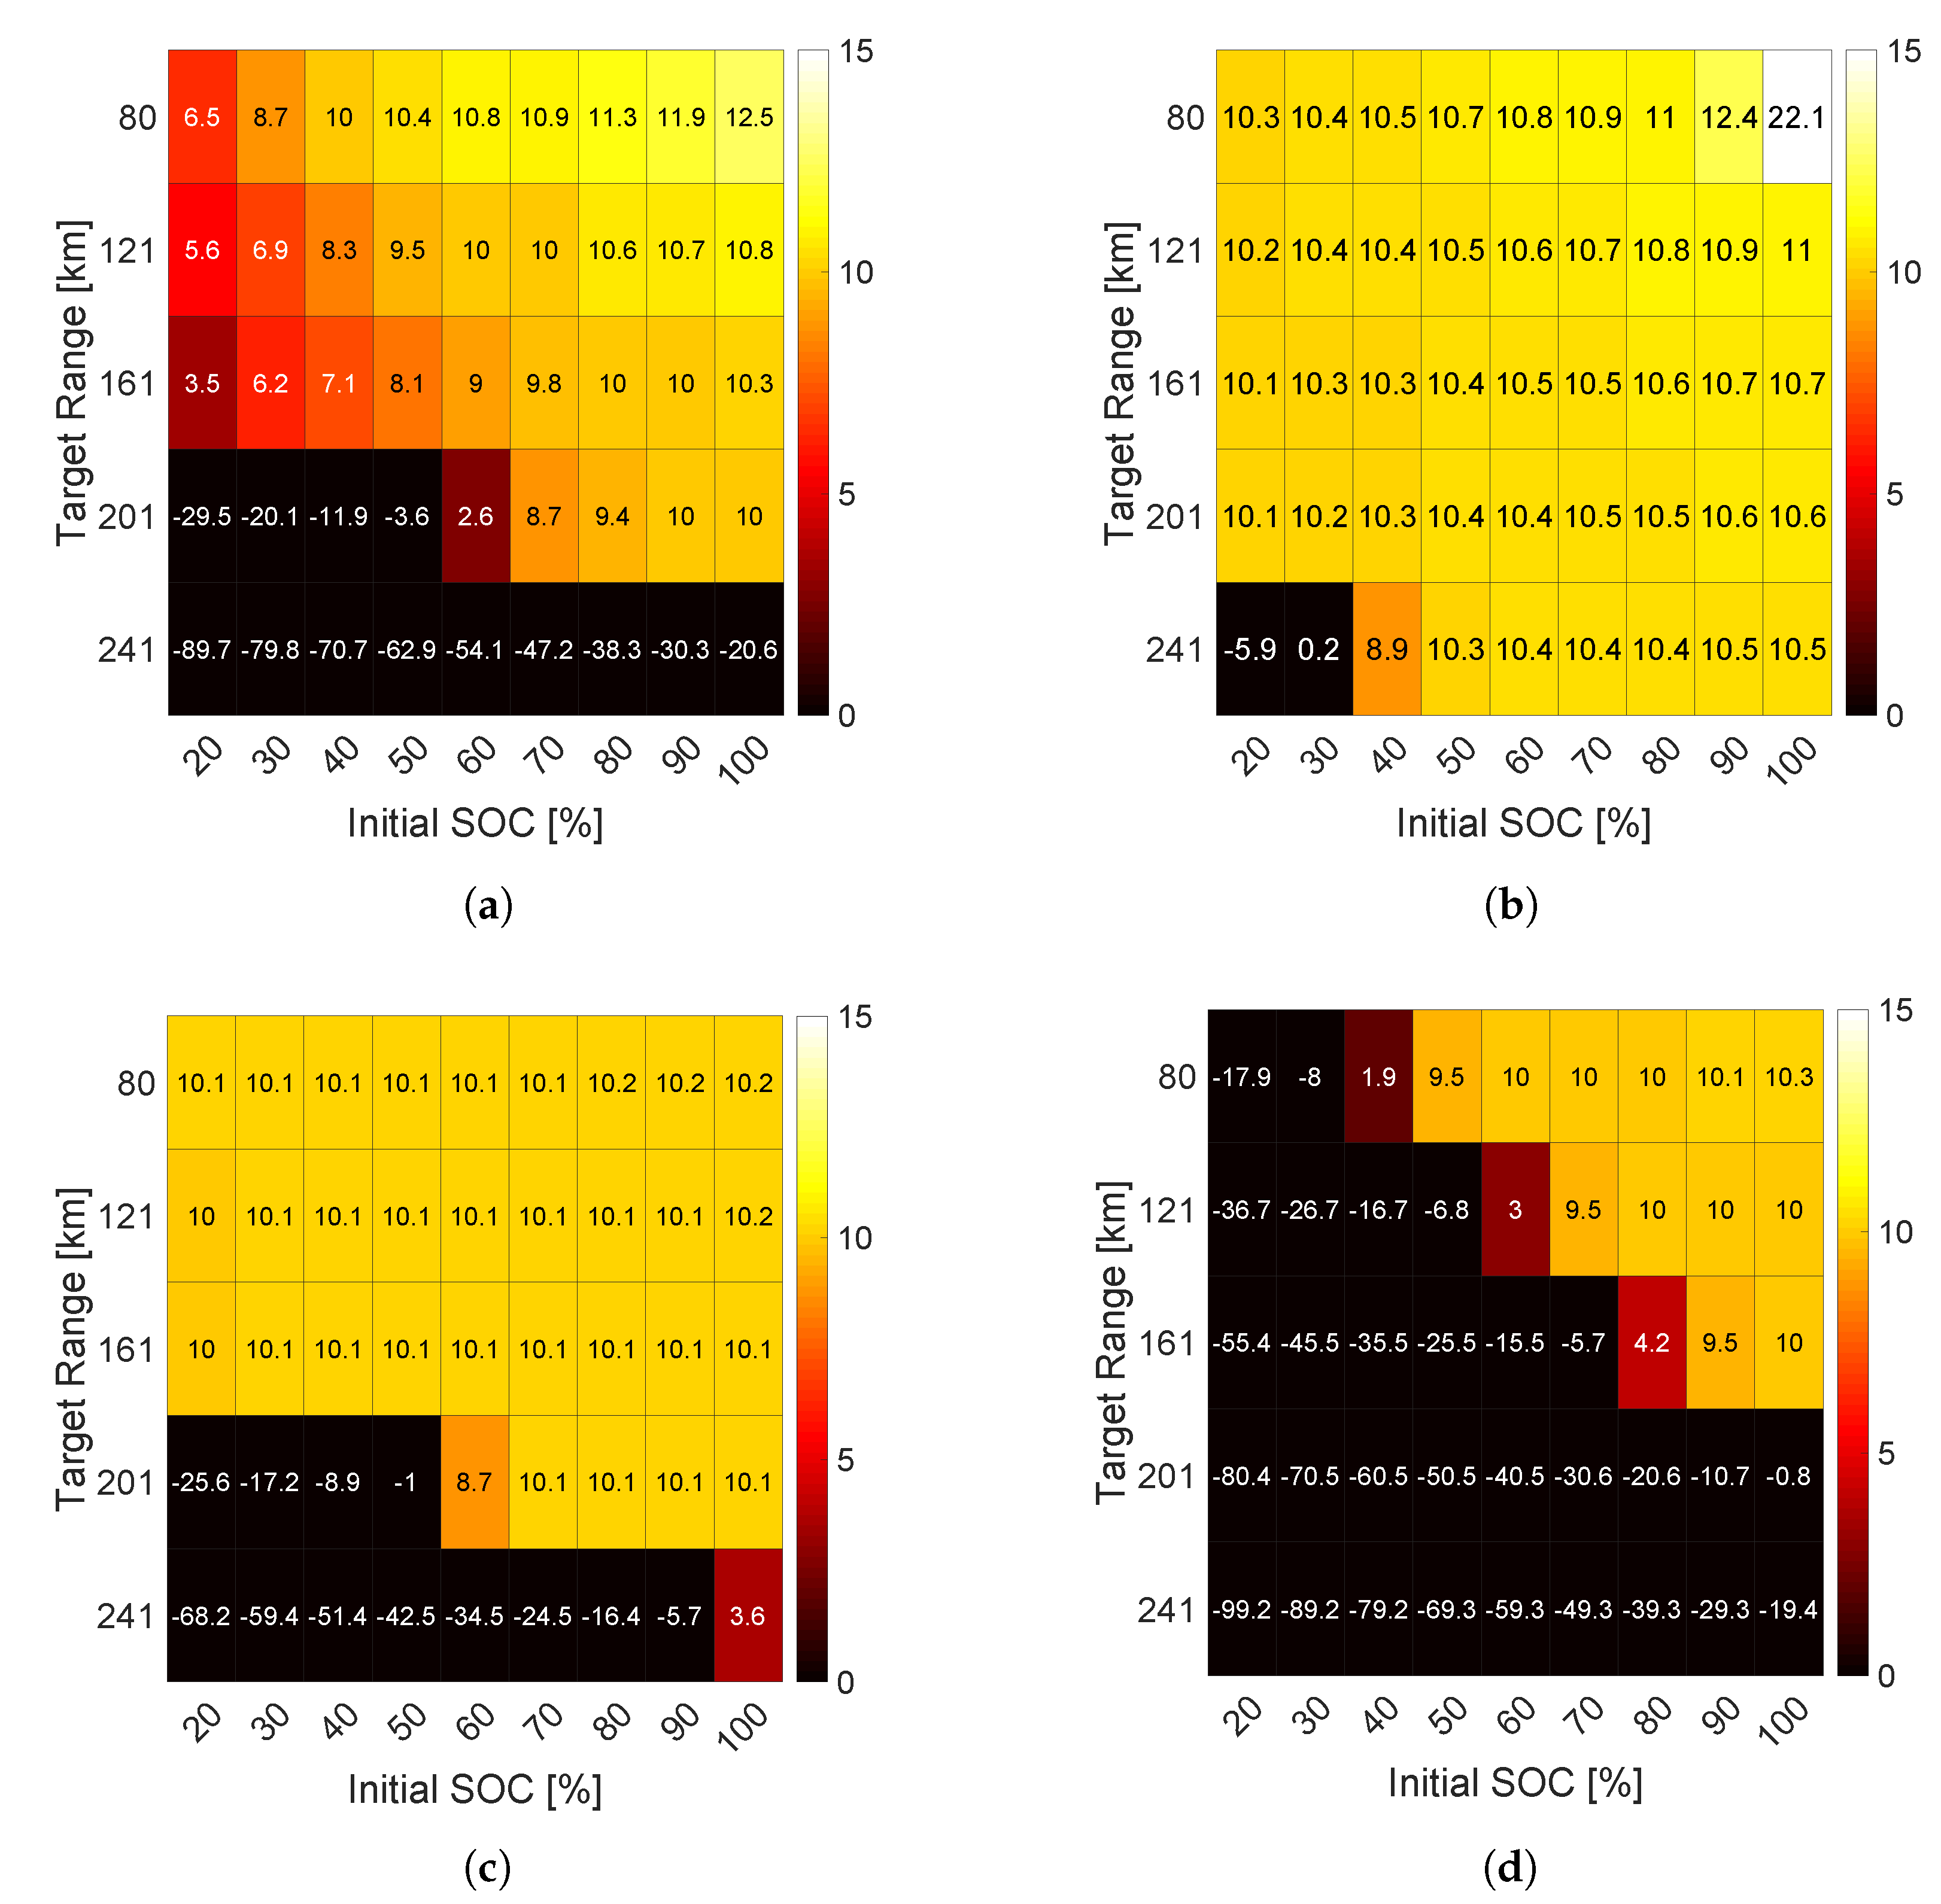
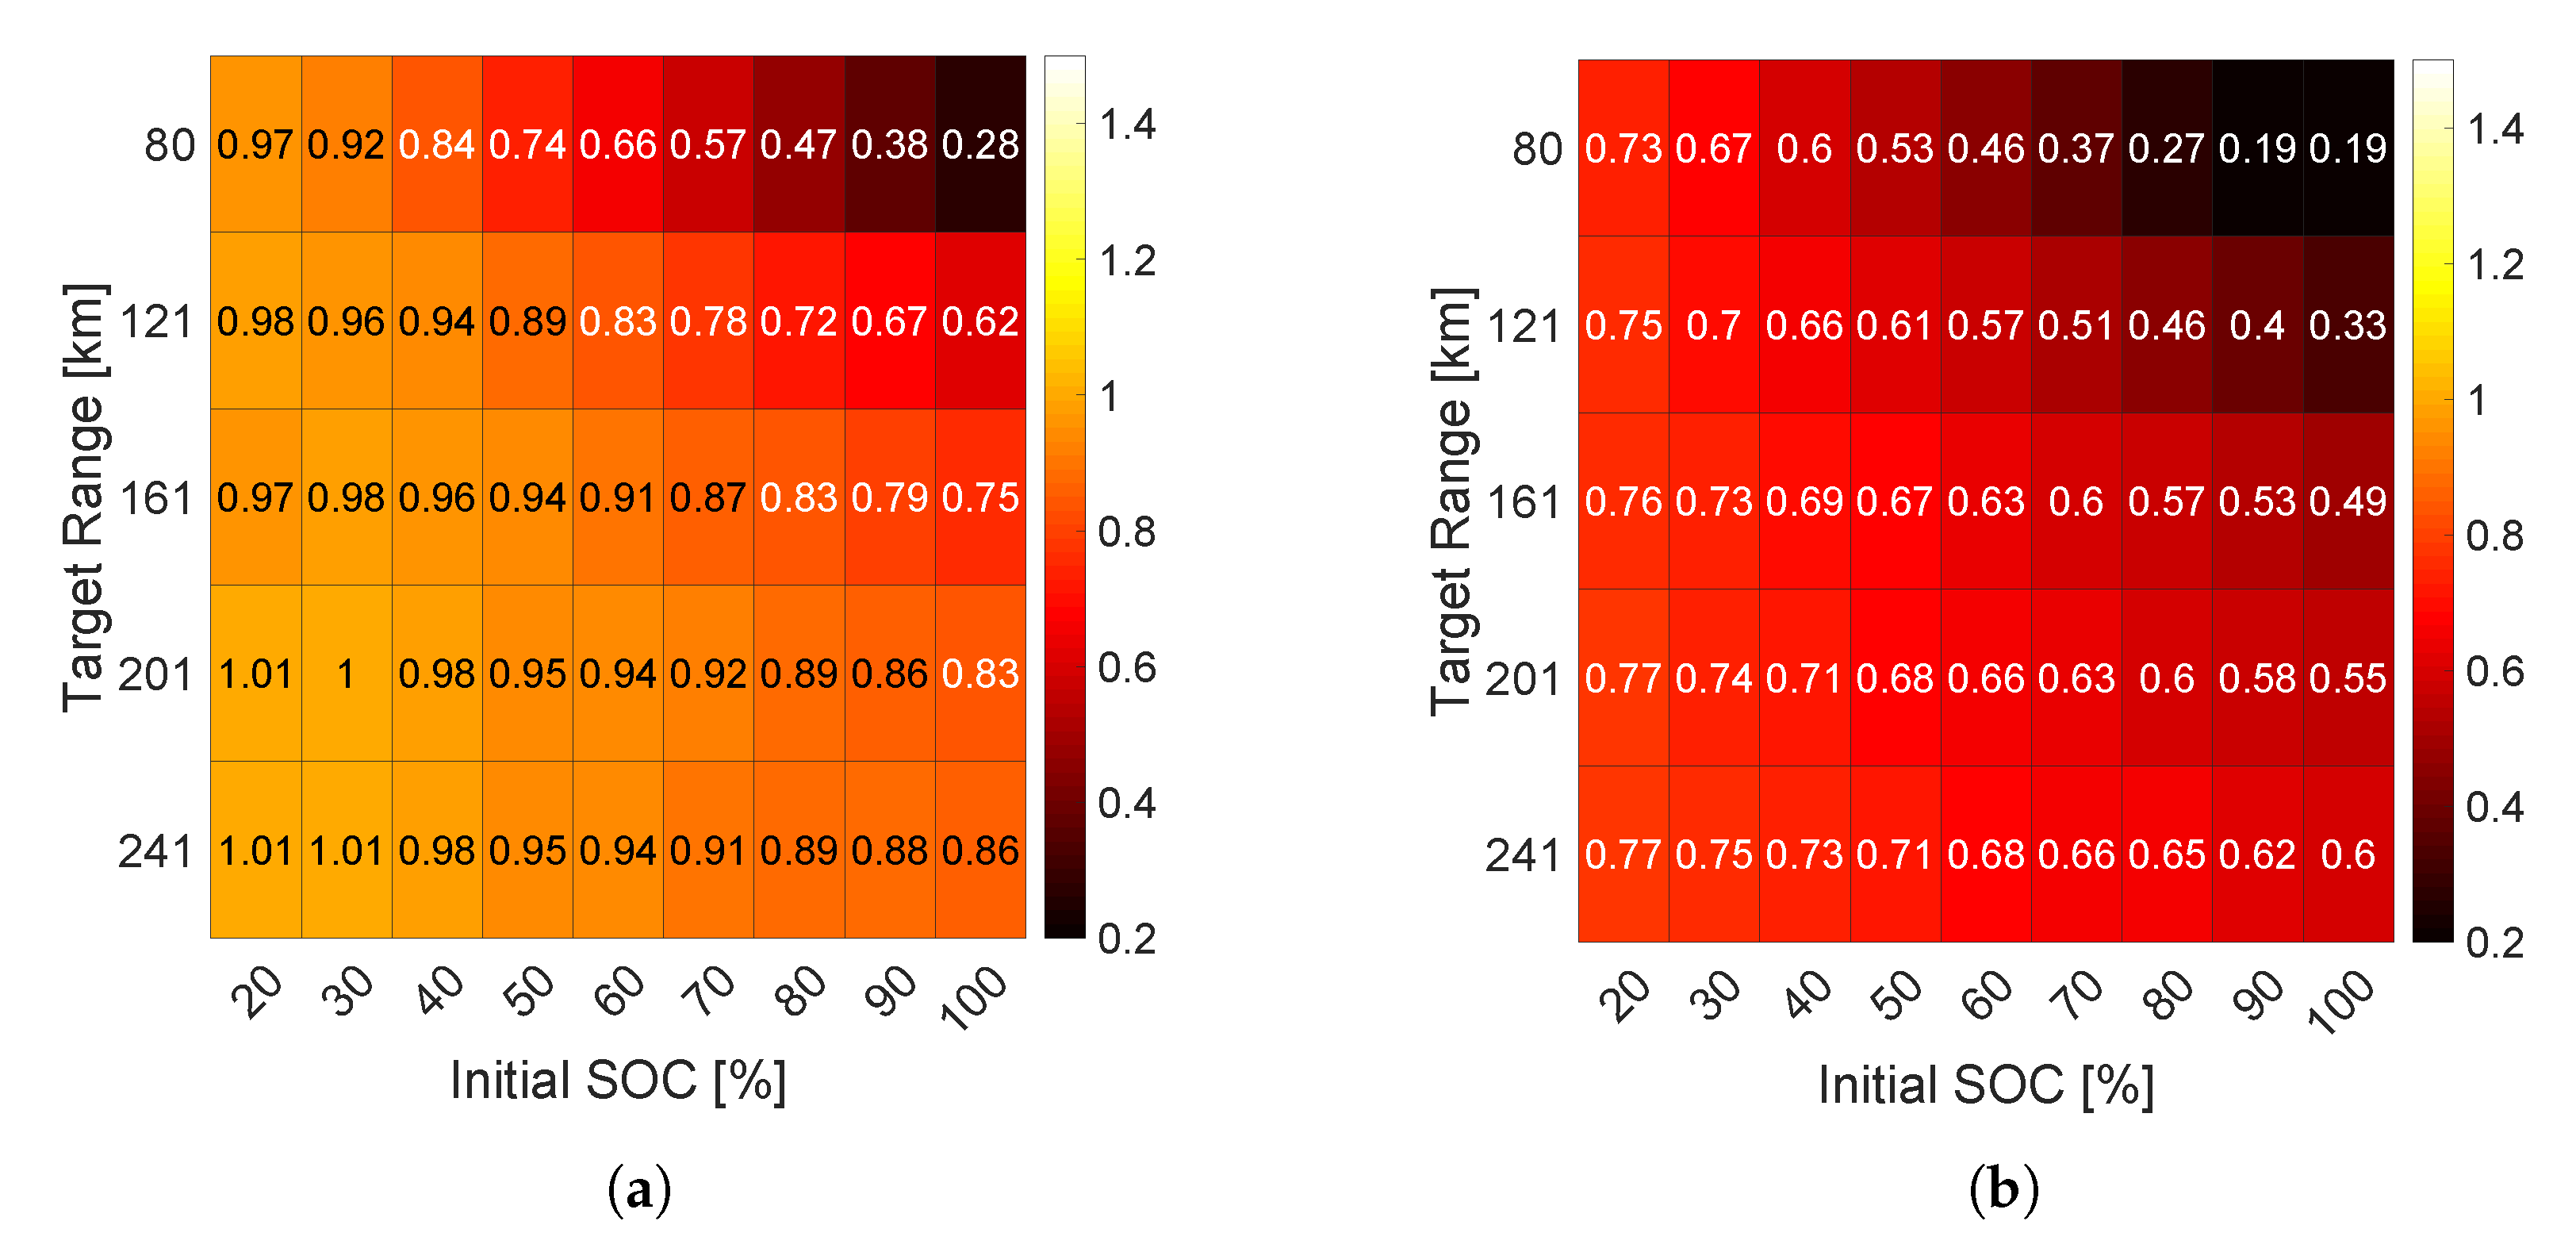
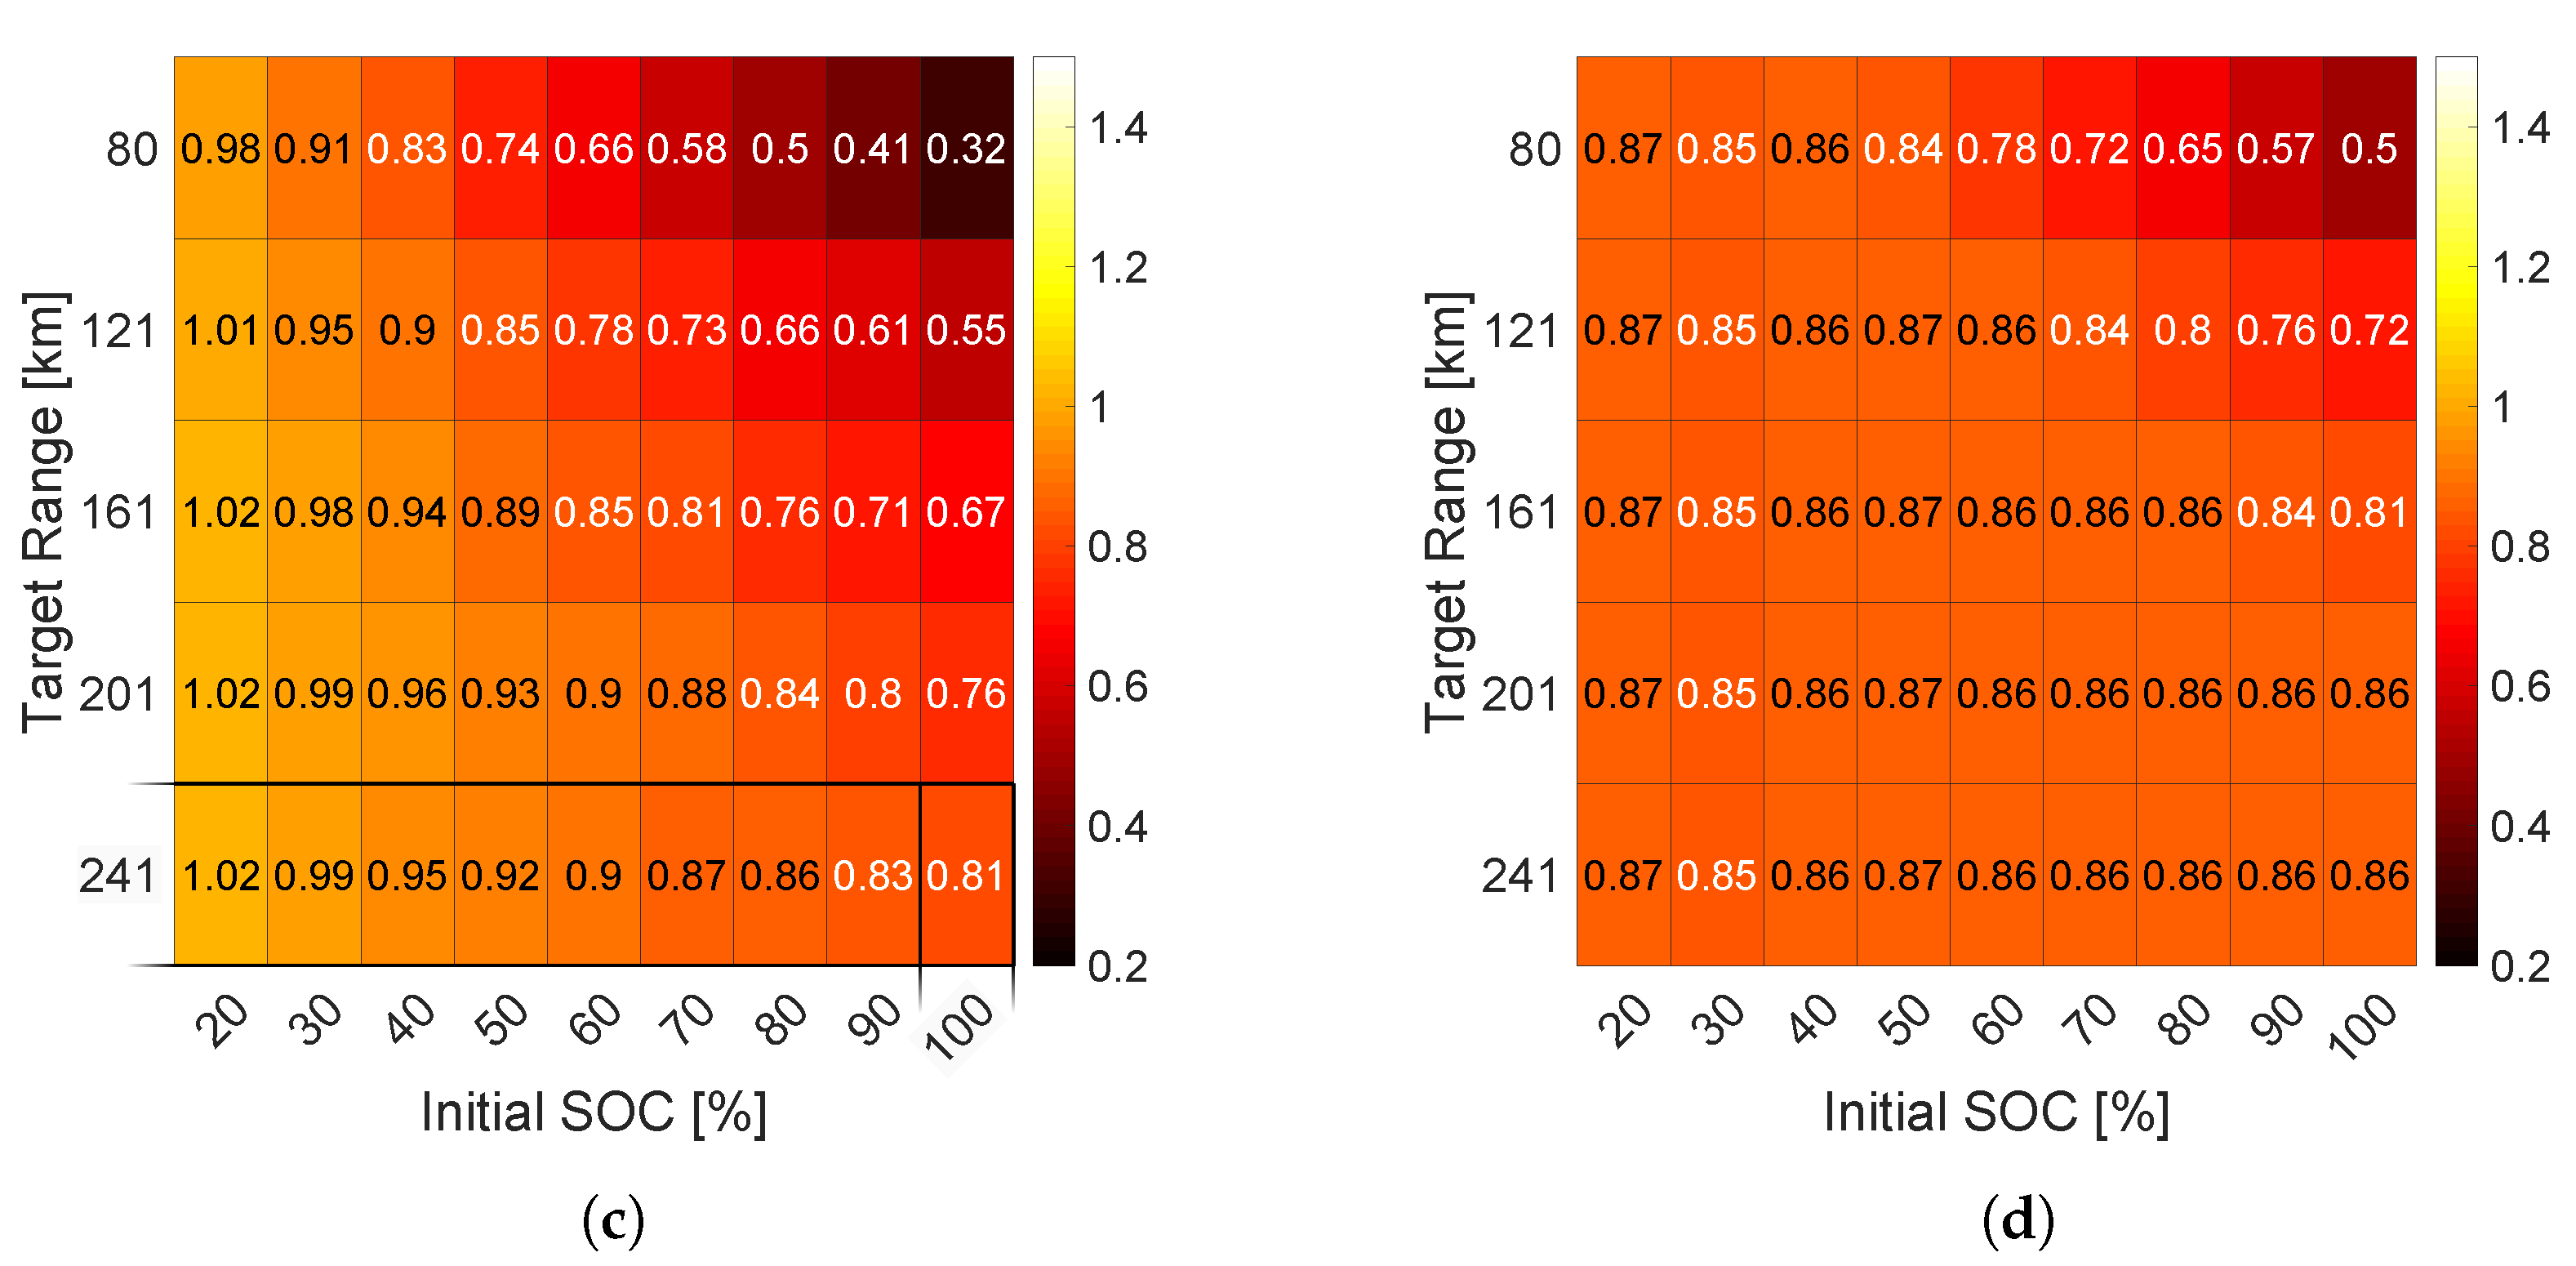
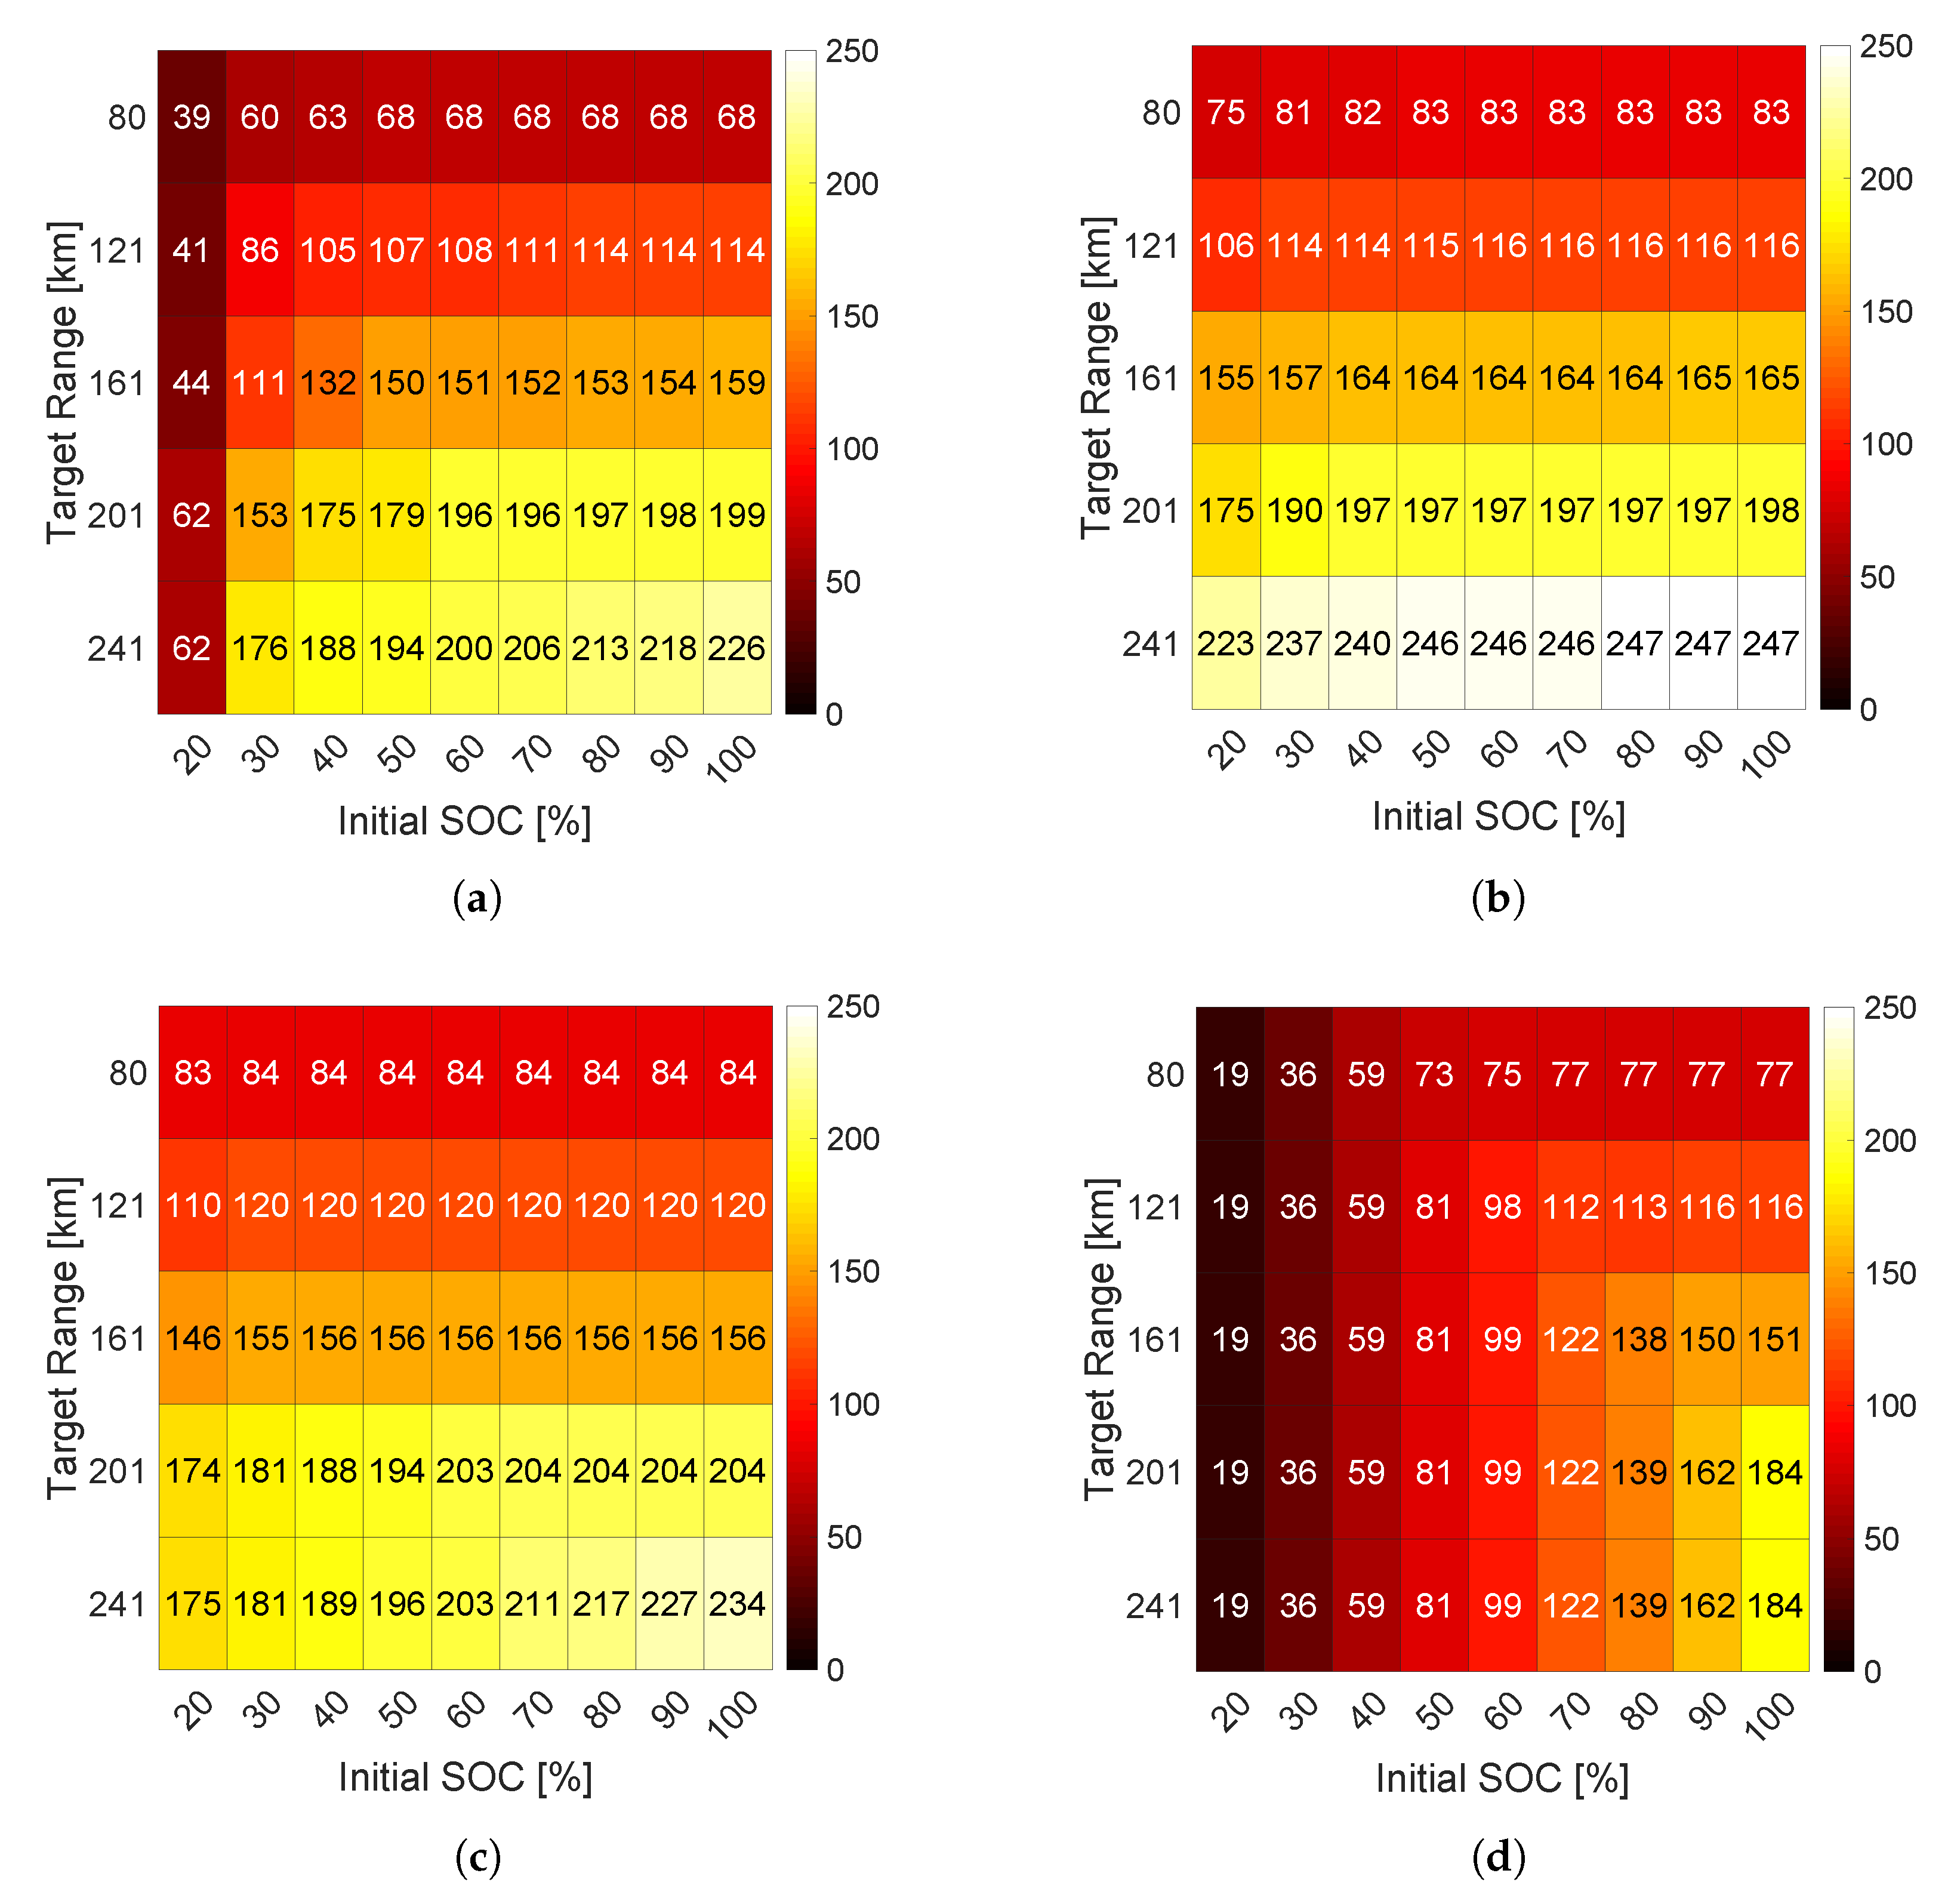
Four different drive cycles, namely Emissions and Energy Consumption (EEC), Highway Fuel Economy Testing (HWFET), Urban Dynamometer Driving Schedule (UDDS), and US06, which emulate different power demand conditions, were used. The ESS SoC state variable and the driving range state constraint were varied to perform 45 simulations per drive cycle. The simulated driving distance was varied by repeating the number of drive cycles as shown in
Table 3 for reference. The final ESS SoC, maximum achievable driving range, and net optimal energy consumption results are shown in
Figure 8,
Figure 9 and
Figure 10.
The final ESS SoC results as seen in
Figure 8 show that for high power demand drive cycles such as EEC and US06, a feasible solution exists only for limited combinations of initial ESS SoC and target driving distance. From the HWFET and UDDS evaluation results, we observed that the EREV was able to meet the final ESS SoC requirements for more simulation scenarios in the case of HWFET than UDDS. This outcome is counter intuitive to our initial expectation due to an expected lower energy demand per cycle in the case of UDDS. To maintain similar driving distances, the number of UDDS cycles was higher than HWFET resulting in a higher net energy demand and complete depletion of fuel reserve. On overlaying ESS SoC results with th net optimal energy consumption results as per Figure , it was seen that the lowest values are achievable only for a 50 mi driving range and 100% initial ESS SoC amongst the simulated drive cycles. As the driving range requirement increases or the initial ESS SoC value decreases, the energy consumption values increase substantially. This result is supported by the maximum driving range results as per
Figure 10. Thus, on the basis of the dynamic programming-based simulations, an optimal energy consumption for the EREV is highly dependent on the driving range requirement and initial ESS SoC.
With a baseline available for our work using dynamic programming, we utilized another energy management optimization algorithm based on Pontryagin’s minimization principle (PMP) [
30]. This approach is also applicable only with a priori knowledge of the vehicle behavior. In this algorithm, the hamiltonian as shown in Equation (
14) is computed at every time step and minimized to obtain the optimal control parameters.
where,
is the fuel power consumed.
is the feasible set of fuel power consumption.
is the ESS power consumed.
is the feasible set of ESS power consumption.
is the co-state variable.
is the hard penalty associated with the feasible SoC range.
On the basis of the feasible power values in
,
, and the co-state parameter (
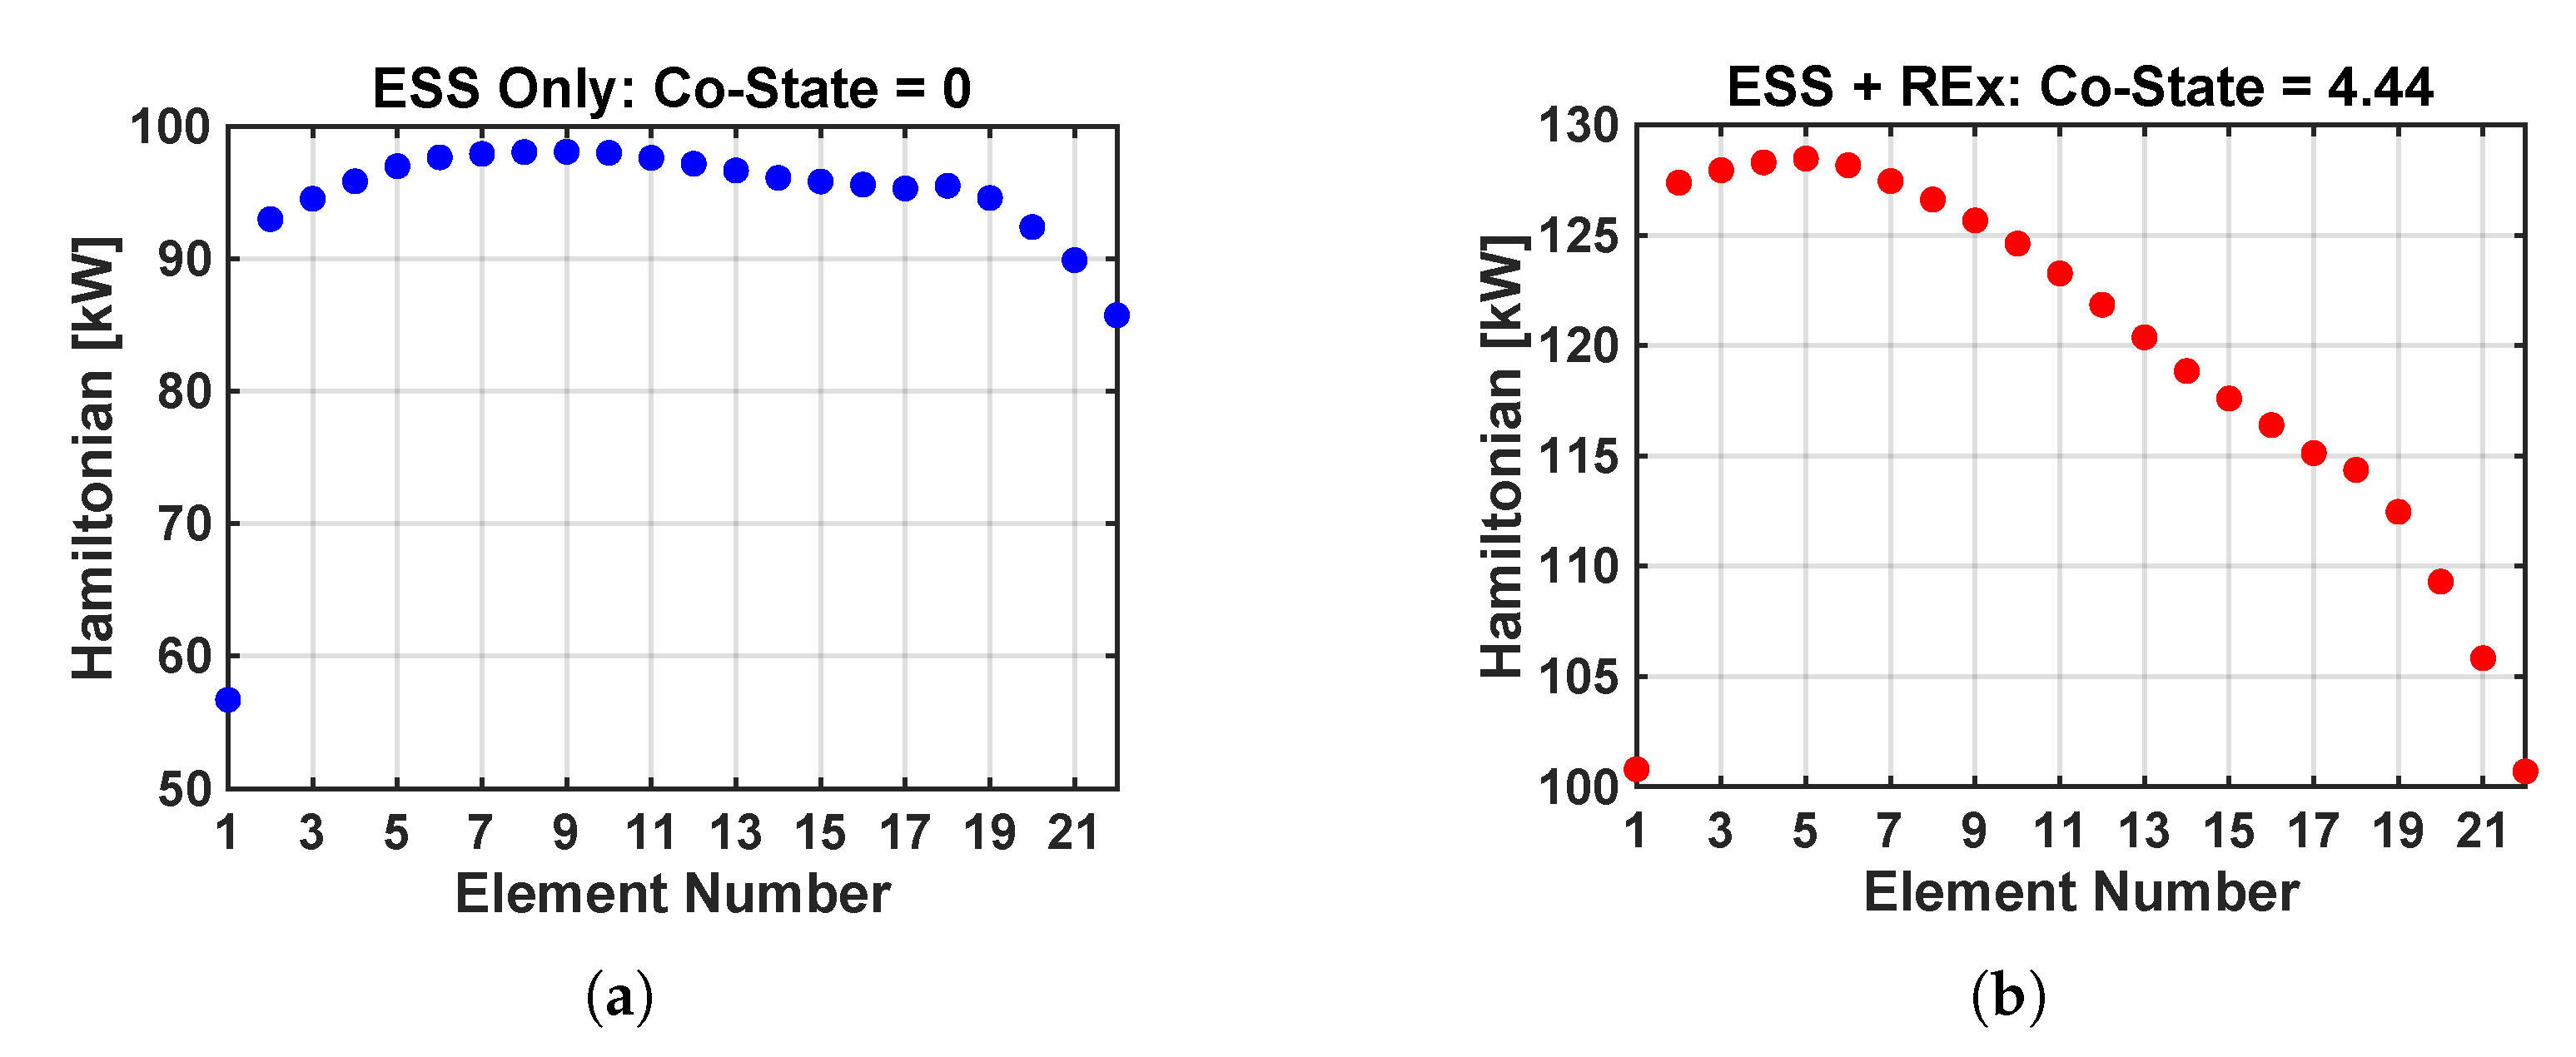
) that satisfies the SoC constraint, the Hamiltonian obtained is shown in
Figure 11. The plot shows the Hamiltonian corresponding to a feasible set of power with 27 elements computed at time step of
s for a single cycle of EEC. As per the figure, at any time step
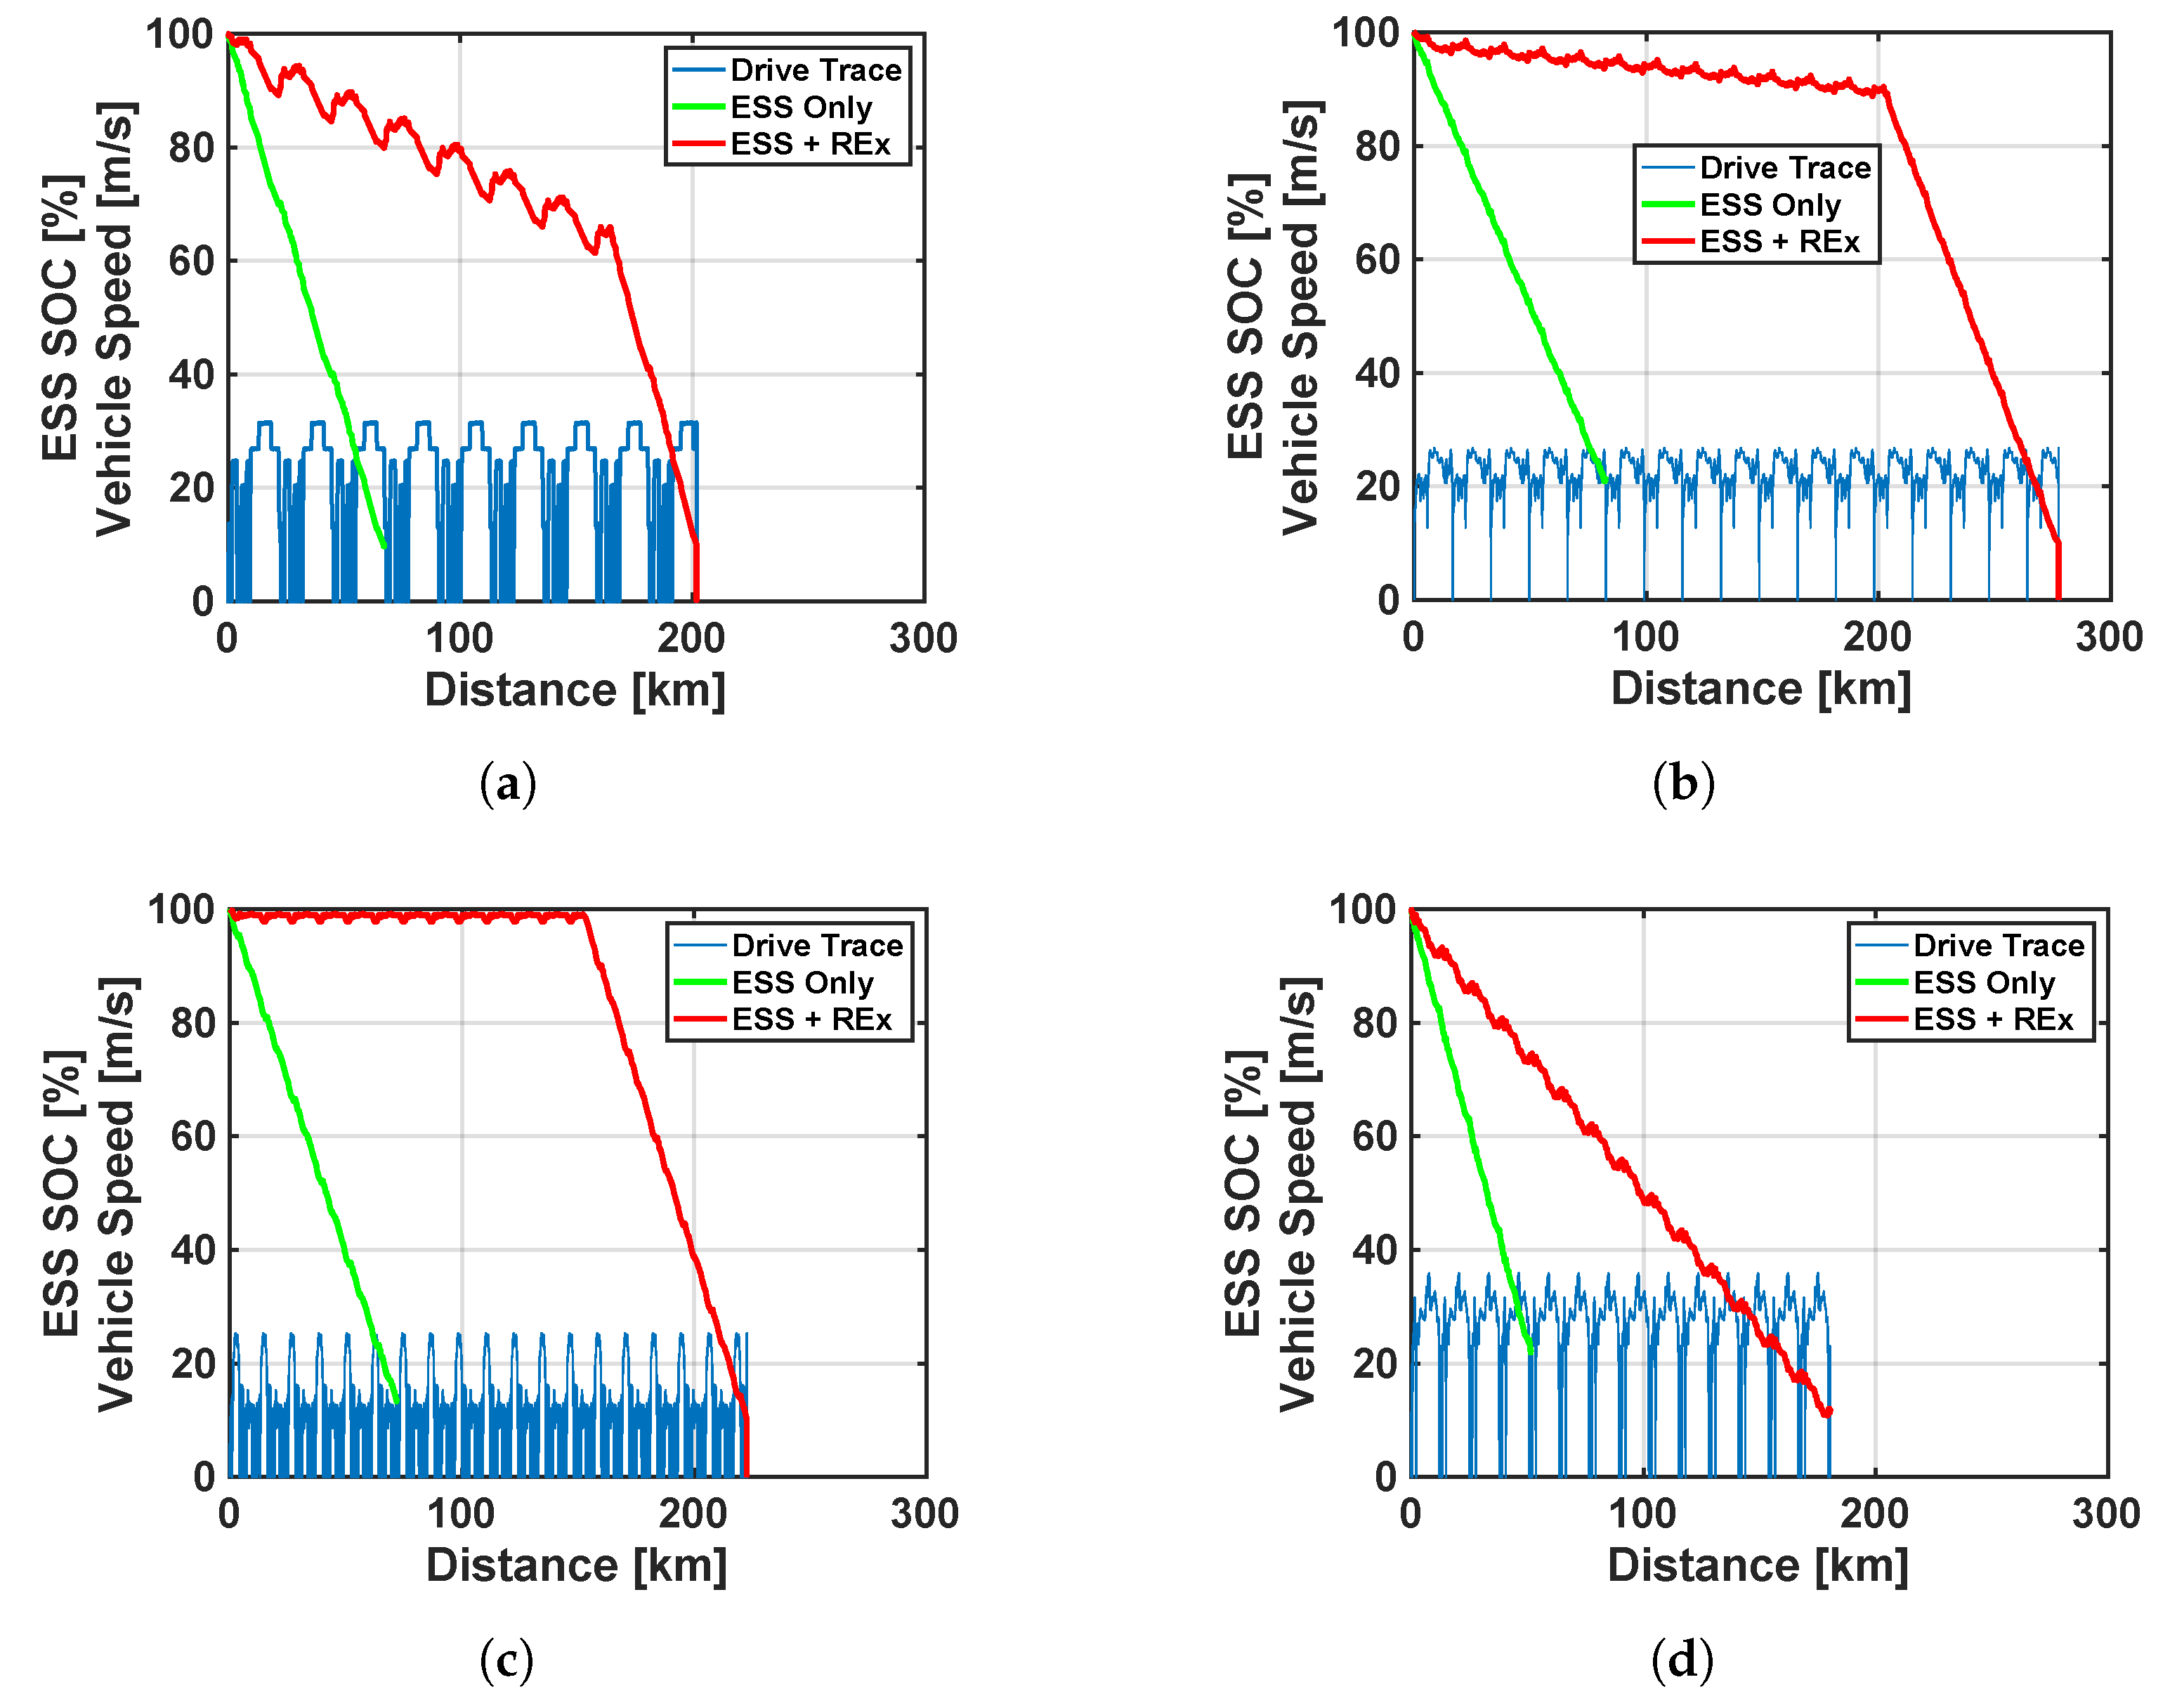
k there are only two feasible options for an optimal solution. One corresponding to the ESS-only operation and the other corresponding to the ESS + REx operation. These simulations were performed on the EEC, HWFET, UDDS, and US06 drive cycles and the observed ESS SoC behavior is shown in
Figure 12. For the US06 drive cycle, as a result of the high power demand (as noted through the dynamic programming results shown earlier), even with maximum REx operation, the ESS SoC approaches the lower limit. In the case of the HWFET and UDDS drive cycles, a sharp drop in ESS SoC is observed for the ESS + REx operation due to fuel reserve depletion. A key takeaway from these results is that based on the final SoC constraint, only two feasible operating solutions exist. The ESS-only solution provides the best energy consumption, while the ESS + REx solution provides the maximum range. This limits the range of operation of the REx and the adaptability to variability in the drive power demand.
With the aim to implement an optimal control algorithm on the research vehicle, real-time online energy management optimization algorithms were evaluated as mentioned in the Introduction Section. ECMS and its variants have been proven in literature to have a similar outcome to PMP and are also applicable only for HEVs operating in CS mode. As the PMP evaluation showed only two optimal REx operation set points and the vehicle operates in both CD and CS modes, ECMS was discarded as a possible optimization algorithm.
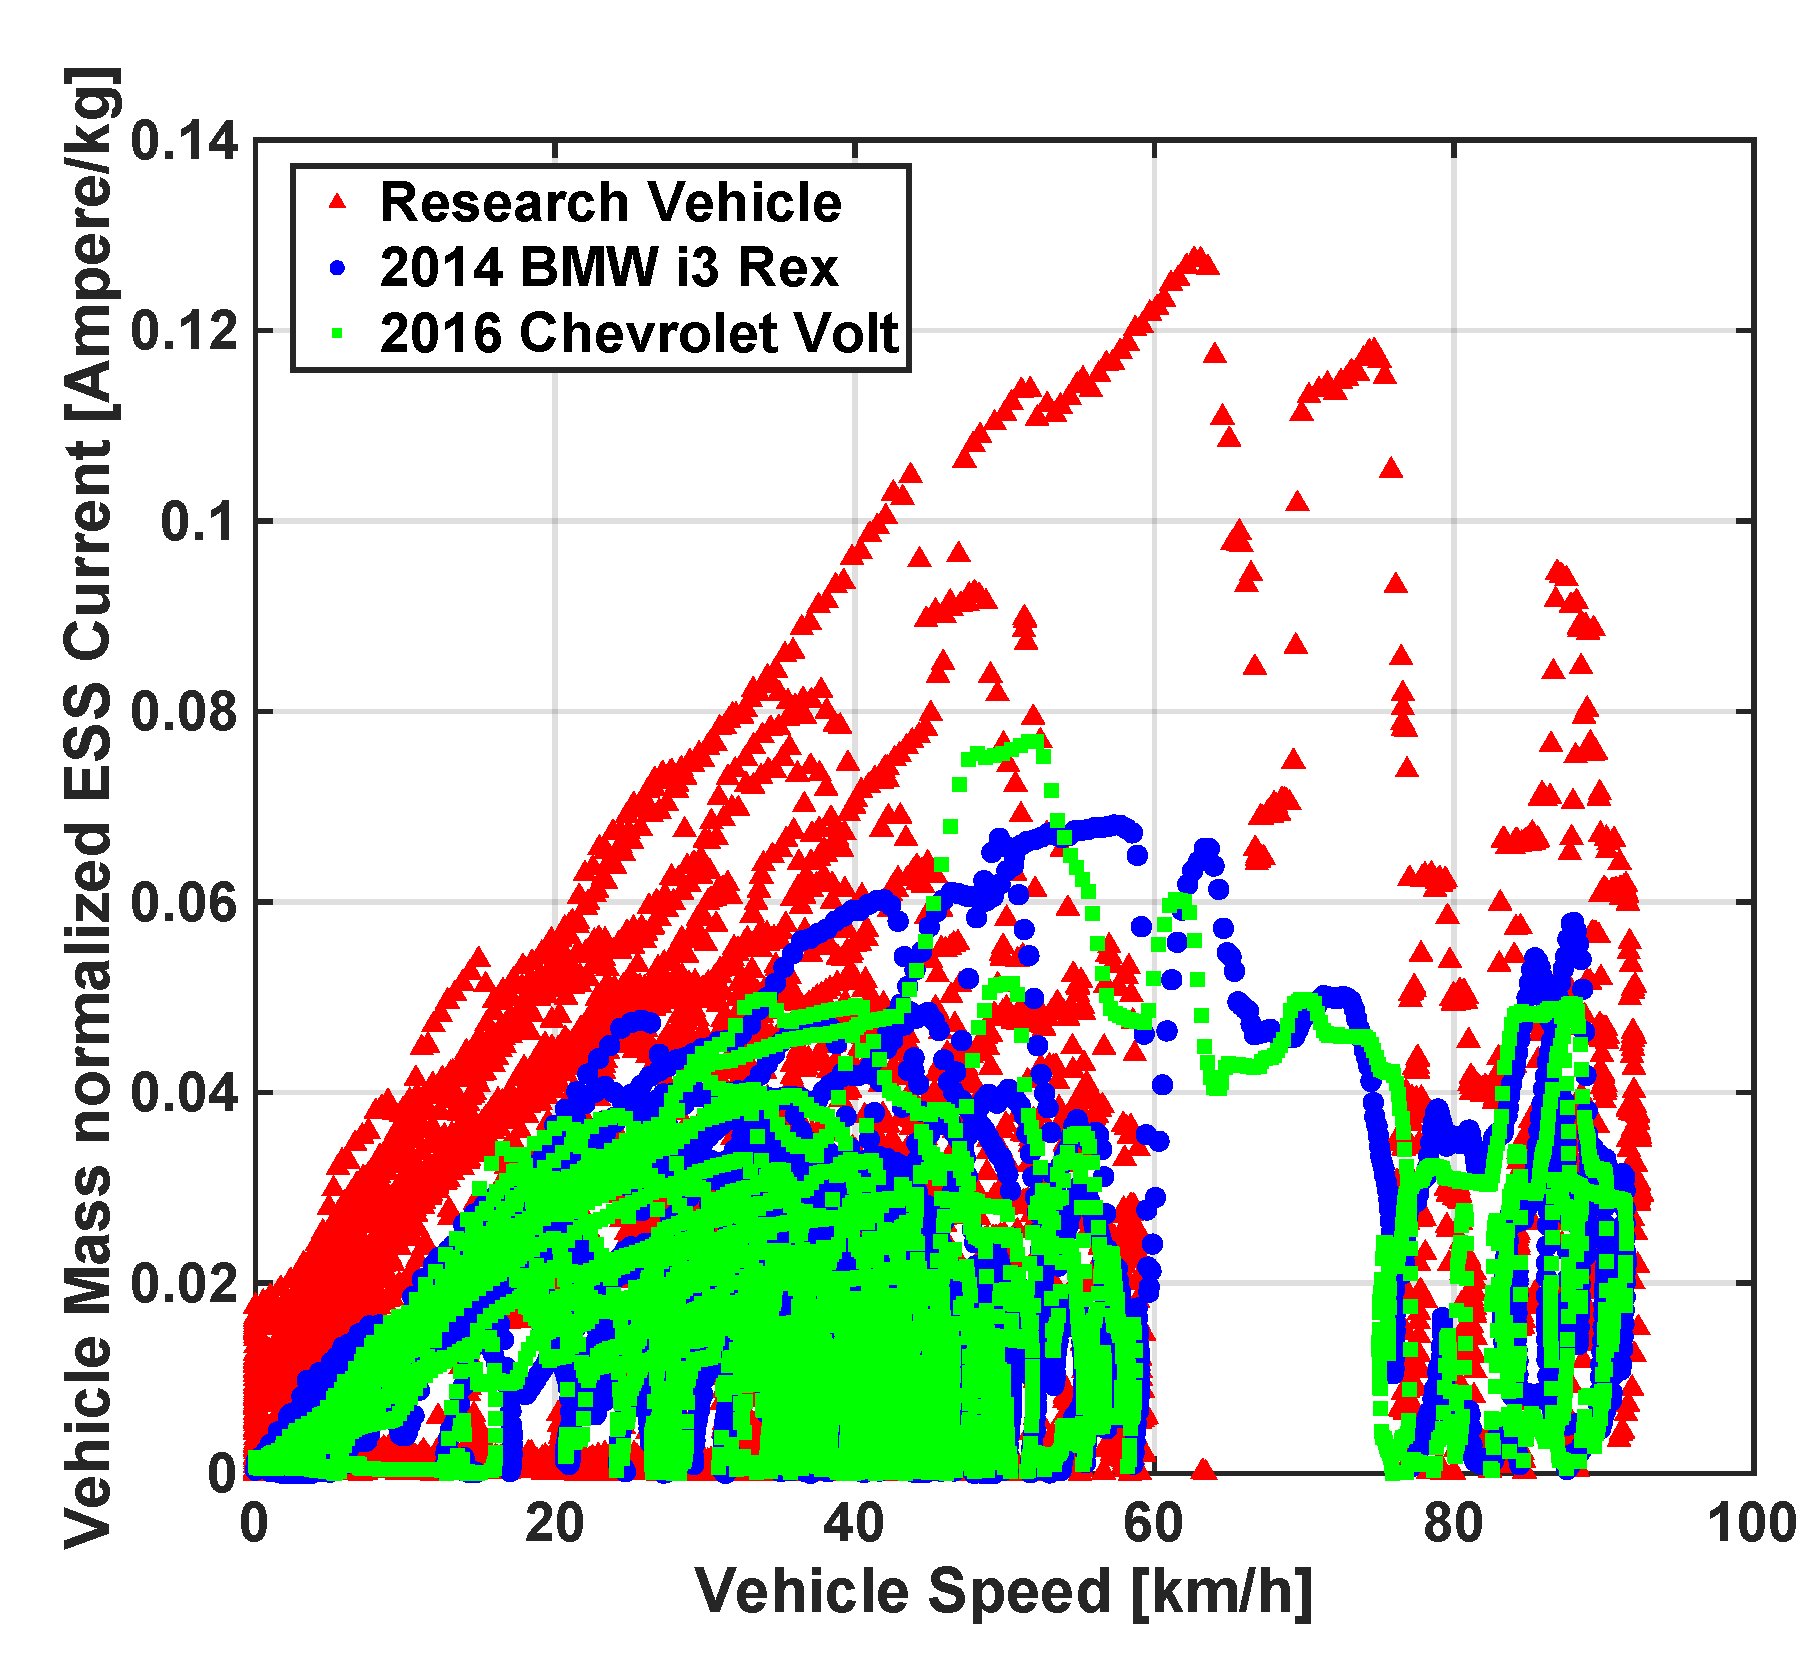
Amongst the in-production EREVs, the 2014 BMW i3 Rex and 2016 Chevrolet Volt, vehicle dynamometer test data were obtained from Argonne National Laboratory (ANL) and analyzed in terms of energy management strategy. Both of these vehicles perform in distinct CD and CS modes, and at an ESS SoC level of ∼15.7%, the CS mode was observed to initiate. ESS power analysis and its comparison with vehicle speed showed that the REx system follows an offline optimized energy management strategy which targets maintaining an ESS SoC level close to
. For the UDDS cycle, the discharge current normalized with vehicle mass as a function of vehicle speed was compared between our research vehicle and the two in-production EREVs mentioned earlier, as shown in
Figure 13. It is evident from the figure that our research vehicle normalized current demand is nearly two times greater than the in-production vehicles. As a result of the operation power limit on the REx system in the research vehicle, implementing a generic CS mode as observed in the in-production vehicles will be inconsequential. Thus, for an energy management strategy similar to in-production vehicles, the research vehicle is expected to deplete through it’s ESS energy, thus limiting the feasible driving range. Therefore, a more blended CD/CS strategy is required for the research vehicle to be operational within the imposed constraints.
Stochastic dynamic programming for energy management has been shown to operate in a real-time online environment but requires offline optimization over a variety of drive cycles to generate optimal transition policies while traversing between different energy states. In our evaluation, dynamic programming optimization results showed high adaptability to changes in drive scenarios. This motivated us to develop an optimal energy management algorithm based on adaptive real-time dynamic programming that can generate optimal control parameters for power distribution in our EREV. To overcome the challenge of obtaining a priori information about the drive, we integrated Google API functions to create an estimated drive trace for the planned drive. The two key elements of our proposed algorithm are (i) using a range constraint parameter to variate power distribution between ESS and REx, and (ii) adapting to changes during actual driving by monitoring energy consumption residuals.
3.1. Distance Constrained Dynamic Programming
The results from dynamic programming evaluation in
Figure 8,
Figure 9 and
Figure 10, showed that the net energy consumption worsened as simulated driving distance increased. If the required driving range is known prior to the drive or can be treated as a user-input variable, the optimal power distribution between the ESS and REx within these new constraints can be obtained. For this variant of the algorithm, we still use the cost function, as shown in Equation (
13). Though the feasible set of operating parameters is subjected to the driving range constraint condition. Here, the feasible sets of
and
, i.e.,
and
, are derived from the feasible set of ESS SoC at each time step
k, i.e.,
.
itself is determined from the net power demand and range extender available power, i.e.,
and
, where
. With the additional range constraint, the feasible set of ESS SOC is represented as
such that
. The range constraint changes the lower limit of the set
, i.e., at time step
k, if
such that
, then
such that
, to form the new feasible subset of operating parameters. The range constrained feasible set
is computed at every time step
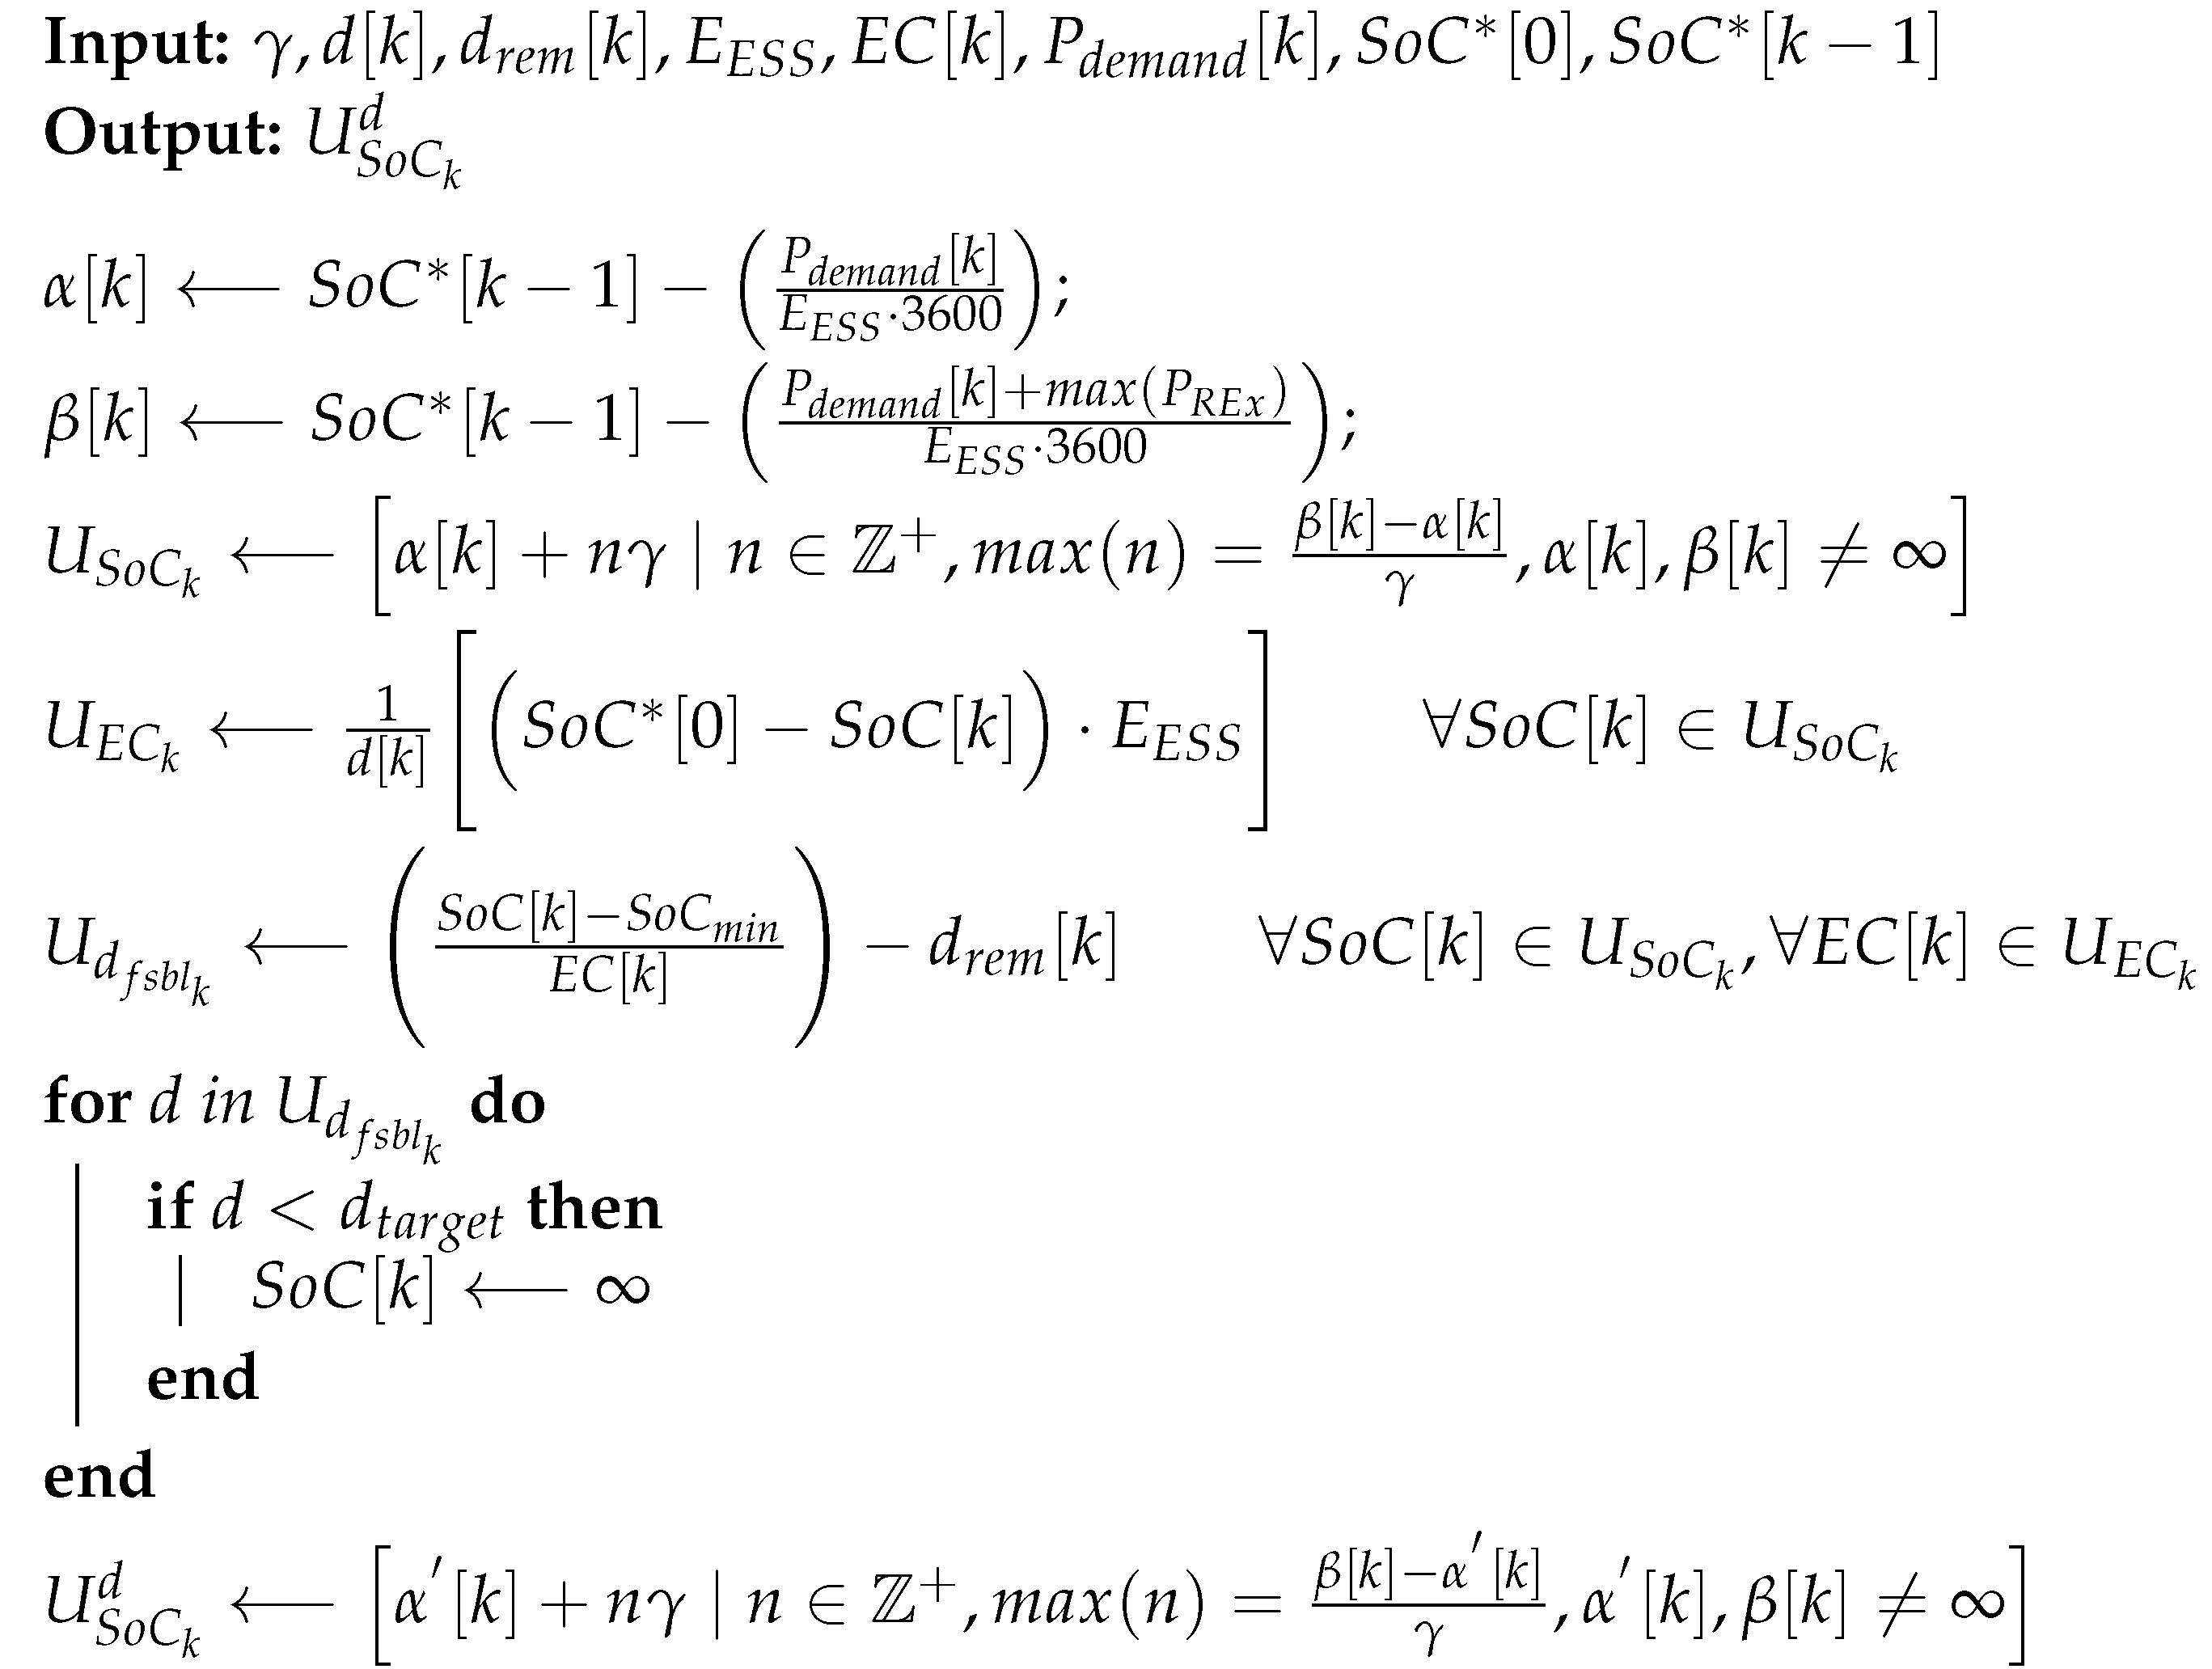
k as per Algorithm 1.
At any time step
k, the algorithm takes the SoC range precision factor (
), distance travelled (
d), distance remaining (
), total energy capacity of ESS (
), ESS energy consumption (
, power demand
, and the optimal SoC, i.e.,
, from the previous time step
and initialization. Using these inputs, the lower and upper limits to
, i.e.,
and
, are computed. Here,
corresponds to ESS-only operation, while
corresponds to the ESS and maximum REx operation. With
, which is equivalent to
SoC and provides a power precision of
W every time step
k and the limits,
is obtained. In
Figure 14 at time step k = 1, the blue circles represent the feasible ESS SoC set,
. To determine
, we next compute
, which forms a set of
at time step
k and is further used to compute
, which is a set of the feasible distance the vehicle can travel. Here, the feasible distance computation is based only on the remaining ESS SoC. This provides the worst case scenario solution, as ESS energy is the limiting factor for an EREV. Finally,
is compared against the desired distance target (
) and infeasible
values are changed to
∞. In
Figure 14 at time step k = 2, the blue circles represent the range constrained feasible ESS SoC set,
and the yellow circles represent SoC values which are infeasible as a result of the range constraint. This process continues
. The impact of adding a range constraint to dynamic programming optimization is elaborated in the Results Section.
| Algorithm 1: Compute feasible set of ESS SOC subject to driving range constraint at time step k. |
![Electronics 09 00228 i001 Electronics 09 00228 i001]() |
3.2. Adaptive Distance Constrained Dynamic Programming
The estimated average vehicle speed obtained from Google API is helpful for the proposed optimization. However, the variability in actual driving and real-time changes in traffic conditions can cause the energy consumption to deviate from the pre-drive optimal solution. The effect of this variability was evaluated over a randomized drive trace bounded within speed limits with reference to the average vehicle speed obtained from Google. Equation (
15) shows the relationship to obtain this random new speed from a normal distribution
, where
is the new speed at previous time step
, i.e.,
, and
is the variance. The variance was selected to be 0.0625 to limit the magnitude of instantaneous acceleration within a limit of driving comfort, i.e., 0.2 G. A speed limit parameter is also used to prevent the new randomized speed deviate from the average vehicle speed obtained from Google API.
To compare the effect of variation in vehicle speed against the average vehicle speed used for optimization, we monitor the ESS SoC state variable. It was observed that for a randomized vehicle speed obtained from Equation (
15), a deviation of ∼3% ESS SoC can occur at the very least. This deviation can cause a violation of the driving range constraint or can increase the net energy consumption. Thus, the optimal solution needs to be recomputed to avoid these violations. For this we calculated the absolute difference in magnitude between the optimal ESS SoC and actual ESS SoC, known as the ESS SoC residual, as the vehicle covers the required distance. If the ESS SoC residual exceeds the limit, it recomputes the optimal solution for the remaining ESS energy and distance.
3.3. Proposed Real-Time Application of Adaptive Distance Constrained Dynamic Programming
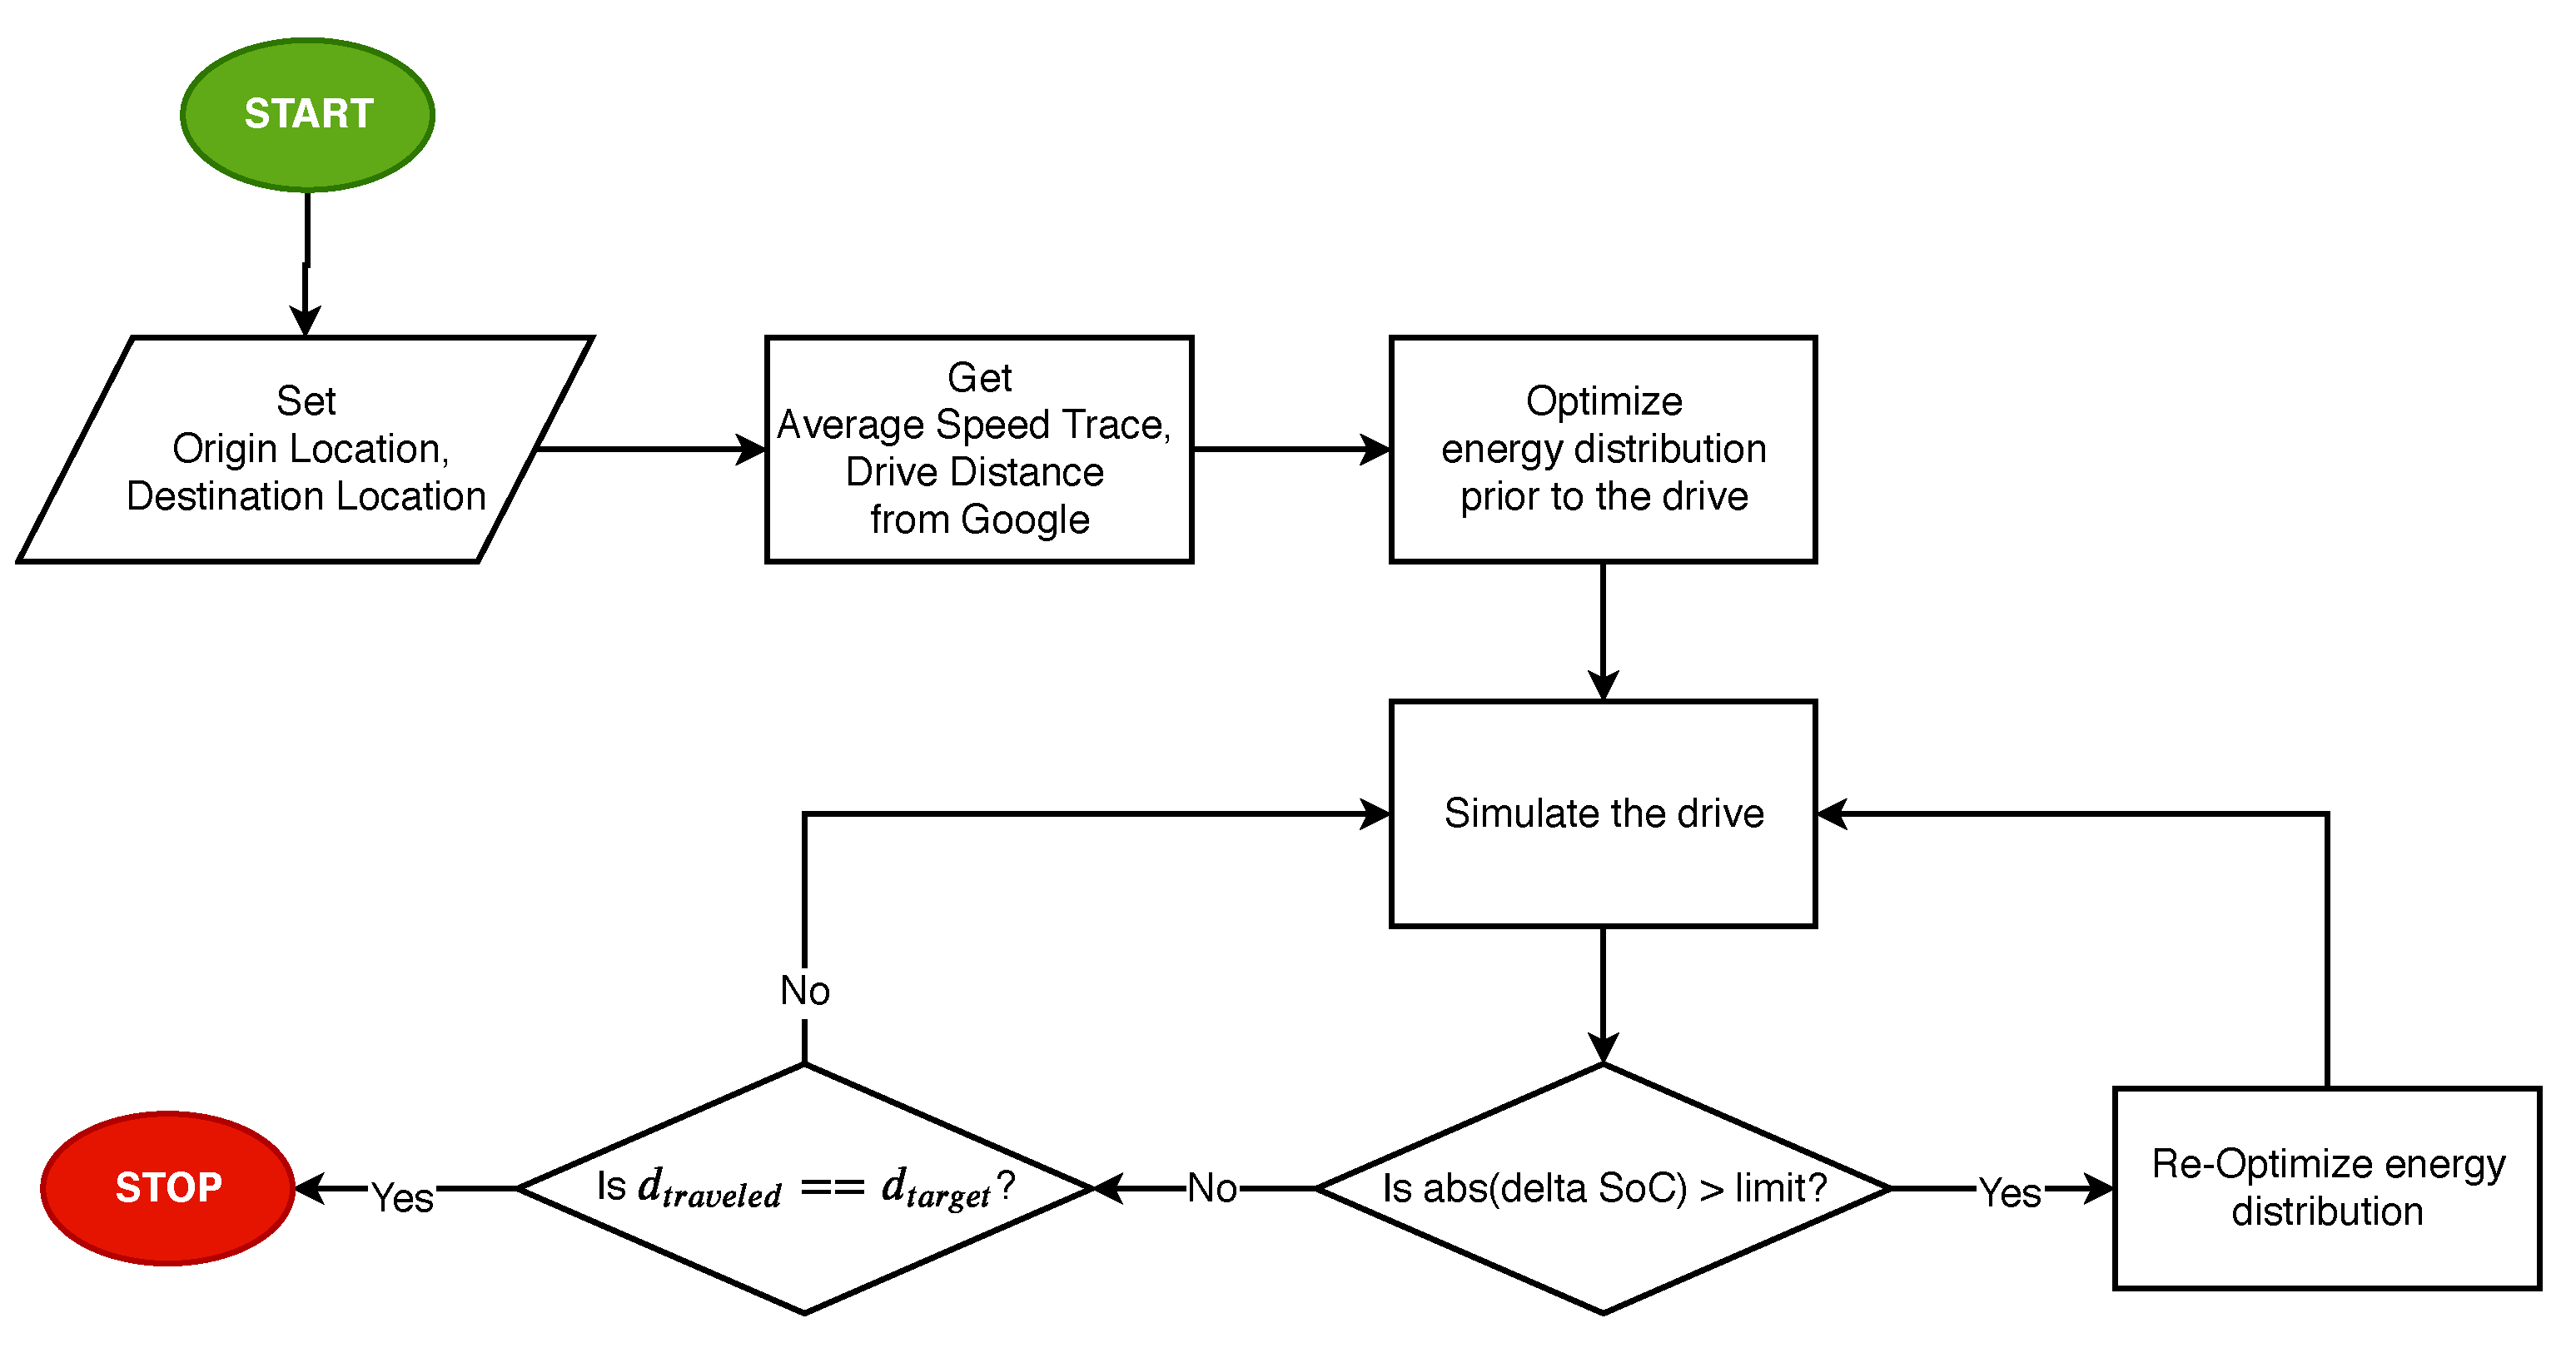
The process flowchart for this proposed scheme is represented in
Figure 15. The proposed energy management optimization scheme is subdivided into two phases: (1) pre-drive optimization; and (2) real-time reoptimization. As the proposed scheme is based on the dynamic programming algorithm, a priori knowledge of the drive is required for both the phases. Thus, we implemented a tool that uses Google Directions API to generate an estimated speed trace of the journey based on user inputs for origin and destination locations. The API uses Google’s “best guess” traffic model to determine the duration of travel between different path nodes, which is crucial in building the estimated speed trace.
Figure 16 shows the output of the estimated speed trace generating tool. In this example scenario, the speed trace is generated from coordinates (
) to (
), which results in an
km long travel. To emulate variability in driving, we used the two randomized speed traces shown in
Figure 16c.
Using this a priori knowledge about the drive, the proposed scheme performs Phase 1 and generates an optimal set of control parameters for the EREVs REx system. As the simulation proceeds, the ESS SoC residual is computed and compared against a predefined limit. If the residual exceeds the limit, it initiates Phase 2, i.e., reoptimization of control parameters. This reoptimization only occurs for the remaining travel distance and available energy. The updated control parameters are now used for the remaining drive. This process of reoptimization is part of an iterative decision loop and thus can occur as many times the ESS SoC residual exceeds the limit.
4. Results and Discussion
In this section, we provide simulation results showing the key stages of evaluation of this proposed algorithm. First, we present the implementation of the dynamic programming algorithm with a distance constraint variable and its impact on energy consumption of the research vehicle. We then present results which show a comparison of the proposed algorithm with and without the reoptimization process. Finally, a comparison of the proposed algorithm against the conventional CD/CS algorithm used in EREV energy management is provided. Interpretation of these results, the assumptions made, and limitations are also discussed.
4.1. Implementation of Distance Constrained Dynamic Programming
The dynamic programming algorithm with distance constraint as described in the previous section was implemented on the research vehicle model. A simulation sweep for the UDDS and US06 cycles with varying target distances,
km, was conducted. For the UDDS cycle scenario as shown in
Figure 17a–c, the algorithm was able to optimize for all values of
. The net optimal energy consumption values increased with an increasing
. A minimum of 0.23 kWh/km and a maximum of 0.81 kWh/km net energy consumption was obtained for the UDDS cycle evaluation.
For the US06 cycle scenario as shown in
Figure 17d–f, the algorithm was able to optimize for all values of
except 150, 200, and 250 km, as shown by the triangle (
▴) markers in
Figure 17f. The net optimal energy consumption in this case also showed a similar increasing trend as in the case of the UDDS cycle. A minimum of 0.25 kWh/km and a maximum value of 0.53 kWh/km was obtained for the successfully optimized US06 cycle evaluations. A key difference between the UDDS and US06 cycle was a consistently high energy consumption value for all optimized
values. This observation is consistent with US06 being a relatively higher speed cycle than UDDS.
The vehicle energy management inherently prefers to only use ESS energy in order to maintain a low net energy consumption. Such an outcome reduces EREVs feasibility to meet the required target distance. Hence, our implementation of distance constrained dynamic programming for EREV energy management showed that the feasible set of solutions at each stage of DP can be varied with the target distance parameter. This allowed the vehicle to meet the target distance while being optimal in net energy consumption. On the basis of the UDDS and US06 cycle simulation results shown in
Figure 17, the final ESS SoC can be observed to be higher as the target distance increases. This was expected, as a higher target distance would require the REx system to be operational and provide supplemental energy. In
Figure 17d, the optimal solutions for target distances 150, 200, and 250 km are in violation of the distance constraint but the optimal solution for
km does not violate
km. This implies that in some cases for a solution to not violate both the final ESS SoC and target distance constraints, it will be suboptimal for the net energy consumption.
An assumption for computing the feasible driving distance was made based on EREV behavior. We assumed that the available energy at any point of time during the drive is the energy available in ESS only. An EREVs available driving range in the worst case scenario, i.e., if the REx system is nonfunctional, is solely dependent on the available ESS energy. Thus, if we optimize with the worst case scenario, we can always ensure that the vehicle will be able to meet the ESS SoC and target distance requirements, if successfully optimized. On the basis of these results, we were able to establish a functional dynamic programming algorithm with a distance constraint.
4.2. Adaptive Distance Constrained Dynamic Programming
The distance constrained dynamic programming algorithm was integrated with an ESS SoC residual-based reoptimization. This approach made the algorithm adaptive to variation in driving, and by extension, energy usage. This approach was evaluated for standard drive cycles and for custom drive cycles obtained from Google Directions API. The results presented in this section are for a custom drive cycle as shown in
Figure 15 and the randomized speed traces derived from it. The ESS SoC deviation limit to initiate reoptimization was chosen to be 3%. This value was chosen to prevent unwanted reoptimizations due to modeling errors while preventing excessive deviations from an optimal solution.
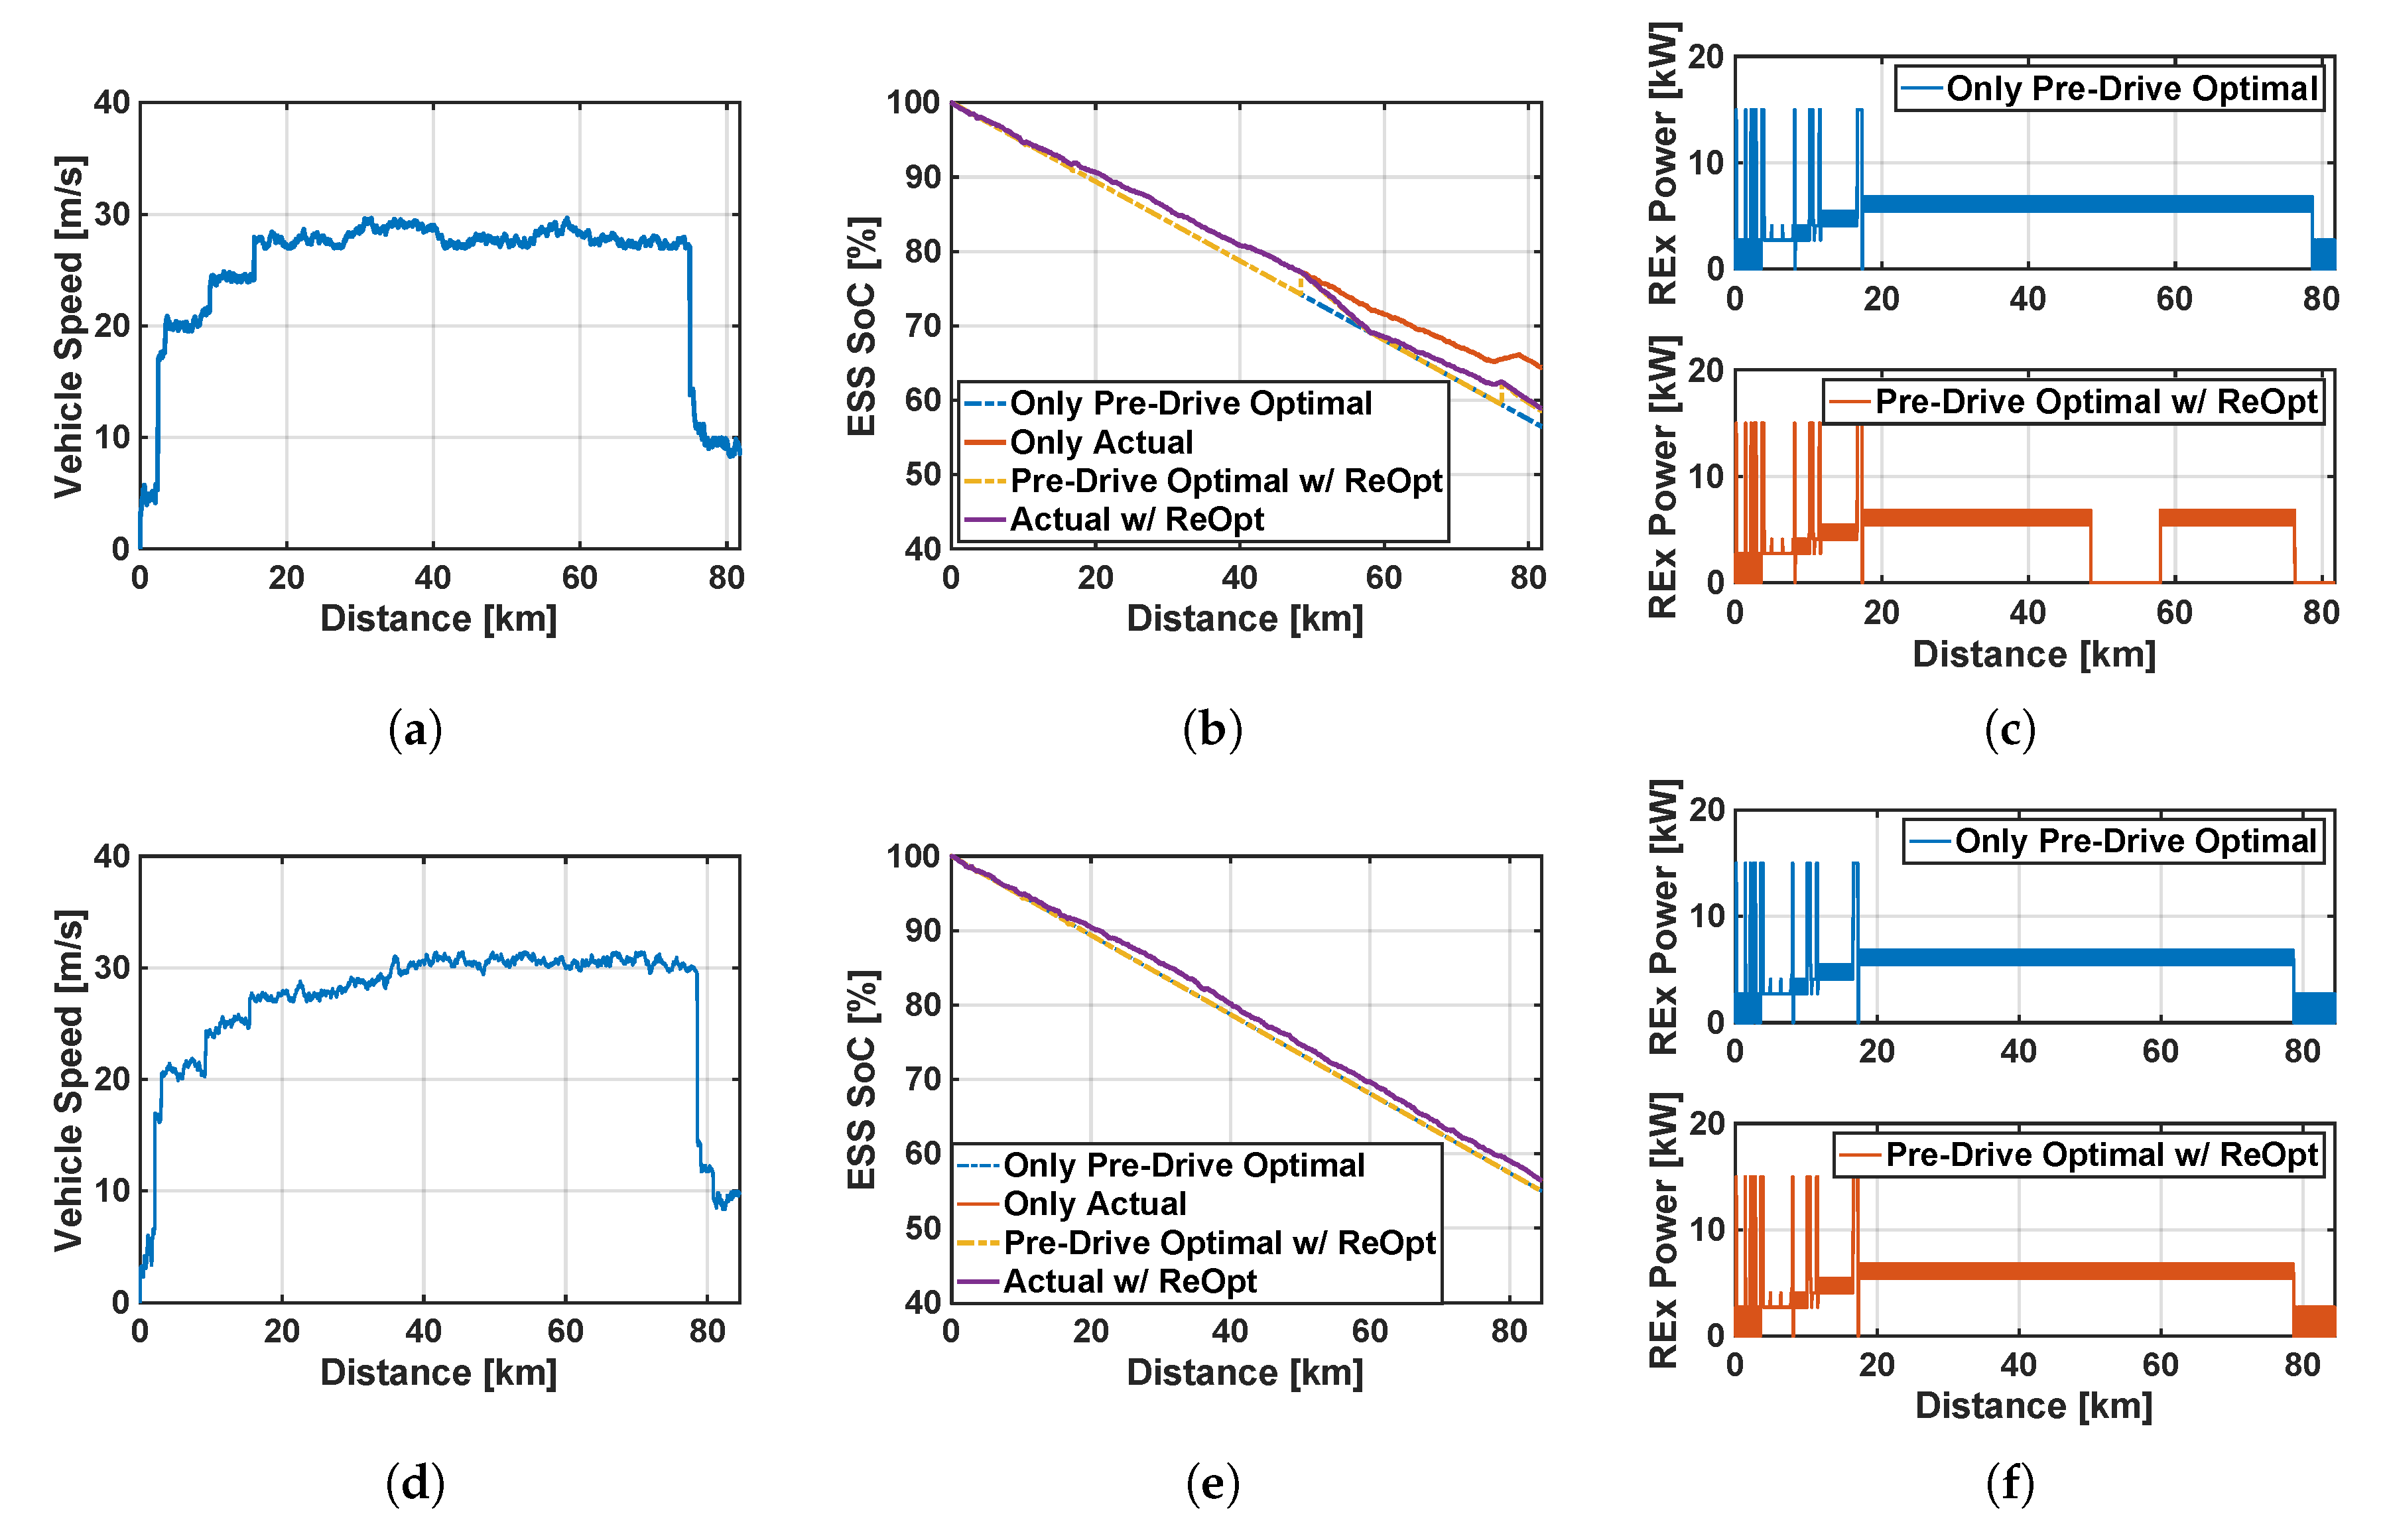
Figure 18a–c show results for the Random 1 speed trace, where the actual energy demand was much lower than the pre-drive optimal estimate. Similarly,
Figure 18d–f show results for the Random 2 speed trace, where the actual energy demand was within the deviation limit of the pre-drive optimal estimate, and
Figure 18g–i show results for the Random 3 speed trace with an actual energy demand much higher than the pre-drive optimal estimate.
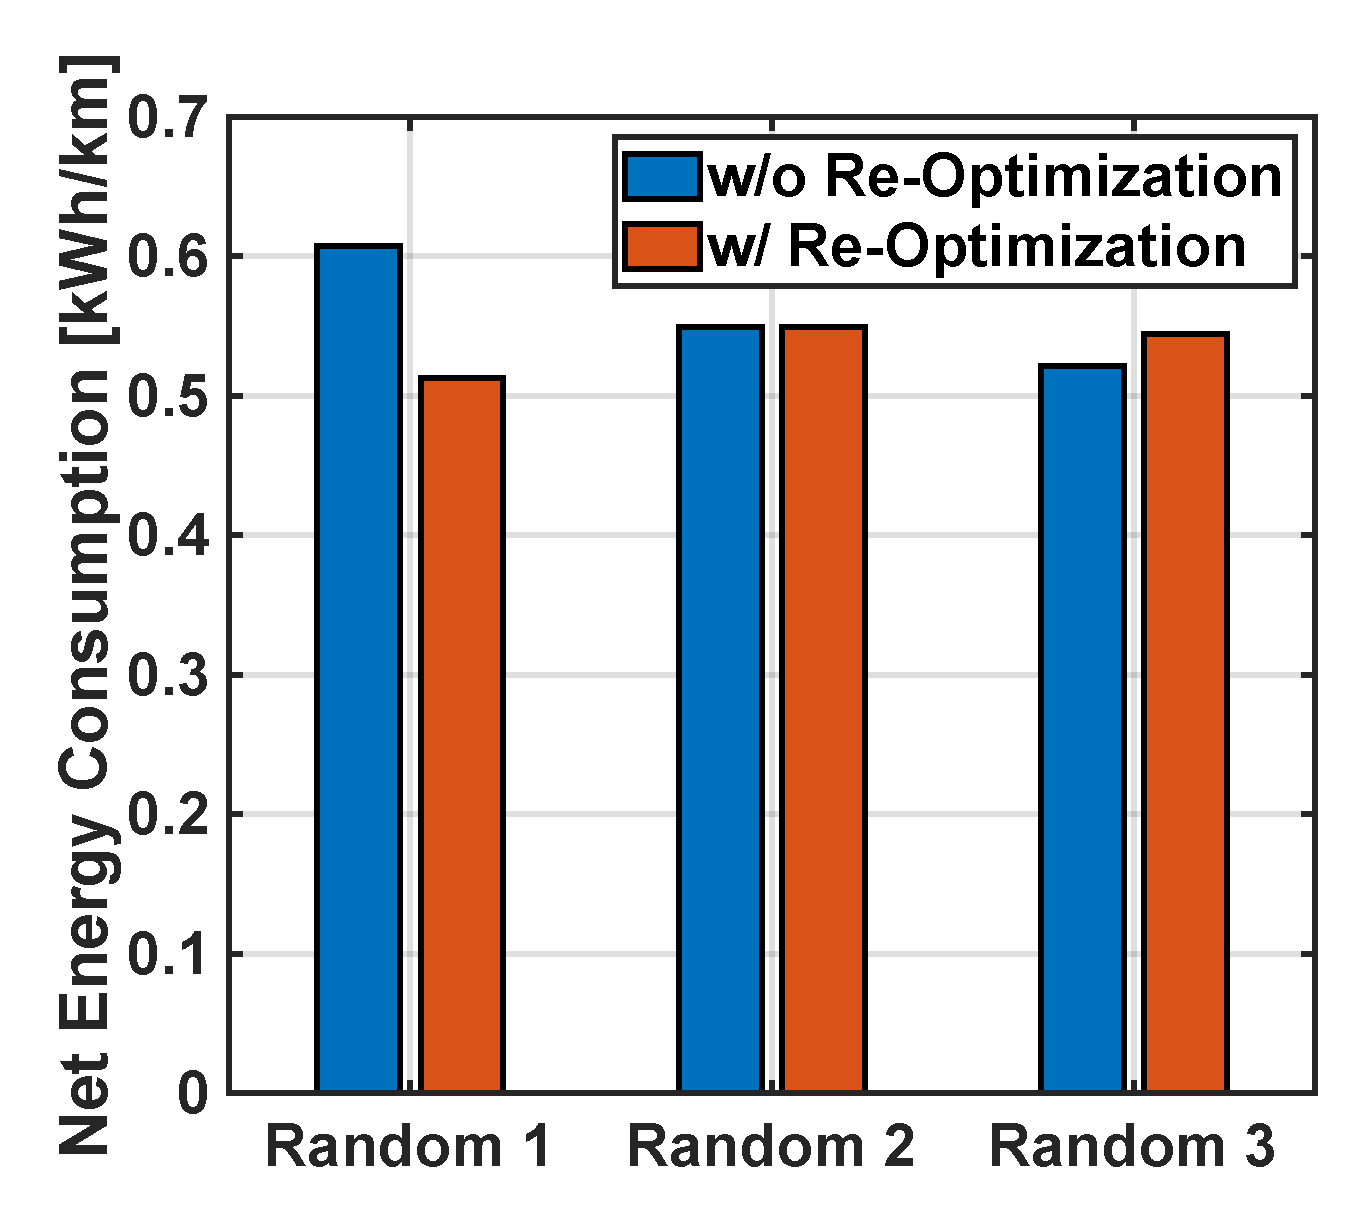
For the Random 1 speed trace, ESS SoC was observed to deviate by 8% from the pre-drive optimal solution, resulting in an excess usage of fuel by the REx system. With reoptimization, the solution was observed to adapt at 49 km and 75 km distance markers resulting in a < 1% deviation from the new optimal solution and a 2.4% deviation from the pre-drive optimal solution. In the case of the Random 2 speed trace, ESS SoC was observed to stay within the 3% limit, thus resulting in no reoptimization events. Finally, for the Random 3 speed trace, ESS SoC was observed to deviate by 9% from the pre-drive optimal solution, resulting in excess usage of ESS energy. With reoptimization, the solution was observed to adapt at 53 km, 71 km, 82 km, and 84 km distance markers resulting in a 2% deviation from the pre-drive optimal solution. In this case, the reoptimization resulted in an increased power demand from the REx system than originally optimized. Net energy consumption values for the three randomized speed traces with and without reoptimization are shown in
Figure 19. The Random 1 speed trace showed an improvement of ∼15.6% in the net energy consumption, while the Random 3 speed trace increased the energy consumption by ∼4.4% but satisfied the driving distance constraint. The Random 2 speed trace shows a similar net energy consumption in both of the cases.
Driving behavior tends to vary due to several system and environmental disturbances. Hence, it is challenging to have a deterministic knowledge of future driving speeds. Stochastic approaches to obtain an estimate of future driving speeds are discussed in the literature but they increase computational load. In our proposed approach, we leveraged the average speed information obtained from Google Direction API which uses a proprietary traffic estimation model along with live traffic data. The average speed trace served as an initial baseline, though possible deviations can occur as observed with the three random speed traces. Speed deviations result in energy demand variations which are used to initiate reoptimization. The reoptimization process only computes optimal operation parameters for the remaining drive. On the basis of the Random 1 speed trace results, if energy demand is lower as a result of a lower than expected speed, the reoptimization process reduces the REx system run-time for the drive. By extension, if the vehicle comes to an unexpected complete stop, as the residual calculation is not a function of time but of distance travelled, the reoptimization process is expected to handle such variations.
On the other hand, on the basis of the Random 3 speed trace results, if the energy demand is higher as a result of a higher than expected speed, the reoptimization process causes an increase in the REx system run-time. Such an outcome would result in an increased net energy consumption than expected initially to meet the final ESS SoC and target distance requirements. This was expected based on our presented hypothesis and subsequent validation of the distance constrained dynamic programming explained in the previous subsection. This is further confirmed by net energy consumption results, as shown in
Figure 19. With reoptimization the EREV was able to obtain optimal net energy consumption results without violating the final ESS SoC and target distance requirements. Thus, the adaptive distance constrained dynamic programming is able to provide optimal results in the case of driving disturbances.
4.3. Comparison of Adaptive Distance Constrained Dynamic Programming
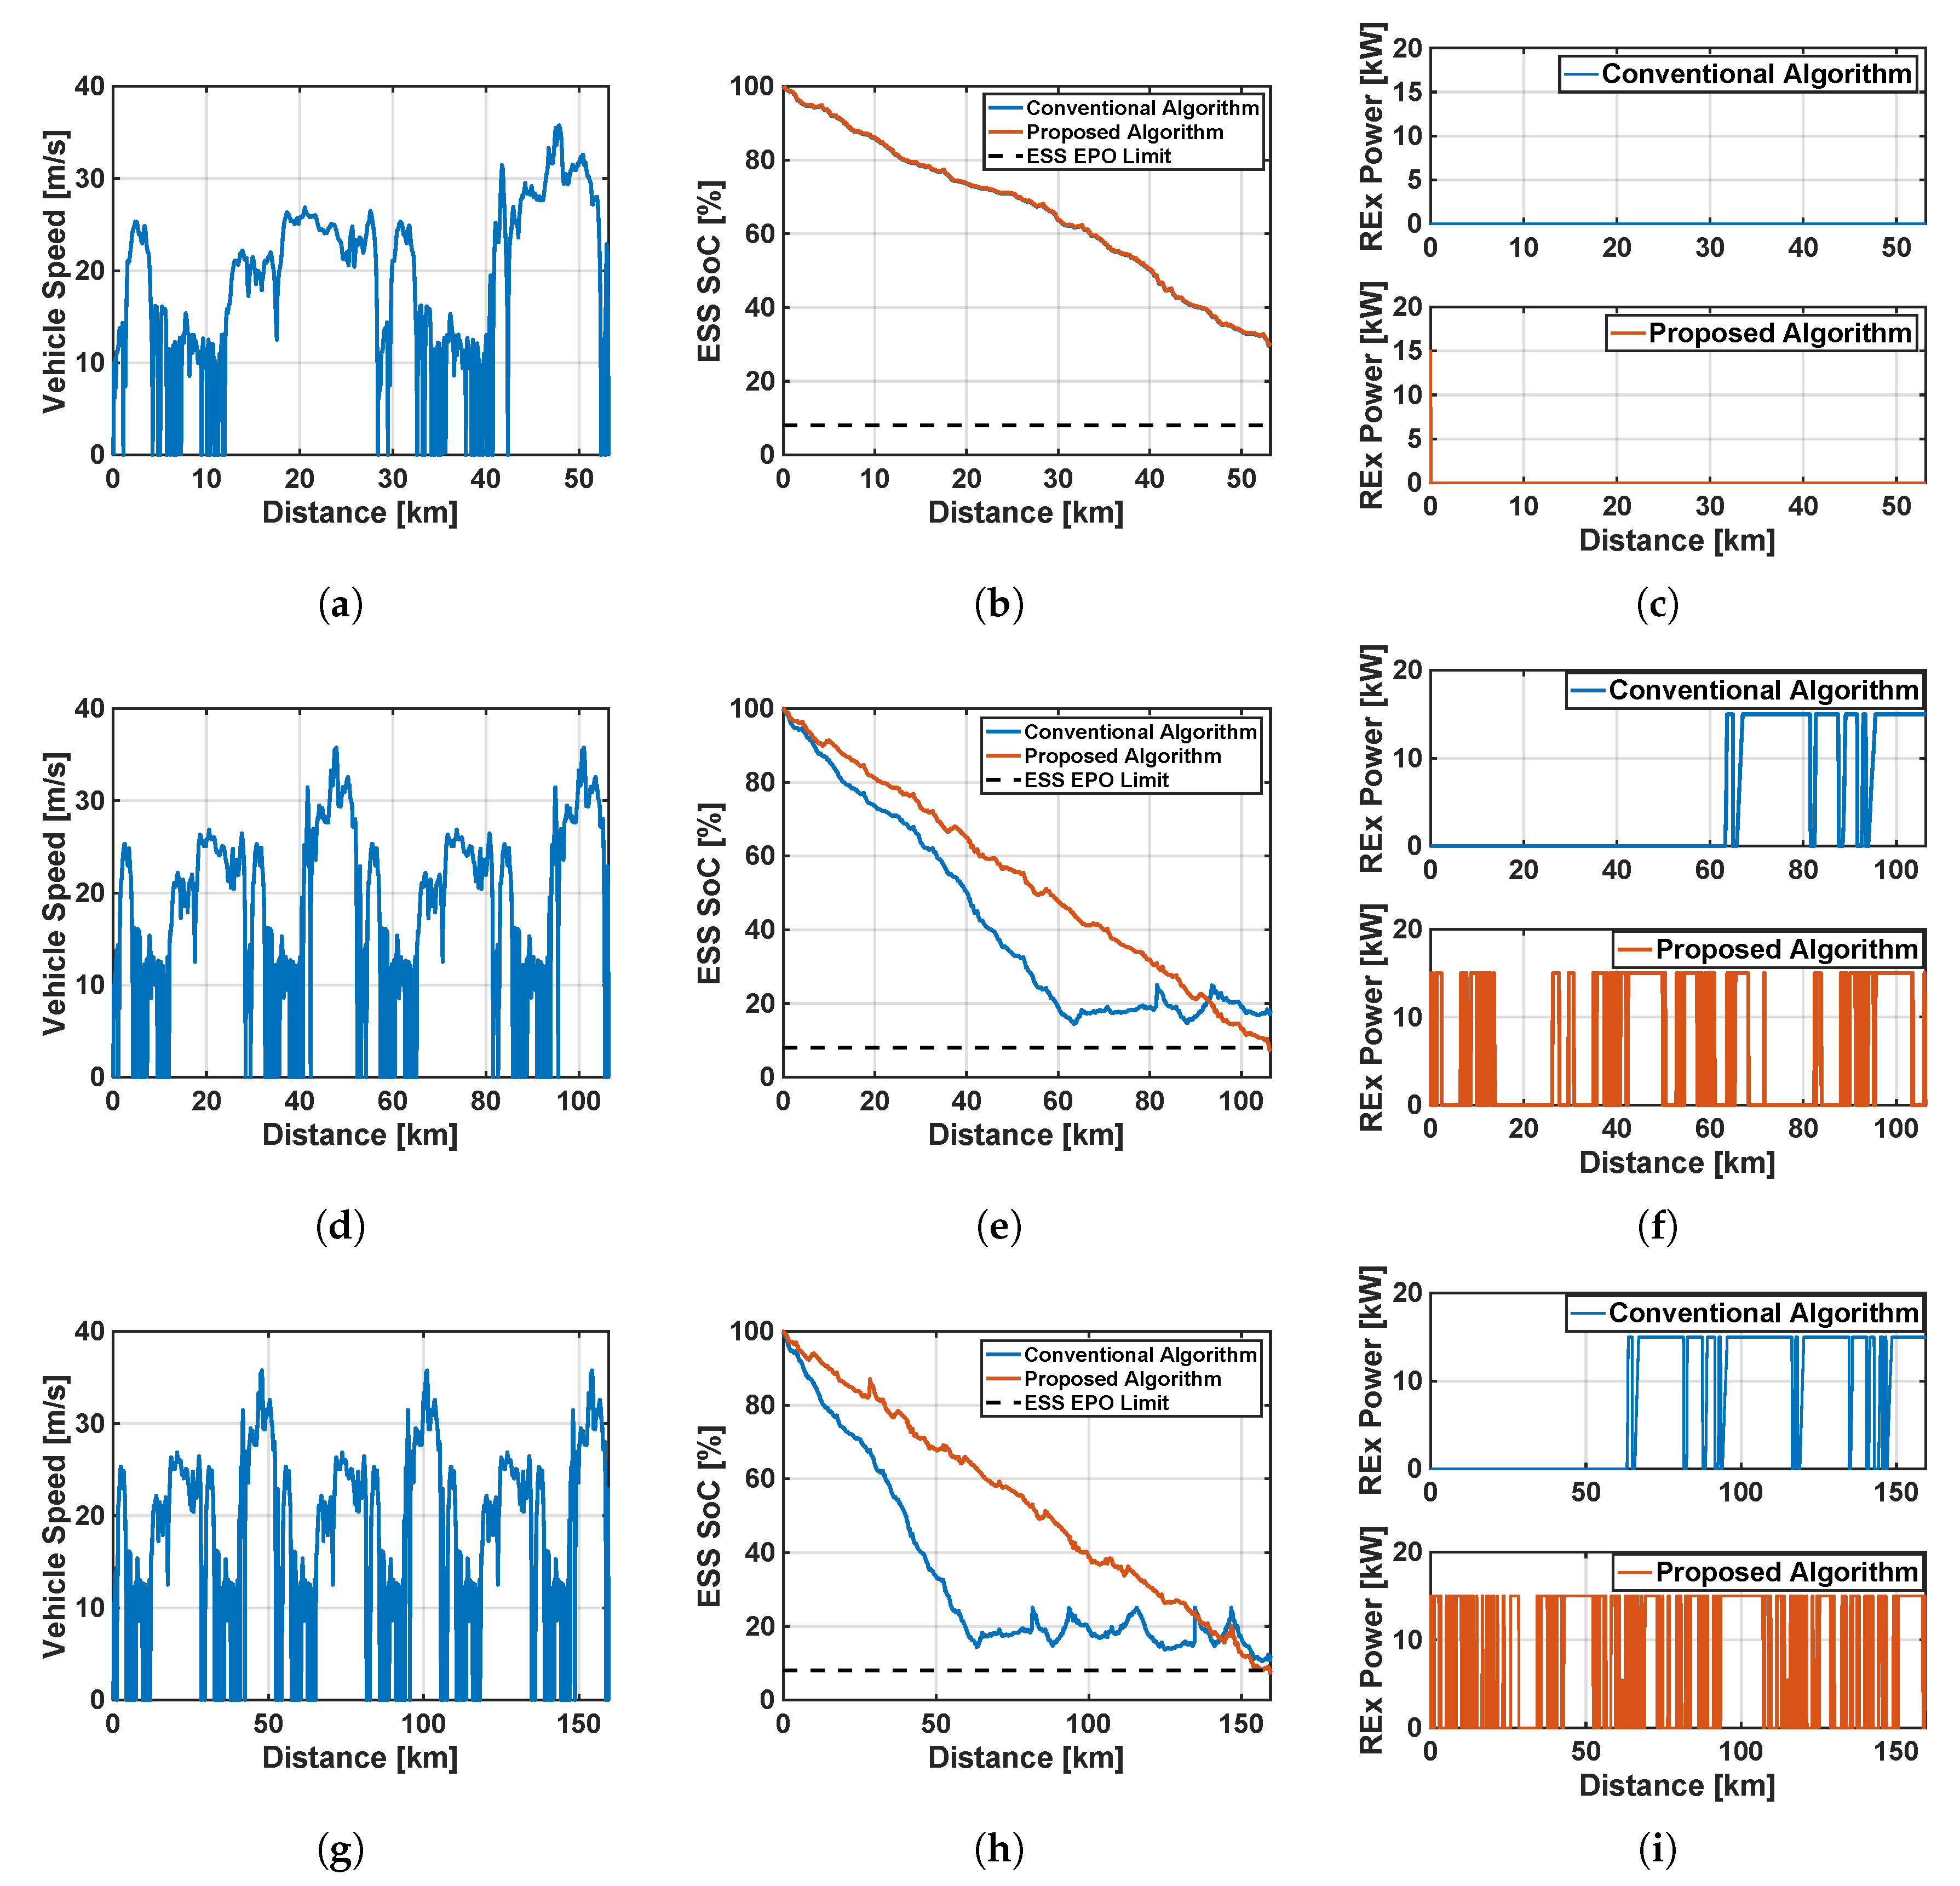
We evaluated the performance of our proposed algorithm against the more conventional energy management approach for EREVs. This was based on operating the vehicle in two distinct modes, CD and CS, depending on the ESS SoC value. For the comparison presented, we used the UDDS-HWFET-UDDS-US06 cycle, a combination of the standard cycles used by the Environmental Protection Agency (EPA). The ESS SoC band for the CS mode was chosen to be between 15% to 25%. These values ensured that when the REx operated at its maximum output power, the minimum ESS SoC limit was not violated. The minimum ESS SoC limit was chosen to be 8% as per vehicle tests. The ESS was found to perform an emergency power off (EPO) below that limit. In
Figure 20, we have provided the results showing a comparison between the two algorithms, where
Figure 20a–c correspond to a single cycle run,
Figure 20d–f correspond to a double cycle run, and
Figure 20g–i correspond to a triple cycle run.
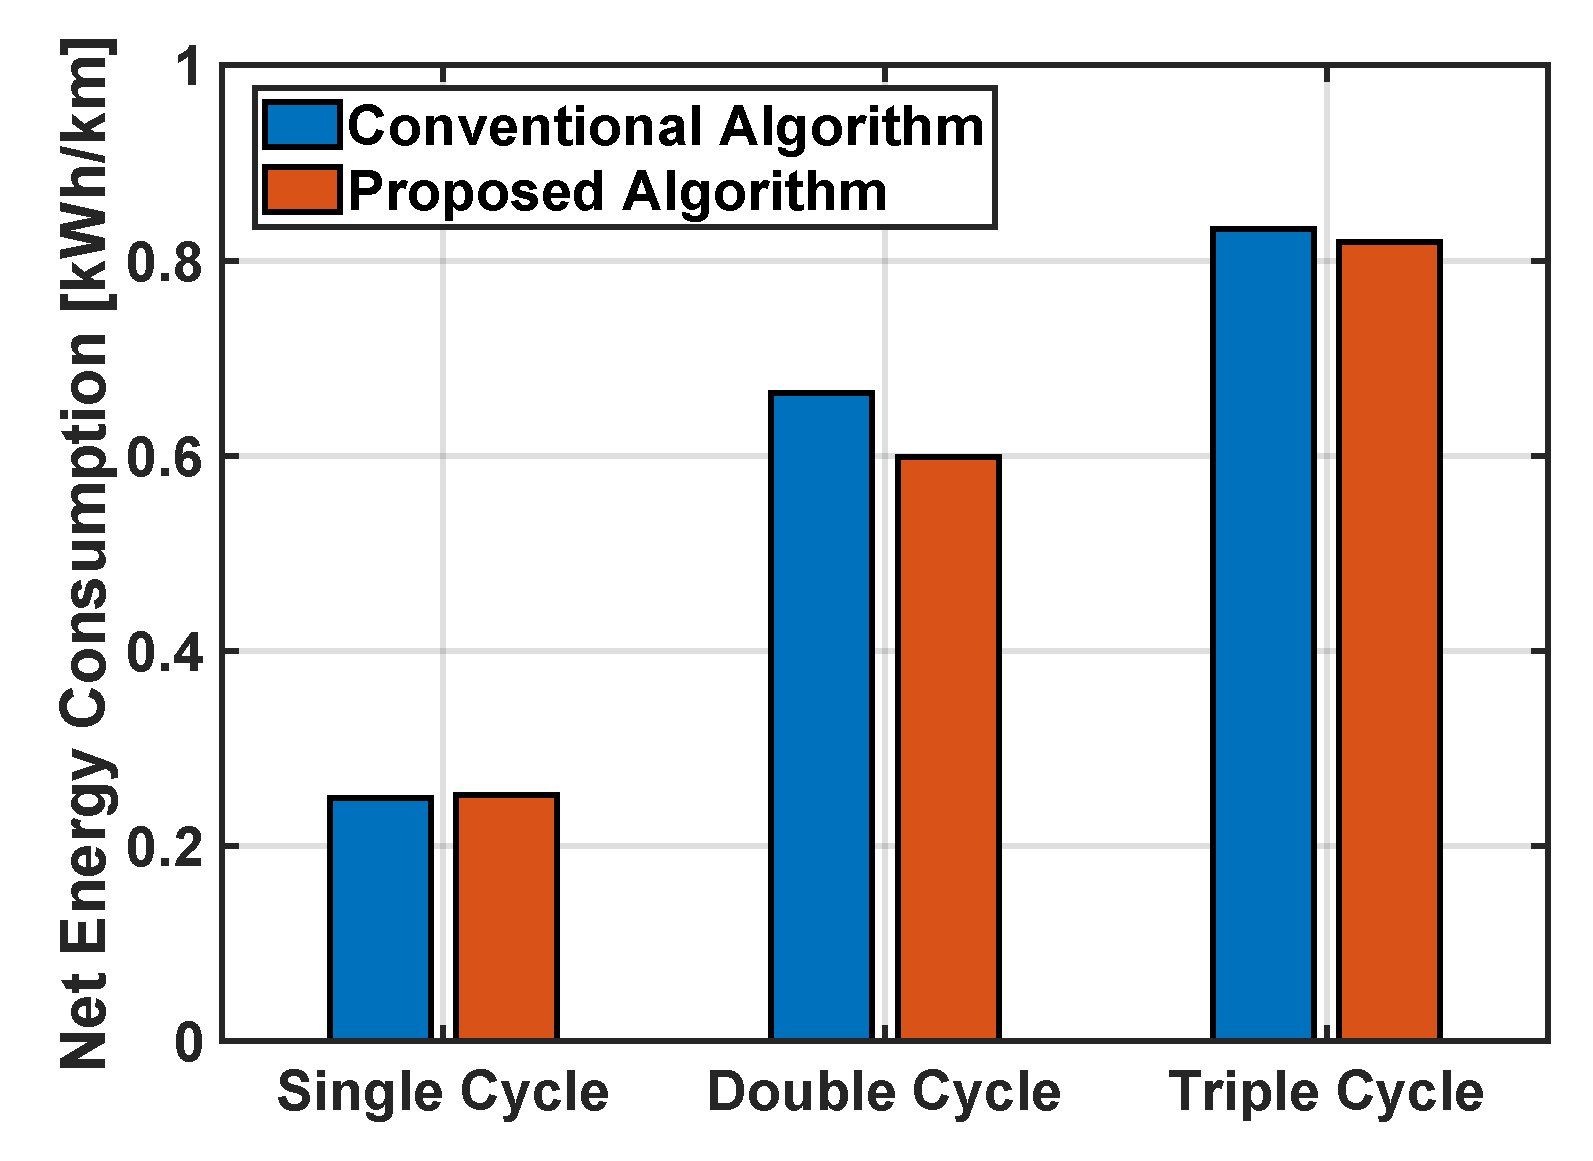
For a single cycle run, both the conventional algorithm and the proposed algorithm showed a similar behavior with the vehicle operating in the CD mode, i.e., using only ESS energy. Thus, the net energy consumption is of the same magnitude. In the case of a double cycle run, the conventional algorithm covers ∼60 km distance in CD mode and the remaining in CS mode. Our proposed algorithm showed an earlier activation of the REx system to meet the driving distance and minimum ESS SoC requirements. A similar behavior was observed for the triple cycle run case also, where our proposed algorithm was able to generate optimal control parameters for the REx system that satisfied the driving distance and minimum ESS SoC requirements. The double and triple cycle run scenario results show the ability of our proposed algorithm to adapt to driving distance changes. The net energy consumption comparison for these three cases as per
Figure 21, shows an improvement by our proposed algorithm over the conventional algorithm. Amongst the three scenarios shown, the largest improvement of 9.8% is observed for the double cycle run and a 1.6% for the triple cycle run. The single cycle run had the same net energy consumption due to operating only in the CD mode.
The conventional EREV energy management approach was obtained from our evaluation of two in-production EREV vehicles, i.e., the 2014 BMW i3 Rex and 2016 Chevrolet Volt. Both the vehicles were found to operate in distinct CD and CS modes. The CS mode was found to initiate when ESS SoC was lower than ∼15.7%. Both vehicles implemented a proprietary CS mode energy management strategy. Thus, for our comparison, we formulated a distinct CD and CS mode energy management strategy for the experimental research vehicle, inspired by the in-production vehicles strategies we evaluated. This derived conventional strategy also switched to CS mode near to 15.7% ESS SoC. With limitations on REx power, the strategy operated REx at its maximum feasible power output when required. To ensure the vehicle did not violate the ESS EPO cutoff and by extension the distance constraint, the CS mode ESS SoC upper limit was determined to be . This representative conventional EREV strategy was evaluated in the MiL and SiL environment along with our proposed algorithm.
In single cycle simulation, the vehicle operates in CD mode for both of the algorithms. This implies that for short distance drives, the proposed algorithm is able to prioritize ESS-only usage over the REx system. A difference between the conventional and proposed algorithm is more evident for the double and triple cycle simulations. The conventional algorithm in both the cases is able to effectively charge sustain and maintain ESS SoC higher than the EPO limit as marked by the dashed black line in the ESS SoC plots. The proposed algorithm on the other hand was observed to employ a blended CD/CS strategy of operation with the REx system. The corresponding ESS SoC trend for the experimental research vehicle was observed to fulfill both ESS SoC and distance constraints. As observed from prior evaluations, such an outcome was expected from the proposed algorithm over the conventional algorithm. In the case of the conventional algorithm, fuel usage was computed to be higher than in the case of the proposed algorithm. For the triple cycle simulation, the conventional algorithm used 17.8 L of fuel against 10.1 L in the case of the proposed algorithm. This shows the vehicle can travel farther with the proposed algorithm. With respect to our research goal of implementing and evaluating an optimal energy management strategy for EREV, the net energy consumption results as shown in
Figure 21 shows that the proposed algorithm at least matches and in other cases lowers the value in comparison to the conventional algorithm. Thus, the proposed adaptive distance constrained dynamic programming algorithm performs better than the conventional algorithm.
The adaptive nature of the proposed algorithm introduces the possibility of it being fault tolerant. In a scenario where a propulsion system component on the research EREV experiences a fault or functional limitation, the vehicle performance will be limited or the feasible driving distance will reduce. We evaluated a fault scenario causing the REx system maximum power to reduce from 15 kW to 8 kW. Under this limited power capability, the conventional CD/CS algorithm and our proposed adaptive distance constrained dynamic programming algorithm were evaluated. The ESS SoC comparison as per
Figure 22b shows that the proposed algorithm was able to adapt to the fault and optimize the REx system operation to meet the final ESS SoC and target distance requirements. Unfortunately, in the case of the conventional algorithm, ESS SoC drops below the ESS EPO limit near the 90 km marker, resulting in the vehicle being immobile.
On the basis of these results, our proposed algorithm shows fault tolerance over the conventional algorithm but within certain limitations. In the presented results, the fault insertion occurred early in the drive, thus allowing considerable time for the vehicle to adjust to the new limitations. We expect the algorithm to violate the target distance constraint if the fault was inserted much later in the drive. Such an outcome is possible as the vehicle ESS SoC would be much closer to the ESS EPO limit. With ADAS (Advanced Driving Assistance System) features in modern vehicles, the fault tolerant behavior of the algorithm can also be used to inform the driver of the updated available driving distance.
5. Conclusions
This article presented a novel implementation of an energy management algorithm for the experimental research EREV. The development and application of this algorithm was directed by two major goals: (i) achieving the maximum feasible driving distance without recharging or refueling, and (ii) maintaining the minimum feasible net energy consumption. We also targeted for a real-time online application of this algorithm.
To achieve these goals, we first formulated a power loss model of the experimental research EREV. The model was validated against vehicle test results conducted on a chassis dynamometer. This followed an evaluation of frequently used energy management optimization algorithms. A dynamic programming approach was chosen for the development of our proposed algorithm. The proposed algorithm was a variation of dynamic programming with forward propagation and a distance constraint. To ensure the algorithm is resilient to external disturbances, a reoptimization feature was added that made the algorithm adaptive. The application of this algorithm was evaluated against different standard speed traces and a real-time average speed trace obtained from Google Directions API.
Our evaluation of the more prevalent energy management optimization algorithms showed that the dynamic programming approach provided more optimal results. We implemented our variant of dynamic programming with forward propagation by adding a target distance constraint. This approach resulted in ensuring the energy management is optimal while the target distance requirement is achieved. The results from the adaptive version of the proposed algorithm validated our hypothesis of real-time online implementation while being optimal. Finally, a functional comparison of our proposed algorithm with the conventional CD/CS algorithm was conducted on the model of our experimental research EREV vehicle. The results proved that our algorithm at the very least performs on par with the conventional algorithm and outperforms it by 9.8% on the other extreme.
In conclusion, the presented work showed that for EREV energy management, in addition to optimizing for the minimum net energy consumption, we also need to optimize for the maximum feasible driving distance. We also showed an implementation of our proposed adaptive distance constrained dynamic programming algorithm with live traffic information from Google Directions API. This verified our hypothesis that the proposed algorithm is implementable in a real-time online scenario. By extension, our proposed algorithm is also able to provide an optimal solution even if one or more of the propulsion systems are power limited or experience a fault. Our proposed algorithm was verified and validated in MiL and SiL environments in this article; however, additional system and environmental disturbances, such as road elevation, system ramp-up and ramp-down delays, as well as thermal effects were not considered. The MATLAB/Simulink model and reference datasets used for this article are available online at
https://github.com/avk4714/EREV-EM-Algorithm. The instructions on using the model are provided in the repository README. A future extension of this work will include the impact of these limitations as well as implementation of the proposed energy management strategy on the experimental research EREV.
