Article

An Experimental Investigation on the Impact of Duplexing and Beamforming Techniques in Field Measurements of 5G Signals

1
Department of Rome, ARPA Lazio, Via G. Saredo 52, 00173 Rome, Italy
2
DIEI (Dipartimento di Ingegeria Elettrica e dell’Informazione “Maurizio Scarano”), University of Cassino and Southern Lazio, via G. Di Biasio 43, 03043 Cassino, Italy
3
ICEmB (Inter-University National Research Center on Interactions Between Electromagnetic Fields and Biosystems), Via All’Opera Pia, 11 A, 16145 Genova GE, Italy
*
Author to whom correspondence should be addressed.
Electronics 2020, 9(2), 223; https://doi.org/10.3390/electronics9020223
Submission received: 23 December 2019 / Revised: 17 January 2020 / Accepted: 20 January 2020 / Published: 29 January 2020

Abstract

:
The fifth generation mobile network introduces dramatic improvements with respect to the previous technologies. Features such as variable numerology, bandwidth parts, massive Multiple Input Multiple Output (MIMO) and Time Division Duplex (TDD) will extend the capabilities of the 5G wireless systems and, at the same time, will influence the measurement techniques used to assess the compliance with general public electromagnetic field exposure limits. In this study, a heterogeneous set of 5G signals is investigated with the aim of establishing an effective measurement technique suitable for the new technology. Following an experimental approach based on both modulation and zero span analysis, some important characteristics of the 5G system are highlighted and extensively discussed, and experimental procedures for estimating factors associated to TDD ( F T D C factor) and beam sweeping (R factor), to be used in the extrapolation formulas, are presented. The results of this study represent a starting point for future investigations on effective methods to estimate both the instant maximum power and the total power transmitted during a 5G radio frame.

1. Introduction

The fifth generation (5G) technology’s radio interface, known as New Radio (NR) [1,2] will address a variety of usage scenarios from enhanced mobile broadband to ultra-reliable low-latency communications (URLLC) to massive machine type communications. Along with the use of millimeter waves, features such as variable numerology, bandwidth parts, massive Multiple Input Multiple Output (MIMO) and Time Division Duplex (TDD) [3,4] will allow for an efficient and optimized use of transmission power and radio resource, favoring the implementation of use cases that have very different service requirements. These new features will also influence the measurement techniques used to assess the compliance with electromagnetic field (EMF) exposure limits. The International Electrotechnical Commission (IEC) has recently published IEC 66232 “Determination of RF field strength, power density and SAR in the vicinity of radiocommunication base stations for the purpose of evaluating human exposure” and IEC TR 62669 “Case studies supporting IEC 66232” [5,6]. This standard addresses the evaluation of radio frequency (RF) field strength, power density and Specific Absorption Rate (SAR) levels in the vicinity of radiocommunication base station (RBS) radiating in the frequency range from 110 MHz to 100 GHz. The basic principle of the assessment is to measure the power received by a calibrated antenna from a constant radio frequency source, typically a pilot signal, and applying an extrapolation formula as described in [5] annex B.5. This method ensures that the resulting field is the maximum obtainable at the location for the considered radiofrequency source.
This kind of approach is standardized for 2G, 3G and 4G technologies as described in Appendix F, “Technology-specific guidance” [5] but is still under investigation for 5G technology.
This paper is focused on the evaluation of extrapolation factors associated to two 5G characteristics: Beam sweeping and TDD access mode.
A technique to quantify the effect of TDD in the estimation of the EMF has been object of research already in 4G [7] and a specific parameter, F T D C , has been introduced in the IEC TR 62669 [6]. In this paper a procedure to evaluate the F T D C in 5G signals using the span zero mode of a vector network analyzer is proposed and checked.
An important further problem affecting the EMF measurement of 5G signals is the variation of power associated to antenna sweeping. In order to clarify this point it is useful to note that EMF measurement of 4G signals takes advantage of the Reference Signal that has constant power, as a reference for the extrapolation technique. The variable power of the SS Blocks in the 5G signal prevents the application of the 4G procedure.
The effect of reconfigurable antenna beams is condensed in TR 62669 [6] within a statistical factor called F P R . This factor takes into account (statistically) all possible variations in time and space of the radiation beams produced by the antenna. Consequently, the beam sweeping of the control channels is mixed together with the actual beam forming of the traffic beams that follow the users. In this paper a procedure to quantify the effect of the only beam sweeping of the control channels is proposed introducing a proper parameter called R. A procedure to estimate this parameter based on the variation of the SSB power level in an SS Burst is also discussed. This research represents a first attempt to quantify the effect of the beam sweeping in the EMF measurement. Further studies have been planned to relate this parameter to different data load transmitted by the base station.
The paper is organized in the following way.
Section 2 gives a brief overview of the 5G technology, with particular reference to the aspects that impact the evaluation of EMF level for assessment of exposure limits.
Section 3 is devoted to the analysis of some experimental data collected by ARPA Lazio (Italy) in an extensive measurement campaign of 5G signals in real environments, with particular attention toward the measurement of parameters relevant for EFM, as bandwidth, SSB power and time domain analysis of the signal using span zero measurement.
In Section 4 the F T D C and R parameters are introduced and a procedure to estimate these parameters, based on the measurement techniques discussed in Section 3, is presented. The result of the F T D C estimation procedure is compared with the one obtained from the TDD sequence specified in the 5G standard according to the parameters of the signal identified in Section 3, confirming the effectiveness of the zero span method. Regarding the R evaluation procedure, some simulations are also shown and compared with the experimental results using the proposed procedure based on SSBs. The result is fairly good in spite of the lack of information on the radiating system that affects the numerical simulation accuracy.
Finally, in Section 5 conclusions are discussed.
The results of this study represent a solid starting point for future investigations on effective methods to estimate both the instant maximum power and the total power transmitted during a 5G radio frame.

2. A Brief Overview of Some Characteristics of the 5G Technology Relevant for EMF Measurement

Broadly speaking, the different generations of communication networks reflect different views of interconnections in our society. The first generations were developed under a vision of strong human to human interconnections, while the subsequent generations payed an increasing attention toward human-computer interconnection. 5G has been proposed under a vision of an hyperconnected society, where not only all the people but a large number (theoretically all) physical or virtual devices are connected to the network. 5G is supposed to be the backbone of a new society: The Internet of Everything.
In order to reach this ambitious goal, three major classes of applications have been identified for 5G: Enhanced Mobile Broadband (eMBB) for high speed video and data connection, Massive Machine Communication for Internet of Things (mIoT) and Ultra-Reliable Low Latency (URLLC) for real time applications like control systems and game. The main effort in the development of 5G cellular infrastructure is currently focused on enhanced mobile broadband (eMBB) to provide increased data-bandwidth and connection reliability, while mIoT and URLLC, for which market is not sufficiently mature, will be deployed in the next future.
These applications are so different that it is impossible to identify a specific frequency range. In fact, while high bit rate requires high frequency, high frequency is affected by low penetration depth of the field and limited coverage area. Consequently, in order to cover all the three main 5G fields of applications, 5G bandwidth includes the frequencies range 450 MHz–6 MHz (FR1, commonly referred as “sub-6 GHz band”) and the frequencies range in 24.25 GHz–52.6 GHz (FR2, commonly refereed as “millimeter wave band”). Sub-1 GHz band allows to obtain very large coverage areas and deep in-building penetration. Accordingly it is suitable to support IoT services and extend mobile broadband coverage from urban to suburban and rural areas. The 1–6 GHz band overlaps 4G LTE frequencies and consequently it is suitable for initial 5G deployments. In general, this band offers a reasonable mixture of coverage and capacity. Finally, the ’millimeter wave’ band provides significant capacity thanks to the very large bandwidth that can be allocated to mobile communications and thus enables enhanced mobile broadband applications.
The 5G technology represents the state-of-art of communication theory, and it is characterized by a sophisticated use of the space-time resources offered by the communication channel.
Loosely speaking, one of the main problems facing any communication system is an efficient use of the communication channel. In order to effectively share this resource among all the users a proper Multiple Access strategy (MA) is required. Many different MA strategies are available [8], f.i. FDMA (Frequency Division Multiple Access), TDMA (Time Division Multiple Access), CDMA (Code Division Multiple Access), and SDMA (Space Division Multiple Access). FDMA, TDMA, and CDMA allow a smart use of the time/frequency resource of the channel and have been extensively adopted in the previous generations of cellular systems. On the contrary, SDMA allows a smart use of the “space” resource of the channel. Originally introduced in 4G, this technology represents an important key factor in the 5G technology. SDMA techniques include switched-beam antennas, steering antennas, adaptive antennas, Multi-User MIMO and Massive MIMO.
5G represents a huge forward step in the optimal sharing of the available resources among the users. However, the extremely sophisticated and flexible strategies adopted in 5G to transmit data gives an unprecedented complexity in the space-time field configuration radiated by 5G antennas.
In the following a brief overview of how the time resource and the space resource of the communication channel is used by 5G systems is described. This description is by far not complete, and it is focused only on the aspects that are relevant for the topic of this paper, that is limited to field measurement for exposure limit evaluation. For more details on 5G technology the interested reader can refer to the specific literature, e.g., [9,10].

2.1. The Use of the Time Resource in 5G Communication Systems

The NR waveform is strictly related to the Multiple Access strategy (MA), i.e., the strategy used to share the communication channel among the subscribers. After a long analysis 3GPP adopted CP-OFDM modulation for both the Down Link (DL) and Up Link (UL) NR transmission [2,9]. Basically OFDM is a Frequency-Division Multiplexing (FDM) using many closely spaced orthogonal subcarriers with a proper guard interval to eliminate intersymbol interference [8,10]. Each subcarrier is modulated with the chosen modulation scheme. OFDM is used in a multiuser scenario by assigning different OFDM sub-channels to different users, obtaining the so called Orthogonal Frequency-Division Multiple Access (OFDMA), that is basically a special case of Frequency Domain Multiple Access.
An adaptive modulation scheme is adopted according to the quality of the channel and to the importance of the transmitted data. Modulation schemes includes BPSK (binary phase shift keying), QPSK (quadrature phase shift keying), 16 QAM (quadrature amplitude modulation of order 16), 64 QAM and 256 QAM [10].
As in LTE, the time length of the NR frame is 10 ms and consists of 10 subframes each of them having a time length of 1 ms [2,10]. Due to the large spectrum available and the wide range of applications, 5G NR uses a “flexible numerology” characterized by the parameter μ . Each NR subframe contains 2 μ slots, where μ can be 0, 1, 2, 3 or 4 [2,10]. Each slot period (having 1 / 2 μ ms time duration) contains 14 OFDM symbols (12 OFDM symbols in case of extended cyclic prefix). Accordingly, each symbol duration is equal to ( 14 · 2 μ ) - 1 ms ( ( 12 · 2 μ ) - 1 ms for extended prefix) [10]. As a consequence, the number of symbols contained in a subframe changes according to the μ value: Larger μ , more symbols in a subframe.
Different numerologies are associated to different OFDM subcarrier distances. In particular, the subcarrier spacing turns out to be 2 μ · 15 KHz, with μ = 0 , 1 , 2 , 3 , 4 . Subcarrier spacing of 15 kHz, 30 kHz and 60 kHz are used in FR1, while 60 kHz and 120 kHz are used for FR2. The 240 kHz spacing is reserved for non data (signalling) channels. Note that NR uses the same LTE subcarrier spacing for μ = 0 (15 KHz) keeping a fully compatibility with the previous wireless network generation. A NR carrier is made of up to 3300 subcarriers. The maximum bandwidth of each NR carrier is 100 MHz for sub-6 GHz band (FR1) and 400 MHz for millimeter band (FR2) [2]. Note that this value is much greater than the LTE bandwidth, that is limited to 20 MHz.
Frequency and time (and space, that will be object of the next subsection) are the resources available at the very low physical level.
At a ‘data’ level, the smallest physical resource is represented by 1 subcarrier on frequency domain and 1 OFDM symbol. This is called a “Resource Element” (RE) [10]. A Resource Block (RB) consists of 12 consecutive subcarriers. Finally, the Resource Grid (RG) is a representation of the available Resource Elements considering the available subcarriers and symbols.
The internal structure of the resource grid is extremely complex [10], and its description is beyond the scope of this paper. Among the many data structures, the synchronization signal is particularly interesting in the framework of field measurement for EMF Exposure Limits Assessment, since it allows to obtain a number of useful information on the 5G communication parameters.
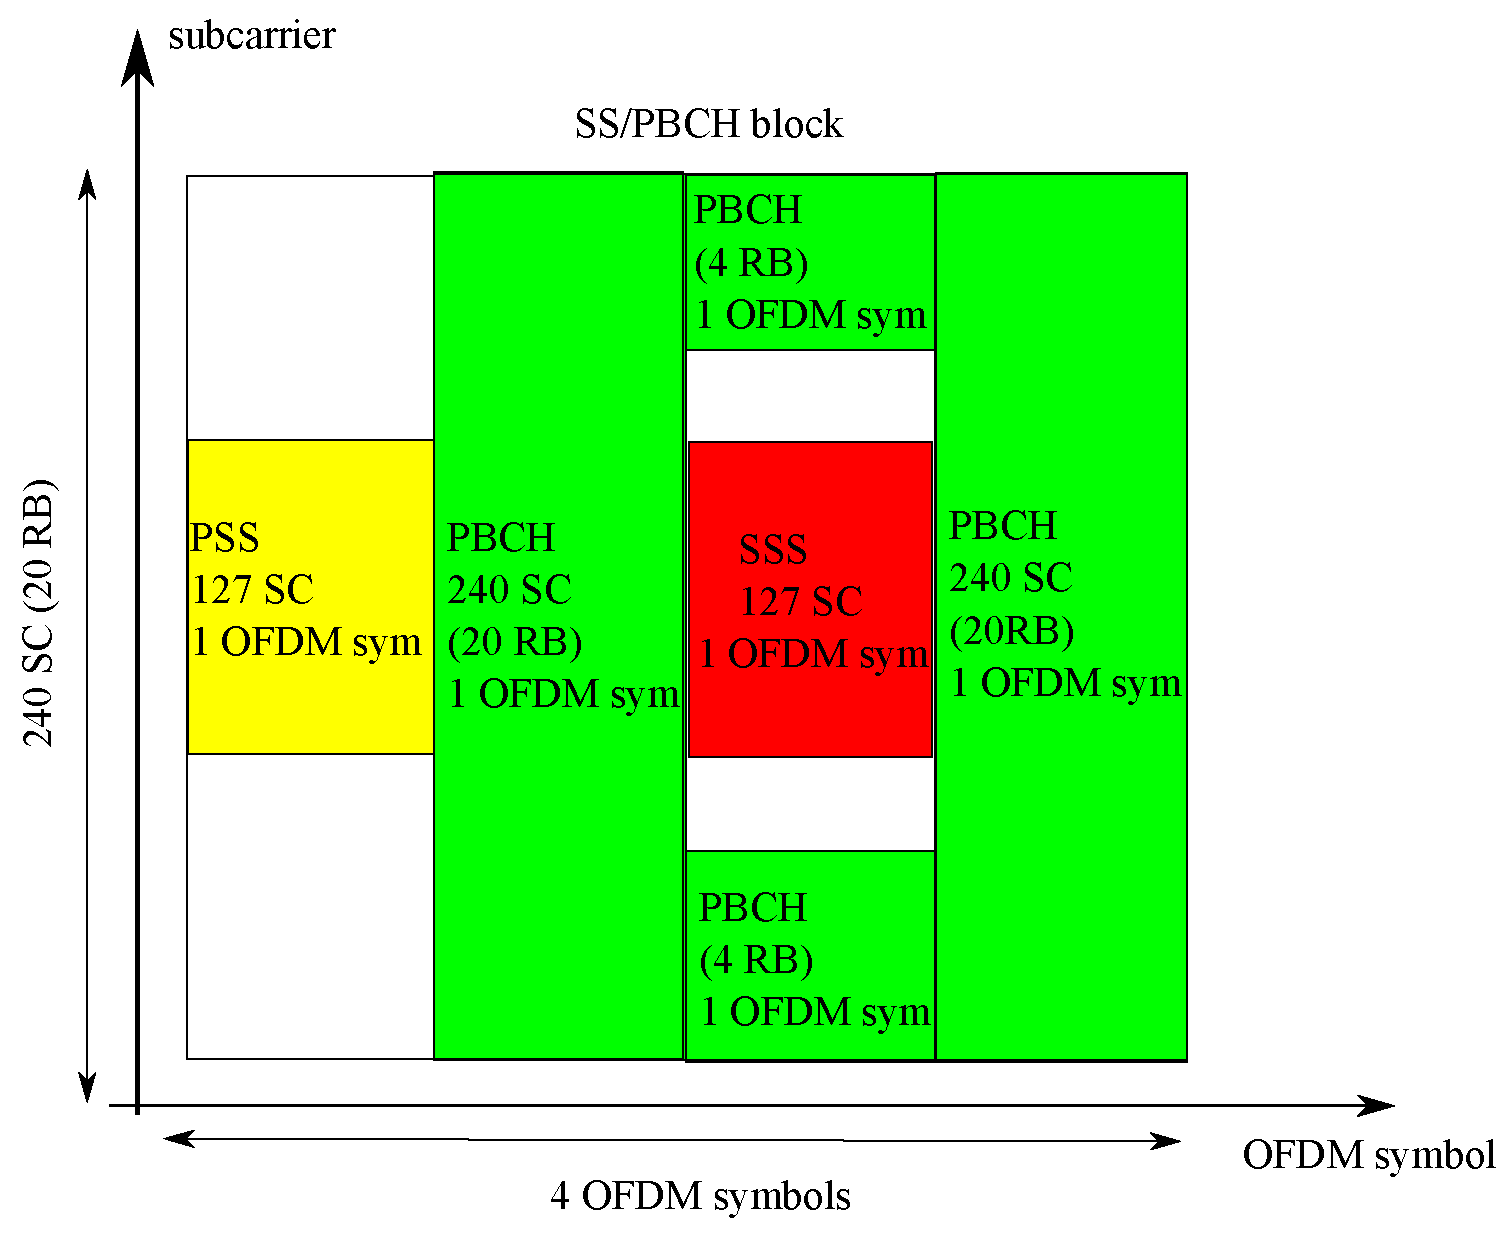
In 5G, Synchronization Signal and Physical Broadcast Channel (PBCH) are packed as a single block (Figure 1) [10]. More specifically, the Synchronization Signal/Physical Broadcast Channel (SS/PBCH), also called “synchronization signal block” or “SS block” (SSB), consists of a block of 240 subcarriers and 4 OFDM symbols containing the Primary Synchronization Signal (PSS), the Secondary Synchronization Signal (SSS), the Physical broadcast channel (PBCH) and the PBCH demodulation reference signal (PBCH DM-RS) [10]. SS blocks in downlink frame are transmitted towards UEs at regular intervals based on periodicity set. The SS blocks are grouped in block patterns called SS bursts.
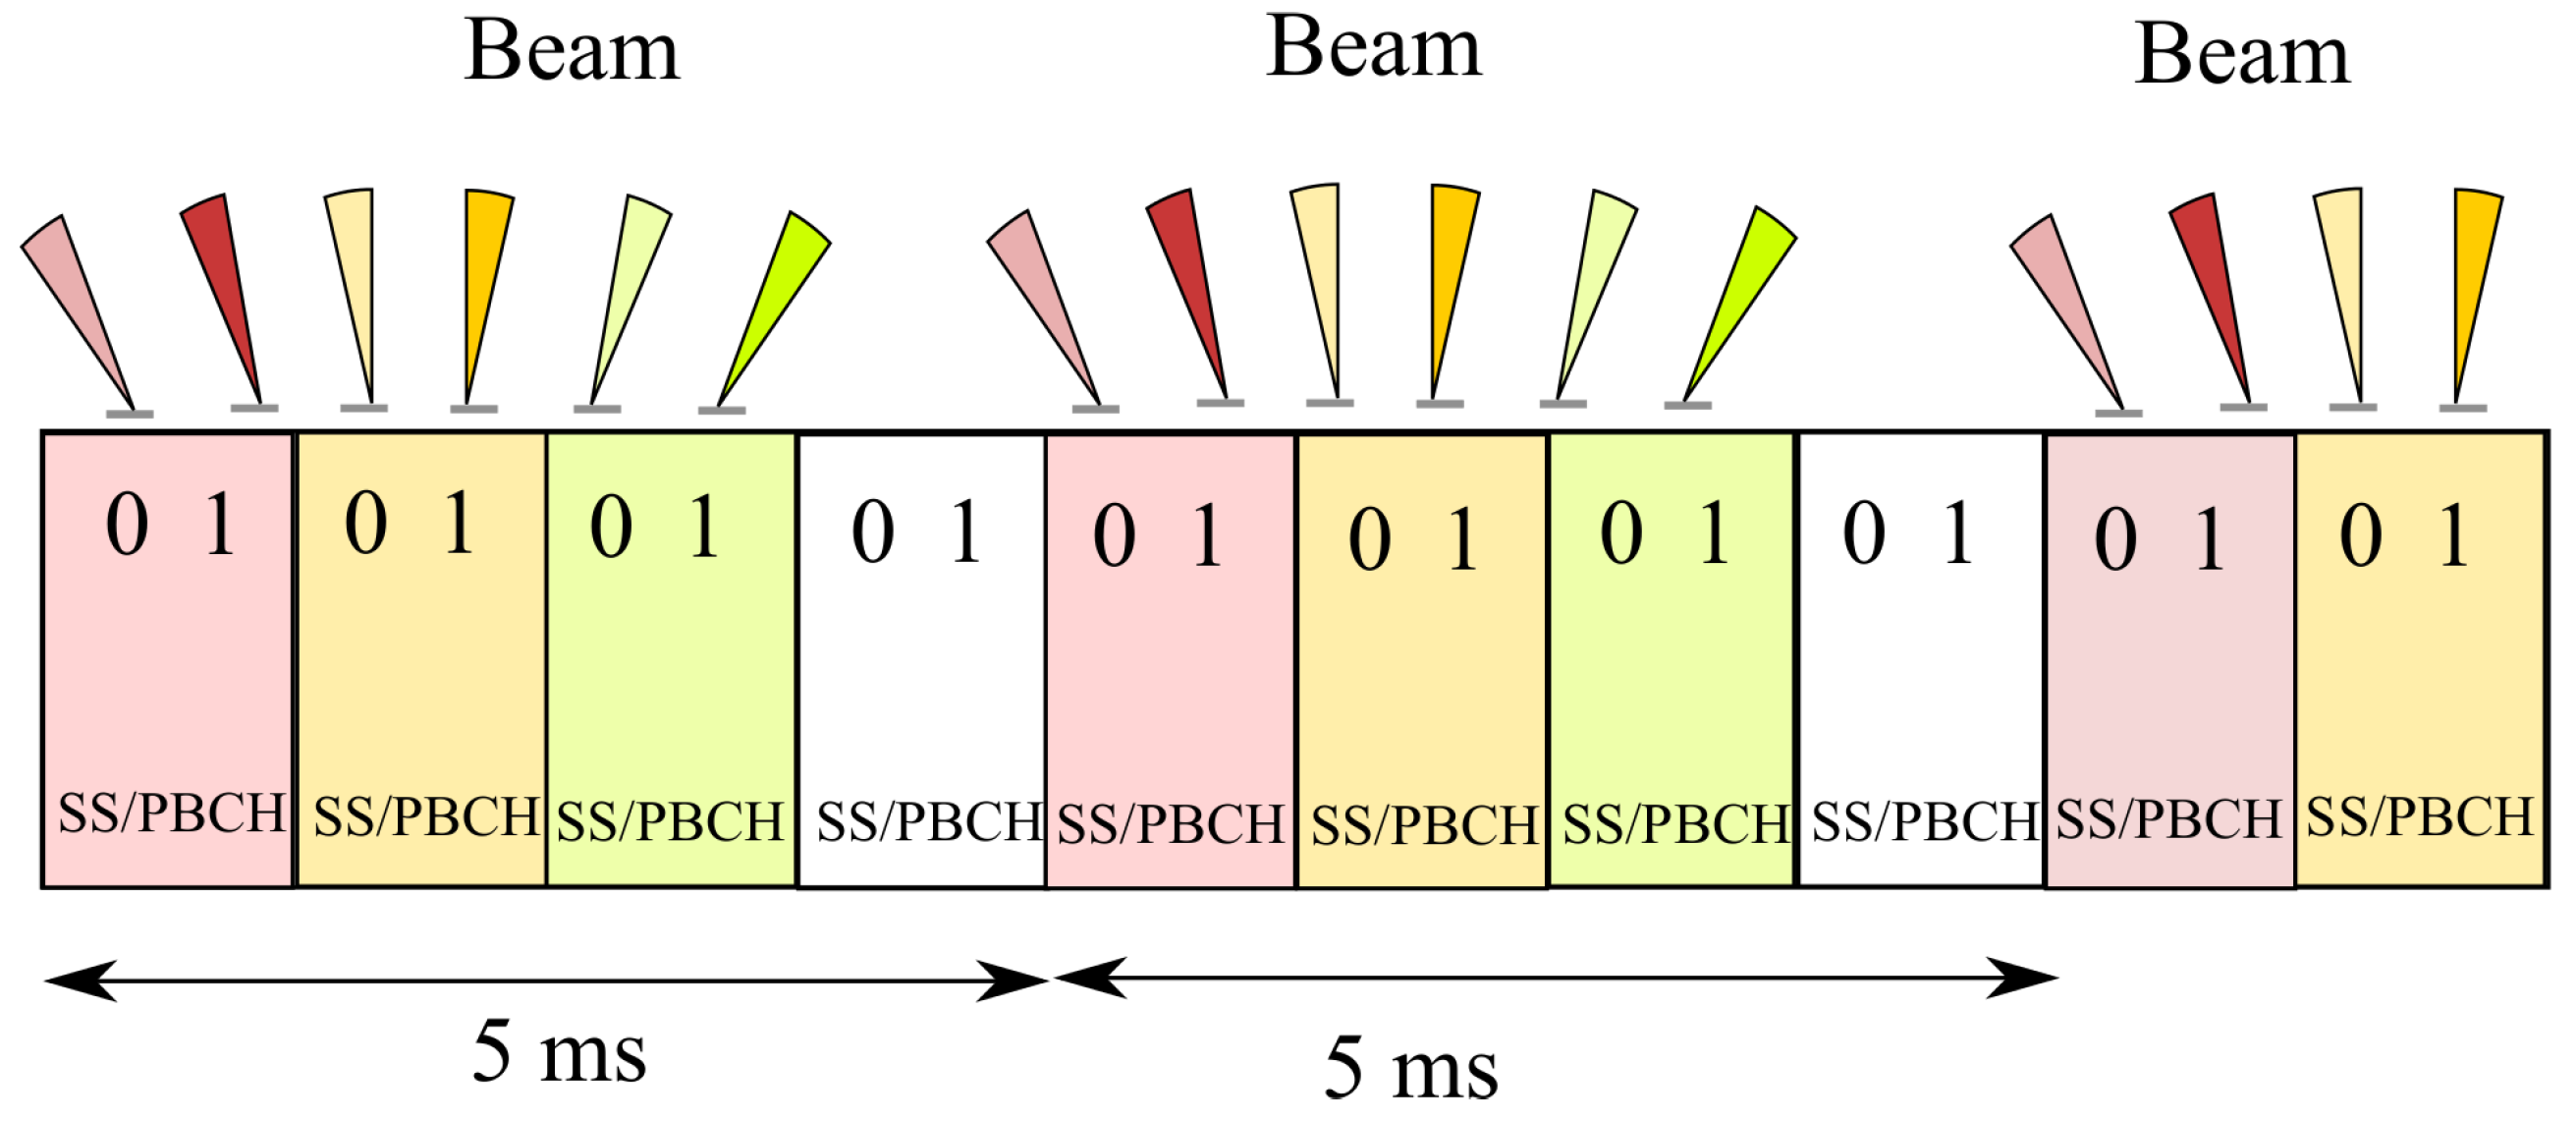
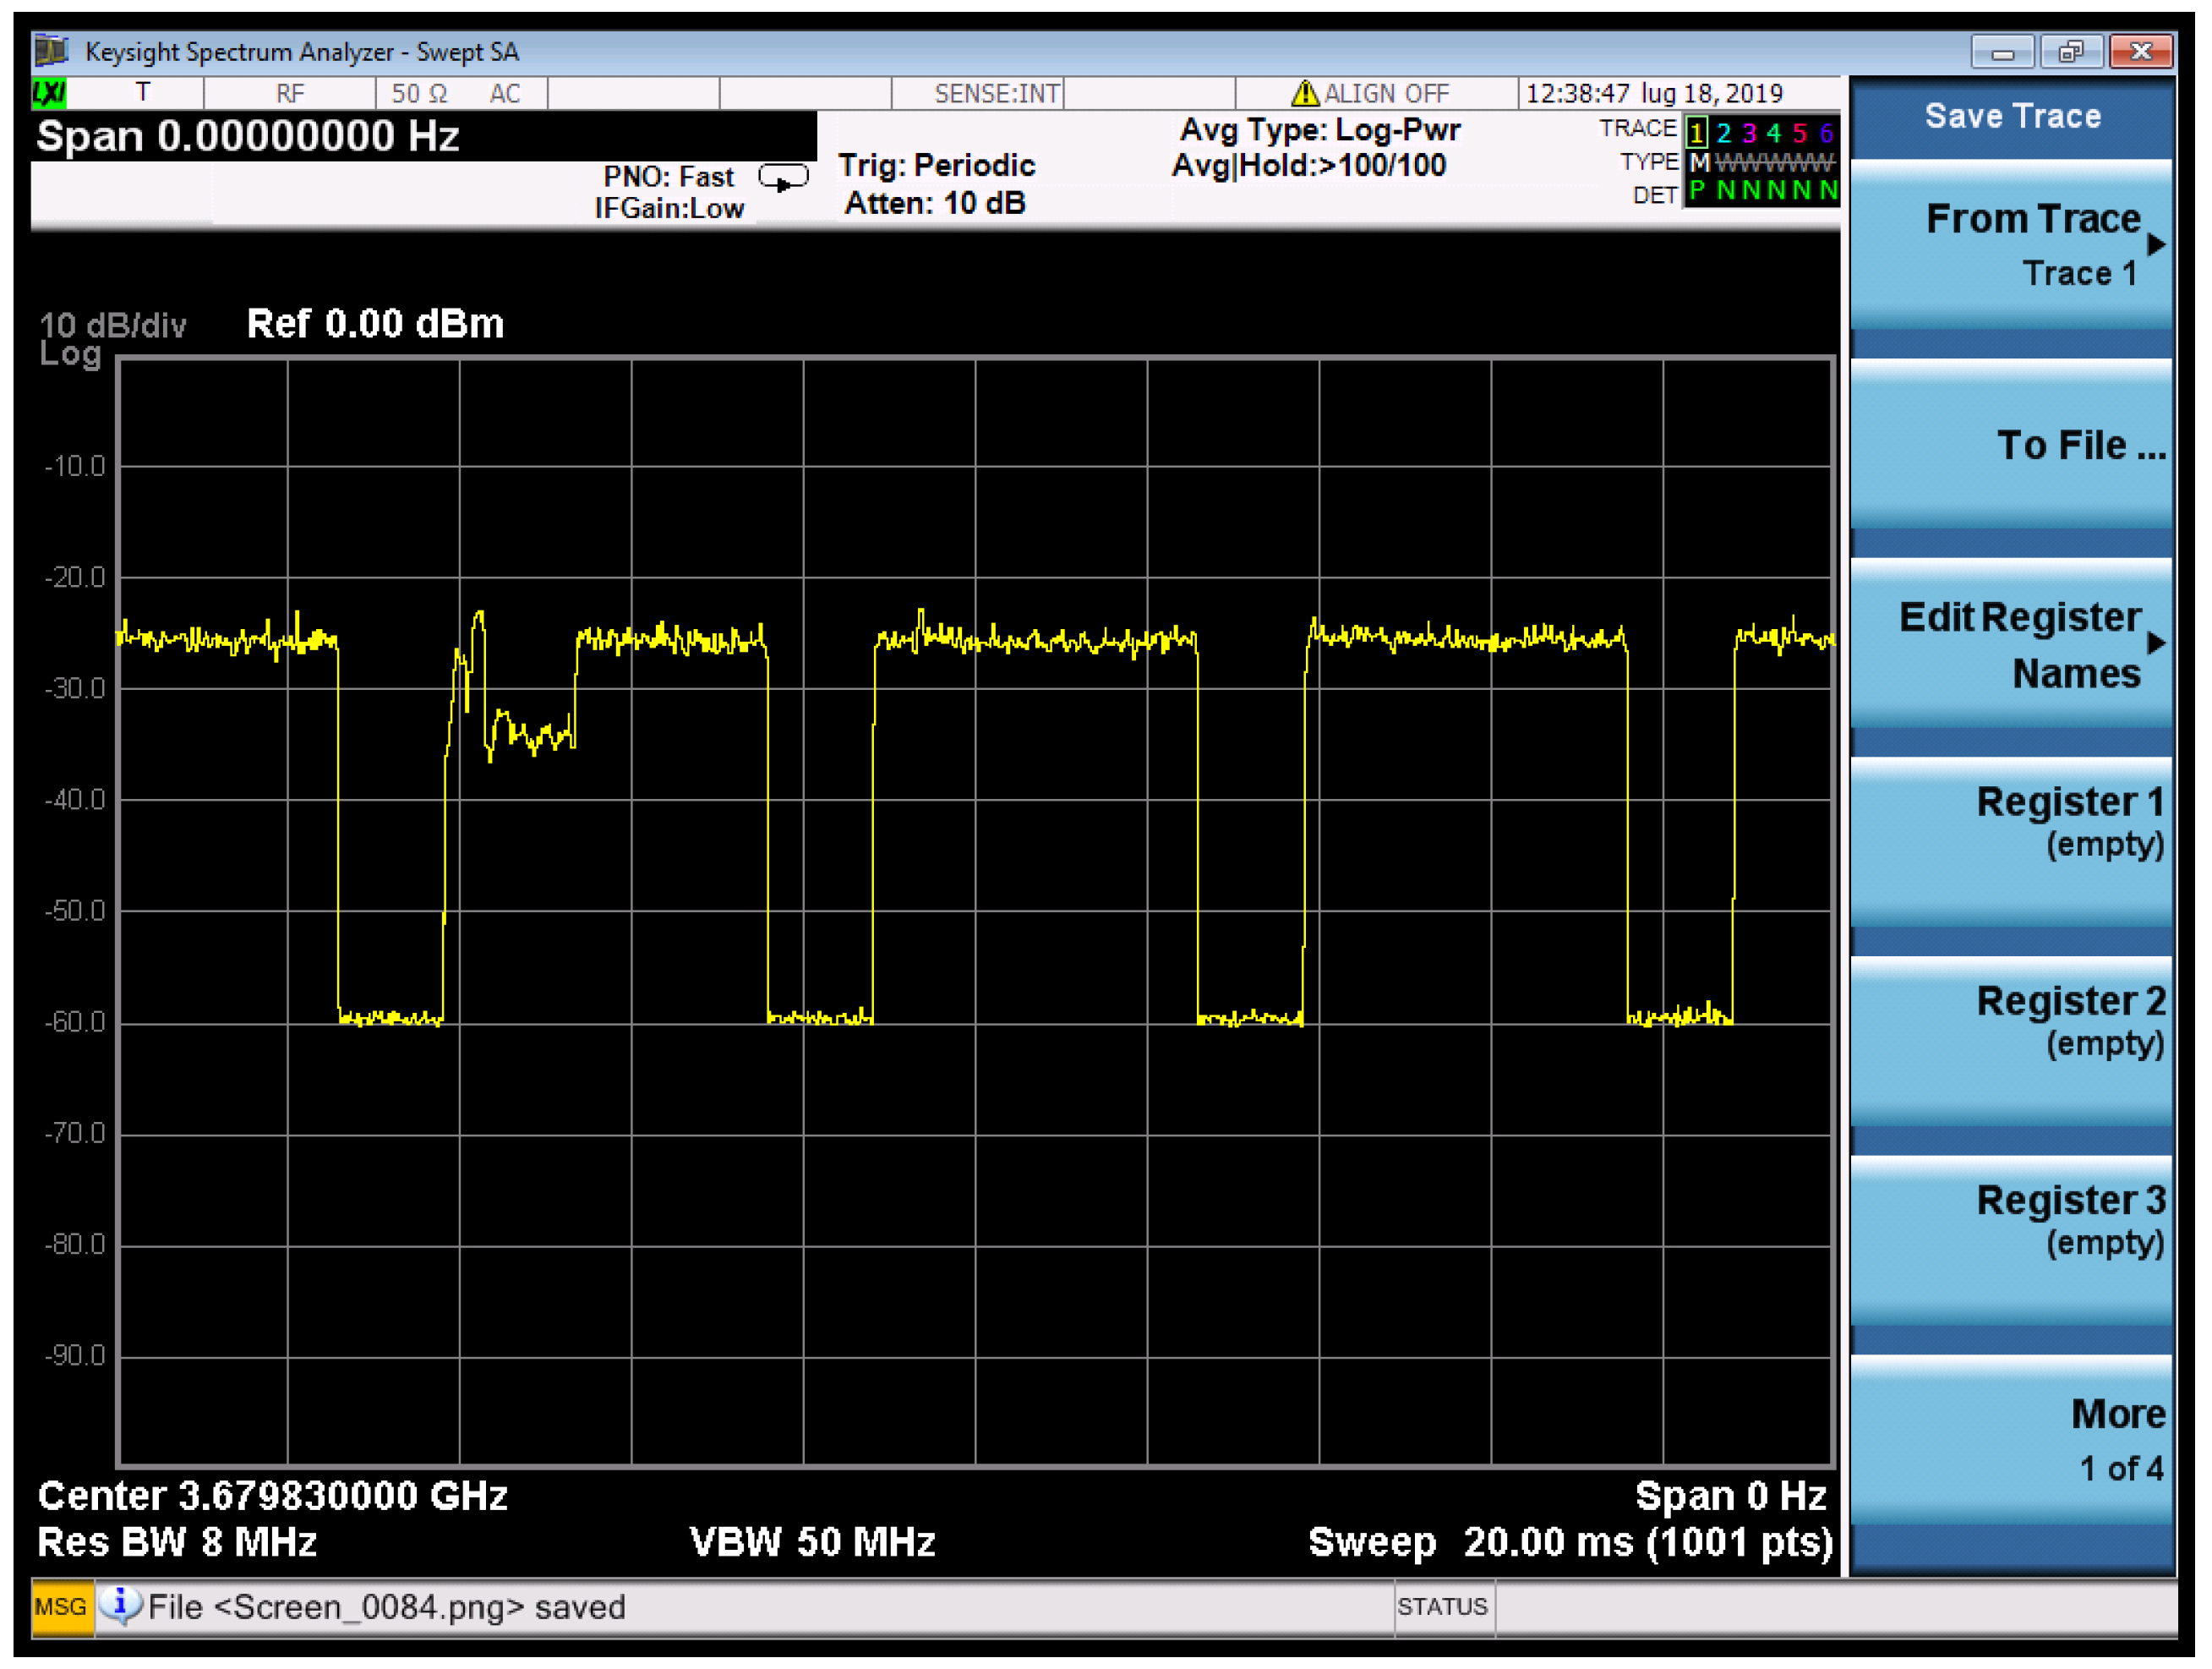
There are five block patterns [
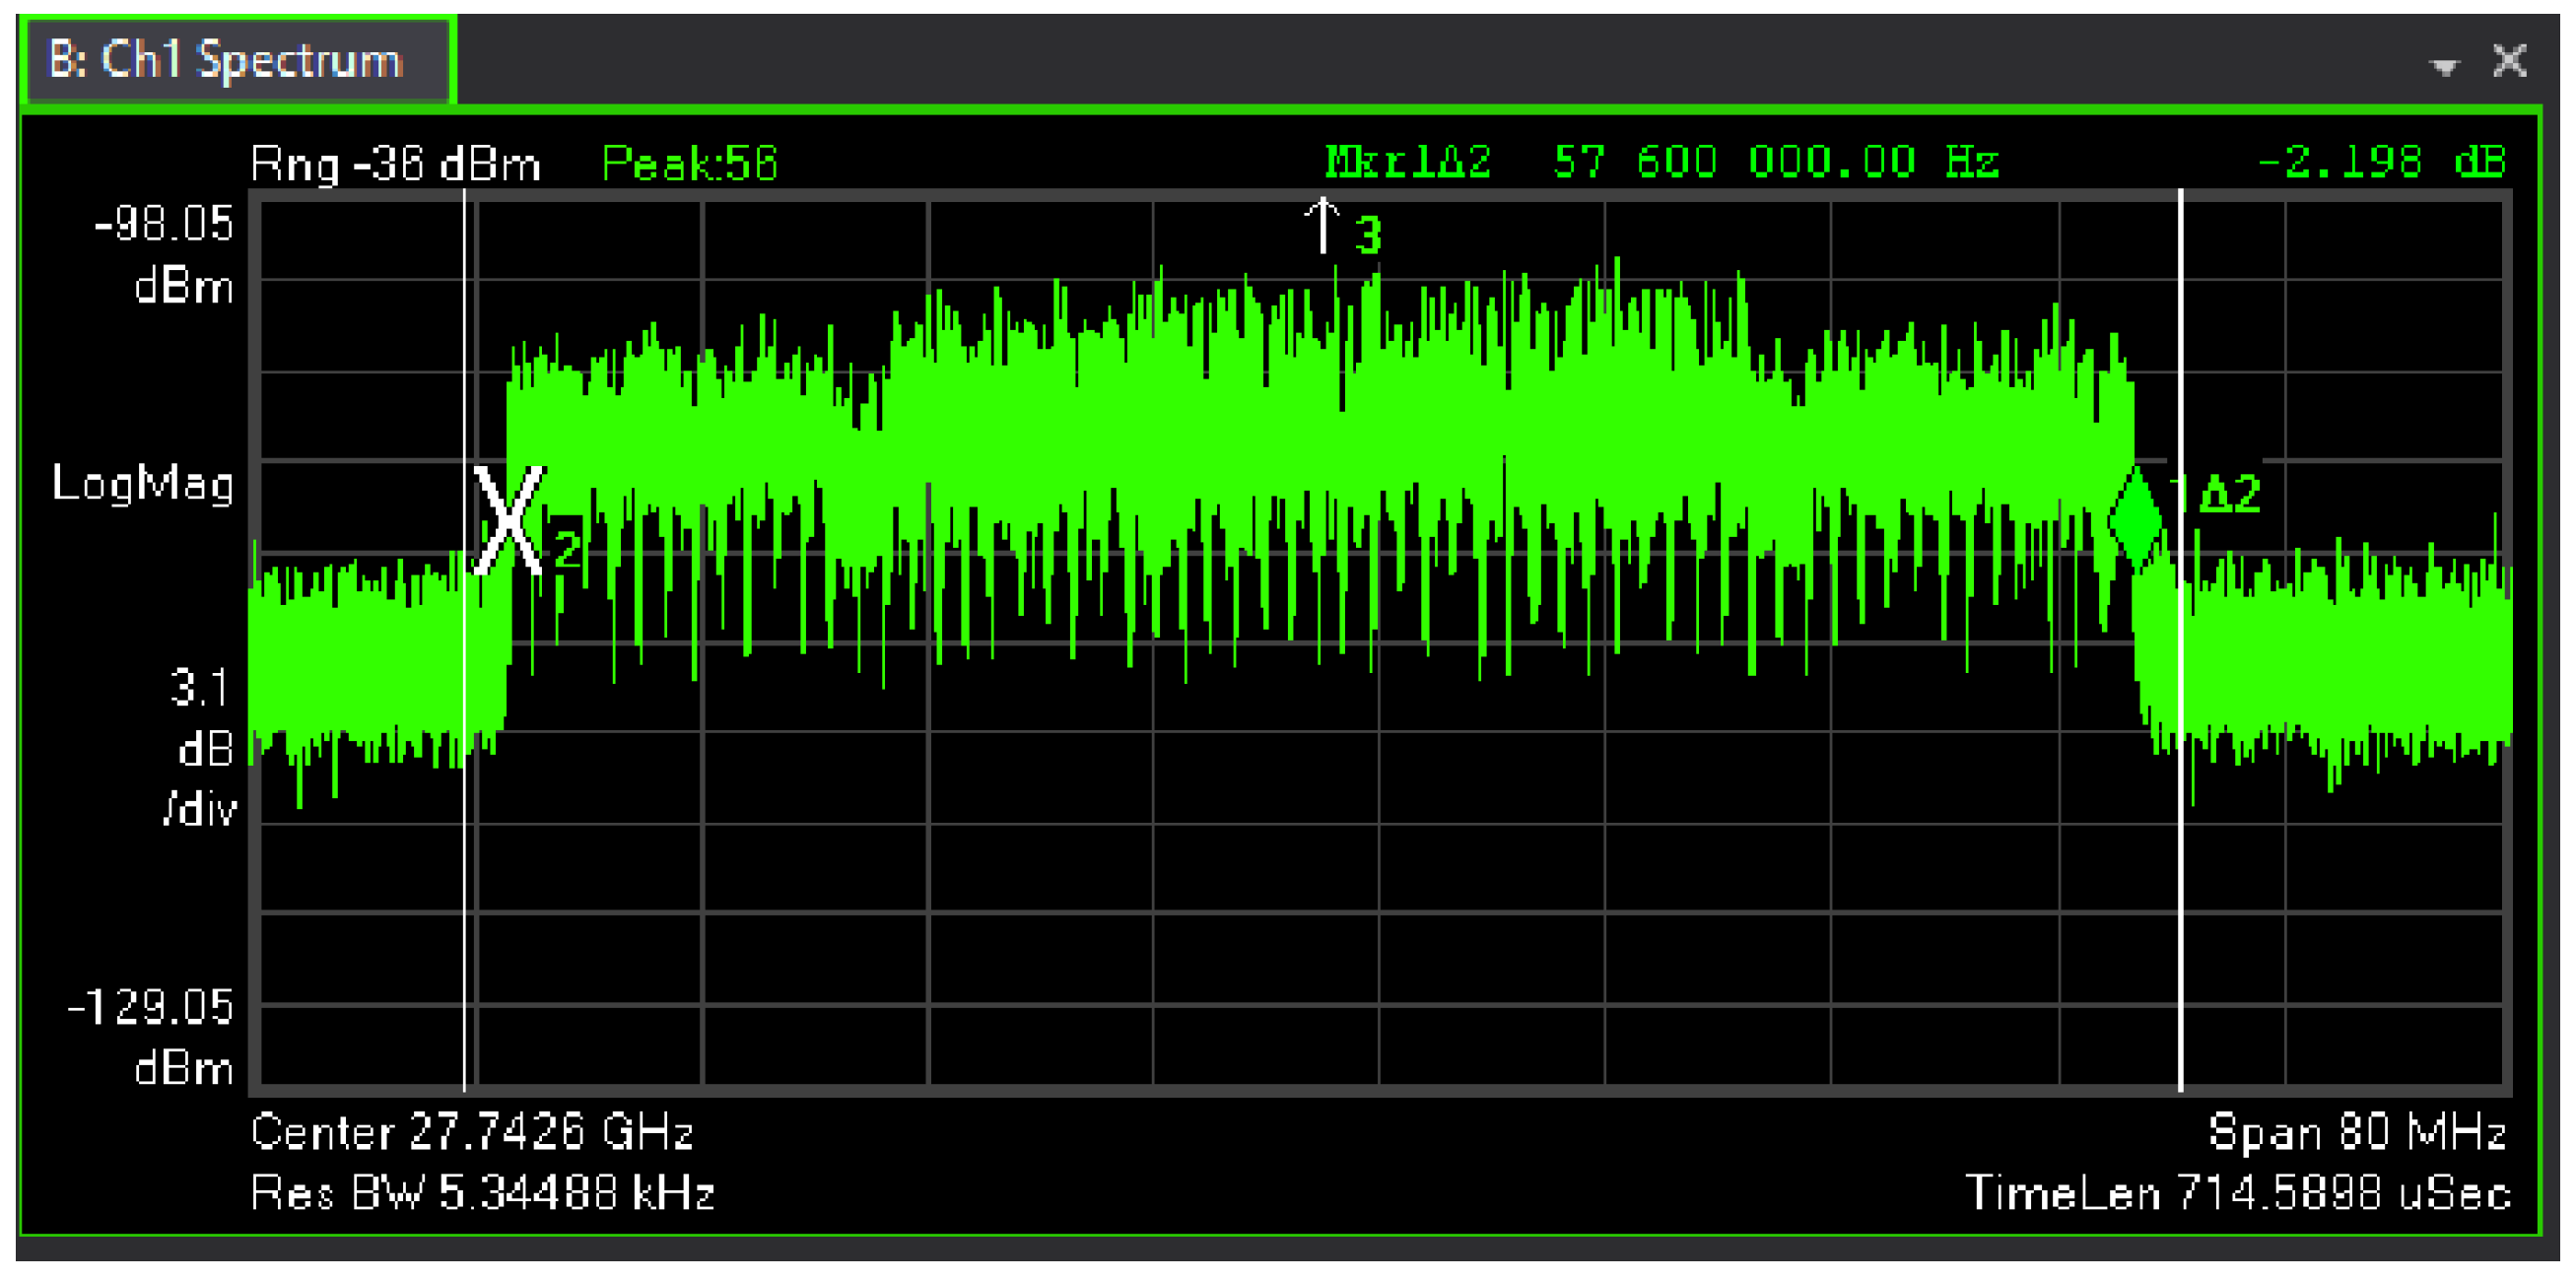
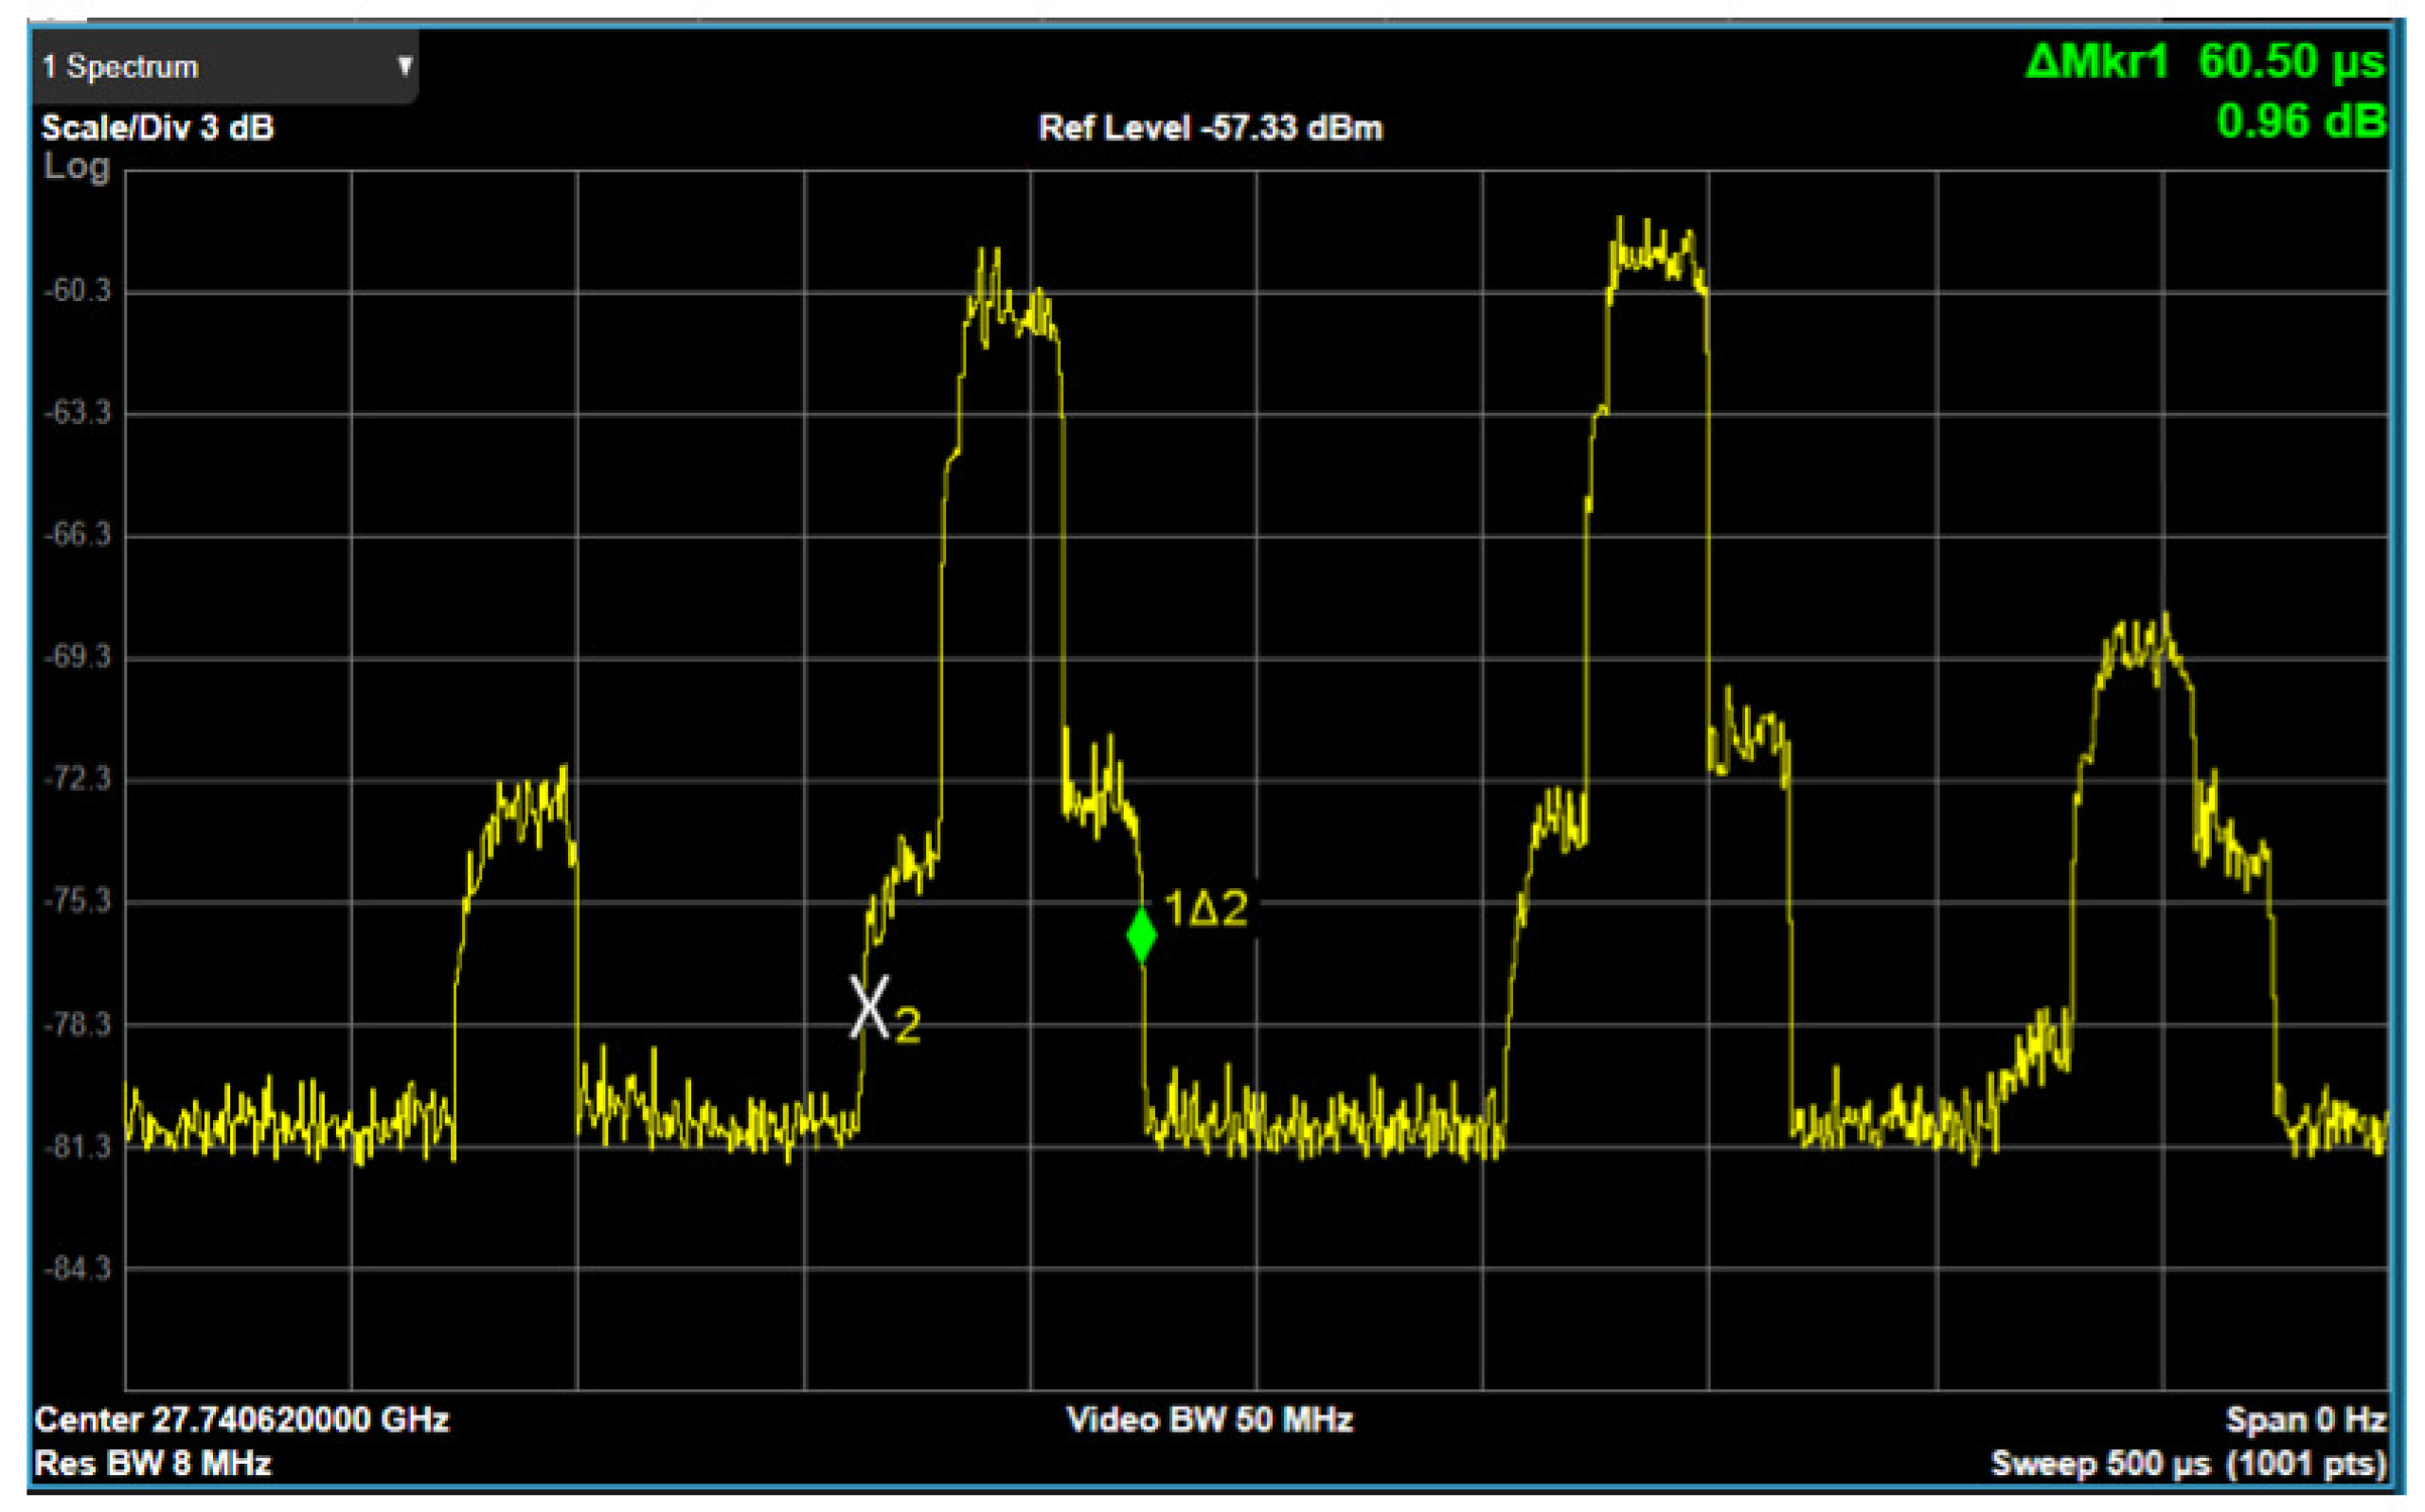
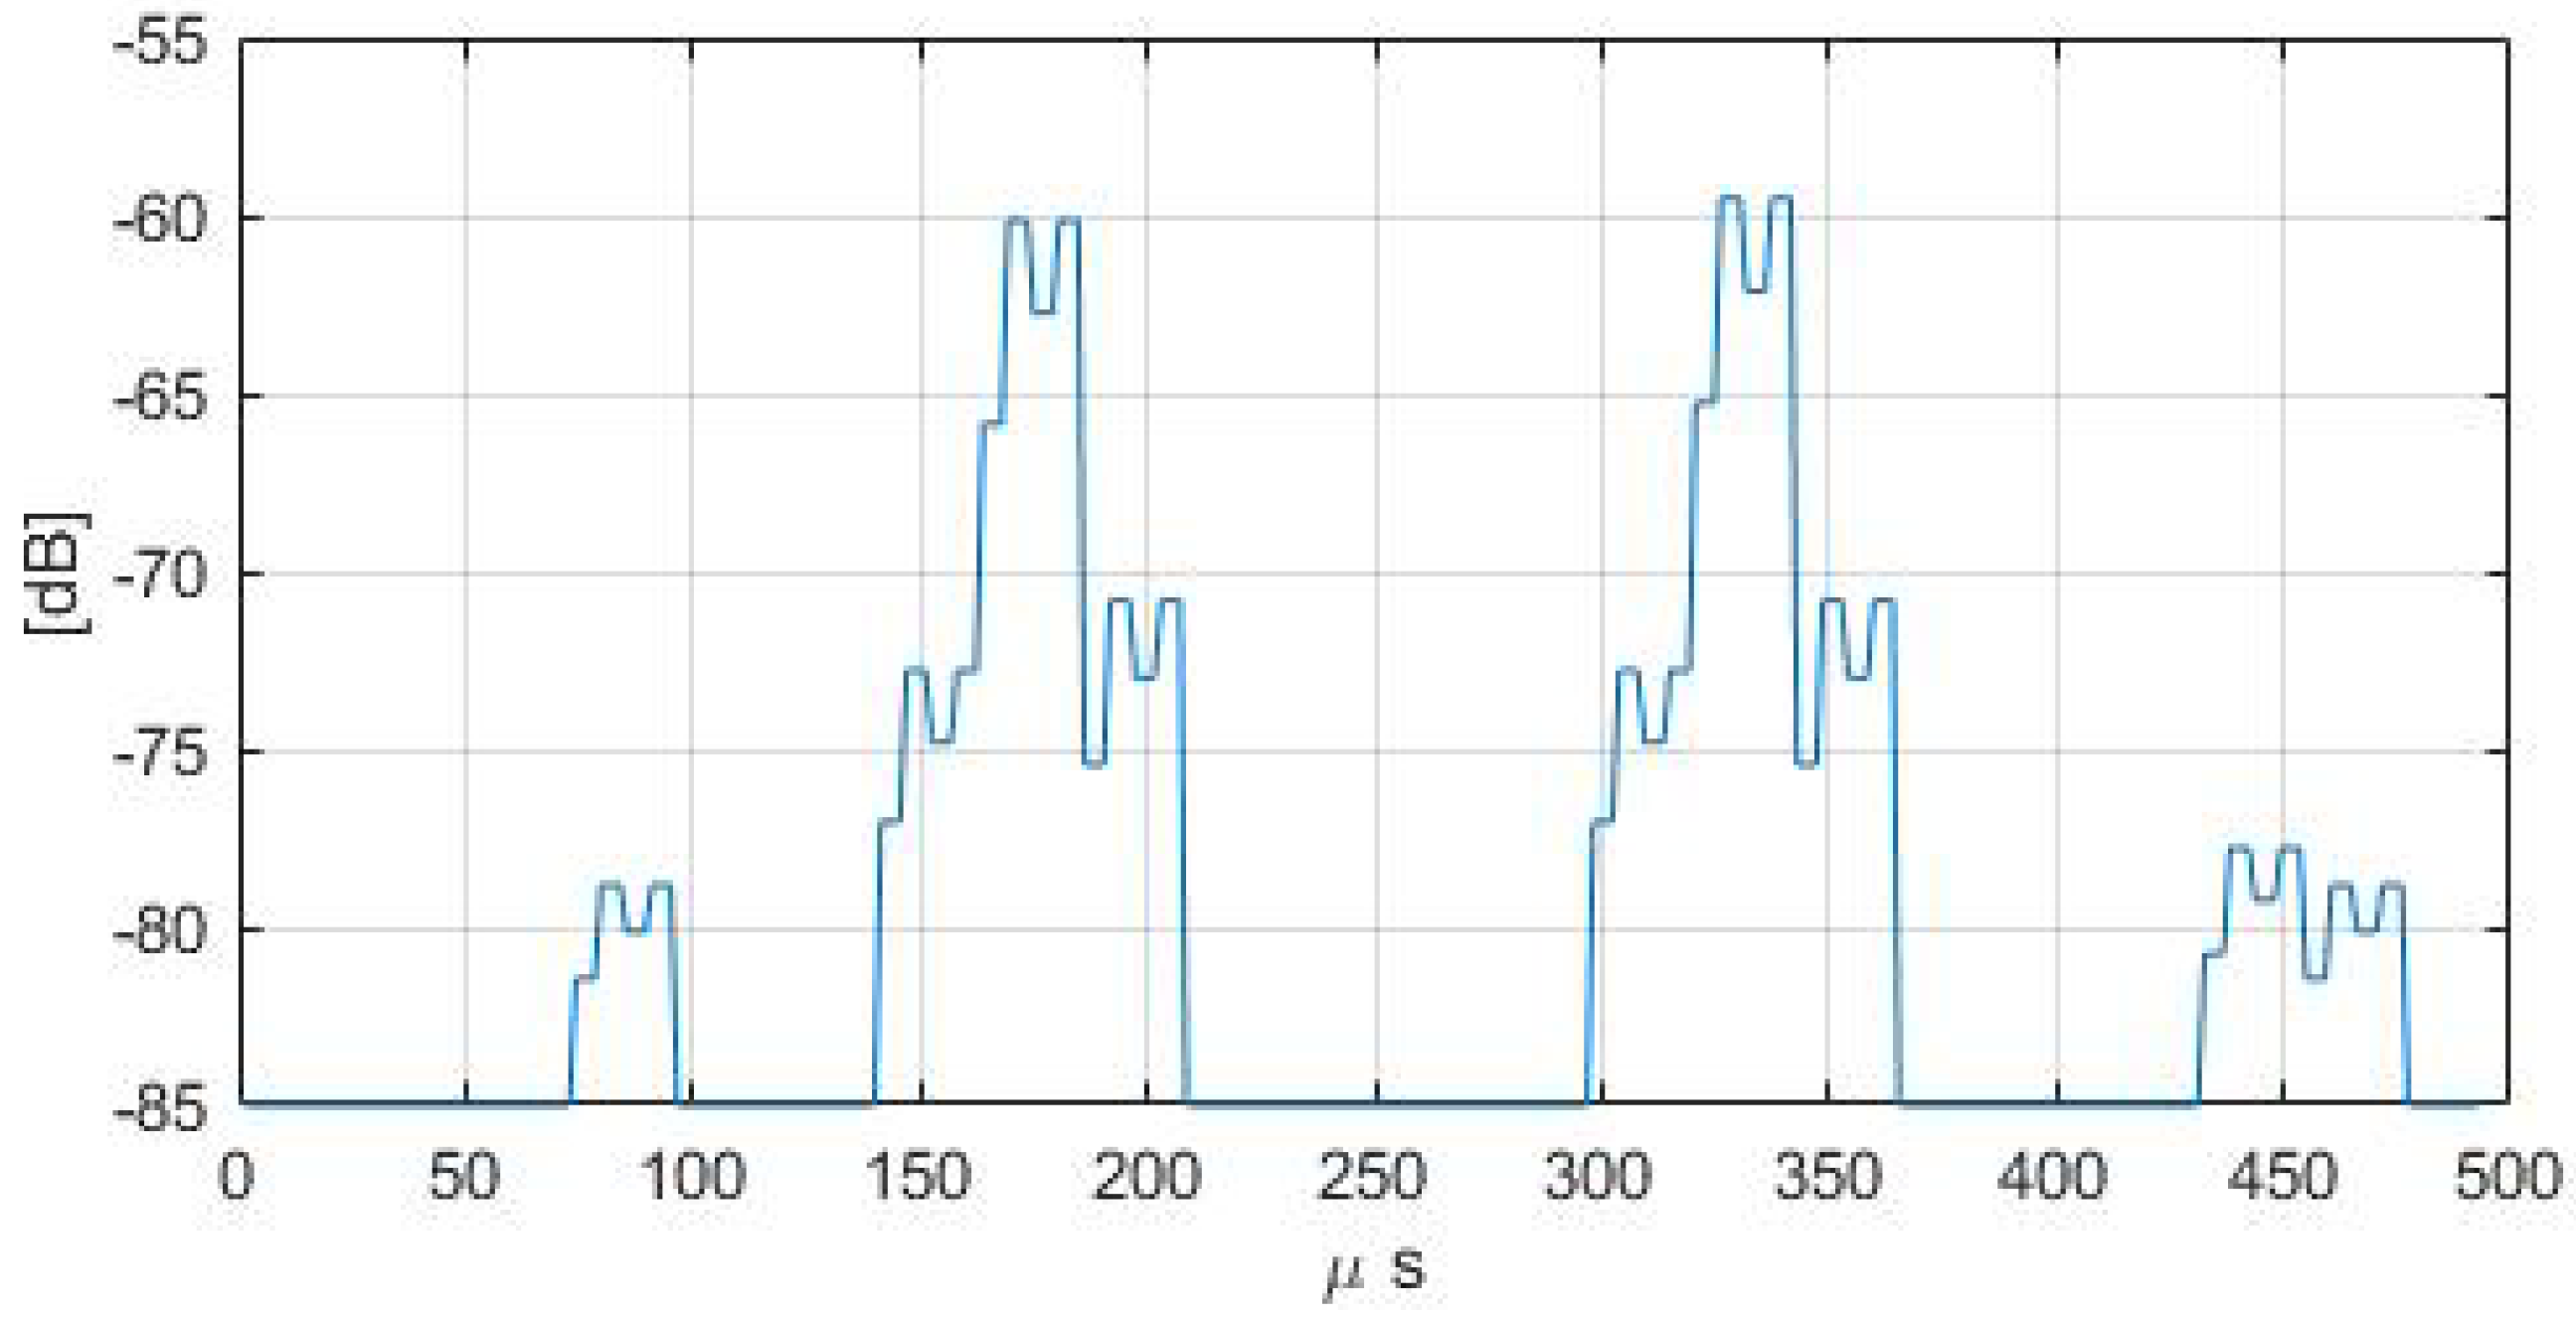
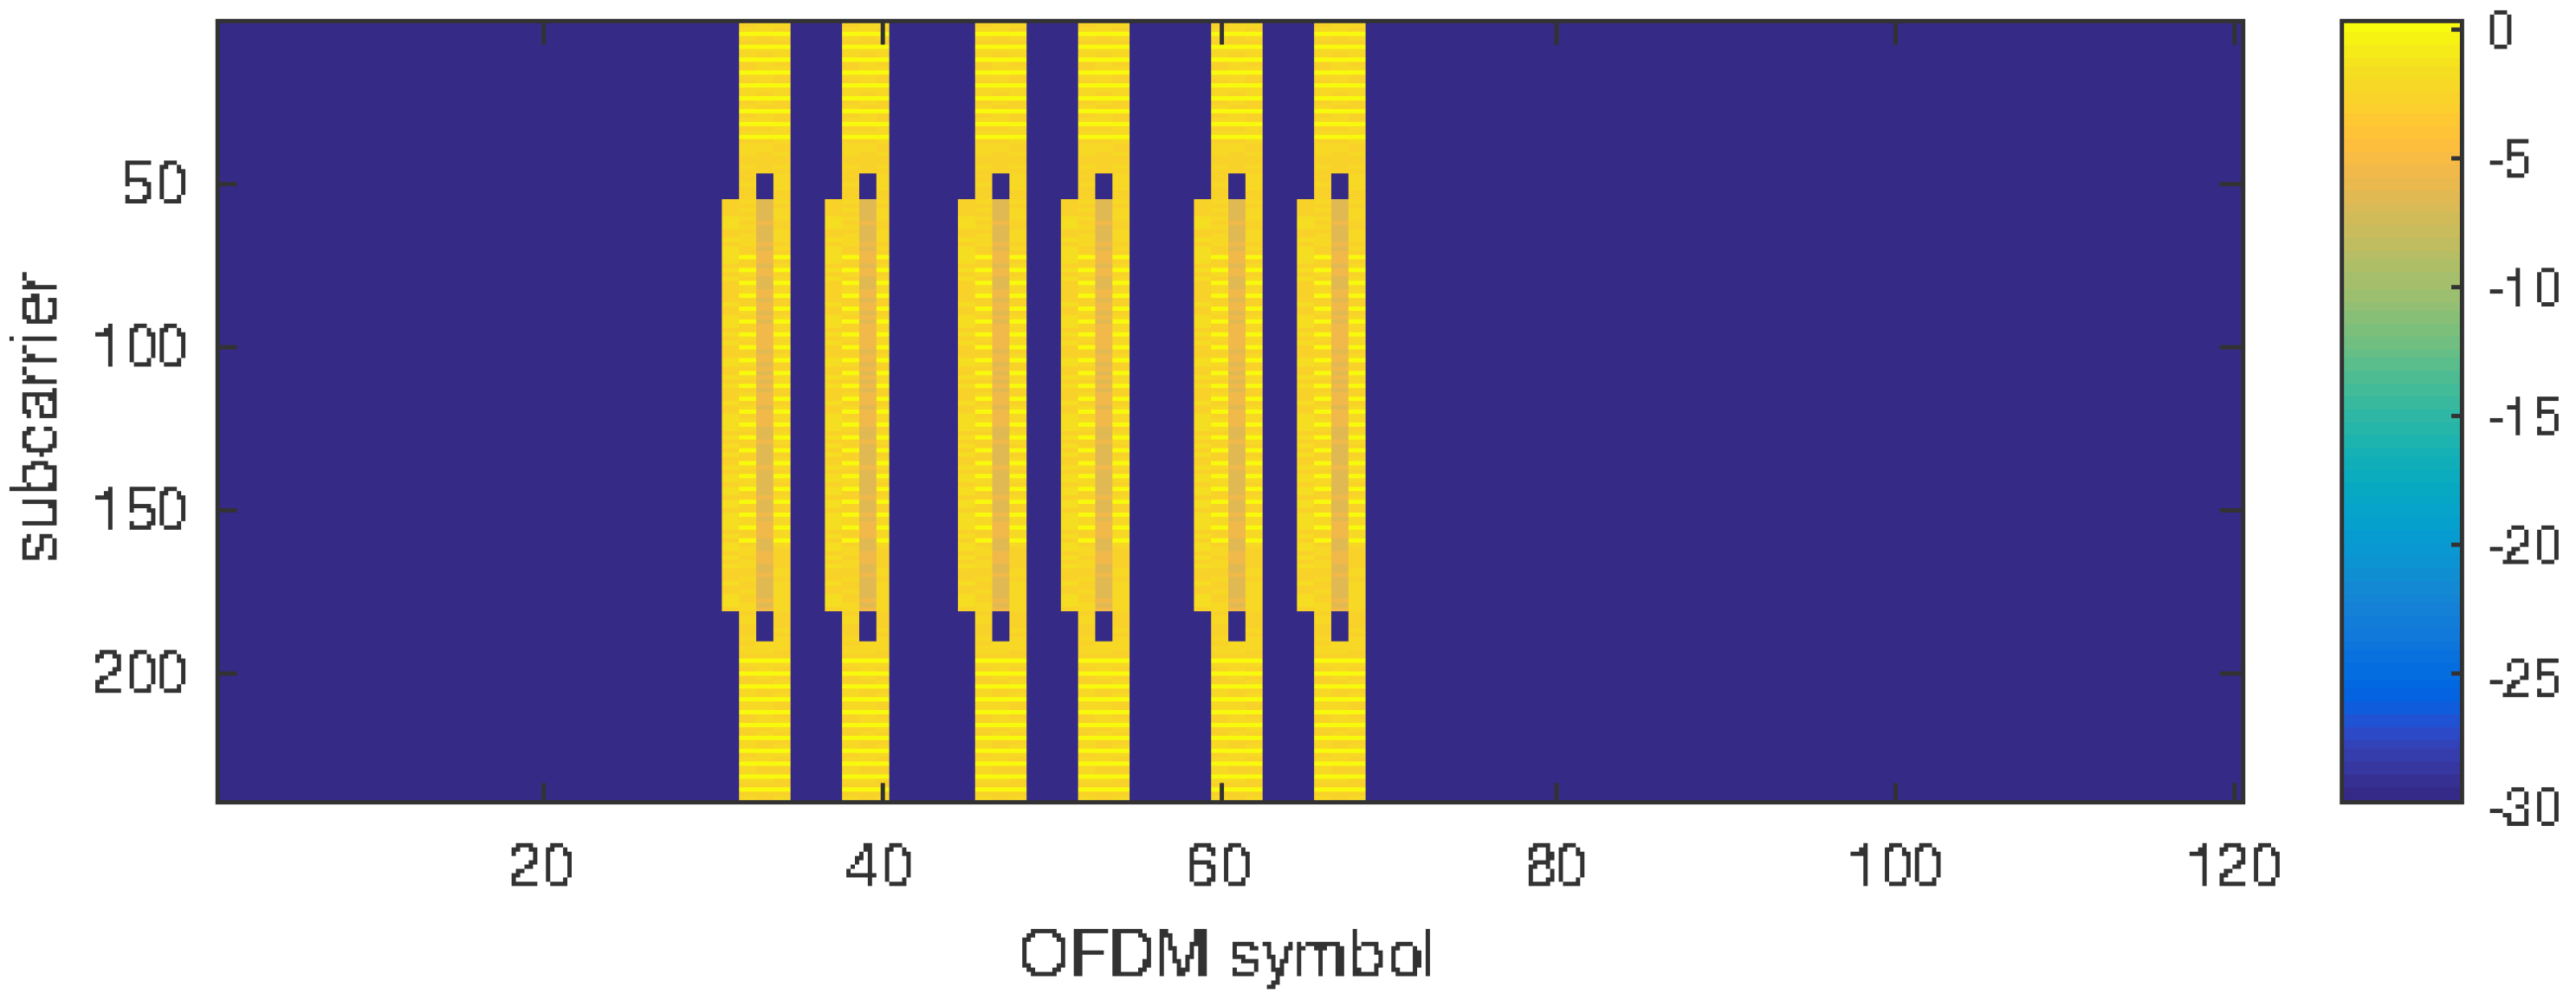
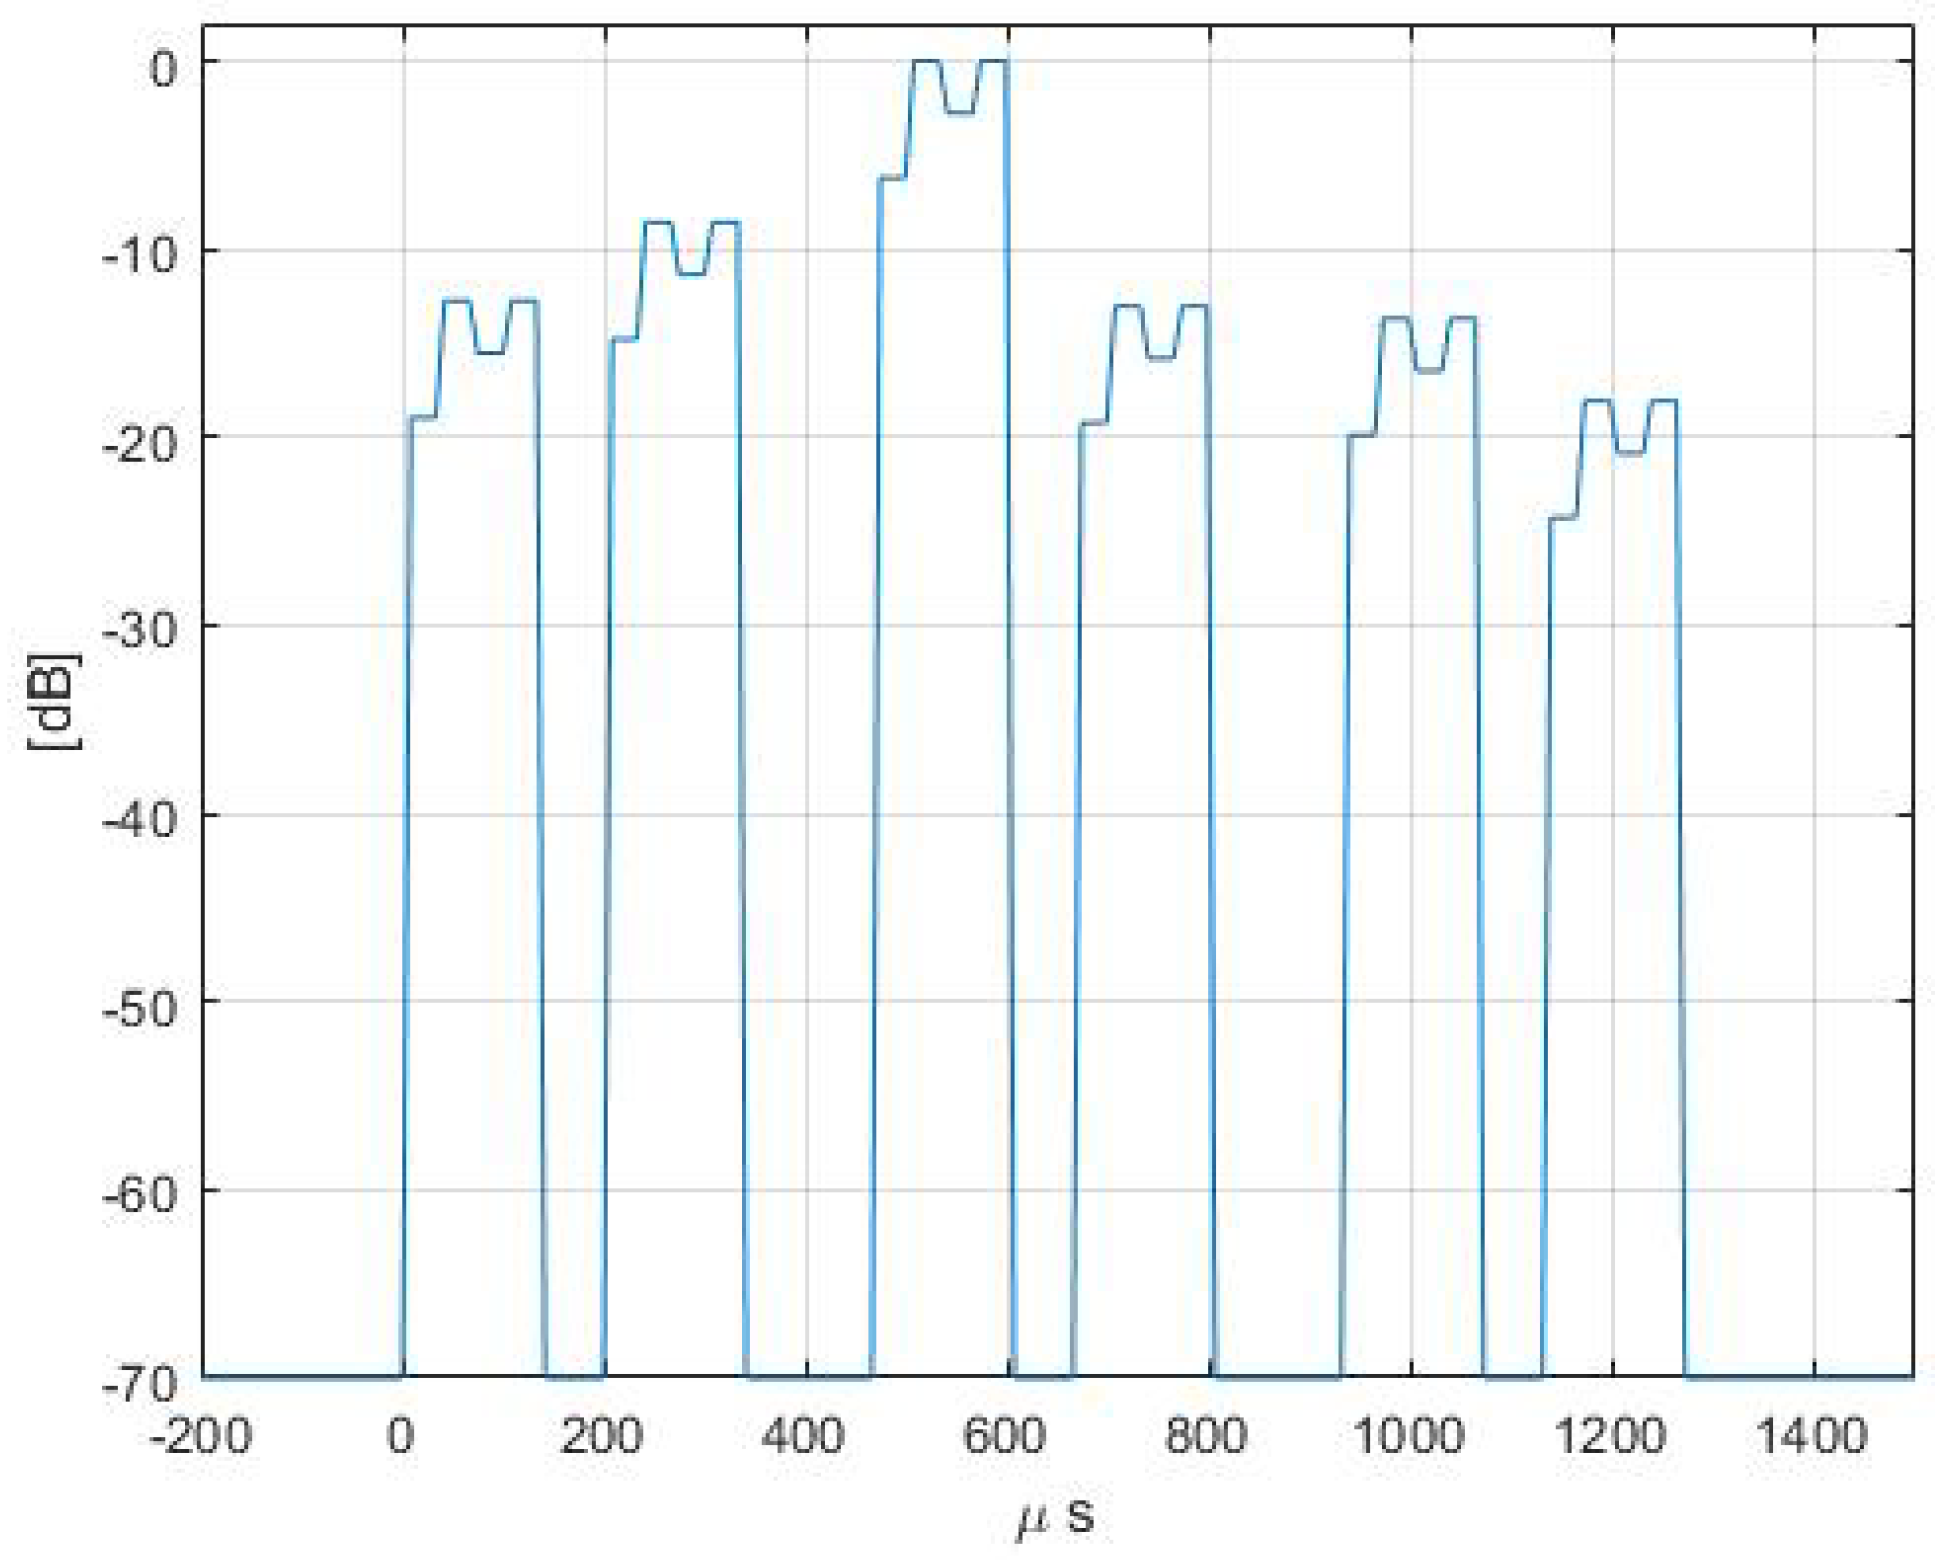
10] which have different subcarrier spacings and are applicable for different carrier frequencies: Case A (15 kHz subcarrier spacing), Case B (30 kHz subcarrier spacing), Case C (30 kHz subcarrier spacing), case D (120 kHz subcarrier spacing) and Case E (240 kHz subcarrier spacing). The maximum number of SS blocks in single burst is frequency dependent, and ranges from 4 or 6 in FR1 to up to 64 blocks per burst in FR2. In (Figure 2) an example of SS burst is shown. The SS blocks are clearly visible as yellow blocks. This example will be relevant for the FR1 TDD case reported in Section 3.

2.2. The Use of the Space Resource in 5G Communication Systems

As pointed out in the above sections, a key factor in order to reach the high performance in terms of bit rate, reliability and low latency of 5G systems is the use of SDMA techniques in order to take advantage of the spatial resources offered by the communication channel. This goal can be achieved using sophisticated antenna technologies that can be globally collected in the term “reconfigurable antennas” [11]. Basically, reconfigurable antennas allow to take advantage of the electromagnetic environment by a proper processing of the transmitted/received signal [12]. The 5G network supports the use of advanced antennas by means of a number of dedicated signaling procedures [10] that include SS-B bursts for antenna beam selection, Reference Signal Received Power (RSRP) for dynamic beamforming and Sounding Reference Signals (SRS) for massive multi-user MIMO.
Loosely speaking, reconfigurable antennas are based on a number of radiating elements, eventually organized in subarrays, whose input/output signal is properly processed using analog circuits, digital circuits or an hybrid of the two solutions [11]. Reconfigurable antennas are not new in the antenna community [10,13], but their cost has prevented their use in non-military applications. The introduction of these antennas on the marked is strictly related to the development of low-cost solutions [14]. Consequently, different generations of antenna technologies are expected to be introduced in 5G systems depending on the technological advances in antenna production. In the following a brief review of possible antenna technologies for SDMA is presented.
In order to describes the solution proposed for 5G antennas, it is useful to link the antenna technology to the final goal of the communication system, that is the maximization of the information reliably transmitted to the receiver.
The least upper bound of the bit rate reachable in a channel affected by noise and interference (both modeled as Additive White Gaussian Noise (AWGN) for sake of simplicity) is given by the well known Shannon channel capacity [8]:
C = B log 2 1 + S I N R = B log 2 1 + P t G t ( θ r , ϕ r ) A ( θ r , ϕ r ) N + I [ bits / s ]
wherein B is the bandwidth of the signal, G ( θ r , ϕ r ) is the gain of the transmitting antenna toward the receiver, θ r and ϕ r are the angles associated of the receiver position in a proper spherical system centered on the transmitting antenna, S I N R is the Signal Interference plus Noise ratio, N and I are, respectively, the noise power and the interference power, and A ( θ r , ϕ r ) is the response of the channel. In the above model the receiving antenna gain has been included in A ( θ r , ϕ r ) in order to focus the attention on the role of the gain of the transmitting antennas.
The standard fixed-beam antennas used in the base stations until the 4G generation are fan-beam antennas with a gain around 16 d B i (Figure 3(a1,b1)).
The simplest and “cheaper” reconfigurable antennas is the beam-switched antenna [15] shown in Figure 3(a2,b2). It gives a number of beams covering a desired angular range using pre-fixed weights for the radiating elements, giving a number of possible gain functions G h ( θ , ϕ ) 
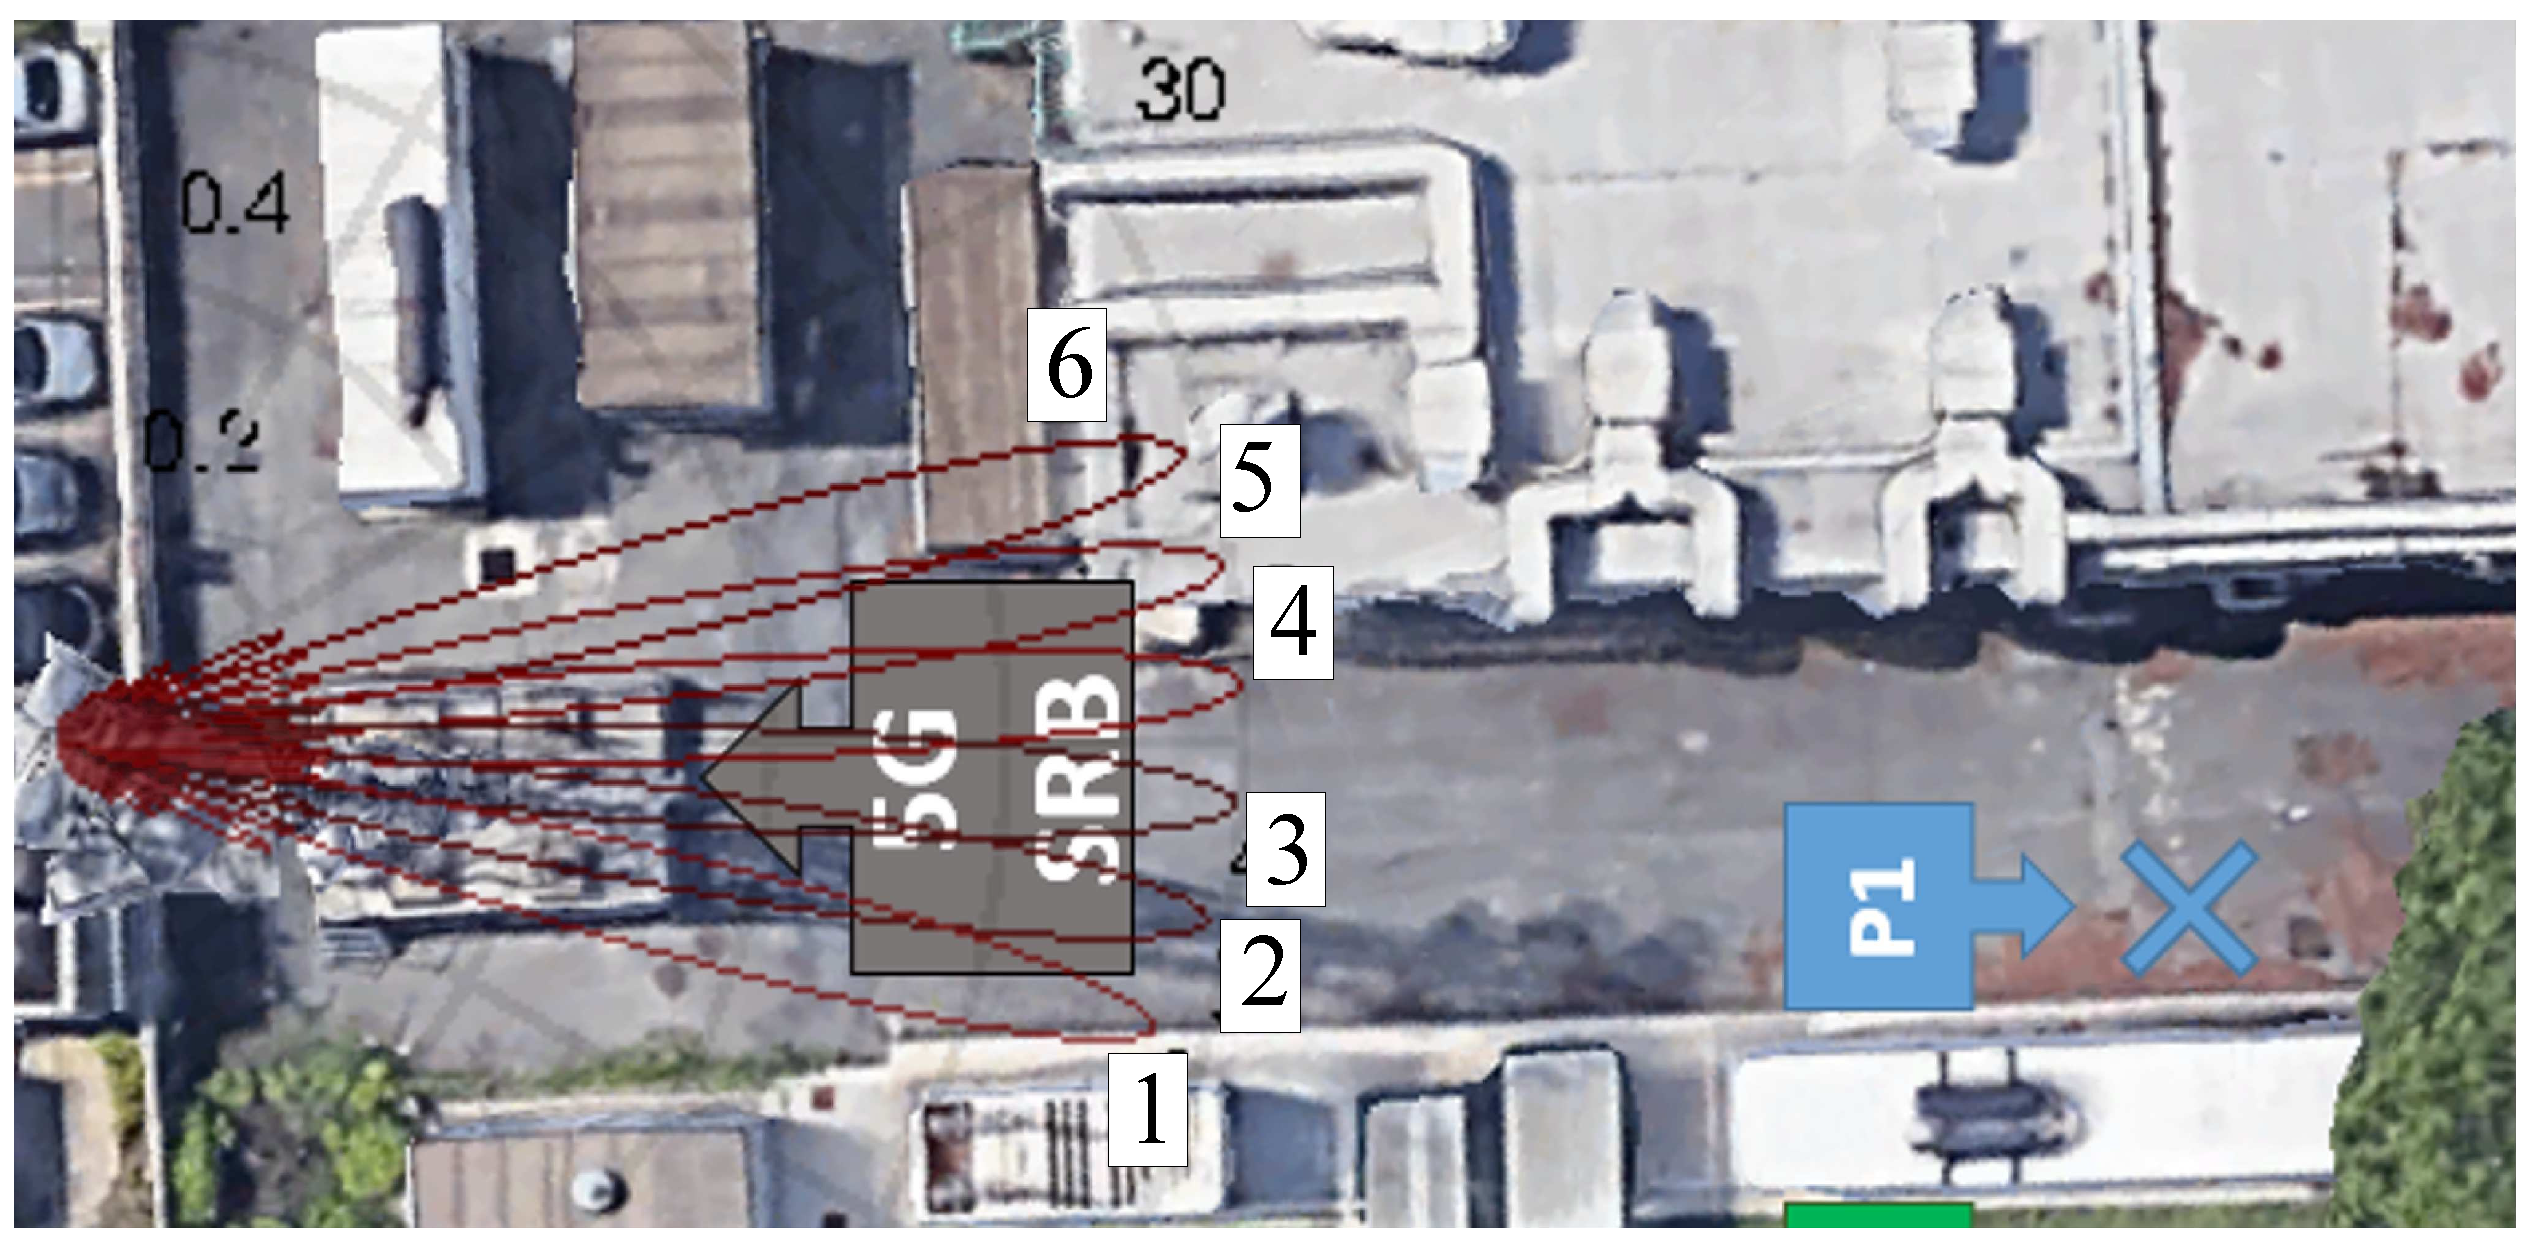
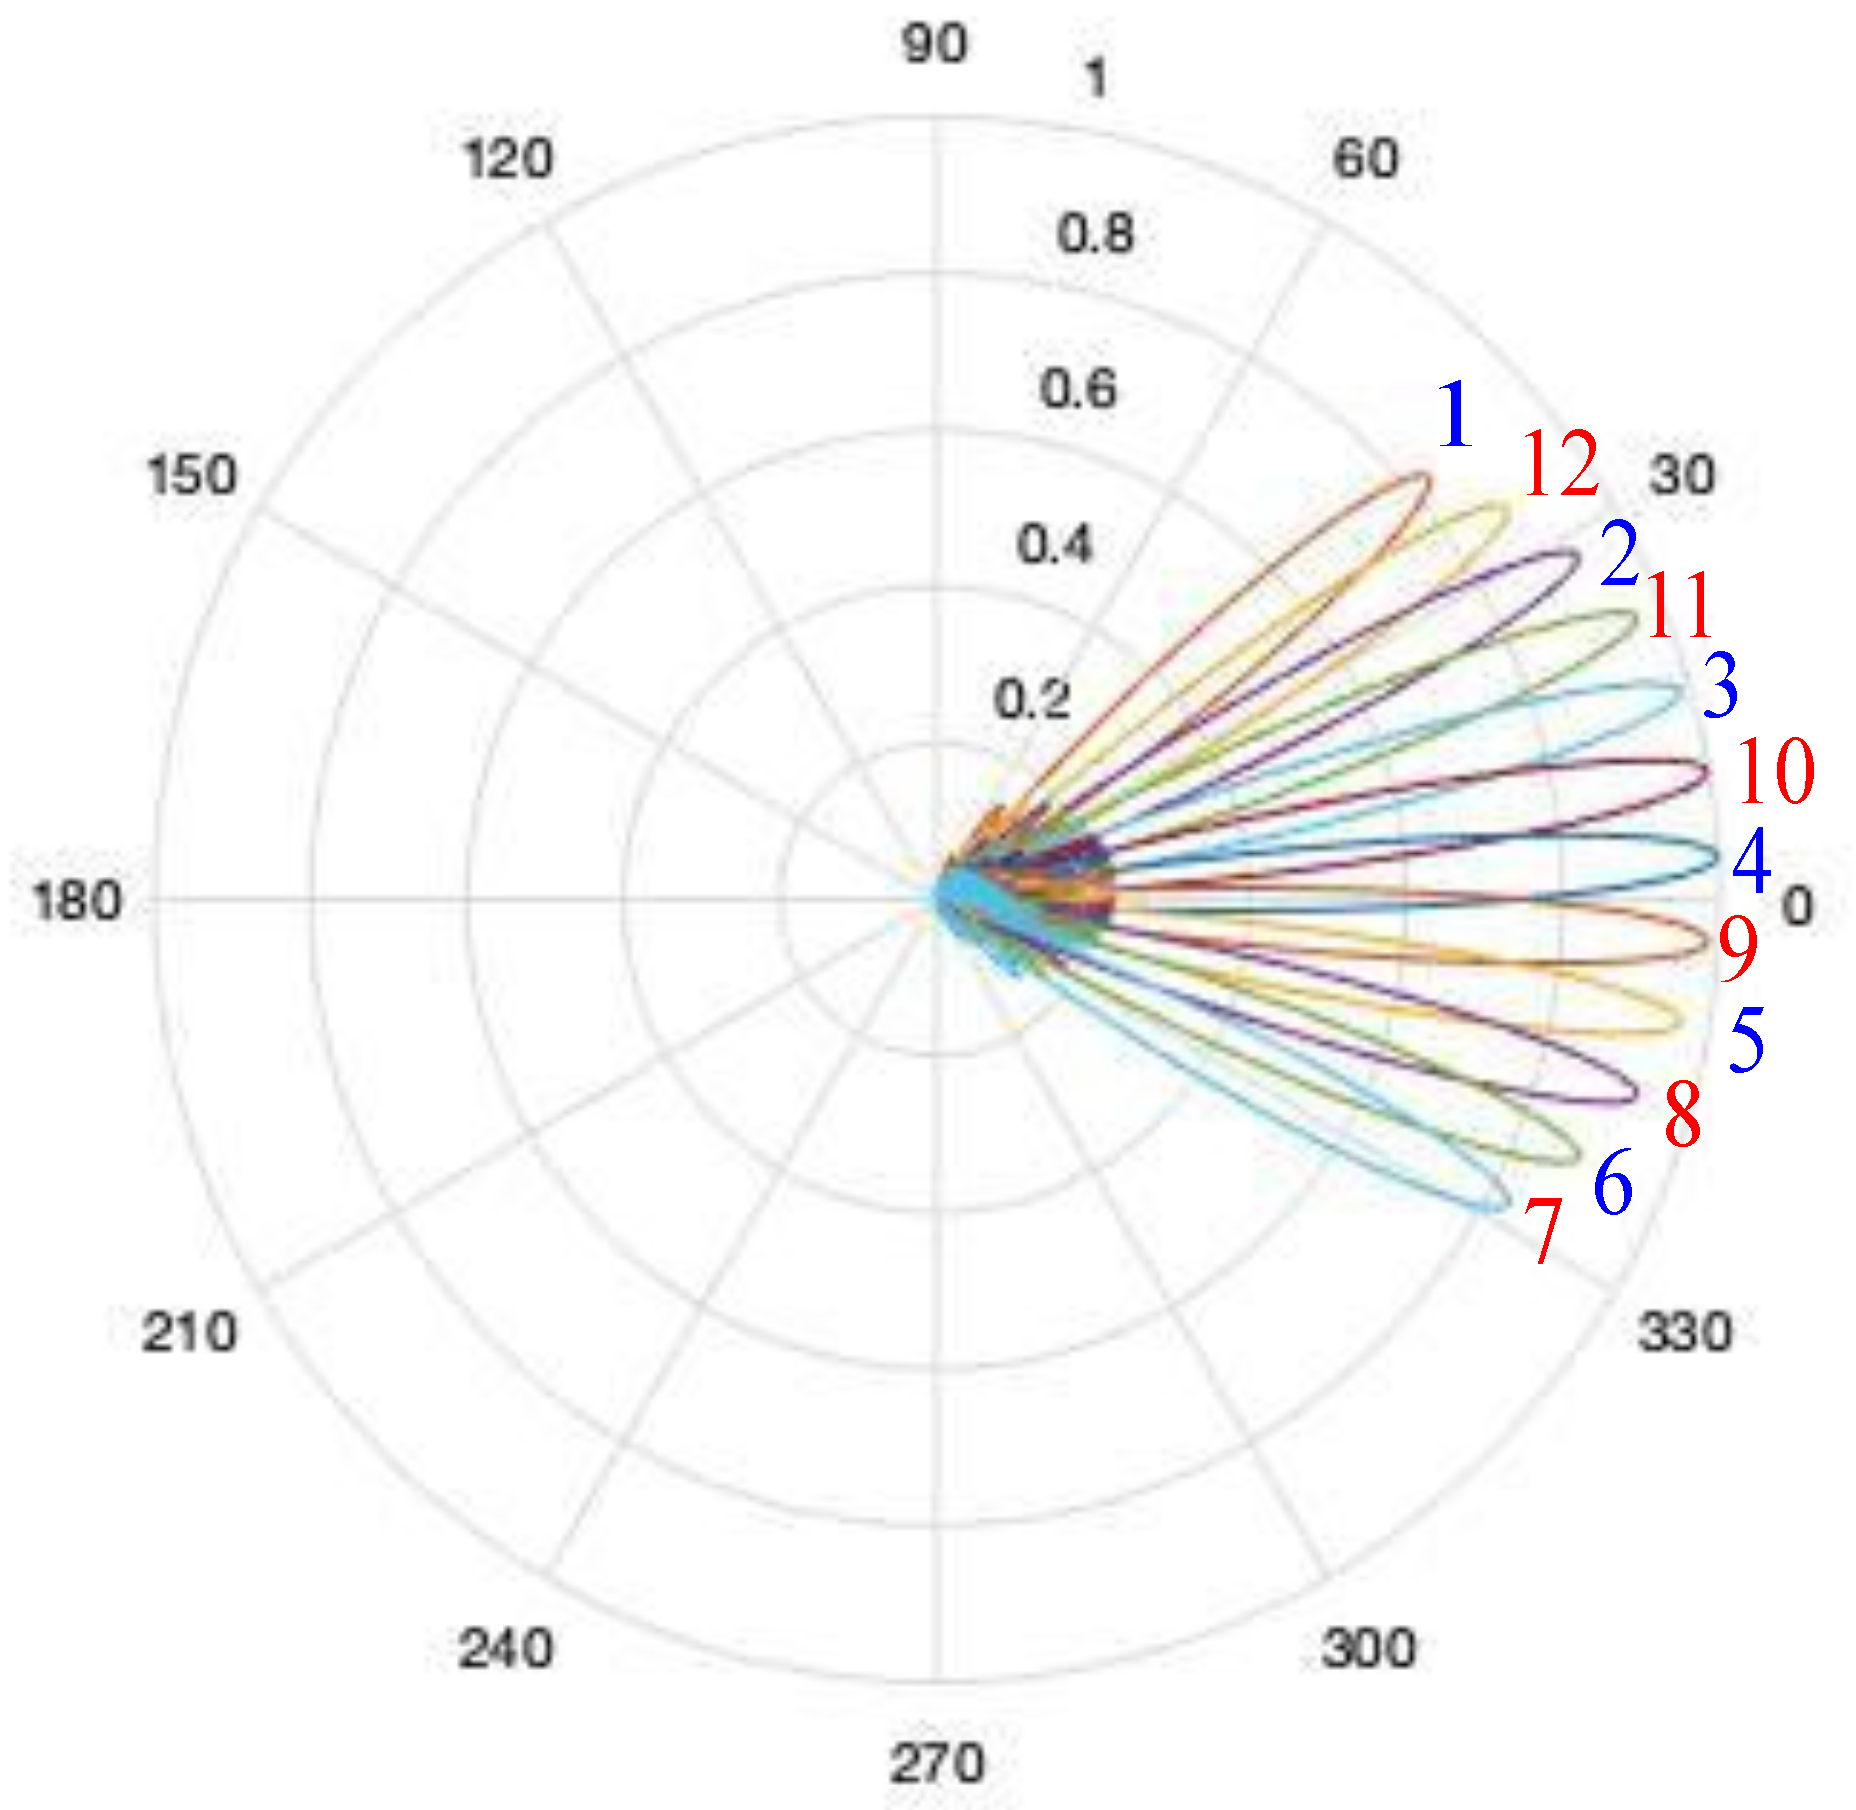
. This allows to obtain a higher SNR (Signal Noise Ratio) at the receiver, increasing the throughput of the communication system compared to a standard fan-beam antenna. Switched beams in vertical direction are used to mitigate the problems affecting lower bit rate available at the border of the cells (Figure 3(b2)). For this application, generally a small number of beams are required. Switched beams in horizontal direction (Figure 3(a2)) are mainly used to selectively illuminate narrow angular region, and a larger number of beams are generally required. Furthermore, different beam widths can be used (Figure 3(a3,b3)), allowing a further flexibility in the use of space resource. Switched beam is a relatively simple technology, that however has some drawbacks, since a finite number of fixed beam configurations causes a ripple in the received power associated to the shape of the pattern, and hence a variation of the channel capacity with the angular direction of the receiver.
The beam-steering antennas [11,15] (Figure 3(a4,b4)) avoid this problem by steering the main beam toward the receiver. This technology required to evaluate the weights on the radiating elements in real time. A drawback of this solution is that power is radiated along the direction of the sidelobes of the antenna, causing interference with other users, or receiving interference from other base stations using the same frequency resources.
This problem can be solved using adaptive antennas [11,13], (Figure 3(a5,b5)), that are able to synthesize at the same time the main lobe toward the desired user and nulls of the beams toward the other users or base stations, avoiding interference. Adaptive antennas are currently extensively used in military RADAR and communication systems.
All the above approaches offer an improvement of the SNR or of the SINR. However, the Shannon formula shows that a linear increase of the SNR gives only a logarithmic increase of the received power.
MIMO (Multiple Input Multiple Output) [8,12] technology starts from a different perspective. In order to increase the channel capacity MIMO creates a number of ’spatial’ parallel communication channels, let M be, on the same physical channel, obtaining a channel capacity (in case of No Channel State Information [8]) equal to
C = j = 1 M log 2 1 + S N R k [ bits / Hz / s ]
wherein S N R k is the Signal Noise Ratio associated to the k-th communication channel. If S N R 1 = S N R 2 = . . . = S N R k = S N R we have
C = M log 2 1 + S N R [ bits / Hz / s ]
i.e., a linear increase of the channel capacity. An intuitive explanation of the way of working of MIMO systems is shown in Figure 3(a6). The antenna radiates in presence of two obstacles. The reflections from the obstacles cause paths that can carry information. The three paths shown in the figure can potentially transmit 3 data streams at the same time. It is important to stress that this is only a rough intuitive explanation. In reality, the antenna radiates a complex field configuration wherein the data streams are mixed in a complex way. The interested reader can find a simple introduction of the physical bases of MIMO systems in [16,17] while a more rigorous analysis from a physical perspective can be found in [18].
From a circuital point of view, MIMO antennas are antennas whose radiating/receiving elements are connected to different TRM (transmitting receiving modules) in order to separate data streams associated to different MIMO spatial channels. It is useful also to note that the effectiveness of MIMO systems depends on the values of S N R k , i.e., on the effective number of MIMO channel. In real applications, the number of effective channels rarely exceeds 5 or 6.
Even if MIMO was originally developed for Single-User application (SU-MIMO), it was quickly realized that this technology can be extended in case of Multi-User applications in order to reduce or to avoid the problem of interference in the cell, obtaining a number of solutions known as MU-MIMO (Multi-User MIMO) [8].
More recently Marzetta proposed the use of a very large number of radiating elements (theoretically unlimited) at the base station [19]. The use of a number of antennas much larger than the number of users allows to take advantage of some mathematical properties of large matrices, (asymptotically) assuring the absence of interference also in case of non cooperative users. This triggered a huge research on large antennas, called also Massive MIMO. A multimedia-simulation of the field radiated by 5G Massive MIMO antennas in a dynamic environment is also available at [20]. It must be also noted that the term Massive MIMO antennas is currently adopted on the market for antennas with a large number of elements. Consequently, with the name of ’Massive MIMO’ vendors often indicate also switched antennas or beam-steering antennas.
EMF measurement in communication systems using sophisticated SDMA technique is a new field of research. The 5G systems tested in the research discussed in this paper use switch beam antennas, and the discussion reported in following sections is limited to this technique. Measurement of MU-MIMO represents a much difficult technical problem. Loosely speaking, in MIMO systems the electromagnetic field spatial distribution is modulated according to transmitted information. Consequently, the amplitude of the field in a spatial point fast changes in an almost random way. The time scale of these variations is at the level of a symbol, and therefore much faster than the coherence time due to the temporal fading. Similarly, the spatial variation of the field is generally faster than the coherence distance related to spatial fading. The EMF measurement techniques for MIMO are not yet available, but probably will be largely based on statistical approaches.

3. 5G Signal Measurement

This Section is devoted to the measurement of some parameters that are relevant for EMF measurement. 5G allows both FDD (Frequency Division Duplexing) and TDD (Time Division Duplexing) for FR1, and TDD for FR2. Since the available operative 5G communication systems used only TDD, TDD signals were measure Over The Air (OTA), while the FDD 5G signal was obtained using laboratory equipments. For each signal, zero span and demodulation analysis are performed. Zero span is a mode of a spectrum analyzer in which the local oscillator does not sweep, i.e., remains fixed at a given frequency. This feature allows the analyzer to be used as a fixed-tuned receiver, which provides the signal amplitude (or power) variations as a function of time. In the following, a periodic trigger of 10 ms is be applied to the zero span measurements, in order to synchronize each sweep with the duration of a 5G radio frame.

3.1. FR1 FDD 5G Signal

As first case, the analysis of a FDD signal in the FR1 (sub-6 GHz) band is considered. Since no 5G stations using FDD were available, the 5G signal was generated using a Keysight Technologies MXG N5182B vector signal generator [21] and carried by a coaxial cable with N-connector to a Vector Network Analyzer Keysight Technologies UXA N9040B. The measurements allowed to define measurement techniques that will be successively applied to TDD signals.
As first step, let us analyze the signal in the frequency domain. The parameters of the signal are listed in Table 1. The frequency spectrum in case of full data traffic is plotted in Figure 4. The measurement allows to identify the bandwidth of the signal, equal to 100 MHz. The spectrum has an almost flat shape in the whole bandwidth, with sharp edges, and shows a full use of the OFDM available subcarriers.
Figure 5 shows the spectrum of a signal in no traffic-data transmission condition. In absence of traffic data it is possible to easily identify the SS-Blocks allocation. The bandwidth of the SSB, equal to 7.2 MHz, allows to identify the numerology of the signal, equal to μ = 1 , associated to a subcarrier spacing equal to 30 kHz.
Figure 6 shows the signal in the time domain in case of no data traffic condition. The plot is the result of a 10 seconds, zero span acquisition over a 5 ms sweep time, using a detector trace set to max-hold. A periodic trigger of 10 ms is applied, in order to synchronize each sweep with the duration of a 5G radio frame.
From the figure it is possible to identify the structure of an SS-Burst. In particular, the figure shows that SS-Burst is composed by eight SS-Blocks, each transmitted during the dedicated time slot, that in case of μ = 1 , is equal to 4 τ 133 μ s wherein 4 is the number of symbols reserved for an SS-Block and τ represents the time of a symbol.
Figure 6 shows that all the SS-Blocks have same power level. This is a consequence of the specific set-up, in which a direct connection by a coaxial cable between the vector signal generator and the analyzer is present, that do not allow to properly model the sweeping/beamforming effect of antennas in real 5G connections. This point will be object of deep investigation in the next subsections.
Before concluding this section, it is interesting to give a deeper look into the 5G signal. A more complete analysis of the relevant characteristics of the detected signal is shown in the Figure 7, that reports a shot of the screen of the vector signal analyzer. Let us consider in particular the right sub window in the second row where details of the different blocks of the signal are reported. The data show that different modulations are used for different kind of blocks according to the different degree of importance of the data carried by the blocks. In particular, BPSK is the most robust modulation with respect to the noise, and is used for PSS and SSS blocks, while the much less robust 256 QAM is used for user data. In the same sub window it is reported also the number of Resource Blocks associated to different blocks. A pictorial view of how the different blocks are placed in the Resource Grid is shown in the right sub window of the first row. Among the other data, it is also reported the power level of the SS-Blocks (center figure), showing a difference of less that 0.1 dB, as above discussed.

3.2. FR1 TDD 5G Signal

In this Section a OTA (Over The Air) measured signal transmitted by a commercial 5G base station is analyzed. The signal was measured by means of a Vector Netwok Analyzer Keysight MXA N9020A (Keysight) connected to a Rohde & Schwarz HL050 logarithmic antenna using a Sucoflex phase-stable cable. The parameters of the signal are listed in Table 2. The measurement site is shown in Figure 8. Since 5G smartly use both space and time to send information, the data were collected both in the time and the space domain. In particular, three different spatial positions, indicated as P1, P2 and P3 in Figure 8, were selected for the measurements.
The acquired signal allows to discuss two important aspects of the 5G technology not present in the previously analyzed signal: The Time Domain Multiplexing and the beam sweeping.
As previously introduced, communication uses a TDD scheme. Indeed, even if both FDD and TDD are included in 5G standard, it is probable that TDD will become the standard for all the frequencies excluding eventually the lowest ones. In fact, one of the critical point in sophisticated space-time coding strategies is the knowledge of the communication channel, known as Channel State Information (CSI) [8]. In FDD different frequencies are used by the transmitter and the receiver. This means that TX and RX use different communication channels, each of them requiring the acquisition of CSI. The advantage of TDD is that transmitter and receiver share exactly the same communication channel in any time interval shorter than the coherence time of the channel [15], simplifying the use of SDMA techniques, whose effectiveness critically depend on the accuracy of the CSI.
The knowledge of CSI allows to effectively use the many SDMA techniques developed in the last decades, and shortly described in Section 2.2. It is worth noting that CSI measurement causes a reduction of paying traffic due to the CSI measurement process, and that more sophisticated SDMA techniques require more accurate and so more expensive CSI measurements. As a consequence, the choice of the SDMA technique by the vendor derives by a careful balance among many concurrent aspects. The measure data allows to give an interesting look inside the technology used in the current generation of 5G communications systems.
In order to analyze the signal, a time domain analysis is carried out with particular reference to the SS-Blocks using zero span mode in the three measurement positions P1, P2, P3. Figure 9 shows the acquired zero span spectra. An offset was applied in order to ensure that the SS-Burst started at the same pixel for the three measurement position. If we compare this figure with the Figure 6, it is possible to note a modulation of on the amplitude of the SS bursts. This is strictly related to the SDMA technique applied by the 5G base station. In Figure 10 the use of the SS Blocks to select the beam of the antenna [10] is shown. Different beams are associated to different SS blocks. The beam associated to the block received with highest power is then selected. Consequently, the effect of such a beam sweeping is a variation of the SS-Blocks power level received by a user.
In order to clarify this point, that has important consequences on the development of proper strategies for the estimation of the average field level, a simulation of the P1 position case is shown. P1 position has been selected since no buildings are placed along the propagation path. This allows a basically Line of Sight (LOS) propagation without significant reflection/scattering effects. The set of patterns considered and the position of the receiver are shown in Figure 11. The beam sweeping of the patterns form pattern 1 to pattern 6 modifies the amplitude of the SS Blocks from a constant amplitude, (Figure 2), to a variable amplitude (Figure 12). The subcarrier/OFDM symbol configuration shown in Figure 12 is first mapped into the frequency/time domain and then the signal in the time domain is evaluated. The result is shown in Figure 13. As reader convenience, the measured time-domain signal in the P1 position is plotted in Figure 14, showing a good agreement with the simulation. It must be stressed that the details of the base station antenna were not known, and hence sidelobes could not be accurately modeled, resulting in a slight overestimation of the SS Block amplitude associated to the sidelobes.

3.3. FR2 TDD 5G Signal

In this subsection measurements on an on-air 5G signal in the millimeter frequency range are discussed. The measurements were performed in the “Terme di Diocleziano” (“Baths of Diocleziano”). Built from 298 A.D. To 306 A.D. by the roman emperor Diocletian, they were the largest of the roman imperial baths, and today are one of the most popular touristic attractive in Rome. The mmWave 5G system was installed to fulfill specific tourism-related use-cases. The parameters of the signals are summarized in Table 3.
As first case, zero data traffic is considered. The spectrum of the signal in case of zero data traffic is plotted in Figure 15. The figure shows a bandwidth of 58 MHz, given by the 240 subcarriers of the SS Blocks, each of them having 15 × 2 4 kHz bandwidth, indicating a numerology equal to μ = 4 .
Coming to the time-domain analysis, Figure 16 shows zero span measurement acquired over a 50 ms sweep time using a detector trace set to max-hold. Five SS-Bursts can be easily recognized, according to the 10 ms periodicity declared by the vendor.
Then, full data traffic scenario was considered. The bandwidth, shown in Figure 17, turns out to be 100 MHz according to the use of all the available subcarriers. Regarding the time-domain behavior of the signal, the zero span measurement is shown in Figure 18. The SS-Blocks can be easily recognized in the central part of the figure. In addition, the measured duration of a traffic slot (about 120 μ s) indicates a numerology μ = 3.
A detail of the signal acquired is represented in Figure 19. The figure is focused on the TDD frame structure, showing ten traffic slots. Note that there are two different detected power levels for traffic slots: The highest one, for type-D (Downlink) and type-S (Special Subframe) [9,10] slots and the lowest one for type-U (Uplink) slots, arranged according to a “D-D-D-S-U-D-D-S-U-U” pattern [10]. The two different detected power levels for traffic slots reflects the difference between the radio base station and the user equipment transmit power.
Subsequently, the sweep time is reduced in order to focus on a single SS-Burst. Figure 20 shows the signal acquired over a 500 μ s sweep time setting the receiver on span zero. The figure shows twelve SS-Blocks, arranged according to the Case-E schema. All the blocks can be easily recognized, with the exception of the SS-Block 1 and 3 whose signal-to-noise ratio is too low to be appreciated. The effect of the beam sweeping on the amplitude of the SS Blocks is clearly visible.
The beam sweeping has been also numerically simulated. In Figure 21 the simulated patterns are shown. The number associated to each of the 12 patterns represents the selection sequence of the patterns. SS-Blocks amplitude have been simulated according to this sweeping strategy. The time domain signal, plotted in the same time scale of the measured signal, is plotted in Figure 22, showing a good agreement with the experimental data.

4. Estimation of the F TDC and R Parameters

The results shown in the above Section makes clear the effect of TDD and beam sweeping on the acquired 5G signal. As discussed in the Introduction. These effects must be taken in to account in the measurement of field for assessment of compliance with Exposure limits.
Regarding the the impact of TDD technology on the total transmitted (and detected) power, according to [6], this can be quantified by a deterministic scaling factor ( F T D C ) representing the duty cycle of the signal, i.e., the fraction of the signal frame reserved for downlink transmission. The on-site evaluation of F T D C value for a generic 5G signal takes a crucial importance for the regulatory authorities.
The experimental investigation carried out suggests that span zero measurement can be an effective way to quantify the F T D C of 5G signals. In particular, according to the experience gained during the measurements described in this paper, the experimental procedure proposed for the estimate of F T D C factor is based on a zero span measurement using the following settings:
  • Center frequency = the same of the SS-Blocks;
  • resolution bandwidth = the entire signal bandwidth (or in the case of hardware limitations, the largest RBW allowed by the instrument);
  • sweep time = a multiple of the frame length (10 ms);
  • periodic trigger = 10 ms;
  • detector trace = max-hold;
  • acquisition time = 10 sec (or the lowest time needed by the downlink slots to properly arise).
As an example of application on a true signal, the proposed procedure has been applied to the FR1 TDD signal. The measured data are plotted in Figure 23. Starting from these data, an estimated value for F T D C can be obtained using the following formula:
F T D C = N d o w n l i n k - p i x e l N t o t a l - p i x e l
where N d o w n l i n k - p i x e l is the number of pixels ‘on’ and N t o t a l - p i x e l is the total number of pixels provided by the analyzer. A pixel can be identified as ‘on’ if it exceeds a certain power threshold, used to distinguish between downlink and uplink symbols. Note that the receiver antenna must be placed at a proper distance from any user equipment, in order to not include the uplink transmission in the acquired spectrum.
The estimated value for F T D C of the FR1-TDD case is 0.743. As a validation of the experimental procedure, this value should be compared to the expected F T D C value for the specific TDD scheme implemented by the 5G source, equal to 0.746. The excellent agreement between the measured value and the expected one confirms that the proposed technique is well suitable for a correct evaluation of the F T D C factor.
Regarding the beam-sweeping, it causes a variation of the field amplitude in a point according to the direction of the maximum and of the shape of the transmitted beam. An estimation of the variation of the field level caused by beam sweeping can be obtained by the analysis of the SS-blocks, as shown in Section 3.
As an example, in Figure 24 a screenshot of the SS-Block power (dBm) in case of FR1-TDD case is shown. The SS-blocks power level has a bell-shape that can be used to estimate the effect of the beam-sweeping on the average received power. In particular, in order to evaluate the effect of beam sweeping on the SS-Block detected power level a parameter, let R be, can be defined as:
R = < P S S B > max P S S B
wherein < P S S B > is the average detected power of all the SS-Blocks in a burst and max P S S B is the power of the strongest SS-Block in the burst. This formula has been applied to the FR1-TDD case, obtaining a value or R value equal to 19.5% in P1, 17 . 8 % in P2 and 27.7% P3. It is also worth noting that the simulated P1 position case gives an R = 21 % . As noted before, there is a slight overestimation due to the absence of information on the exact shape of the antenna pattern, that however gives a relatively low error since it involves the sidelobes of the simulation.
The same formula has been applied in the case of FR2-TDD data (Figure 25), obtained R = 18 %. The numerical simulation discussed in the previous Section gives an R = 18 %. Note that also in this case the exact patterns of the base station antenna were not exactly known. The better result compared to the FR1 case is probably due to a lower importance of the exact far-sidelobes shape since millimeter wave antennas have generally much lower sidelobe levels than antennas working at FR1 frequencies.
The above results, even if preliminary, show that zero-span analysis and SS-Block analysis could be an effective way to estimated deterministic scaling factors for assessment of compliance with RF EMF exposure limits. Furthermore, numerical results suggest that simulations could be a useful tool to analyze the measured data, and eventually also to estimate R, provided that the parameters of the transmitted signal and of the base station antenna are known.

5. Conclusions

In this paper some characteristics of the 5G signal that play a relevant role in the EMF measurement are discussed, and measurement techniques to quantify the impact of these characteristics in the estimation of the mean value of the field amplitude are shown.
In particular, a procedure to estimate the F T D C and R parameters, based on span zero measurement technique and SSB power measurement, has been proposed. The result of the F T D C estimation procedure has been compared with the one obtained from the TDD sequence specified in the 5G standard according to the parameters of the signal identified in Section 3, confirming the effectiveness of the zero span method. Furthermore, a method to quantify the effect of the only beam sweeping of the control channels, measuring the variation of the SSB power level in an SS Burst, is proposed and a proper factor called R is introduced.
The results achieved in this study represents a solid starting point for a future in-depth analysis focused on the definition of effective extrapolation techniques to be used by the regulatory authorities with the aim of assessing the compliance with the limits imposed by the national legislations.

Author Contributions

D.F., S.C., E.G. and S.P.; Formal analysis, D.F.; Methodology, D.F., E.G. and S.P.; Supervision, T.A., R.C. and M.D.M.; Writing—original draft, D.F., M.D.M. All authors have read and agreed to the published version of the manuscript.

Funding

This research was partially funded by the program `Dipartimenti di Eccellenza (2018–2022)’ of MIUR, Italy.

Conflicts of Interest

The authors declare no conflict of interest.

References

  1. 3GPP TR 38.913. Study on Scenarios and Requirements for Next Generation Access Technologies. Available online: https://www.etsi.org/deliver/etsi_tr/138900_138999/138913/14.02.00_60/tr_138913v140200p.pdf (accessed on 23 December 2019).
  2. Xiang, W.; Zheng, K.; Xuemin, S. (Eds.) 5G Mobile Communications; Springer: Cham, Switzerland, 2016. [Google Scholar]
  3. 3GPP TR 38.912. Study on New Radio Access Technology. Available online: https://www.etsi.org/deliver/etsi_tr/138900_138999/138912/15.00.00_60/tr_138912v150000p.pdf (accessed on 23 December 2019).
  4. 3GPP TS 138 104 V15.4.0, 5G; NR; Base Station (BS) Radio Transmission and Reception. Available online: https://www.etsi.org/deliver/etsi_ts/138100_138199/138104/15.02.00_60/ts_138104v150200p.pdf (accessed on 23 December 2019).
  5. IEC 62232:2017. Determination of RF Field Strength, Power Density and SAR in the Vicinity of Radio Communication Base Stations for the Purpose of Evaluating Human Exposure; International Electrotechnical Commission: Geneva, Switzerland, 2017. [Google Scholar]
  6. IEC/TR 62669:2019. Case Studies Supporting IEC 62232—Determination of RF Field Strength, Power Density and SAR in the Vicinity of Radiocommunication Base Stations for the Purpose of Evaluating Human Exposure; International Electrotechnical Commission: Geneva, Switzerland, 2019. [Google Scholar]
  7. Franci, D.; Grillo, E.; Pavoncello, S.; Coltellacci, S.; Buccella, C.; Aureli, T. Extrapolation method for maximal and 24-h average LTE TDD exposure estimation. Radiat. Prot. Dosim. 2017, 178, 179–184. [Google Scholar] [CrossRef] [PubMed]
  8. David, T.; Viswanath, P. Fundamentals of Wireless Communication; Cambridge University Press: Cambridge, UK, 2005. [Google Scholar]
  9. Zaidi, A.; Athley, F.; Medbo, J.; Gustavsson, U.; Durisi, G.; Chen, X. 5G Physical Layer: Principles, Models and Technology Components; Academic Press: Cambridge, MA, USA, 2018. [Google Scholar]
  10. Kottkamp, M.; Pandey, A.; Raddino, D.; Roessler, A.; Stuhlfauth, R. 5G New Radio. Fundamental Procedures and Technical Aspects; Rhode & Schwarz: Munchen, Germany, 2019. [Google Scholar]
  11. Balanis, C. Antenna Theory Analysis and Design; Wiley: Hoboken, NJ, USA, 2016. [Google Scholar]
  12. Migliore, M.D. On electromagnetics and information theory. IEEE Trans. Antennas Propag. 2008, 56, 3188–3200. [Google Scholar] [CrossRef]
  13. Compton, R. Adaptive Antennas, Concepts and Performance; Mc Graw Hill: New York, NY, USA, 1988. [Google Scholar]
  14. Migliore, M.D.; Pinchera, D.; Schettino, F. A simple and robust adaptive parasitic antenna. IEEE Trans. Antennas Propag. 2005, 53, 3262–3272. [Google Scholar] [CrossRef]
  15. Vaughan, R.; Andersen, J.B. Channels, Propagation and Antennas for Mobile Communications; IET Series; IET: London, UK, 2003; Volume 50. [Google Scholar]
  16. Migliore, M.D. An intuitive electromagnetic approach to MIMO communication systems. IEEE Antennas Propag. Mag. 2006, 48, 128–137. [Google Scholar] [CrossRef]
  17. Migliore, M.D. MIMO Antennas Explained Using the Woodward-Lawson Synthesis Method. IEEE Antennas Propag. Mag. 2007, 49, 175–182. [Google Scholar] [CrossRef]
  18. Migliore, M.D. Horse (Electromagnetics) is More Important Than Horseman (Information) for Wireless Transmission. IEEE Trans. Antennas Propag. 2019, 67, 2046–2055. [Google Scholar] [CrossRef]
  19. Marzetta, T.L. Noncooperative cellular wireless with unlimited numbers of base station antennas. IEEE Trans. Wirel. Commun. 2010, 9, 3590–3600. [Google Scholar] [CrossRef]
  20. Massive MIMO Antenna Simulation. Available online: https://sites.google.com/unicas.it/electromagnetic-information/papers/multimedia/massive-mimo (accessed on 23 December 2019).
  21. Keysight Technologies. Available online: www.keysight.com (accessed on 23 December 2019).
Figure 1. SS/PBCH (Synchronization Signal and Physical Broadcast Channel) block.
Electronics 09 00223 g001
Figure 2. An example of an SS Burst Case C; the SS Blocks are visible as yellow blocks.
Electronics 09 00223 g002
Figure 3. Different antenna technology for Space Division Multiple Access (SDMA) (a1) Fixed beam antenna, horizontal pattern; (b1) Fixed beam antenna, vertical pattern; (a2) switched beam antennas, horizontal pattern; (b2) switched beam antennas, vertical pattern; (a3) switched beam antennas (with different total angular region coverage), horizontal pattern; (b3) switched beam antennas (with different total angular region coverage), vertical pattern; (a4) beam steering antennas, horizontal pattern; (b4) beam steering antennas, vertical pattern; (a5) adaptive antennas with null control (green point: Subscriber; red point: Interference), horizontal pattern; (b5) adaptive antennas with null control (green point: Subscriber; red point: Interference), vertical pattern; (a6) Multiple Input Multiple Output (MIMO) antennas; (a7) Multi-User (MU)-MIMO antennas; blue and yellow points: two receivers.
Electronics 09 00223 g003
Figure 4. FR1-FDD signal: Spectrum in case of “full traffic data”.
Electronics 09 00223 g004
Figure 5. FR1-FDD signal: Spectrum in case of no traffic data condition showing the spectrum associated to the the SS-Blocks.
Electronics 09 00223 g005
Figure 6. FR1-FDD signal: Time domain analysis in case of no traffic data condition.
Electronics 09 00223 g006
Figure 7. FR1-FDD signal: Some relevant characteristics of the detected signal; central-right window shows the modulations used; note that Synchronization Signal Block/Physical Broadcast Channel (SSB/PBCH) uses two different modulations, binary phase shift keying (BPSK) for Primary Synchronization Signal (PSS) and Secondary Synchronization Signal (SSS), and quadrature phase shift keying (QPSK) for PBCH and PBCH/DMRS, while PDSCH (Physical Downlink Shared Channel) uses a 256QAM modulation; the SSB/DMRS are shown in the right upper figure with the same color associated to the modulation; the symbol constellation is shown in the upper left window.
Electronics 09 00223 g007
Figure 8. FR1-TDD signal measurement site; the measurement positions are indicated as P1, P2 and P3; examples of switched shape beams associated to three different SS-Blocks are also shown.
Electronics 09 00223 g008
Figure 9. lFR1-TDD signal: SS-Burst power collected in the three measurement positions P1, P2, P3, indicated in Figure 8; the effect of beam sweeping on the detected power level of the SS-Blocks in the SS-Burst is clearly visible.
Electronics 09 00223 g009
Figure 10. Beam selection procedure; the channel is sounded using the level of the SS bursts. The SS/PBCH block period (5 ms) also fixes the channel state uploading period; in this example only six among a maximum of eight beams are configured.
Electronics 09 00223 g010
Figure 11. Beam sweeping simulation; six beams are considered.
Electronics 09 00223 g011
Figure 12. The effect of the beam-sweeping on the SS Burst Case C considered in Figure 2; each burst is modulated in amplitude according to the antenna sweeping; the false color scale is in dB.
Electronics 09 00223 g012
Figure 13. FR1 TDD case, no data traffic, P1 position; time domain simulation from SS burst shown in Figure 12.
Electronics 09 00223 g013
Figure 14. FR1-TDD case, no data traffic, P1 position; time domain measurement; the figure reports an example of SS burst (first six pulses).
Electronics 09 00223 g014
Figure 15. FR2-TDD signal bandwidth in case of no data traffic.
Electronics 09 00223 g015
Figure 16. FR2-TDD signal in case of no data traffic: Zero span measurement acquired over a 50 ms sweep time using a detector trace set to max-hold.
Electronics 09 00223 g016
Figure 17. FR2-TDD signal spectrum in case full data traffic.
Electronics 09 00223 g017
Figure 18. FR2-TDD signal in case full data traffic.
Electronics 09 00223 g018
Figure 19. FR2-TDD signal: TDD frame structure.
Electronics 09 00223 g019
Figure 20. FR2-TDD signal: Details of the SS-Burst.
Electronics 09 00223 g020
Figure 21. Sequence of patterns (from 1 to 12) of the beam sweep strategy used in the numerical simulation.
Electronics 09 00223 g021
Figure 22. FR2-TDD: Numerical simulation of the time domain signal according to the sweep beam sequence shown in Figure 21.
Electronics 09 00223 g022
Figure 23. FR1-TDD case: Signal used for the estimation of the F T D C factor.
Electronics 09 00223 g023
Figure 24. FR1-TDD case: Measured SS-Block level.
Electronics 09 00223 g024
Figure 25. FR2-TDD case: Measured SS-Block level.
Electronics 09 00223 g025
Table 1. Parameters of the FR1-Frequency Division Duplexing (FDD) signal.
Access modeFDD
Center frequency [MHz]3500
Bandwidth [MHz]100
Numerology ( μ )1
SS-Block center frequency [MHz]3500
Number of SS-Block per SS-Burst8
Data scenarioFull traffic/Zero traffic
Table 2. Parameters of the TDD FR1-band signal.
Access modeTDD
Center frequency [MHz]3680.01
Bandwidth [MHz]100
Numerology ( μ )1
SS-Block center frequency [MHz]3679.83
Number of SS-Block per SS-Burst6
TDD SchemeDDDDD DDSUU
TDD periodicity [ms]5
Data scenarioReal traffic
Table 3. Parameters of FR2-TDD signal.
Access modeTDD
Center frequency [MHz]27742.06
Bandwidth [MHz]100
Numerology ( μ )4 for SS-Block, 3 for data
SS-Block center frequency [MHz]27740.62
Number of SS-Block per SS-Burst12
TDD SchemeDDDSU DDSUU
TDD periodicity [ms] 1.2
Data scenarioFull traffic/Zero traffic

