Article

Techno-Economic Optimization of Small-Scale Hybrid Energy Systems Using Manta Ray Foraging Optimizer

by
Fahd A. Alturki
1,
Hassan M. H. Farh
1,*,
Abdullrahman A. Al-Shamma’a
1,2,* and
Khalil AlSharabi
1
1
Department of Electrical Engineering, College of Engineering, King Saud University, Riyadh 11421, Saudi Arabia
2
Department of Mechatronics Engineering, College of Engineering, Taiz University, Taiz 6803, Yemen
*
Authors to whom correspondence should be addressed.
Electronics 2020, 9(12), 2045; https://doi.org/10.3390/electronics9122045
Submission received: 22 October 2020 / Revised: 25 November 2020 / Accepted: 26 November 2020 / Published: 2 December 2020
(This article belongs to the Section Systems & Control Engineering)

Abstract

:
Hybrid energy systems (HESs) are becoming popular for electrifying remote and rural regions to overcome the conventional energy generation system shortcomings and attain favorable technical and economic benefits. An optimal sizing of an autonomous HES consisting of photovoltaic technology, wind turbine generator, battery bank, and diesel generator is achieved by employing a new soft computing/metaheuristic algorithm called manta ray foraging optimizer (MRFO). This optimization problem is implemented and solved by employing MRFO based on minimizing the annualized system cost (ASC) and enhancing the system reliability in order to supply an off-grid northern area in Saudi Arabia. The hourly wind speed, solar irradiance, and load behavior over one year are used in this optimization problem. As for result verification, the MRFO is compared with five other soft computing algorithms, which are particle swarm optimization (PSO), genetic algorithm (GA), grasshopper optimization algorithm (GOA), big-bang-big-crunch (BBBC) algorithm, and Harris hawks optimization (HHO). The findings showed that the MRFO algorithm converges faster than all other five soft computing algorithms followed by PSO, and GOA, respectively. In addition, MRFO, PSO, and GOA can follow the optimal global solution while the HHO, GA and BBBC may fall into the local solution and take a longer time to converge. The MRFO provided the optimum sizing of the HES at the lowest ASC (USD 104,324.1), followed by GOA (USD 104,347.7) and PSO (USD 104,342.2) for a 0% loss of power supply probability. These optimization findings confirmed the supremacy of the MRFO algorithm over the other five soft computing techniques in terms of global solution capture and the convergence time.

1. Introduction

Renewable energy sources such as wind and photovoltaic (PV) have attracted the attention of many countries all over the world because fossil fuels are expected to last only a few more decades. Moreover, almost 1.5 billion people are living in remote and rural regions around the world [1]. Remote areas cannot be electrified through the utility grid and are considered off-grid loads. The stochastic nature of the renewable energy sources causes major challenges and makes it very difficult to rely on single renewable energy generator in order to electrify rural and remote loads. The standalone hybrid energy systems that combine a few more power generators such as PV, wind turbine generators (WTGs), diesel generator, fuel cell (FC), and batteries, are used to electrify these off-grid areas. These hybrid energy systems may represent an effective and reliable solution not only to electrify off-grid and remote areas but also to postpone or avoid the cost of grid extension [2,3,4]. Although hybrid energy systems have many advantages such as being environmentally friendly, less storage requirements, and low maintenance cost, the design and sizing of hybrid energy systems (HESs) represent a very complex non-linear optimization problem. The optimal sizing of different components of the HESs is a major issue not only to save energy but also to prolong their effective life span [4,5]. Furthermore, optimal sizing is a non-linear optimization design problem that aims to minimize a certain single objective or multiple objectives subject to some specific constraints. Therefore, the first key to solve this problem is to determine the objective function. The second key is to determine the optimization technique to solve this problem in order to design the HES components based on the preset objective function.
Numerous techniques are utilized to achieve the optimal sizing of the HES, which can be classified into graphical [6,7], analytical [8,9,10,11] and soft computing techniques [12,13,14]. Obviously, each technique has its own advantages and disadvantages. For instance, graphical and analytical techniques are simple to implement but they cannot deal with more than two components of the HES, concurrently. Analytical techniques perform better at a higher accuracy compared to graphical techniques. On the other hand, graphical and analytical techniques consume more computational time compared to soft computing techniques and may fall into the local solution. Soft computing techniques can deal with multi-component HES and follow the global solution at a faster pace.
Due to the shortcomings of the graphical and analytical techniques, recent studies [12,13,14,15,16,17,18,19,20,21,22,23,24,25,26,27,28,29,30,31,32,33,34,35] have focused on employing soft computing techniques for the optimal sizing of the HESs with various technical and/or economic objectives. Technical objectives mainly focus on the reliability evaluation for the HES through reliability parameters such as the loss of load expected (LOLE), loss of energy expected (LOEE), loss of load hours (LOLH), unmet load (UL), loss of power supply probability (LPSP), deficiency of power supply probability (DPSP), equivalent loss factor (ELF), and renewable energy fraction (REF). In addition, the economic objectives include the annualized system cost (ASC), net present cost (NPC), cost of energy (COE), and life cycle cost (LCC). The harmony search (HS) algorithm was employed in [15] to design a hybrid PV/diesel energy system based on the minimization of both ASC and the pollutant emission of pollutants. In Reference [16], grey wolf optimization (GWO) algorithm was utilized to achieve the optimal sizing of a hybrid PV/WTGs/battery generation system based on ASC minimization considering the power balance constraint. In Reference [17], the firefly algorithm (FA) was utilized for the optimal sizing of a hybrid PV/WTGs/battery energy system to minimize the electricity cost considering the load dissatisfaction rate. Artificial bee swarm optimization was employed in [18] for the optimal design of a PV/WTGs/FC energy system based on the ASC minimization considering the LPSP as a constraint. Furthermore, the performance of hybrid PV/WTGs/diesel/battery generation system was studied and analyzed for an off-grid area in Malaysia based on the minimization of NPC and CO2 emission using HOMER software program in [19]. The genetic algorithm (GA) was employed to design/size a hybrid PV/WTGs/diesel energy system based on the ASC minimization considering LPSP as a constraint in order to electrify an off-grid area in Italy in [20]. Moreover, particle swarm optimization (PSO) was utilized for sizing a hybrid PV/WTGs/battery generation system based on minimizing the ASC with a full load demand supply in [21]. The optimal design of a PV/WTGs/FC energy system was attained using a multi-objective PSO based on minimizing the ASC, LOLE and LOEE, with ELF as a constraint [22]. Eftichios et al. calculated the optimal number and types of a hybrid PV/wind/battery system based on the ASC minimization subject to the LOLH as a constraint using the GA in [23]. In Reference [24], the GA was used to achieve the optimal design of a PV/WTGs/battery/diesel energy system based on the minimization of COE and CO2 emission. Al-Shamma’a et al. utilized the GA to study the optimal sizing of the HES including PV/WTGs/battery/diesel based on the COE minimization considering the REF with zero LPSP in [25]. In Reference [26], PSO was used for the optimal sizing of an HES including PV/WTGs/FC based on the minimization of NPC and LPSP in order to cover the load demand of an off-grid region in Mexico. In Reference [27], the PSO was employed to determine optimal design of a PV/wind/diesel generator/battery/FC based on the multi-objective function of UL, NPC and CO2 emission. In Reference [28], simulated annealing (SA), tabu search (TS), PSO, and HS techniques were used for the optimal sizing of a PV/WTGs/FC energy system. The research findings proved the supremacy of PSO compared to the other algorithms based on the ASC minimization. Ghorbani et al. combined GA with PSO in order to find the optimal design of three different hybrid energy systems, which were PV/battery, WTGs/battery, and PV/WTGs/battery in [29]. Employing hybrid the GA-PSO technique was recommended to optimize the HES through minimizing the NPC and LPSP. In Reference [2], the cuckoo search (CS), GA, and PSO were employed for the optimal design of three different hybrid energy systems; PV/battery, WTGs/battery, and PV/WTGs/battery based on ASC minimization considering the seasonal load variation. The CS outperformed PSO and GA in both the convergence rate and global solution captured. In Reference [30], the mine blast algorithm (MBA) was compared with PSO, CS, and artificial bee colony (ABC) to attain the optimal sizing of a PV/WTGs/FC energy system based on ASC minimization. The results proved that the MBA was more reliable, efficient and the fastest in comparison to the other three meta-heuristic techniques. In Reference [31], the optimal sizing of a HES including PV/WTGs/Tidal/battery were attained using crow search algorithm (CSA) based on minimizing the NPC considering the ELF as a constraint. In Reference [32], the optimal sizing of a PV/FC/diesel generation system was achieved using CSA for a remote area in Iran based on the minimization of COE and LPSP. The improved fruit fly algorithm (FFA) was employed in [33] for the optimal sizing of a PV/WTGs/diesel/battery energy system based on ASC and CO2 emission minimization as the objectives. In Reference [34], the optimal sizing of a HES including PV/biomass/battery was achieved using flower pollination algorithm (FPA), ABC, HS, and FA based on the minimum NPC considering the LPSP and the excess energy percentage. The results proved that FA has the best global solution and less convergence time in comparison to the other three algorithms. In Reference [35], the big-bang-big-crunch (BBBC) technique was used to design a HES comprising PV/wind/battery based on the objective of NPC and UL minimization. The findings proved that BBBC performed well compared to HS and PSO. In Reference [36], HS was used to design a hybrid PV/diesel energy based on the minimization of ASC and CO2 emissions. In Reference [37], the optimal sizing of a PV/WTGs/FC energy system was achieved by FPA to minimize the NPC, LOLE, and LOEE. In Reference [38], the grasshopper optimization algorithm (GOA) was used to determine the optimal sizing of a HES including PV/WTGs/battery/diesel based on minimizing COE and zero DPSP.
According to the literature, soft computing algorithms, especially the metaheuristic ones, proved their effectiveness compared to the graphical and analytical algorithms. Therefore, researchers are motivated to discover novel soft computing techniques in order to solve the HES sizing optimization problem. This paper proposes a new meta-heuristic technique called manta ray foraging optimizer (MRFO). This new technique was proposed in 2020 and was implemented in this paper for the first time to attain the optimal sizing of a standalone HES. The off-grid HES in this study was expected to cover the load demand in a rural area sited in the northern region of Saudi Arabia. The solar irradiance, wind speed, and load demand were collected from Saudi Electricity Company (SEC). To validity the results, the proposed MRFO technique was compared with GA [39], as the best evolutionary algorithm, PSO [40] and GOA [41], as the two most prominent algorithms among swarm intelligent techniques, BBBC [42], as one of the best physics-based algorithms, and Harris hawks optimization (HHO) [43], as one of the most recent algorithms. The optimization was executed to supply the load demand of a rural area in northern Saudi Arabia at NPC minimization, zero LPSP, and maximum REF. The main contributions in this study can be summarized as follows:
A novel MRFO was implemented in this paper for the first time to attain the optimal sizing of a standalone HES based on minimizing the annualized system cost (ASC) and enhancing the system reliability.
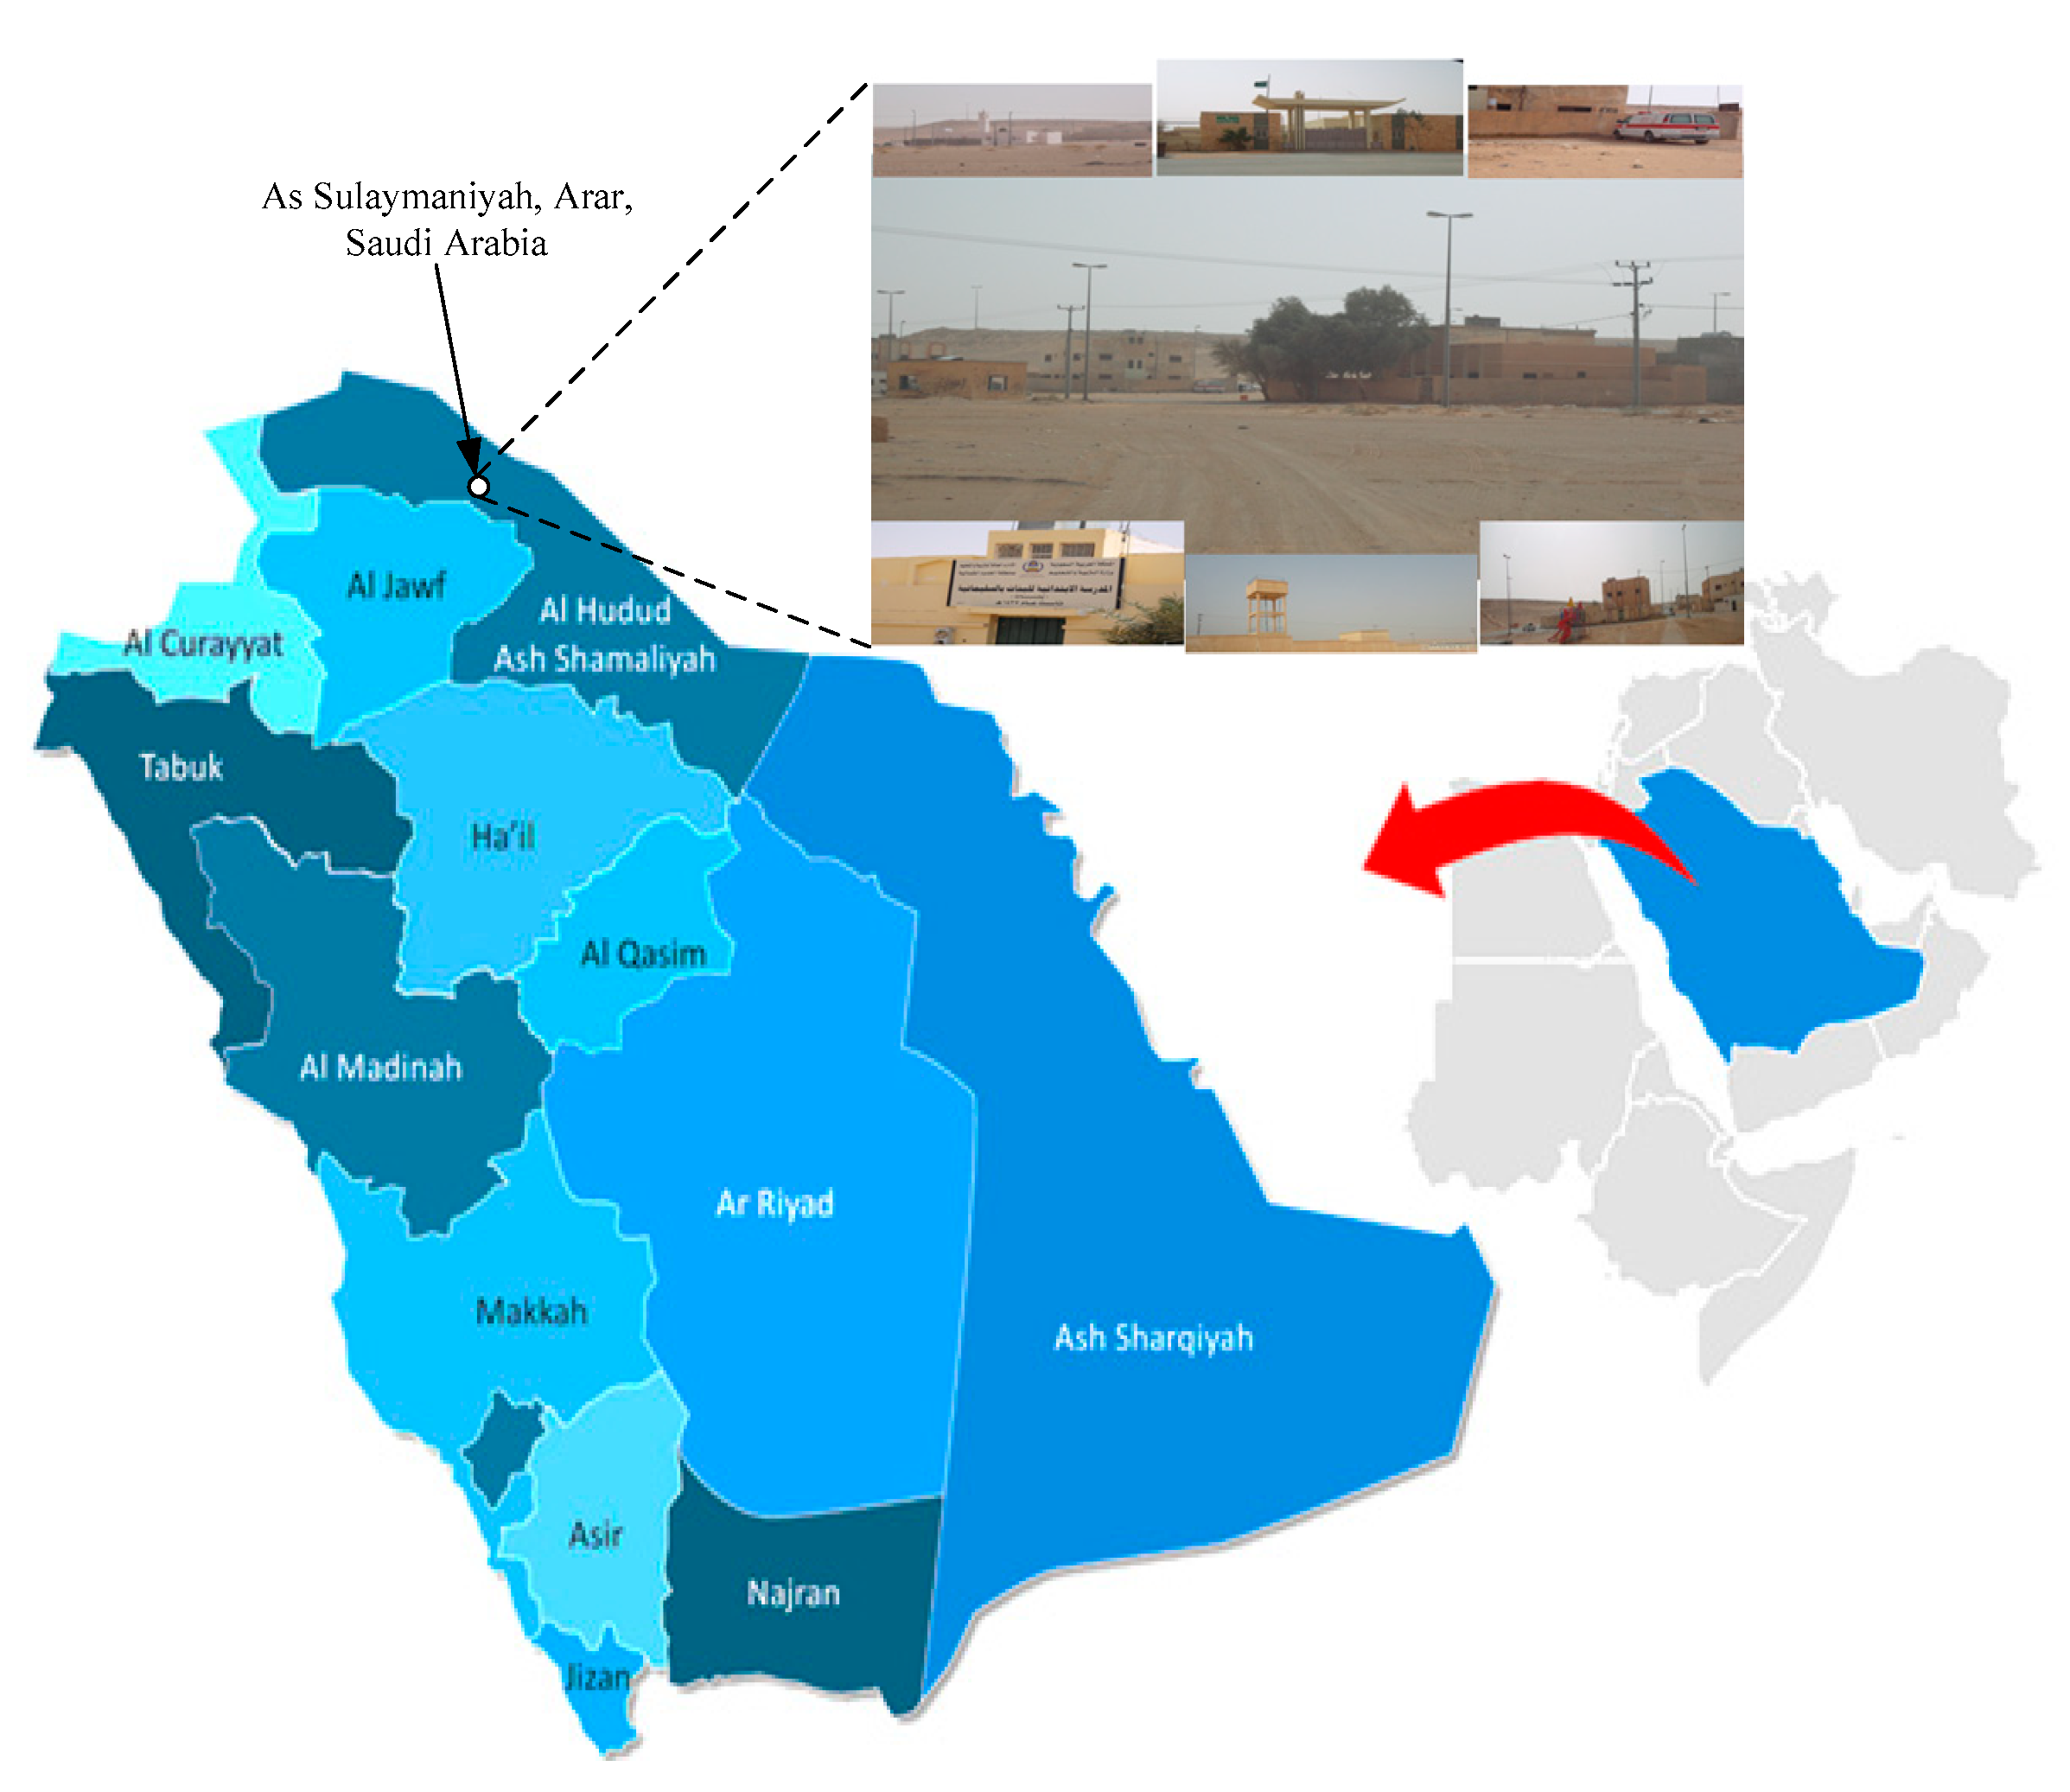
The off-grid HES consisting of PV/WTGs/battery/diesel was proposed to supply an off-grid northern area in Saudi Arabia—Al Sulaymaniyah village—taking both the technical and economic factors into consideration.
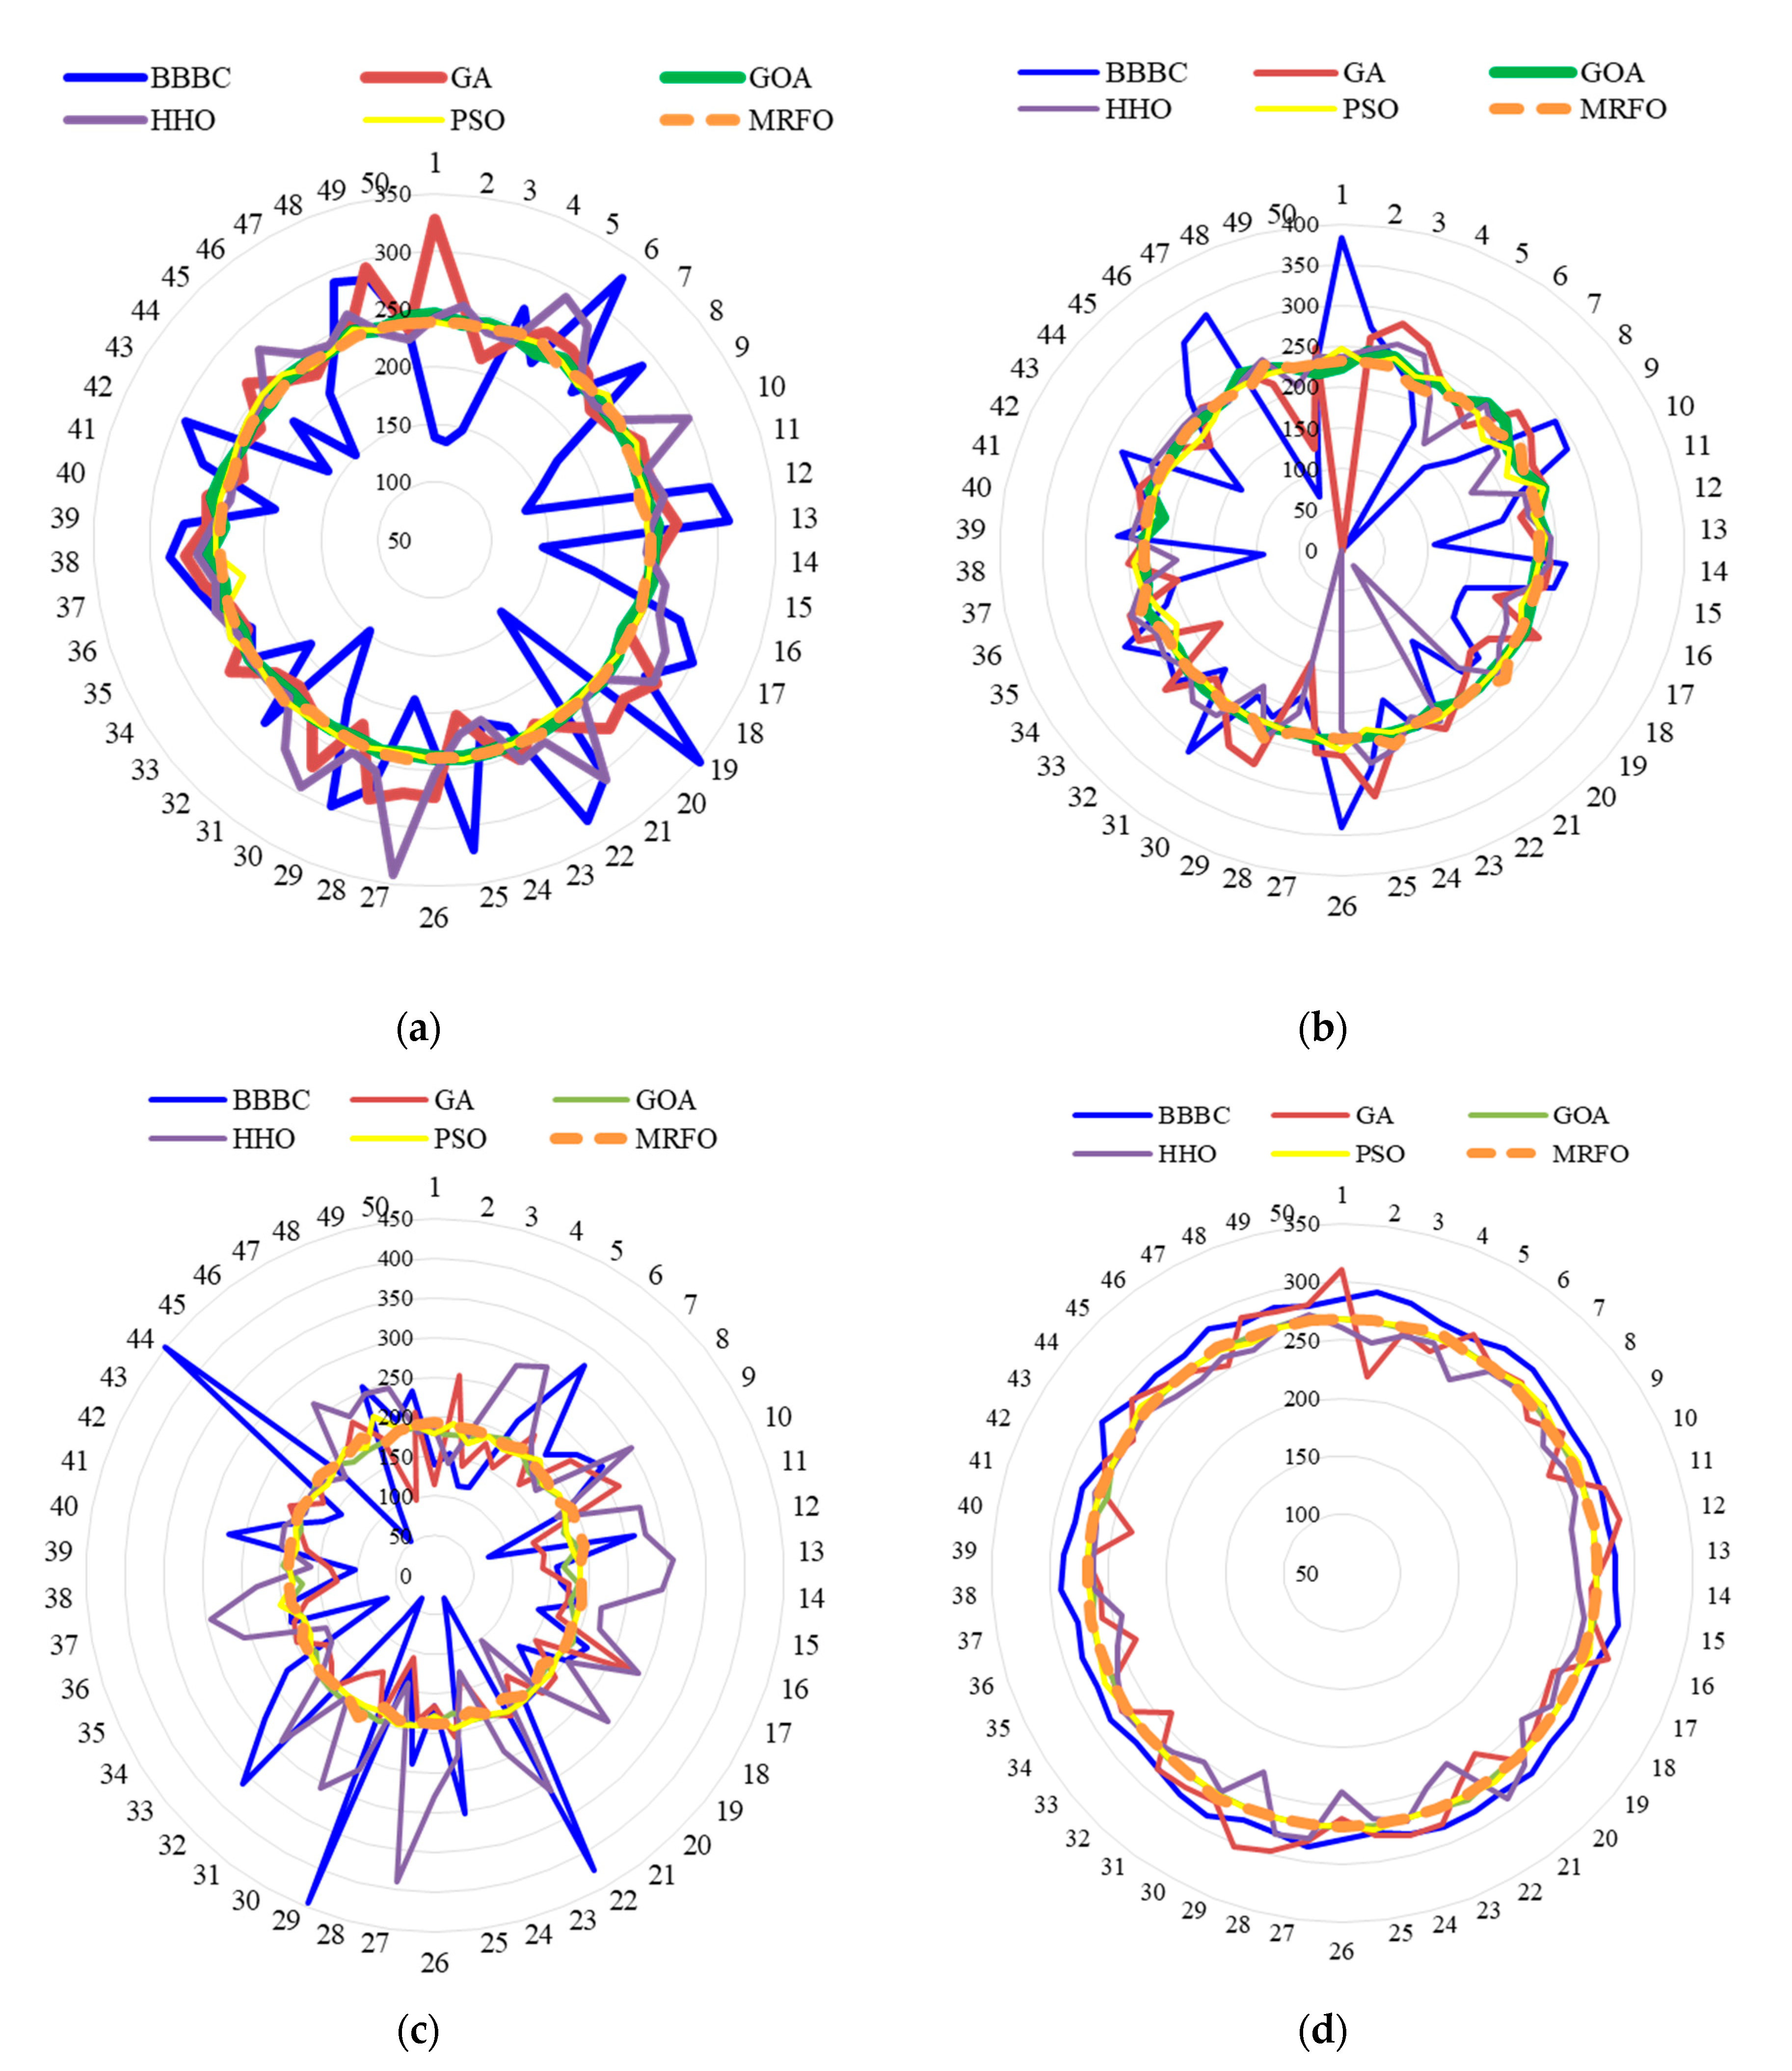
The MRFO was compared with five other soft computing algorithms—PSO, GA, GOA, BBBC, and HHO—for verification purposes.
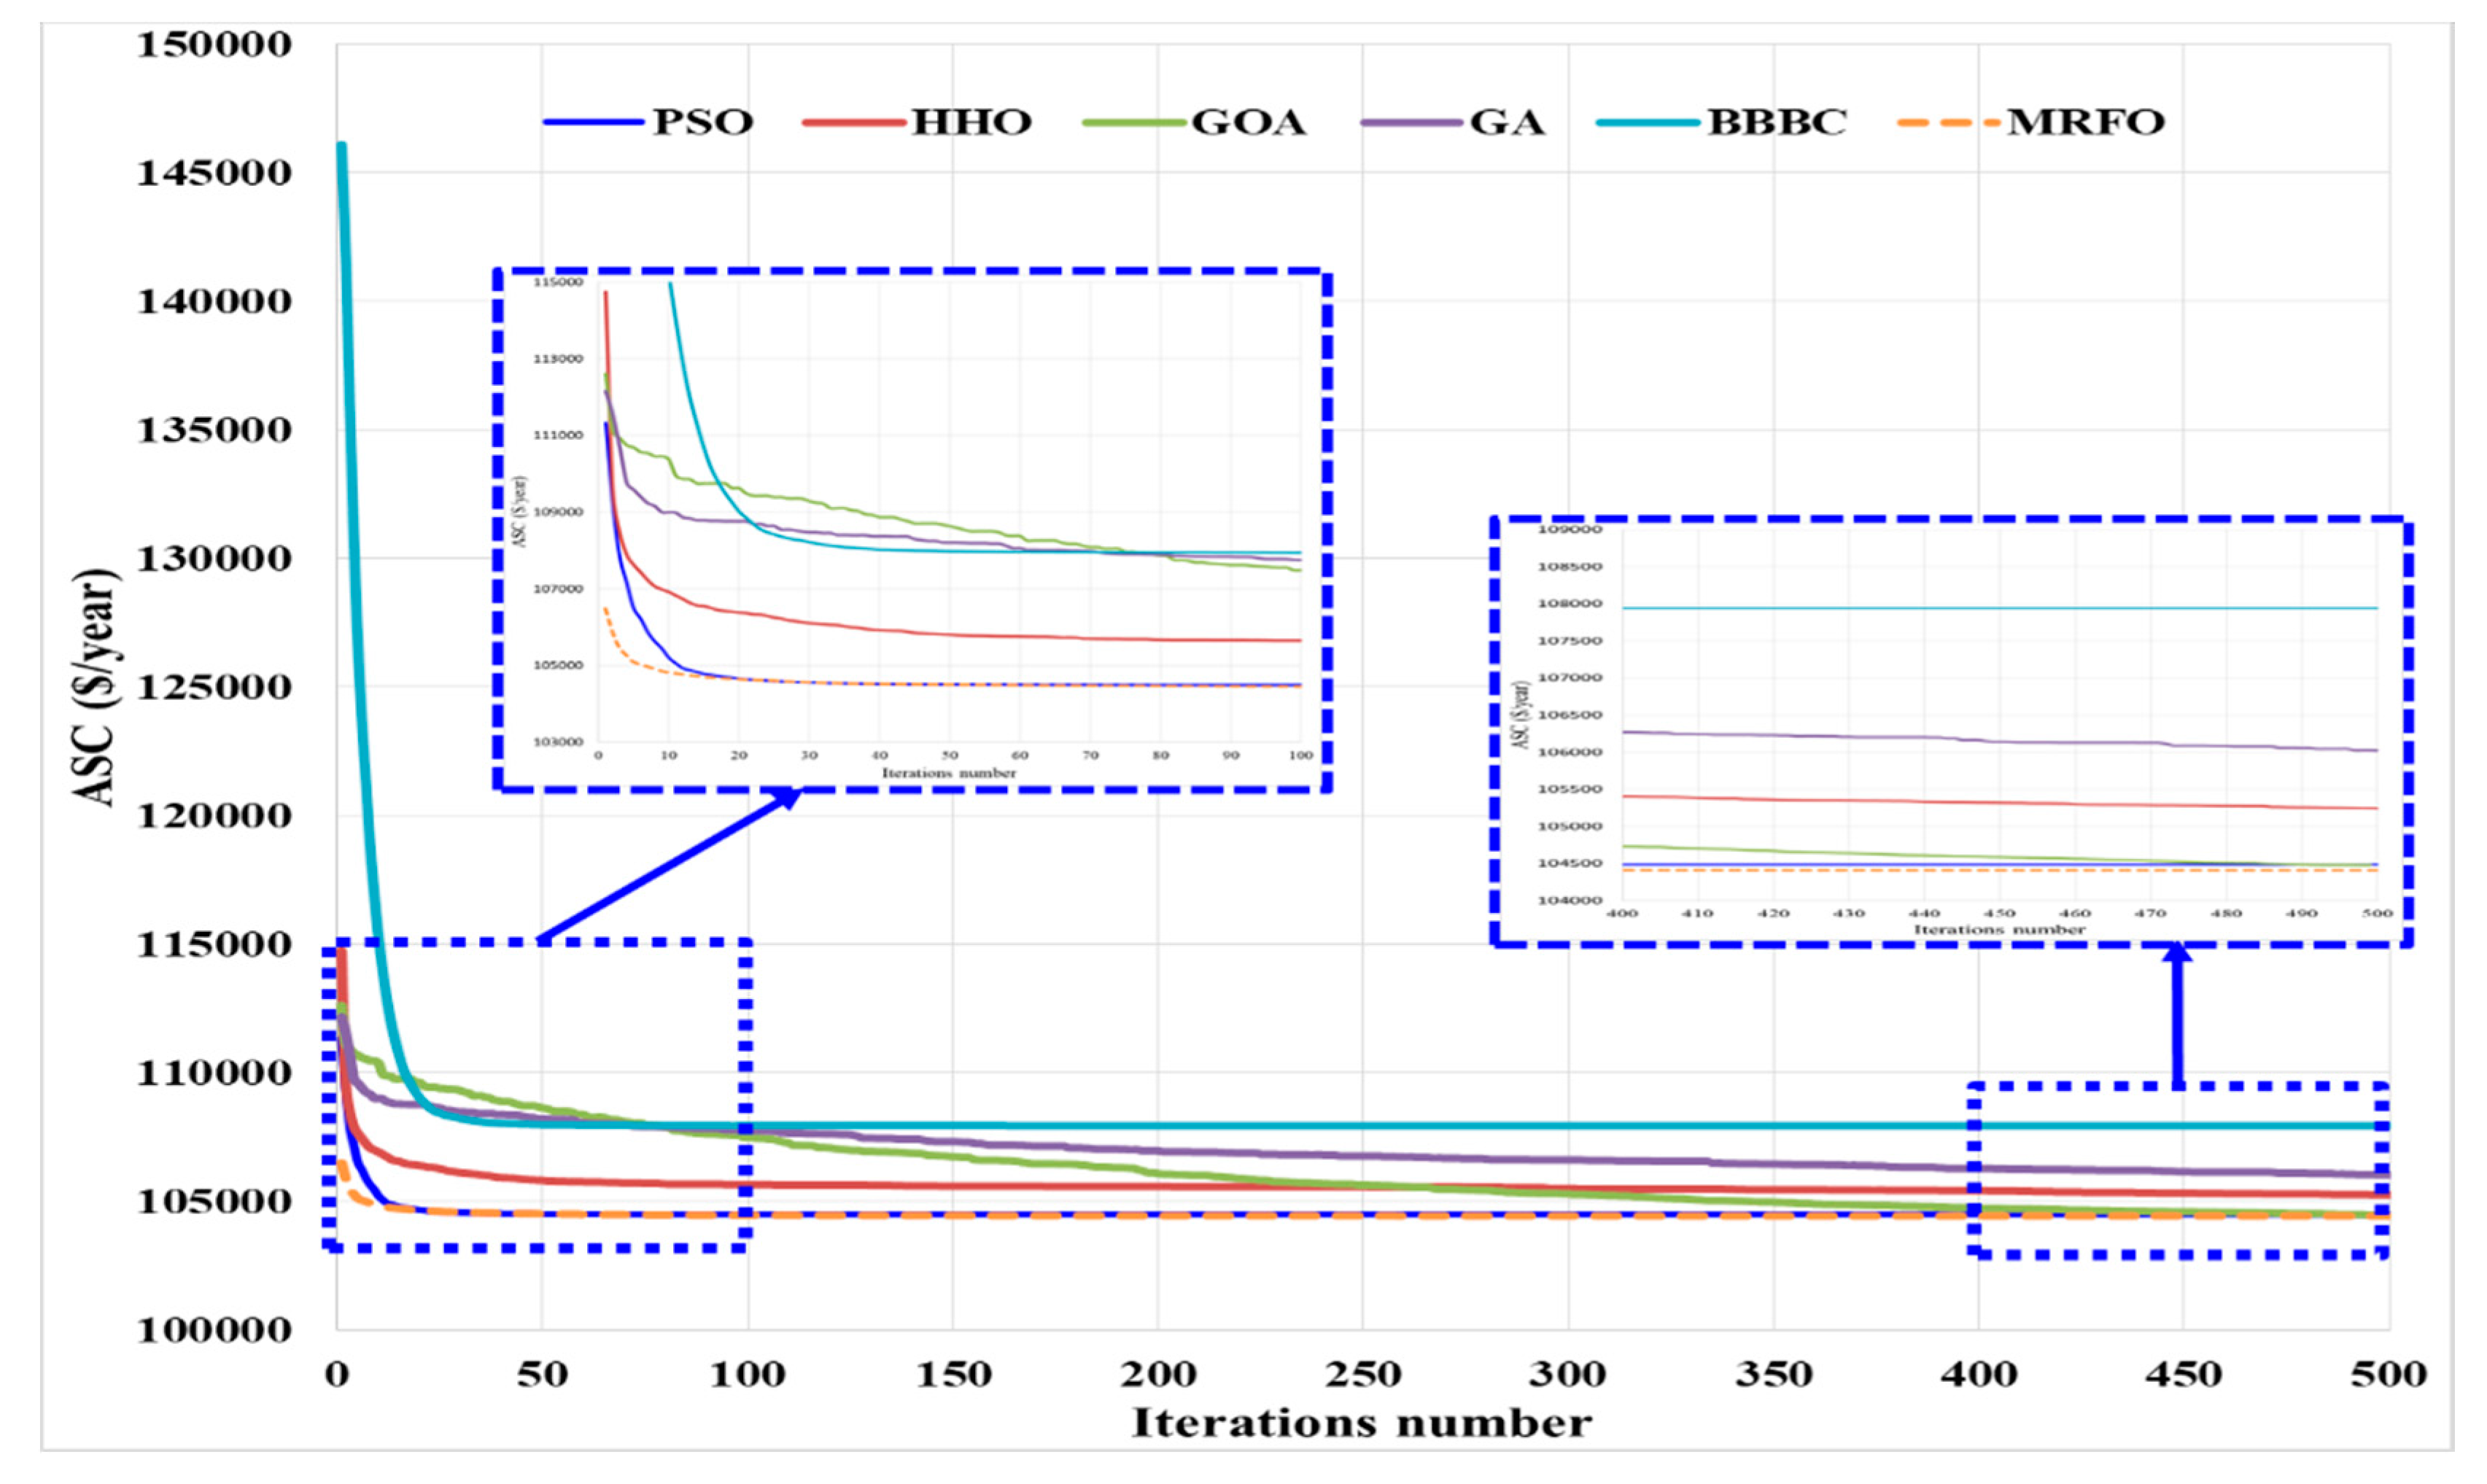
The results showed that the MRFO algorithm converges faster than all other five soft computing algorithms followed by PSO, and GOA, respectively. In addition, MRFO, PSO, and GOA can follow the optimal global solution while the HHO, GA and BBBC may fall into the local solution and take longer time to converge.
These optimization findings confirmed the supremacy of the MRFO algorithm over the other five soft computing techniques in terms of global solution capture and the convergence time.
The rest of this paper is structured as follows: Section 2 introduces the site description and meteorological data; Section 3 presents the proposed configuration of the HES; the problem formulation including the objectives and the proposed MRFO algorithm for HES optimal sizing are introduced in Section 4; Section 5 discusses the simulation findings followed by Section 6, which summarizes the main conclusions.

2. Site Description and Meteorological Data

Figure 1 shows the geographical location of Al Sulaymaniyah village, Arar (30°54′21 N, 41°8′20 E), in northern Saudi Arabia, at an altitude of 1820 ft above sea level. Al Sulaymaniyah village contains some facilities like a small hospital, mosques, schools, a water pump, and some other facilities, as shown in Figure 1. In this village, the electricity demand is already supplied by Diesel generators. The SEC, the sole authority providing power to the nation, has established Diesel generator power plants in rural areas. The climate is continental; the summer is hot and the winter is cold, with sub-zero temperatures. In general, the winds trend from the east or west, and scarcely blow from the south. Over the year, the temperature usually changes in between 0 °C and 45 °C. From May to September represents the warm season, while the cold season is from November to February. The day length changes greatly throughout the year. The shortest day occurs in December with 10 hrs of sunshine and the longest day occurs in June with 14 hrs of sunlight.
The average hourly electrical energy consumption (8760 data points) was measured at Al Sulaymaniyah village. The current power generation system consists of three diesel generators interconnected in parallel to a common bus; each generator has a 456 kW capacity. The power generation system is interconnected to a step-up transformer with a rated capacity of 1250 kVA. Load profiles of Al Sulaymaniyah village are presented in Figure 2. The annual load was 2568 kWh/day and the maximum load demand registered was 285 kW, which occurred on 12 August at 1:00 PM. The minimum load demand registered was 21 kW, which occurred on 9 April and 1 December. The annual load factor for Al Sulaymaniyah region was 0.38 and the average daily load was 179 kW.
The hourly average of wind speed and solar irradiance data for 12 months of the year have been measured by the SEC and are shown in Figure 3 and Figure 4, respectively. Figure 3 presents the monthly average wind speeds at 30 m and 60 m heights in Al Sulaymaniyah. As observed, the monthly wind speed at 30 m and 60 m heights range from 4.356 to 4.809 m/s in November, to 6.064 m/s and 6.695 m/s in April, respectively. Furthermore, the average annual wind speed at 30 m and 60 m heights is 5.329 m/s and 5.884 m/s, respectively. The relationship between the wind speeds at the anemometer height and the hub height can be expressed as
u h = u a ( z h z a ) α
where, H h is the wind turbine hub height, z a is the anemometer height, u h is wind speed at H h , u a is the measured wind speed by the anemometer at z a , and α . is wind shear exponent, which is between 0.05 and 0.5 depending on the surface roughness and atmospheric stability [44]. In this study, α was assumed to be 1/7 in this site.
The monthly mean daily solar radiation for 12 months is plotted and presented in Figure 4. The radiation is high during the summer (from April to Sep.) compared with the other months. The overall average solar irradiance is 6.849 kWh/m2/day. The relationship between the load, solar irradiance, and wind speed can be clarified by calculating the correlation coefficient among their corresponding resources (wind speed and solar irradiance). The correlation coefficient can take values from −1 to +1. A positive value indicates similarity in the data trend, whereas a negative value shows an inverse relationship. The results of the Pearson product moment correlation coefficients calculation were introduced in Table 1. Table 1 emphasized that there is a complementary potential between the solar and wind energy resources in the study region. The high positive solar radiation-load demand correlation coefficient indicates some added value of solar PV in matching the load profile. Wind energy is seen to have a low correlation coefficient with the load demand profile, which is anticipated in warm climates. The observed low correlation coefficient between the solar and wind availability could mean that when they are deployed in tandem, they may not be sufficiently effective without energy storage in meeting load demand.

3. Proposed Configuration of the Hybrid Energy System

The proposed configuration for the hybrid energy system is presented in Figure 5. There are two main energy production units, PV and WTGs, where there is a complementary potential between the solar and wind energy resources in the region under study. As discussed in Section 2, the observed low correlation coefficient between the solar and wind availability could mean that when they are deployed in tandem, they may not be sufficiently effective without energy storage like battery banks in meeting load demand. The WTGs and diesel generator are interconnected to the AC bus bar, whereas the PV arrays and battery banks are interconnected to the DC bus bar. The bidirectional DC/AC converter is employed as an inverter to convert DC to AC power and as a rectification bridge to convert AC to DC power. The battery banks are utilized to feed the power when renewable generation sources cannot satisfy the load completely. Diesel generators represent the second spare source and deliver power when neither WTGs nor PV arrays can provide output power nor do the batteries have stored energy. The optimization trend aims to minimize the net present cost (NPC) of the proposed HES. The NPC is the total present value of a cash flow and contains an investment, operation and maintenance (O&M), replacement, and fuel cost. The NPC of the HES can be estimated by (2), in which i and Y p r o j . denote the interest rate and project life span, respectively:
N P C = A S C ( 1 + i ) Y p r o j 1 i ( 1 + i ) Y p r o j
The ASC represents the total annualized system cost and is equal to the annualized costs summation of each HES component. The annualized cost of each component is, in turn, equal to its annualized capital costs ( C a c a p ), in addition to the O&M cost ( C a m a i n ) and annualized replacement costs ( C a r e p ), as denoted in (3):
A S C = C a c a p + C a r e p + C a m a i n
The capital cost can be formulated as below:
C a c a p = ( C r e n w a b l e + C B a t t + C D G ) i ( 1 + i ) Y p r o j ( 1 + i ) Y p r o j 1
where C r e n e w a b l e ,    C B a t t , and C D G are the capital costs related to the renewables (PV and WTG), batteries, and diesel generator, respectively.
The annualized replacement cost can be calculated as follows:
C a r e p = C r e p i ( 1 + i ) Y r e p 1
where C r e p is the capital replacement cost and Y r e p is the component lifetime.
The technical and economic parameters of all HES components are required to assess the performance of the proposed HES which are listed in Table 2 [45].

3.1. PV Array Modeling

The output power generated from the PV array relies on the solar irradiance, temperature, and manufacturer’s data of the PV arrays [46]:
P P V = P r f P V ( G T ¯ G T , S T C ¯ ) ( 1 + α P ( T c T c , S T C ) )
where P r is the PV rated power; G T , S T C ¯ and G T ¯ are the global solar irradiance under standard test conditions (STCs) and normal conditions, respectively; T c , S T C and T c are the PV temperatures under STCs and normal conditions, respectively; f P V and α P are the de-rating coefficient and power temperature coefficient, respectively. The steady state temperature of the PV is expressed as follows [46]:
T c = T a + ( N O C T T a , N O C T ) ( 1 1.11 η M P P ( 1 α P T c , S T C ) ) ( G T ¯ G T , N O C T ) 1 + 1.11 ( α P η M P P , S T C ) ( N O C T T a , N O C T ) ( G T ¯ G T , N O C T )
where T a and N O C T are the ambient and nominal operating cell temperature, respectively. T a , N O C T and G T , N O C T are the ambient temperature and solar irradiance under NOCT, respectively. η M P P , S T C and η M P P are the maximum power point (MPP) efficiency under STCs, and the MPP efficiency of the PV module, respectively.

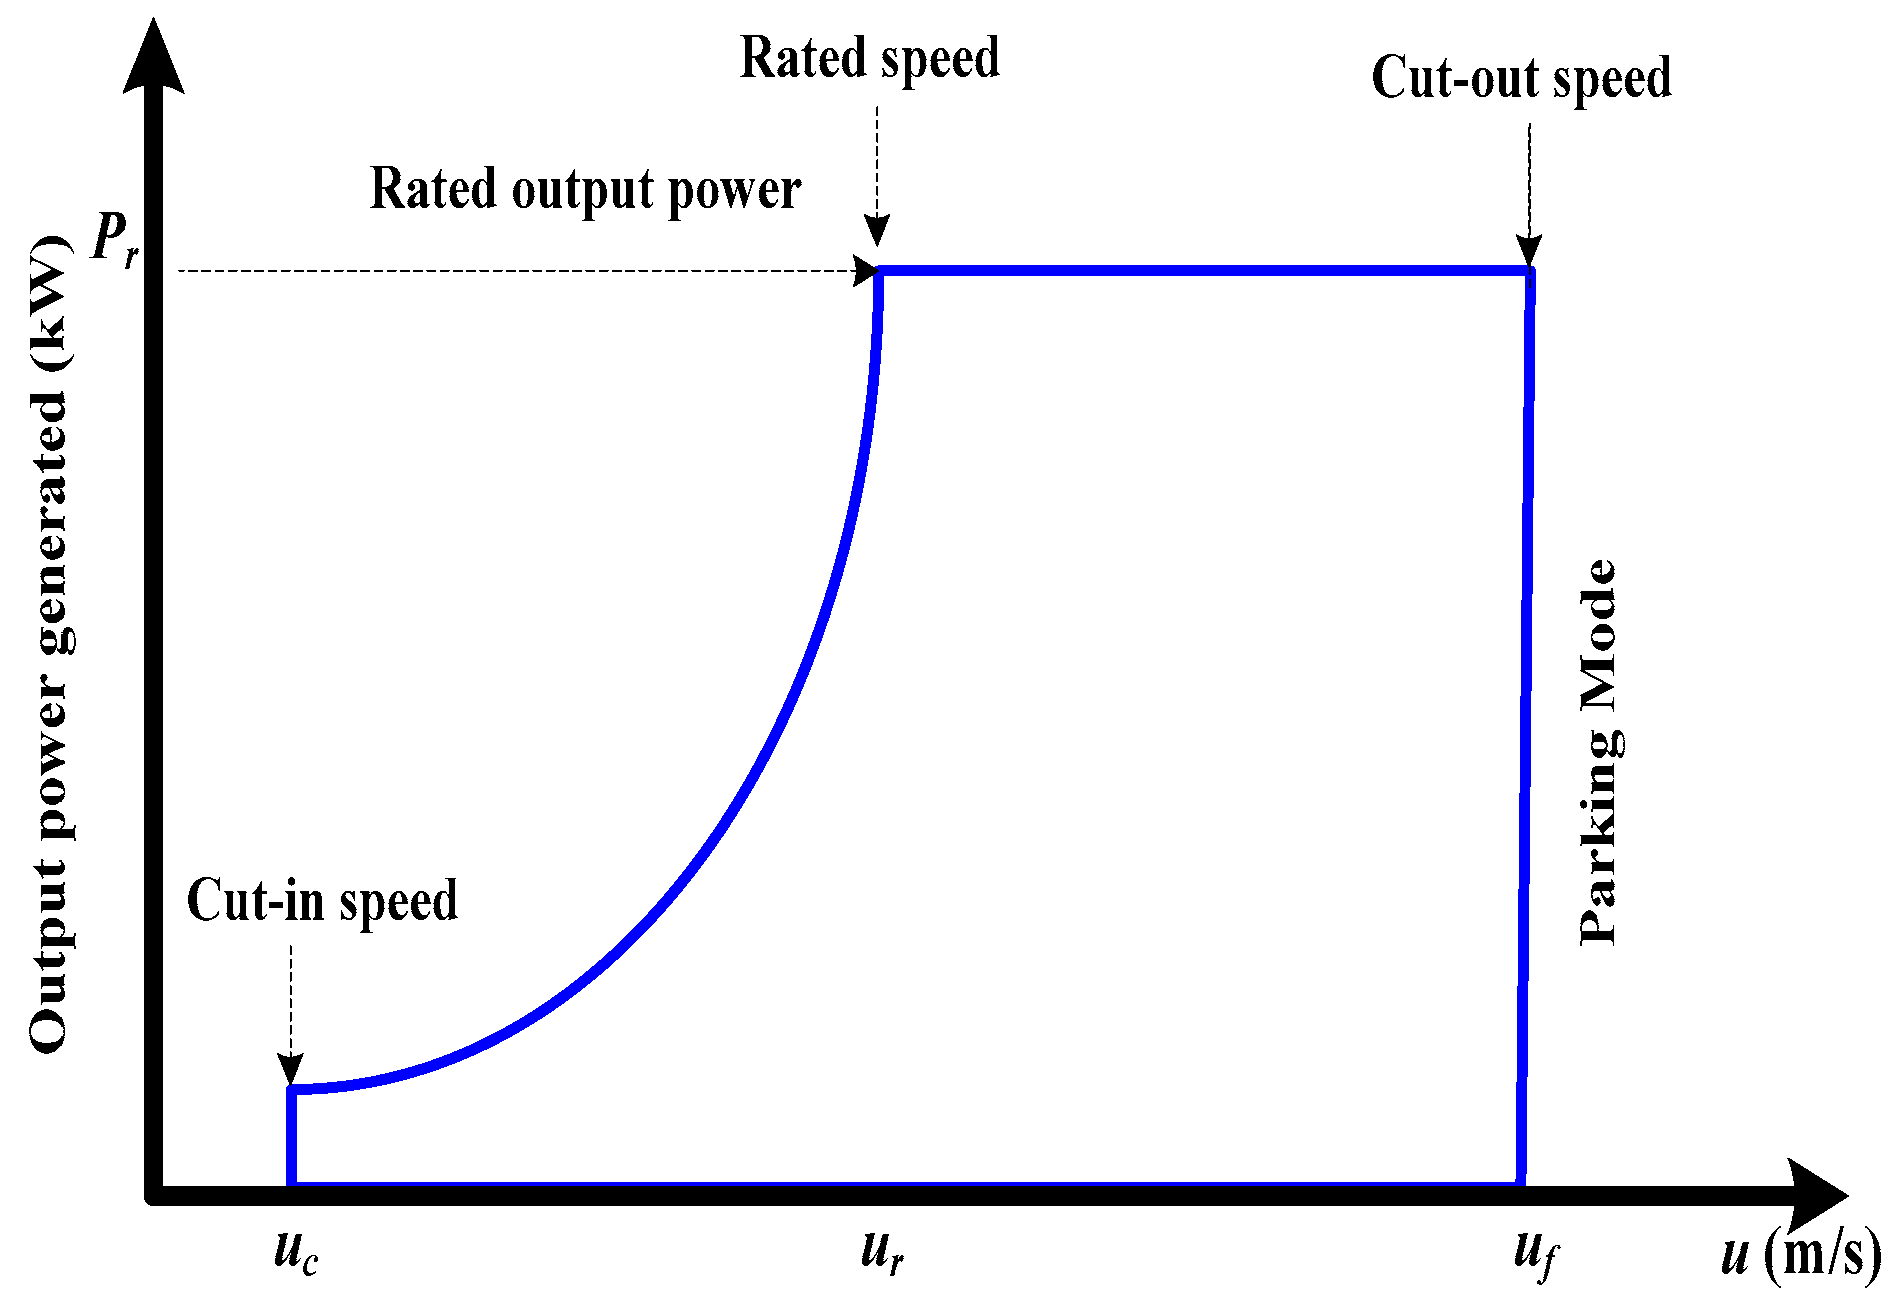
3.2. Wind Turbine Generator Modeling

The power generated by the WTGs is expressed as follows [47]:
P W T G ( u ) = P r ×   { 0 u < u c   o r   u > u f u 2 u c 2 u r 2 u c 2 u c u u f 1 u r u u f
where P r is the rated power of the WTG, u c is the cut-in speed, u r is the rated speed and u f is the cut-out speed. The above equation reveals that the output power generated by the WTG depends on four parameters; P r , u c , u r , and u f . Figure 6 shows typical a WTG power curve based on a quadratic model.

3.3. Battery Bank Modeling

The battery bank represents an essential component in the renewable energy generation systems because of the irregular output power captured from the renewable sources. The power flow through the battery bank at any time is determined by the load demand level at that time and total RER, which is estimated as follows [48]:
S O C ( t ) = S O C ( t 1 ) ( 1 σ ) + ( E G A ( t ) E L ( t ) η i n v ) η b a t t e r y .
where σ is the self-discharging rate; E L ( t ) is the total load demand; E G A ( t ) is the total output power; η i n v is het inverter efficiency and η b a t t e r y is the round trip efficiency of the battery that ranges from 0.5 to 0.95. A positive value of the second term of Equation (9) refers to the charging operation of the battery while a negative value corresponds to the discharging operation of the battery. The State of Charge (SOC) must be greater than or equal to the minimum permissible level ( S O C m i n ). During a charging mode, the SOC cannot be increased greater than the max. allowable level ( S O C m a x ). These states can be formulated as shown below:
S O C ( t ) = S O C m i n S O C ( t ) < S O C m i n S O C ( t ) S O C m i n < S O C ( t ) < S O C m a x S O C m a x S O C ( t ) > S O C m a x

3.4. Diesel Generator Modeling

A diesel generator represents the secondary spare source that covers the load demand if the renewables’ output power and the batteries are not sufficient to meet the load demand. The annual fuel cost and fuel consumption are calculated as shown below [49]:
C D s l = C F t = 1 8760 A × P D s l ( t ) + B × P R
where, C F is fuel cost per liter; A and B are fuel constants; P R and P D s l ( t ) are the nominal power and output generated power of the diesel generator, respectively [49]. The above equation shows that the diesel generator fuel consumption relies on both the nominal and output power. The diesel generator manufacturer determines and recommends the minimum level. Consequently, the diesel generator output power has to be in the range between the nominal power and the preset minimum level.

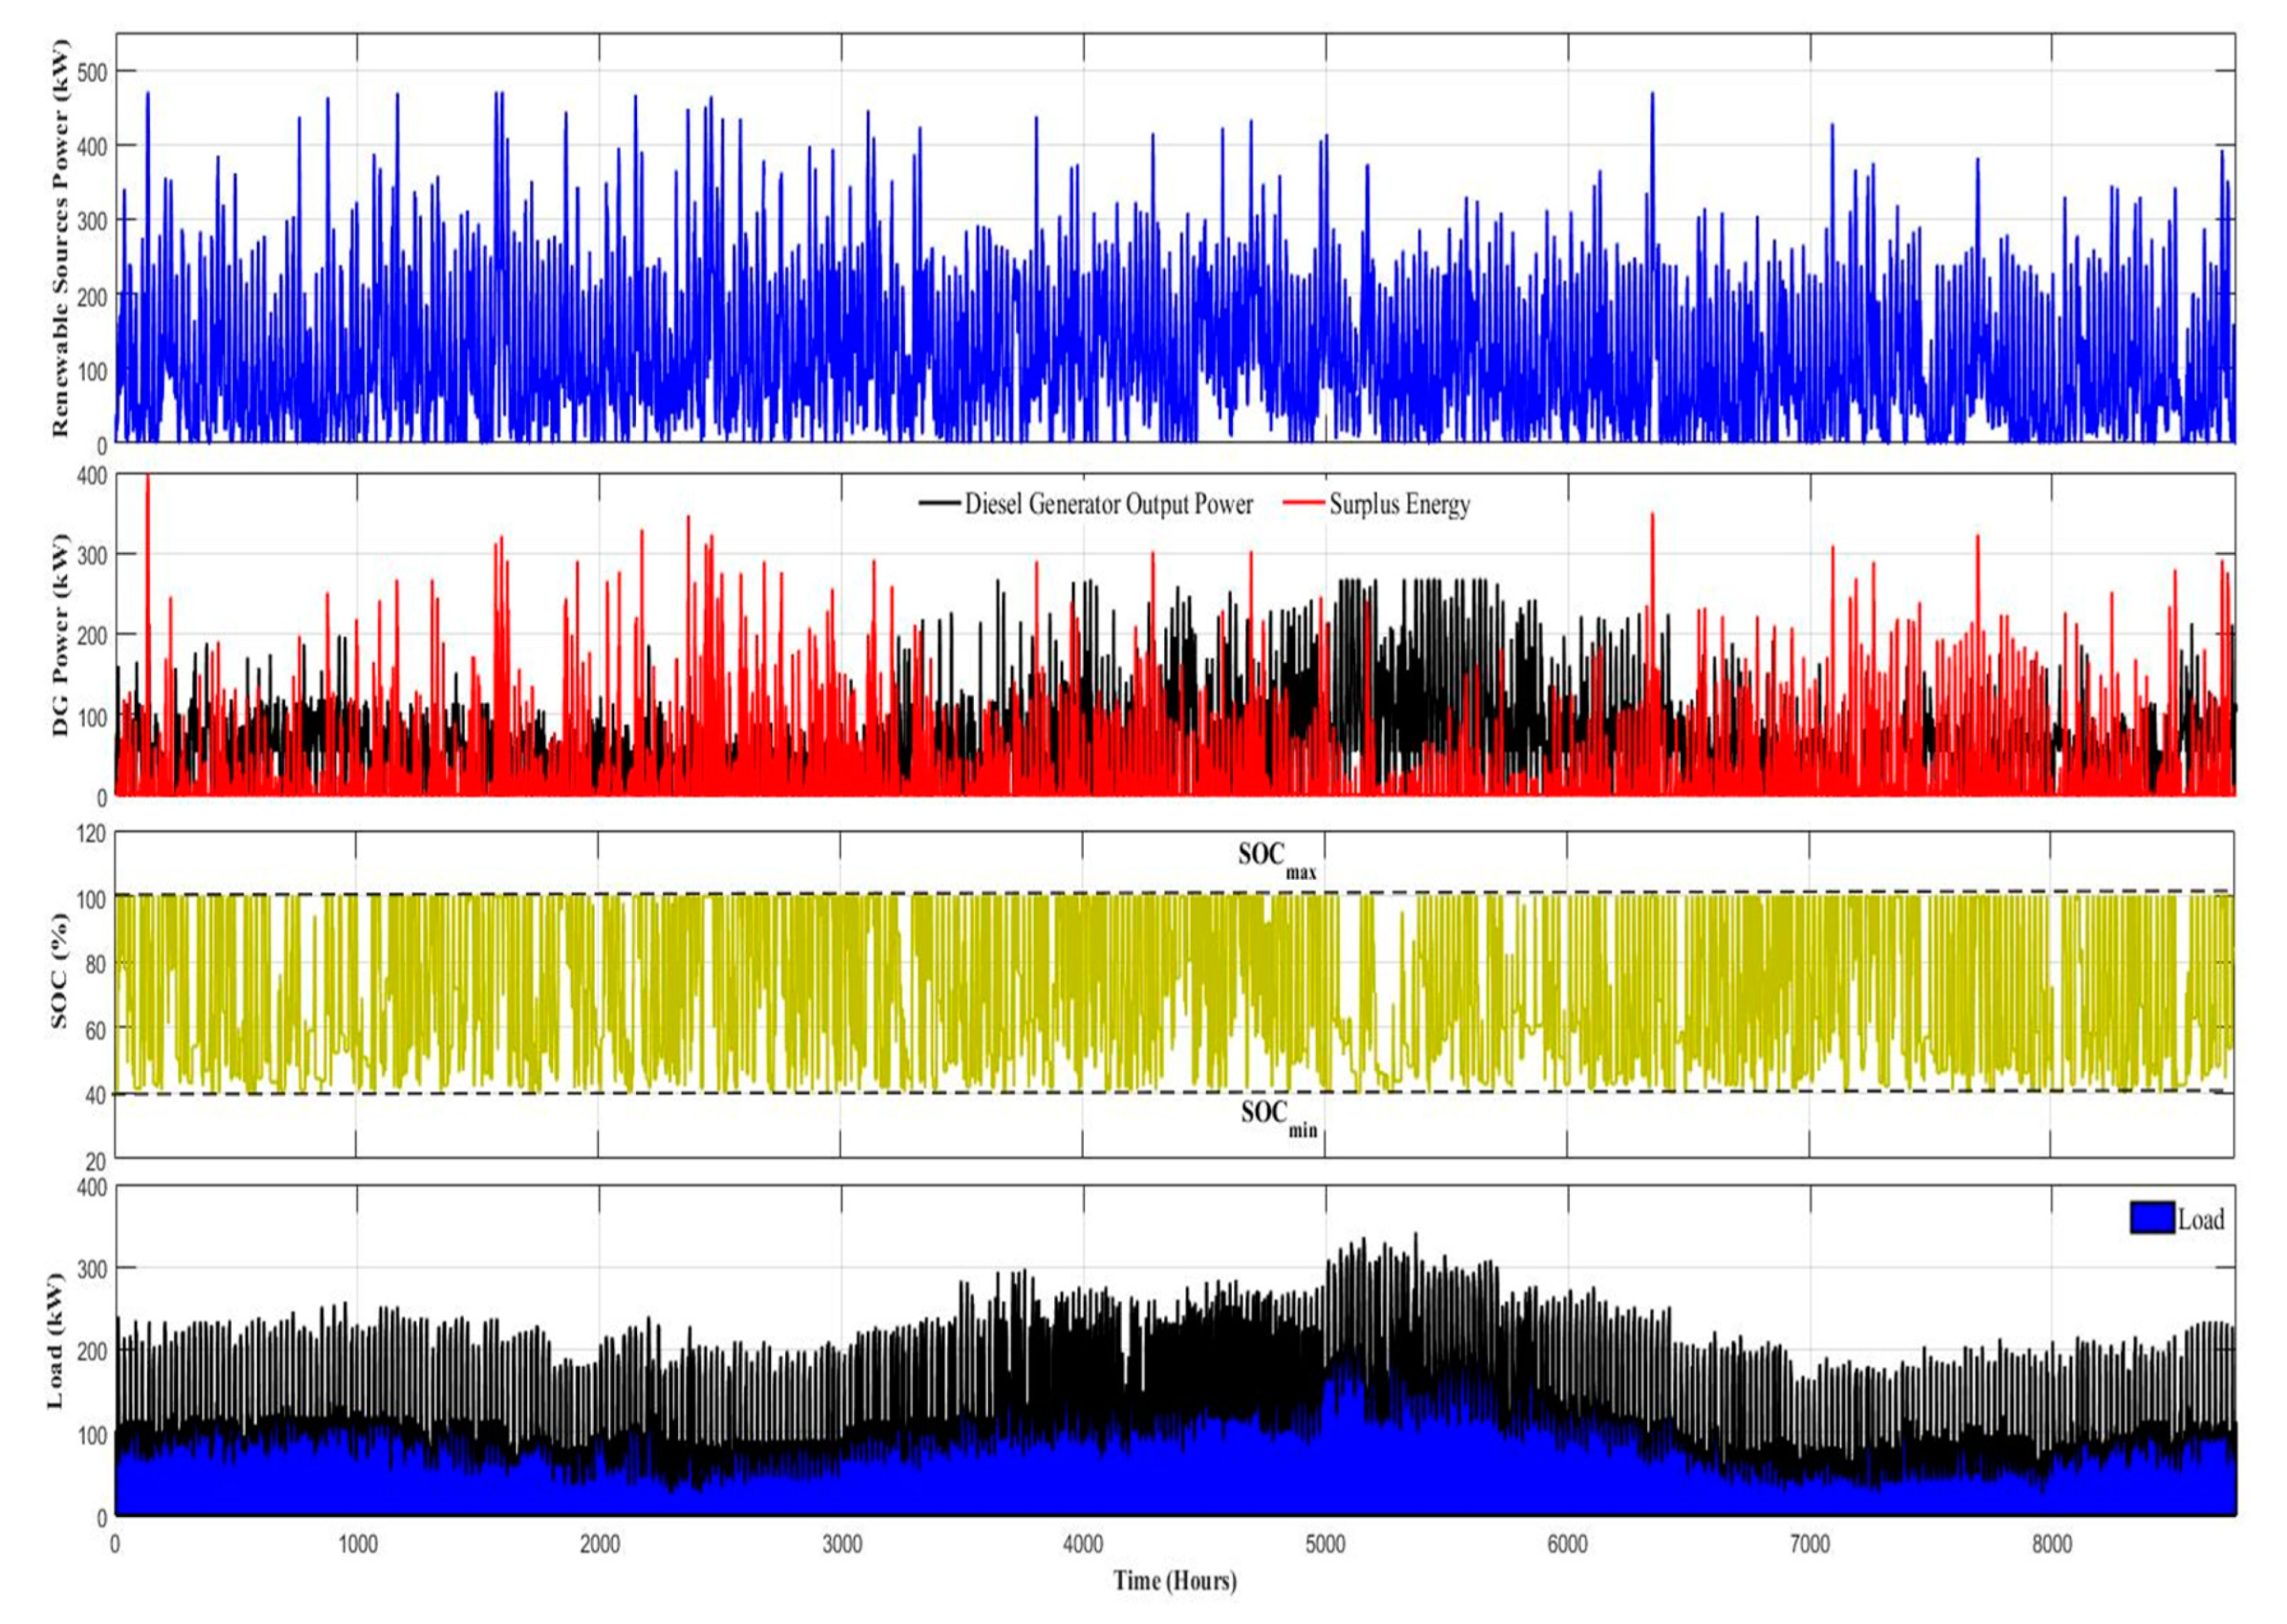
3.5. Operation Strategy of the HES

The proposed HES is operated under the guidance of the following cases:
Case#1: In case of a demand lower than the renewables’ output power, the excess power is utilized for charging the battery via the battery charger controller. Once the battery reaches its rated capacity, the surplus power is dumped.
Case#2: In case of a demand higher than the renewables’ output power, the load not supplied is covered through the battery if its capacity is greater than minimum level.
Case#3: In case of a demand higher than the renewables output power generated and the battery charge is at the minimum level, the diesel generator will operate to supply the demand as below:
  • In the case of load deficiency lower than the minimum allowable power of the diesel generator, the diesel generator will operate at its minimum allowable level, and the surplus power is dumped.
  • In the case of the load not supplied higher than the minimum allowable level and less than the diesel generator nominal power, the load not supplied is covered through the diesel generator. Whereas in the case of the load not supplied higher than the diesel generator nominal power, the diesel generator will operate at the nominal power, and the power not supplied is covered through the battery if the stored capacity is appropriate.

4. Problem Statement

The objective of the HES design problem is to minimize the NPC at a particular level of reliability taken as LPSP in this case. The cost of all system components including investment, replacement, and the yearly O&M cost will be mapped to a present value once the project installation stage starts:
M i n   N P C , s u b j e c t   t o : { L P S P L P S P d e s i r e d R E F R E F d e s i r e d 0 P P V P P V , m a x 0 P W T P W T G , m a x 0 P B a t t P B a t t , m a x 0 P D s l P D s l , m a x
In the minimum NPC value case, decision parameters, the optimal rated power of the PV, WTG, and power rating of the diesel generator in addition to the battery storage capacity are optimally determined:
x = [ P P V ,   P W T G , P D s l , P B a t t ]
where L P S P d e s i r e d and R E F d e s i r e d are the user-specified level of REF and reliability, respectively. P P V , P W T G , and P D s l are the PV-rated power, WTG, and diesel generator (in kW), respectively. P B a t t is the battery bank capacity (in kWh). P P V , m a x , P W T G , m a x , P B a t t , m a x , and P D s l , m a x are the maximum rating of the PV, WTGs, batteries, and diesel generator.

4.1. LPSP-Based Reliability Model

The LPSP is one of the main effective reliability parameters for the HES design. LPSP is defined as the overall probability that the available power supply of the HES is exceeded by the system load level. The LPSP can be expressed as shown below [36]:
L P S P = t = 0 T P o w e r   F a i l u r e   T i m e   ( P F T ) T
Power failure time (PFT) represents the time interval within which a load demand is not met. Zero LPSP indicates that the load will be always supplied and an LPSP value of 1 indicates that the load will never be supplied.

4.2. Renewable Energy Fraction

The renewable energy fraction (REF) represents the total primary energy from renewables that is provided to the load demand which can be expressed as shown below [46]:
R E F = ( 1 E L , D s l E L , s e r v e d ) × 100
where E L , D s l is the total load demand covered by the diesel generator. An unpolluted HES corresponds to 100% of an REF, whereas a pure diesel generator system corresponds to 0% of an REF. The values between 0% and 100% correspond to the hybrid energy system.

4.3. Application of MRFO in HES Sizing Problem

The manta ray foraging optimization (MRFO) is one of the meta-heuristic optimization techniques developed by W. Zhao in 2020. It was developed based on the interesting behaviors of manta rays. The manta ray has a flat top to bottom body and a pair of pectoral fins, with which it elegantly swims as birds and flies freely. They also have a pair of vertical lobes that prolong in front of their giant terminal mouths. Figure 7 illustrates the anatomy of the manta eat. Manta rays eat much plankton every day. The most interesting thing about manta rays is their foraging behaviors, and they may travel individually or in groups of up to 50 but foraging in groups is often noticed. These creatures have developed three wonderful and clever foraging strategies, including chain foraging, cyclone foraging, and somersault foraging. Figure 8 presents the sketch of foraging behaviors in MRFO and mathematically describes it as below. A novel MRFO was implemented in this paper for the first time to attain the optimal sizing of a standalone HESs—described in Section 3—based on minimizing the annualized system cost (ASC) and enhancing the system reliability. The pseudo code of the MRFO has been summarized in Algorithm 1.
Algorithm 1 Pseudo code of the manta ray foraging optimization (MRFO) algorithm for the optimal sizing of an autonomous HES.
1: Initialize the somersault factor S , dimension d , population of manta rays N and the maximum iteration T m a x
2: Initialize the x m a x d and x m i n d
3: Initialize the x b e s t d such that the objective function f ( x b e s t d ) is as close to as possible.
4: for each individual i do
5:   for each dimension d do
6:      Initialize the x i d randomly
7:       x b e s t d = x i d
8:   end for
9:    Compute the objective function f ( x i d )
10:    if f ( x i d ) < f ( x b e s t d ) then
11:      for each dimension d do
12:         x b e s t d = x i d
13:      end for
14:    end if
15: end for
16: Iteration t = 1
17: while t T m a x . do
18:     C o e f = t / T m a x
19:    for each individual i do
20:       for each dimension d do
21:          if r a n d < 0.5 then
22:           Compute α and β . using (17)
23:             if C o e f > r a n d then
24:               Update the individual positions using (18)
25:             else
26:               Update the individual positions using (20)
27:           end if
28:          else
29:           Update the individual positions using (16)
30:          end if
31:       end for
32:       Compute the objective function f ( x i d )
33:       if f ( x i d ) < f ( x b e s t d ) then
34:         for each dimension d do
35:            x b e s t d = x i d
36:         end for
37:       end if
38:    end for
39:  for each individual i do
40:     for each dimension d do
41:        Update the individual positions using (21)
42:        Compute the objective function f ( x i d )
43:        if f ( x i d ) < f ( x b e s t d ) then
44:           x b e s t d = x i d
45:        end if
46:     end if
47:     t = t + 1
48: end while
49: Output the best solution found.

4.3.1. Chain Foraging

In the chain foraging, manta rays line up head-to-tail and form a chain. Manta rays accept the first step towards not only the food but also the one in front of it. The mathematical expression of chain foraging can be expressed as shown below@
x i d ( t + 1 ) = { x i d ( t ) + ( r + α ) ( x b e s t d ( t ) x i d ( t ) )   i = 1 x i d ( t ) + r ( x i 1 d ( t ) x i d ( t ) ) + α ( x b e s t d ( t ) x i d ( t ) )   i = 2 ,   3 , N
α = 2 r | log r |
where x i d is position of the ith individual in the dth dimension, r is a random vector which ranges in between [0, 1], α is a weight coefficient, and x b e s t d is the high concentrated plankton.

4.3.2. Cyclone Foraging

The manta rays start to swim towards the food in a long foraging cyclone chain when they see a spot of plankton in deep water. The individual does not only keep track of the one in front but only moves towards the food through a spiral path. The mathematical model of the spiral path of manta rays can be expressed as below:
x i d ( t + 1 ) = { x b e s t d + ( r + β ) ( x b e s t d ( t ) x i d ( t ) ) i = 1 x b e s t d + r ( x i 1 d ( t ) x i d ( t ) ) + β ( x b e s t d ( t ) x i d ( t ) ) i = 2 ,   3 , N
β = 2 e r 1 T t + 1 T sin 2 π r 1
where β is the weight coefficient, T is the maximum iterations number, and r1 is the random number in [0, 1].
Each individual is charged with finding a new position far from the current best one by assigning a new position randomly inside the search area as a reference. This technique focuses mainly on the exploration and makes the MRFO to attain an inclusive global search. The mathematical expression can be shown below:
x i d ( t + 1 ) = { x r a n d d ( t ) + ( r + β ) ( x r a n d d ( t ) x i d ( t ) ) i = 1 x r a n d d ( t ) + r ( x i 1 d ( t ) x i d ( t ) ) + β ( x r a n d d ( t ) x i d ( t ) ) i = 2 ,   3 , N
where x r a n d d is a random position produced in the search area.

4.3.3. Somersault Foraging

In this mechanism, the food position is seen as a pivot. Hence, each individual swims around the pivot and somersaults to a new position and the manta rays update their positions around the best position determined. The mathematical equation can be expressed as shown below:
x i d ( t + 1 ) = x i d ( t ) + S ( r 2 × x b e s t d r 3 × x i d ( t ) )
where S is the somersault factor of manta rays, and r 2 and r 3 are two random numbers in [0, 1].
In this study, the implementation of the MRFO in solving the HES design optimization problem includes these steps below:
(i).
Prepare (a) global solar radiation, wind speed, and load profile; (b) nominal parameters and economic details of the HES components; and (c) the manta ray population, weight coefficient in chain foraging, weight coefficient in cyclone foraging, somersault factor, dimension of the problem, and maximum number of iteration.
(ii).
Generate manta ray population through x r a n d d = [ P P V ,   P W T , P D G , P B a t t ] , randomly within the boundaries range using Equation (22):
x r a n d d = x m i n d + r a n d ( x m a x d x m i n d )
where x r a n d d is the manta ray location produced randomly in the search region, and x m a x d and x m i n d represent the lower and upper positions of the dth dimension, respectively.
(iii).
Perform the following steps:
-
Compute P P V and P W T by using Equations (6) and (8).
-
Power management as given in Section 3.5.
-
Compute S O C and P D G by using Equations (9) and (11) and obtain the corresponding values of L P S P and R E F using Equations (14) and (15), respectively.
-
Find the best solution, x b e s t d , based on objective function expressed in Equation (2).
(iv).
Update the location of each manta ray using the chain foraging strategy and cyclone foraging strategy as defined in Equations (16), (18), and (20).
(v).
Compute the objective function values for each manta ray by following the procedure mentioned in Step (iii) and update the best location found until this point.
(vi).
Update the location of each manta ray by using the somersault foraging strategy as defined in Equation (21).
(vii).
Repeat Steps (iii) to (vi) until the termination criterion is fulfilled.

5. Simulation Results and Discussion

The MRFO algorithm was proposed for the optimal design of the hybrid energy system in order to supply an isolated area in northern Saudi Arabia. The hourly averages of the wind speed and solar irradiance were utilized in the proposed MRFO algorithm. Four performance indicators; mean, standard deviation (STD), optimal solution, and worst solution were employed to evaluate the performance of all six soft computing techniques. The hybrid energy system addressed in this research typically consists of PV arrays, WTGs, batteries, and diesel generators.
To verify the performance of the MRFO, a detailed comparison was carried out with five modern soft computing-based optimization algorithms (GA, PSO, GOA, BBBC, and HHO) in order to attain the optimal size of the HES. The main parameters of all soft computing-based algorithms, used in this research, are provided in Table 3. Maximum iteration number and independent runs number were selected to be 500 and 50 for all the soft computing algorithms under test. All of the soft computing-based algorithms were implemented and executed in Matlab R2019b/Windows 10/64-bit.
Table 4 presents simulation findings of the MRFO algorithm in comparison with the other five intelligent soft computing algorithms for the optimal design of the HES with a 0% of LPSP. This HES includes PV, WTG, battery bank, and diesel generator. The main observations are summarized as follows:
The soft computing algorithms: MRFO, PSO, and GOA succeeded in following the optimal global solution, whereas HHO, GA, and BBBC failed to reach the optimal solution. As shown in Table 4, the MRFO performed well, where it attained the optimum sizing of the HES with the lowest ASC and highest REF% compared to other five intelligent algorithms.
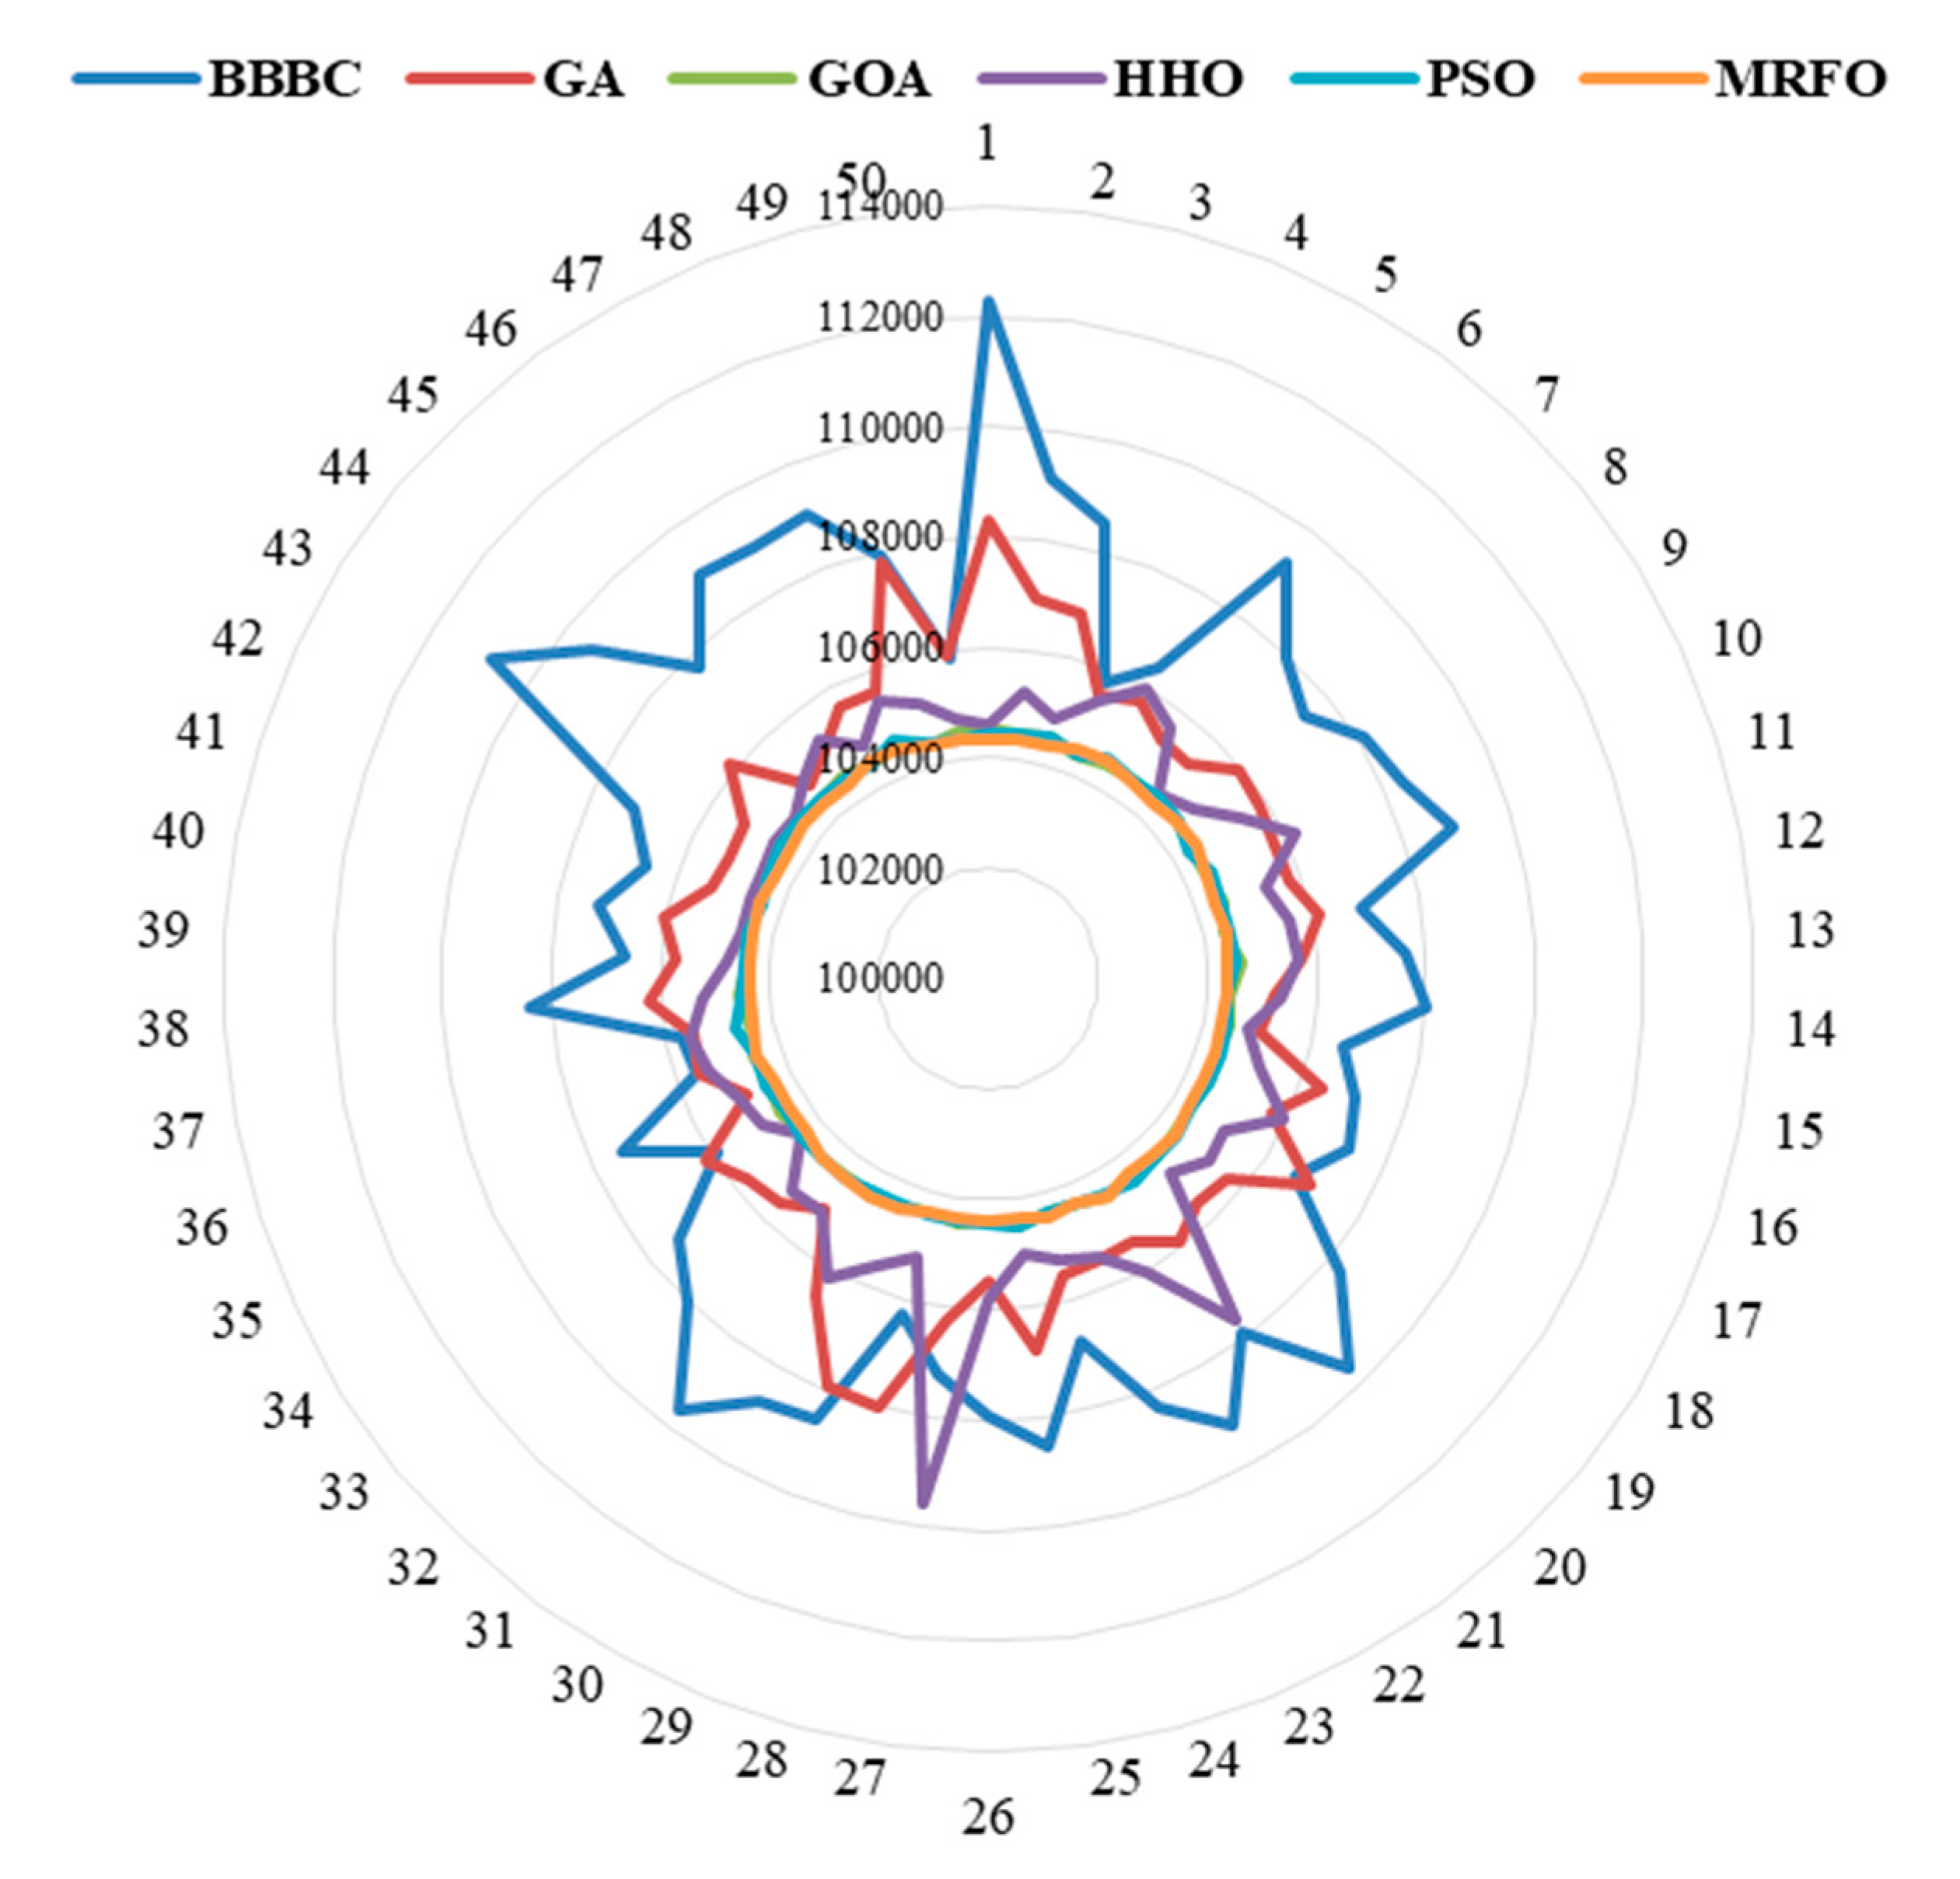
The soft computing-based algorithms: MRFO, GOA, and PSO attained the smallest STD for the HES including PV, WTG, battery, and diesel generator. This insists on the robustness and promising performance of the MRFO technique.
Figure 9 presents the convergence rate of the six computational intelligence-based algorithms; MRFO, GOA, PSO, HHO, GA, and BBBC. This figure shows that although the three algorithms; MRFO, PSO, and GOA, can follow the optimal global solution, MRFO converges faster than all other algorithms followed by PSO and GOA. On the other hand, this figure proves that HHO, GA and BBBC may fall into the local solution and take a longer time to converge. Therefore, the MRFO technique has the best performance in comparison to the other five soft computing techniques in terms of global solution capture and the convergence time.
Figure 10 shows the ASC vs. the number of runs for the MRFO algorithm compared to the other five soft computing algorithms. This figure reveals that MRFO achieved the optimum sizing of the HES with the lowest ASC followed by GOA and PSO. Whilst HHO, GA, and BBBC had clear oscillations and failed to achieve the optimal solution as shown in Figure 10, on the other hand, Figure 11 shows the optimal capacity vs. the runs number for PV, WTG, battery bank, and diesel generator using MRFO in comparison with the other five soft computing techniques. This figure reveals the stable performance of the MRFO technique followed by the GOA and PSO in comparison with the other three techniques.
As shown in Figure 12, the optimal HES exhibits the best renewable energy fraction (REF) percent using the MRFO technique compared to the other five soft computing-based algorithms. On the other hand, Figure 13 proves the superiority of the MRFO compared to the other five algorithms in terms of the surplus energy percent. Figure 14 shows the annual renewable resources output power generated, diesel generated power, the load demand, and the SOC % of the batteries, for the optimal solution captured, in the case of 0% LPSP. Finally, the ASC breakdown (capital, fuel, replacement, and O&M) determined by the MRFO of different system components that constitute the optimal design of the HES are shown in Figure 15. This figure reveals that the diesel generator fuel cost and O&M have the highest percentage. The annualized capital cost of the hybrid energy system is USD 43,935.4/year (USD 16,505.5/year for PV and WTG) with a total cost of USD 878,708. The cost of the energy of the optimal HES is USD 0.092882/kWh.

6. Conclusions

An optimal sizing of a hybrid energy system comprising of PV, WTGs, battery bank, and the diesel generator was achieved based on a novel proposed soft computing/metaheuristic algorithm named MRFO. This optimization problem was solved using the MRFO in order to supply the load demand of a rural village in northern Saudi Arabia. The hourly mean wind speed and solar irradiance and load over a year are utilized for optimization purposes. PSO, GOA, HHO, GA, and BBBC were implemented to validate the performance of the MRFO in the optimal sizing of a HES based on minimizing the ASC and maximizing the system reliability. The three algorithms; MRFO, PSO, and GOA can follow the optimal global solution. The MRFO algorithm converges faster than all other five soft computing algorithms followed by PSO and GOA. However, HHO, GA, and BBBC may fall into the local solution and a take longer time to converge. On the other hand, MRFO attained the optimum sizing of the HES at the lowest ASC (USD 104,324.1) followed by GOA (USD 104,347.7) and PSO (USD 104,342.2) for 0% LPSP. Nevertheless, HHO, GA, and BBBC had clear oscillations and failed to achieve the optimal solution. The optimal HES exhibits the best REF% and SE% using the MRFO technique compared to the other five soft computing-based algorithms. Therefore, the optimization results validate the supremacy of the MRFO algorithm over the other five soft computing techniques in terms of the global solution capture and convergence time. The authors recommended that a comparative and comprehensive study for the optimization techniques should be performed as a further work to enable the designers to adopt the most appropriate and efficient technique among all of them.

Author Contributions

Conceptualization, A.A.A.-S. and H.M.H.F.; data curation, A.A.A.-S. and H.M.H.F.; formal analysis, F.A.A., A.A.A.-S., H.M.H.F. and K.A.; funding acquisition, F.A.A.; investigation, A.A.A.-S. and H.M.H.F.; methodology, A.A.A.-S. and H.M.H.F.; project administration, F.A.A.; software, A.A.A.-S., H.M.H.F. and K.A.; supervision, F.A.A.; writing—original draft, H.M.H.F., and A.A.A.-S.; writing—review and editing, F.A.A., A.A.A.-S., H.M.H.F., and K.A. All authors have read and agreed to the published version of the manuscript.

Funding

This work was supported by the Researchers Supporting Project number (RSP-2020/252), King Saud University, Riyadh, Saudi Arabia.

Acknowledgments

The authors would like to acknowledge the Researchers Supporting Project at King Saud University, Riyadh, Saudi Arabia.

Conflicts of Interest

The authors declare no conflict of interest. The funders had no role in the design of the study; in the collection, analyses, or interpretation of data; in the writing of the manuscript, or in the decision to publish the results.

References

  1. Ma, T.; Yang, H.; Lu, L.; Peng, J. Technical feasibility study on a standalone hybrid solar-wind system with pumped hydro storage for a remote island in Hong Kong. Renew. Energy 2014, 69, 7–15. [Google Scholar] [CrossRef]
  2. Ciupageanu, D.A.A.; Lazaroiu, G. Dynamic Simulation of a Stand-Alone Photovoltaic/Battery Energy Storage System. In 2018 International Symposium on Fundamentals of Electrical Engineering (ISFEE); IEEE: New York, NY, USA, 2018; pp. 1–5. [Google Scholar]
  3. Javed, K.K.; Ashfaq, H.H.; Singh, R.R.; Hussain, S.M.M.; Ustun, T.S. Design and performance analysis of a stand-alone PV system with hybrid energy storage for rural India. Electronics 2020, 8, 952. [Google Scholar] [CrossRef] [Green Version]
  4. Ciupageanu, D.A.A.; Barelli, L.L.; Lazaroiu, G. Design of a Fuzzy Logic Controller for a Remote Power Application. In 2019 IEEE PES Innovative Smart Grid Technologies Europe (ISGT-Europe); IEEE: New York, NY, USA, 2019; pp. 1–5. [Google Scholar]
  5. Sanajaoba, S.; Fernandez, E. Maiden application of Cuckoo Search algorithm for optimal sizing of a remote hybrid renewable energy System. Renew. Energy 2016, 96, 1–10. [Google Scholar] [CrossRef]
  6. Oladigbolu, J.O.O.; Ramli, M.A.A.; Al-Turki, Y.A. Optimal design of a hybrid PV solar/micro-hydro/diesel/battery energy system for a remote rural village under tropical climate conditions. Electronics 2020, 9, 1491. [Google Scholar] [CrossRef]
  7. Nelson, D.B.; Nehrir, M.H.; Wang, C. Unit sizing and cost analysis of stand-alone hybrid wind/PV/fuel cell power generation systems. Renew. Energy 2006, 31, 1641–1656. [Google Scholar] [CrossRef]
  8. Luna-Rubio, R.; Trejo-Perea, M.; Vargas-Vázquez, D.; Ríos-Moreno, G.J. Optimal sizing of renewable hybrids energy systems: A review of methodologies. Sol. Energy 2012, 86, 1077–1088. [Google Scholar] [CrossRef]
  9. Hung, D.Q.; Mithulananthan, N.; Bansal, R.C. Analytical strategies for renewable distributed generation integration considering energy loss minimization. Appl. Energy 2013, 105, 75–85. [Google Scholar] [CrossRef]
  10. Diaf, S.; Belhamel, M.; Haddadi, M.; Louche, A. Technical and economic assessment of hybrid photovoltaic/wind system with battery storage in Corsica island. Energy Policy 2008, 36, 743–754. [Google Scholar] [CrossRef]
  11. Kaabeche, A.A.; Belhamel, M.M.; Ibtiouen, R. Sizing optimization of grid-independent hybrid photovoltaic/wind power generation system. Energy 2011, 36, 1214–1222. [Google Scholar] [CrossRef]
  12. Farh, H.M.; Al-Shaalan, A.M.M.; Eltamaly, A.M.; Al-Shamma′A, A.A. A Novel Crow Search Algorithm Auto-Drive PSO for Optimal Allocation and Sizing of Renewable Distributed Generation. IEEE Access 2020, 8, 27807–27820. [Google Scholar] [CrossRef]
  13. Al-Shamma′A, A.A.; Alturki, F.A.; Farh, H.M. Techno-economic assessment for energy transition from diesel-based to hybrid energy system-based off-grids in Saudi Arabia. Energy Transit. 2020, 4, 1–13. [Google Scholar] [CrossRef] [Green Version]
  14. Farh, H.M.; Al-Shaalan, A.M.; Eltamaly, A.M.; Al-Shamma′A, A.A. A novel severity performance index for optimal allocation and sizing of photovoltaic distributed generations. Energy Rep. 2020, 6, 2180–2190. [Google Scholar] [CrossRef]
  15. Askarzadeh, A. Distribution generation by photovoltaic and diesel generator systems: Energy management and size optimization by a new approach for a stand-alone application. Energy 2017, 122, 542–551. [Google Scholar] [CrossRef]
  16. Hadidian-Moghaddam, M.J.; Arabi-Nowdeh, S.; Bigdeli, M. Optimal sizing of a stand-alone hybrid photovoltaic/wind system using new grey wolf optimizer considering reliability. J. Renew. Sustain. Energy 2016, 8, 035903. [Google Scholar] [CrossRef]
  17. Kaabeche, A.; Diaf, S.; Ibtiouen, R. Firefly-inspired algorithm for optimal sizing of renewable hybrid system considering reliability criteria. Sol. Energy 2017, 155, 727–738. [Google Scholar] [CrossRef]
  18. Maleki, A.; Askarzadeh, A. Artificial bee swarm optimization for optimum sizing of a stand-alone PV/WT/FC hybrid system considering LPSP concept. Sol. Energy 2014, 107, 227–235. [Google Scholar] [CrossRef]
  19. Shezan, S.A.; Julai, S.; Kibria, M.A.; Ullah, K.R.; Saidur, R.; Chong, W.T.; Akikur, R.K. Performance analysis of an off-grid wind-PV (photovoltaic)-diesel-battery hybrid energy system feasible for remote areas. J. Clean. Prod. 2016, 125, 121–132. [Google Scholar] [CrossRef]
  20. Ferrari, L.; Bianchini, A.; Galli, G.; Ferrara, G.; Carnevale, E.A. Influence of actual component characteristics on the optimal energy mix of a photovoltaic-wind-diesel hybrid system for a remote off-grid application. J. Clean. Prod. 2018, 178, 206–219. [Google Scholar] [CrossRef]
  21. Kaviani, A.K.; Baghaee, H.R.; Riahy, G.H. Optimal sizing of a stand-alone wind/photovoltaic generation unit using particle swarm optimization. Simulation 2009, 85, 89–99. [Google Scholar] [CrossRef]
  22. Baghaee, H.R.; Mirsalim, M.; Gharehpetian, G.B.; Talebi, H.A. Reliability/cost-based multi-objective Pareto optimal design of stand-alone wind/PV/FC generation microgrid system. Energy 2016, 115, 1022–1041. [Google Scholar] [CrossRef]
  23. Koutroulis, E.; Kolokotsa, D.; Potirakis, A.; Kalaitzakis, K. Methodology for optimal sizing of stand-alone photovoltaic/wind-generator systems using genetic algorithms. Sol. Energy 2006, 80, 1072–1088. [Google Scholar] [CrossRef]
  24. Bilal, B.O.; Nourou, D.; Sambou, V.; Ndiaye, P.A.; Ndongo, M. Multi-objective optimization of hybrid PV/wind/diesel/battery systems for decentralized application by minimizing the levelized cost of energy and the CO2 emissions. Int. J. Phys. Sci. 2015, 10, 192–203. [Google Scholar]
  25. Al-Shamma′A, A.A.; Addoweesh, K.E. Techno-economic optimization of hybrid power system using genetic algorithm. Int. J. Energy Res. 2014, 38, 1608–1623. [Google Scholar] [CrossRef]
  26. Sanchez, V.M.; Chavez-Ramirez, A.U.; Duron-Torres, S.M.; Hernandez, J.; Arriaga, L.G.; Ramirez, J.M. Techno-economical optimization based on swarm intelligence algorithm for a stand-alone wind-photovoltaic-hydrogen power system at south-east region of Mexico. Int. J. Hydrog. Energy 2014, 39, 16646–16655. [Google Scholar] [CrossRef]
  27. Sharafi, M.; ElMekkawy, T.Y. A dynamic MOPSO algorithm for multiobjective optimal design of hybrid renewable energy systems. Int. J. Energy Res. 2014, 38, 1949–1963. [Google Scholar] [CrossRef]
  28. Maleki, A.; Askarzadeh, A. Comparative study of artificial intelligence techniques for sizing of a hydrogen-based stand-alone photovoltaic/wind hybrid system. Int. J. Hydrogen Energy 2014, 39, 9973–9984. [Google Scholar] [CrossRef]
  29. Ghorbani, N.; Kasaeian, A.; Toopshekan, A.; Bahrami, L.; Maghami, A. Optimizing a hybrid wind-PV-battery system using GA-PSO and MOPSO for reducing cost and increasing reliability. Energy 2018, 154, 581–591. [Google Scholar] [CrossRef]
  30. Fathy, A. A reliable methodology based on mine blast optimization algorithm for optimal sizing of hybrid PV-wind-FC system for remote area in Egypt. Renew. Energy 2016, 95, 367–380. [Google Scholar] [CrossRef]
  31. Askarzadeh, A. Electrical power generation by an optimised autonomous PV/wind/tidal/battery system. Iet Renew. Power Gener. 2016, 11, 152–164. [Google Scholar] [CrossRef]
  32. Gharibi, M.; Askarzadeh, A. Size and power exchange optimization of a grid-connected diesel generator-photovoltaic-fuel cell hybrid energy system considering reliability, cost and renewability. Int. J. Hydrog. Energy 2019, 44, 25428–25441. [Google Scholar] [CrossRef]
  33. Zhao, J.; Yuan, X. Multi-objective optimization of stand-alone hybrid PV-wind-diesel-battery system using improved fruit fly optimization algorithm. Soft Comput. 2016, 20, 2841–2853. [Google Scholar] [CrossRef]
  34. Eteiba, M.B.; Barakat, S.; Samy, M.M.; Wahba, W.I. Optimization of an off-grid PV/Biomass hybrid system with different battery technologies. Sustain. Cities Soc. 2018, 40, 713–727. [Google Scholar] [CrossRef]
  35. Sedighizadeh, M.; Esmaili, M.; Esmaeili, M. Application of the hybrid Big Bang-Big Crunch algorithm to optimal reconfiguration and distributed generation power allocation in distribution systems. Energy 2014, 76, 920–930. [Google Scholar] [CrossRef]
  36. Erdinc, O.; Uzunoglu, M. Optimum design of hybrid renewable energy systems: Overview of different approaches. Renew. Sustain. Energy Rev. 2012, 16, 1412–1425. [Google Scholar] [CrossRef]
  37. Moghaddam, M.J.H.; Kalam, A.; Nowdeh, S.A.; Ahmadi, A.; Babanezhad, M.; Saha, S. Optimal sizing and energy management of stand-alone hybrid photovoltaic/wind system based on hydrogen storage considering LOEE and LOLE reliability indices using flower pollination algorithm. Renew. Energy 2019, 135, 1412–1434. [Google Scholar] [CrossRef]
  38. Bukar, A.L.; Tan, C.W.; Lau, K.Y. Optimal sizing of an autonomous photovoltaic/wind/battery/diesel generator microgrid using grasshopper optimization algorithm. Sol. Energy 2019, 188, 685–696. [Google Scholar] [CrossRef]
  39. Holland, J. Genetic algorithms. Sci. Am. 1992, 267, 66–73. [Google Scholar] [CrossRef]
  40. Eberhart, R.; Kennedy, J. A new optimizer using particle swarm theory. In MHS’95. Proceedings of the Sixth International Symposium on Micro Machine and Human Science; IEEE: New York, NY, USA, 1995; pp. 39–43. [Google Scholar]
  41. Saremi, S.; Mirjalili, S.; Lewis, A. Grasshopper optimisation algorithm: Theory and application. Adv. Eng. Softw. 2017, 105, 30–47. [Google Scholar] [CrossRef]
  42. Erol, O.K.; Eksin, I. A new optimization method: Big bang–big crunch. Adv. Eng. Softw. 2006, 37, 106–111. [Google Scholar] [CrossRef]
  43. Heidari, A.A.; Mirjalili, S.; Faris, H.; Aljarah, I.; Mafarja, M.; Chen, H. Harris hawks optimization: Algorithm and applications. Future Gener. Comput. Syst. 2019, 97, 849–872. [Google Scholar] [CrossRef]
  44. Rehman, S.; Al-Hadhrami, L.M.; Alam, M.M.; Meyer, J.P. Empirical correlation between hub height and local wind shear exponent for different sizes of wind turbines. Sustain. Energy Technol. Assess. 2013, 4, 45–51. [Google Scholar] [CrossRef] [Green Version]
  45. Elshurafa, A.M.; Alsubaie, A.M.; Alabduljabbar, A.A.; Al-Hsaien, S.A. Solar PV on mosque rooftops: Results from a pilot study in Saudi Arabia. J. Build. Eng. 2019, 25, 100809. [Google Scholar] [CrossRef]
  46. Givler, T.; Lilienthal, P. Using HOMER Software, NREL’s Micropower Optimization Model, to Explore the Role of Gen.-Sets in Small Solar Power Systems; Case Study: Sri Lanka; National Renewable Energy Lab: Golden, CO, USA, 2005.
  47. Pallabazzer, R. Evaluation of wind-generator potentiality. Sol. Energy 1995, 55, 49–59. [Google Scholar] [CrossRef]
  48. Belfkira, R.; Zhang, L.; Barakat, G. Optimal sizing study of hybrid wind/PV/diesel power generation unit. Sol. Energy 2011, 85, 100–110. [Google Scholar] [CrossRef]
  49. Skarstein, Ø.; Uhlen, K. Design considerations with respect to long-term diesel saving in wind/diesel plants. Wind Eng. 1989, 13, 72–87. [Google Scholar]
Figure 1. Geographical location of the selected village in Arar, Saudi Arabia.
Electronics 09 02045 g001
Figure 2. Load profile of Al Sulaymaniyah village.
Electronics 09 02045 g002
Figure 3. Monthly mean wind speeds at heights of 30 m and 60 m for 12 months of the year.
Electronics 09 02045 g003
Figure 4. Monthly mean solar radiation for 12 months of the year.
Electronics 09 02045 g004
Figure 5. Structure of the proposed hybrid energy system (HES).
Electronics 09 02045 g005
Figure 6. The wind turbine output power characteristics.
Electronics 09 02045 g006
Figure 7. Anatomy of a manta ray.
Electronics 09 02045 g007
Figure 8. Foraging behaviors of manta rays (black: chain foraging; light blue: cyclone foraging; blue: somersault foraging); red: plankton in high concentration.
Electronics 09 02045 g008
Figure 9. Convergence rate of the MRFO in comparison with the other five intelligent algorithms.
Electronics 09 02045 g009
Figure 10. ASC vs. runs using MRFO in comparison to the other five intelligent algorithms for LPSP = 0%.
Electronics 09 02045 g010
Figure 11. Optimal capacity vs. runs of: (a) PV, (b) WTG, (c) battery bank, and (d) diesel generator; using MRFO compared to the other five algorithms for LPSP = 0%.
Electronics 09 02045 g011
Figure 12. The REF vs. runs using MRFO compared to the other five algorithms for LPSP = 0%.
Electronics 09 02045 g012
Figure 13. SE vs. runs using MRFO compared to the other five soft computing algorithms for LPSP = 0%.
Electronics 09 02045 g013
Figure 14. The HES performance related to renewable sources power, surplus power, diesel generator power, battery bank SOC and the load profile.
Electronics 09 02045 g014
Figure 15. The ASC breakdown of the hybrid PV/WTGs/battery/diesel collected by the MRFO.
Electronics 09 02045 g015
Table 1. Correlation coefficient of load, solar irradiance, and wind speed.
ItemLoad DemandSolar IrradianceWind Speed
Load Demand10.34920.0292
Solar Irradiance0.34921−0.0331
Wind Speed0.0292−0.03311
Table 2. Technical and economic parameters of the HES components.
ComponentParametersValuesUnits
Photovoltaic ModuleLife span20years
Efficiency16%
Capital cost1000USD/kW
O&M cost15USD/kW/year
WTGLife span20years
Capital cost1300USD/kW
O&M cost30.33USD/kW/year
Cut-In/cut-off/rated speed3/25/12m/s
Hub-height60M
Batteries Life span5years
Capital cost200USD/kWh
O&M cost5USD/kWh/year
Round-trip efficiency80%
Depth of discharge60%
Diesel Generator Life span15,000hours
Capital cost300USD/kW
O&M cost0.012USD/kWh
DC/AC Converter Life span10years
Capital cost133USD/kW
Project Factors Life span20years
Interest rate3%
Inflation rate2%
Table 3. Main parameters of the six computational intelligence-based algorithms.
AlgorithmParameterValue
GA Population100
SelectionRoulette wheel
Mutation rate0.2
Crossover rate0.8
PSO Swarm100
Inertia weight1
Cognitive constant0.25
GOA Social constant 1.75
Grasshopper swarms100
HHO Adaptive parameter [0, 1]
Number of hawks100
BBBC Energy of rabbit2
Population size100
MRFO Constant parameterα = 1
Somersault factor2
Random numbers r 1 ,   r 2 ,   r 3 [0, 1]
Table 4. Simulation results for loss of power supply probability (LPSP) = 0% considering 50 total runs.
AlgorithmPerformance IndicatorsPPV
(kW)
PWT
(kW)
PBatt
(kW)
PDsl (kW)ASC
(USD/year)
REF
(%)
Surplus
(%)
GAOptimal238.9239.8189.3271.3104,812.667.016.64
Worst328.10114.1310.7108,302.142.719.21
Mean248.5229.8178.5268.516105,931.566.2218.45
STD21.85446.48737.92517.772789.5414.1751.736
PSOOptimal240.3229.9188.5267.8104,342.266.416.01
Worst220.9239.3202.8266.5104,708.066.115.95
Mean240.0230.0188.5268.4104,461.866.3417.98
STD4.5267.9447.3172.18275.4410.5090.871
GOAOptimal238.9231.3192.1267.7104,347.766.516.00
Worst245.3238.9165.6268.6104,651.366.917.61
Mean239.8232.6186.8267.9104,449.466.516.43
STD3.2406.9027.5821.65973.0290.4420.510
HHOOptimal240.6229.7186.3268.2104,438.566.339.36
Worst342.50389.9280.4109,566.147.411.94
Mean252.6221.2226.7260.2105,333.866.4417.09
STD23.248.359.511.5822.9274.4863.70
BBBCOptimal251.5215.6193.9283.9105,610.965.916.34
Worst139.1384.1139.1285.5112,262.192.453.12
Mean235.1215.5192.2283.4107,887.282.851.77
STD60.171.396.74.0132,8.87310.2411.65
MRFOOptimal238.7231.6192.5267.6104,324.167.216.79
Worst241.8244.8180.8266.7104,524.566.816.52
Mean239.2232.1189.0268.1104,390.166.5516.25
STD2.0566.0525.2721.07358.3920.8270.87
Publisher’s Note: MDPI stays neutral with regard to jurisdictional claims in published maps and institutional affiliations.

