Article

Recognition of Drivers’ Activity Based on 1D Convolutional Neural Network

by
Rafał J. Doniec
1,
Szymon Sieciński
1,*,
Konrad M. Duraj
1,
Natalia J. Piaseczna
1,
Katarzyna Mocny-Pachońska
2 and
Ewaryst J. Tkacz
1
1
Department of Biosensors and Processing of Biomedical Signals, Faculty of Biomedical Engineering, Silesian University of Technology, Roosevelta 40, 41-800 Zabrze, Poland
2
Department of Conservative Dentistry with Endodontics, Faculty of Medical Science, Medical University of Silesia, Pl. Akademicki 17, 41-902 Bytom, Poland
*
Author to whom correspondence should be addressed.
Electronics 2020, 9(12), 2002; https://doi.org/10.3390/electronics9122002
Submission received: 3 November 2020 / Revised: 20 November 2020 / Accepted: 21 November 2020 / Published: 25 November 2020
(This article belongs to the Special Issue Application of Neural Networks in Biosignal Process)

Abstract

:
Background and objective: Driving a car is a complex activity which involves movements of the whole body. Many studies on drivers’ behavior are conducted to improve road traffic safety. Such studies involve the registration and processing of multiple signals, such as electroencephalography (EEG), electrooculography (EOG) and the images of the driver’s face. In our research, we attempt to develop a classifier of scenarios related to learning to drive based on the data obtained in real road traffic conditions via smart glasses. In our approach, we try to minimize the number of signals which can be used to recognize the activities performed while driving a car. Material and methods: We attempt to evaluate the drivers’ activities using both electrooculography (EOG) and a deep learning approach. To acquire data we used JINS MEME smart glasses furnished with 3-point EOG electrodes, 3-axial accelerometer and 3-axial gyroscope. Sensor data were acquired on 20 drivers (ten experienced and ten learner drivers) on the same 28.7 km route under real road conditions in southern Poland. The drivers performed several tasks while wearing the smart glasses and the tasks were linked to the signal during the drive. For the recognition of four activities (parking, driving through a roundabout, city traffic and driving through an intersection), we used one-dimensional convolutional neural network (1D CNN). Results: The maximum accuracy was 95.6% on validation set and 99.8% on training set. The results prove that the model based on 1D CNN can classify the actions performed by drivers accurately. Conclusions: We have proved the feasibility of recognizing drivers’ activity based solely on EOG data, regardless of the driving experience and style. Our findings may be useful in the objective assessment of driving skills and thus, improving driving safety.

1. Introduction

Driving a car is a complex activity which involves movements of the whole body [1]. The decisions and behavior of drivers regarding the surrounding traffic are crucial for road safety [2]. The factors which affect the road traffic safety can be divided into two categories: the environmental factors and the state of the driver. The environmental factors include weather and road conditions. We define the state of the driver as driver’s alertness, concentration (focus), cognitive abilities and the fact of performing secondary tasks.
To solve the problem of specifying driver’s activities, we apply recognition based on tracking eye movements, as most human activities require eyeball movements [3,4,5]. The analysis of eye movements may help understand the reasons and determine the beginning and the end of activity. However, most eye movements are involuntary and remain out of conscious control [6].
The mainstream method for tracking eye movements in human behavior research is analyzing images registered with a camera [7], because of its advantages: small individual differences, and providing a non-contact of eye measurements. The drawbacks of using a camera to track eye movements are the trade-off between processing time and detection accuracy and the susceptibility to lighting conditions, skin color and sunglasses [8]. Moreover, cameras mounted in vehicles cannot be used to detect the state of a driver outside the vehicle [9]. An alternative method is electrooculography (EOG), a technique for measuring the resting electrical potential between the cornea and retina of the human eye [10]. The EOG signal is registered by electrodes placed around the eyes. The extracted EOG signal is then processed in order to detect the eyeball movements [4,5,11,12,13].
The reason for choosing EOG to detect eyeball movements was the availability of JINS MEME ES_R smart glasses which can register electrooculograms in a non-invasive way (without attaching the electrodes to the body) while performing various activities (including driving a car) [9,14] and the fact that the eyeball movements contain the most information related to activities related to driving a car [2,4,15]. Another reason for using only electrooculography was to design the system for recognizing drivers’ activities regardless of their style of driving and experience and to find the minimal number of attributes required to recognize such activities [16].
To the best of our knowledge, the problem of extracting and selecting appropriate features from electrooculograms in recognition of drivers’ behavior has not been thoroughly investigated due to the cumbersome placement of electrodes and the breadth of the topic, which indicates a clear need for further research. The studies conducted by Niwa et al. [9] and Doniec et al. [17] are the only known study on drivers’ behavior which used JINS MEME smart glasses. Another recent study on recognizing the gaze on the left turn was conducted by Stapel et al. [18].
Because the average accuracy of the classifier based on k-means clustering and BFS reported in [17] was 85% when analyzing four activities related to driving (driving on the motorway, parking, urban traffic, traffic in the neighborhood), we attempted to improve the accuracy by changing the approach to classification.
In recent years, deep learning techniques, such as recurrent neural network (RNN) [19,20], convolutional neural network (CNN) [7,19], generative adversarial network (GAN) [21], long short-term memory (LSTM) network [20,21], have found their use in classifying the state of the driver based on various signals, such as electroencephalography (EEG) [19,20,22,23], images [20] and EOG [21].
In our study, we apply a one-dimensional (1D) convolutional neural network (CNN) to perform classification on raw EOG signals without crafting features prior to classification [24]. Another advantage of using 1D CNN is the ability to retrain the model on new data sets by using transfer learning [25].
The purpose of this study was to examine whether it is possible to classify drivers’ activities in real road conditions based on raw EOG signals and 1D CNN. The performance of the 1D CNN built for classification was evaluated as precision, recall and F1-score.
The structure is as follows: material and methods are described in Section 2, which includes the experiment setup, data preprocessing and classification. The results in Section 3 consist of the loss and accuracy graphs, the confusion matrix, and receiver operating characteristic (ROC) curves of the proposed 1D CNN model. Finally, we state that, based on the ROC curve and other performance metrics presented in the confusion matrix, the model was trained without overfitting and underfitting. In Section 4, we conclude the paper by discussing the significance of the results and advantages and limitations of our approach.

2. Materials and Methods

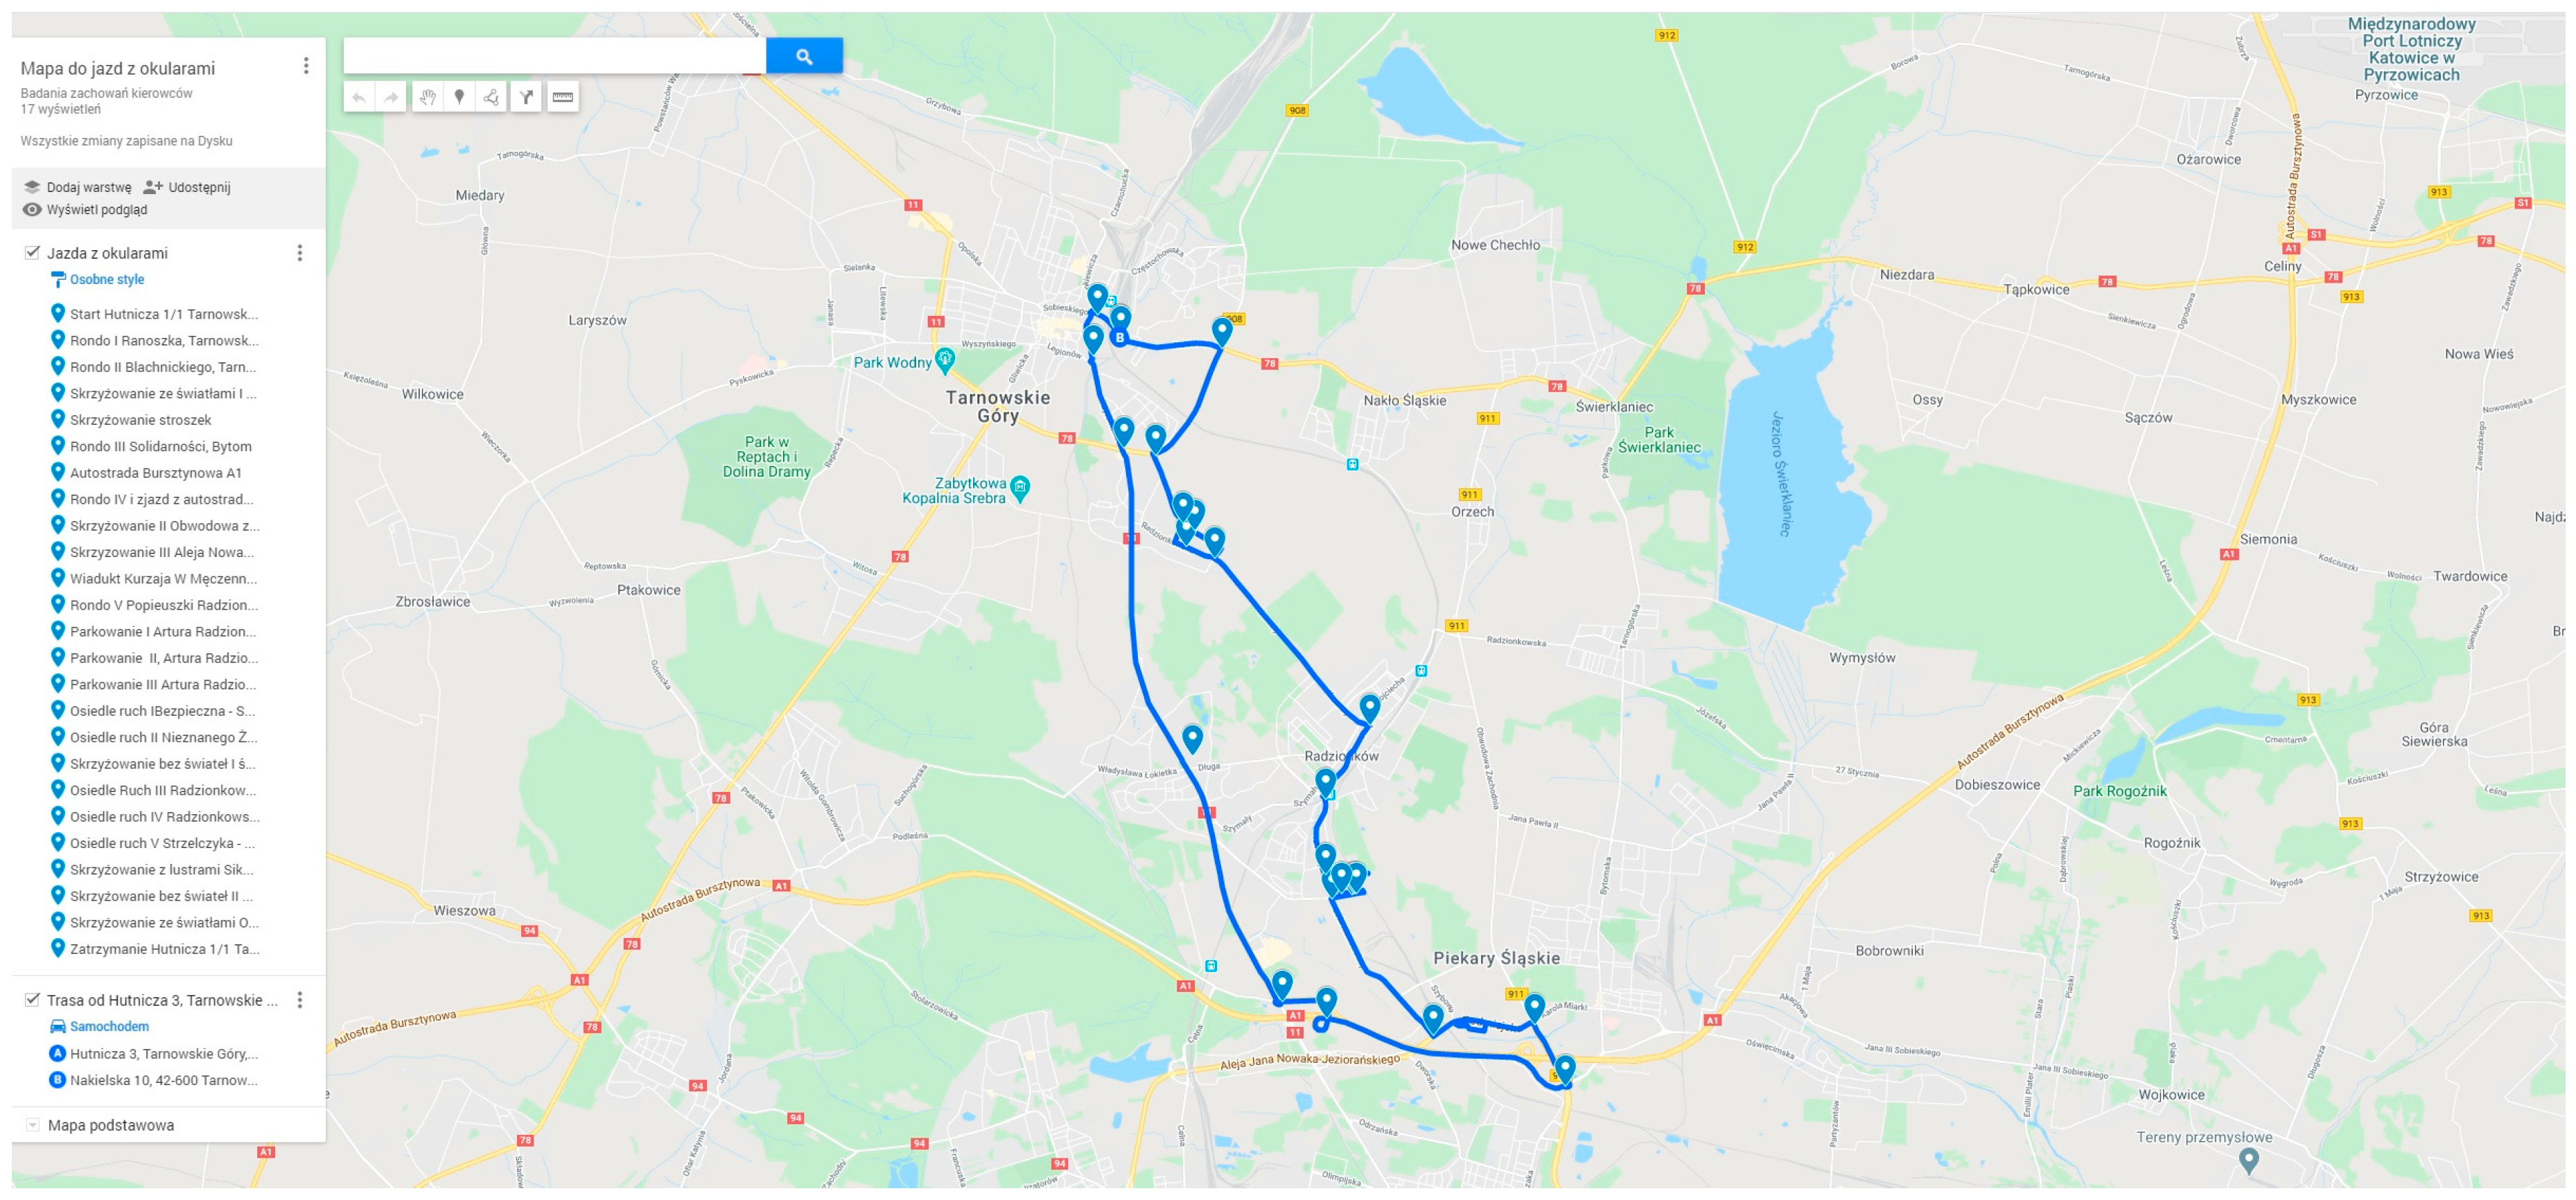
2.1. Experiment Setup

The study was conducted in real road conditions in accordance with Chapter 4 of the Act on Vehicle Drivers of the Republic of Poland [26] on two groups of volunteers: ten experienced drivers (age between 40 and 68) with minimum ten years of driving experience and ten learner drivers who attended driving lessons at a local driving school (age between 18 and 46). The participants gave consent to participate in the study. The candidates for drivers made a statement on their health in a questionnaire submitted to the driving school. Although the candidates for drivers may not reveal the actual health status in the questionnaires, we assumed that the study group did not have any health conditions which may cause a direct driving hazard.
In Poland, the drivers and candidates for drivers are subject to medical examination based on Article 39j of the Act on Road Transportation of the Republic of Poland [27] and Chapter 2 of the Act on Vehicle Drivers of the Republic of Poland [26]. The medical examinations of drivers include the examination of vision, hearing, and balance, the state of cardiovascular and respiratory system, kidneys, nervous system, including epilepsy, obstructive sleep apnea, mental health, symptoms of alcohol abuse, the use of drugs that may affect the ability to drive and other health conditions that may cause a driving hazard.
To avoid distracting the driver during the field study, data were acquired with JINS MEME ES_R smart glasses. The device consists of a three-point electrooculography (EOG) and six-axis inertial measurement unit (IMU) with a gyroscope and an accelerometer. JINS MEME smart glasses acquire ten channels of data: the acceleration and rotation in X, Y and Z axes, and four EOG channels: electric potentials on the right and left electrodes and the vertical and horizontal difference between them. All signals are sampled with the frequency of 100 Hz. The data are transmitted to a computer via Bluetooth or USB and can be exported to CSV file. Electrooculograms were recorded with three-point EOG sensor which consist of left, right and bridge electrodes and were converted into four lead (channel) recording of EOG signal: left, right, horizontal and vertical [14].
Each participant had to perform the same set of tasks while wearing the smart glasses. Sensor data were acquired and linked to scenarios related to driving by the observer sitting on a back seat (see Figure 1). Each learner driver (learner) drove the same car adapted for driving lessons and marked with the L sign. The learners drove the car under the supervision of a driving instructor, whereas other drivers drove their own cars. Sensor data from learner drivers were obtained thanks to the cooperation with a local driving school.
All participants completed their tasks on the same route of 28.7 km in Tarnowskie Góry, Radzionków, Bytom, and Piekary Śląskie in southern Poland presented in Figure 2. The tasks to be completed during the drive were based on the regulations on practical driving tests [28] and included:
  • journey through a motorway;
  • drive straight ahead in city traffic;
  • passage of a section straight ahead outside of the urban area;
  • drive straight ahead in residential traffic;
  • driving through a roundabout (right turn, driving straight ahead and left turn);
  • driving through a crossroads (right turn, driving straight ahead and left turn);
  • parking (parallel, perpendicular, angled).
The route included roundabouts and parking lots shown as satellite images in Figure 3 and Figure 4. Figure 3 presents the bird’s eye view of two roundabouts (small and large) and Figure 4 presents the bird’s eye view of public parking spaces with no ticketing along the Artura street in Radzionków (Poland).
Each activity was labeled manually by the researcher during the drive. A pilot (driving instructor in case of learner drivers and in other cases—the researcher) asked the driver to start performing a particular activity, and at the same time, recording began. When the task was completed, the pilot asked to stop the recording. The file with recorded data was named according to the registered activity.
The average time of completing all the tasks during the experiment was 75 min. Experienced drivers generally completed the route faster than learner drivers, regardless of road conditions [17].
The experiment was carried out following the rules of the Declaration of Helsinki of 1975, revised 2013, and with the permit issued by the Provincial Police Department in Katowice. The participants gave their informed consent for inclusion in the study. Study protocol was approved on 16 October 2018 by the Bioethics Committee of the Medical University of Silesia in Katowice (the resolution number KNW/0022/KB1/18). The identity of learner drivers is confidential under the agreement with the driving school, and the same rule applies for the experienced drivers. Experimental data as Supplementary Materials were made publicly available at IEEE DataPort [29].

2.2. Data Preprocessing

The data set consists of 520 labeled recordings of electrooculograms, acceleration and gyration signals from both experienced and inexperienced drivers acquired with JINS_MEME ES_R smart glasses and is available at the IEEE DataPort [29]. The reason for analyzing the recordings acquired form both experienced and inexperienced drivers is based on the fact that there are no significant differences in overall cognitive and motor skills [30].
The recordings were divided into four scenarios (categories): parking, driving through a roundabout, driving in city traffic and driving through an intersection chosen based on the classification accuracy reported in [17]. By considering only EOG signals, we can distinguish specific patterns associated with analyzed activities, regardless of style of driving, driving dynamics and experience visible in acceleration and gyration.
The recordings were divided into each category as follows:
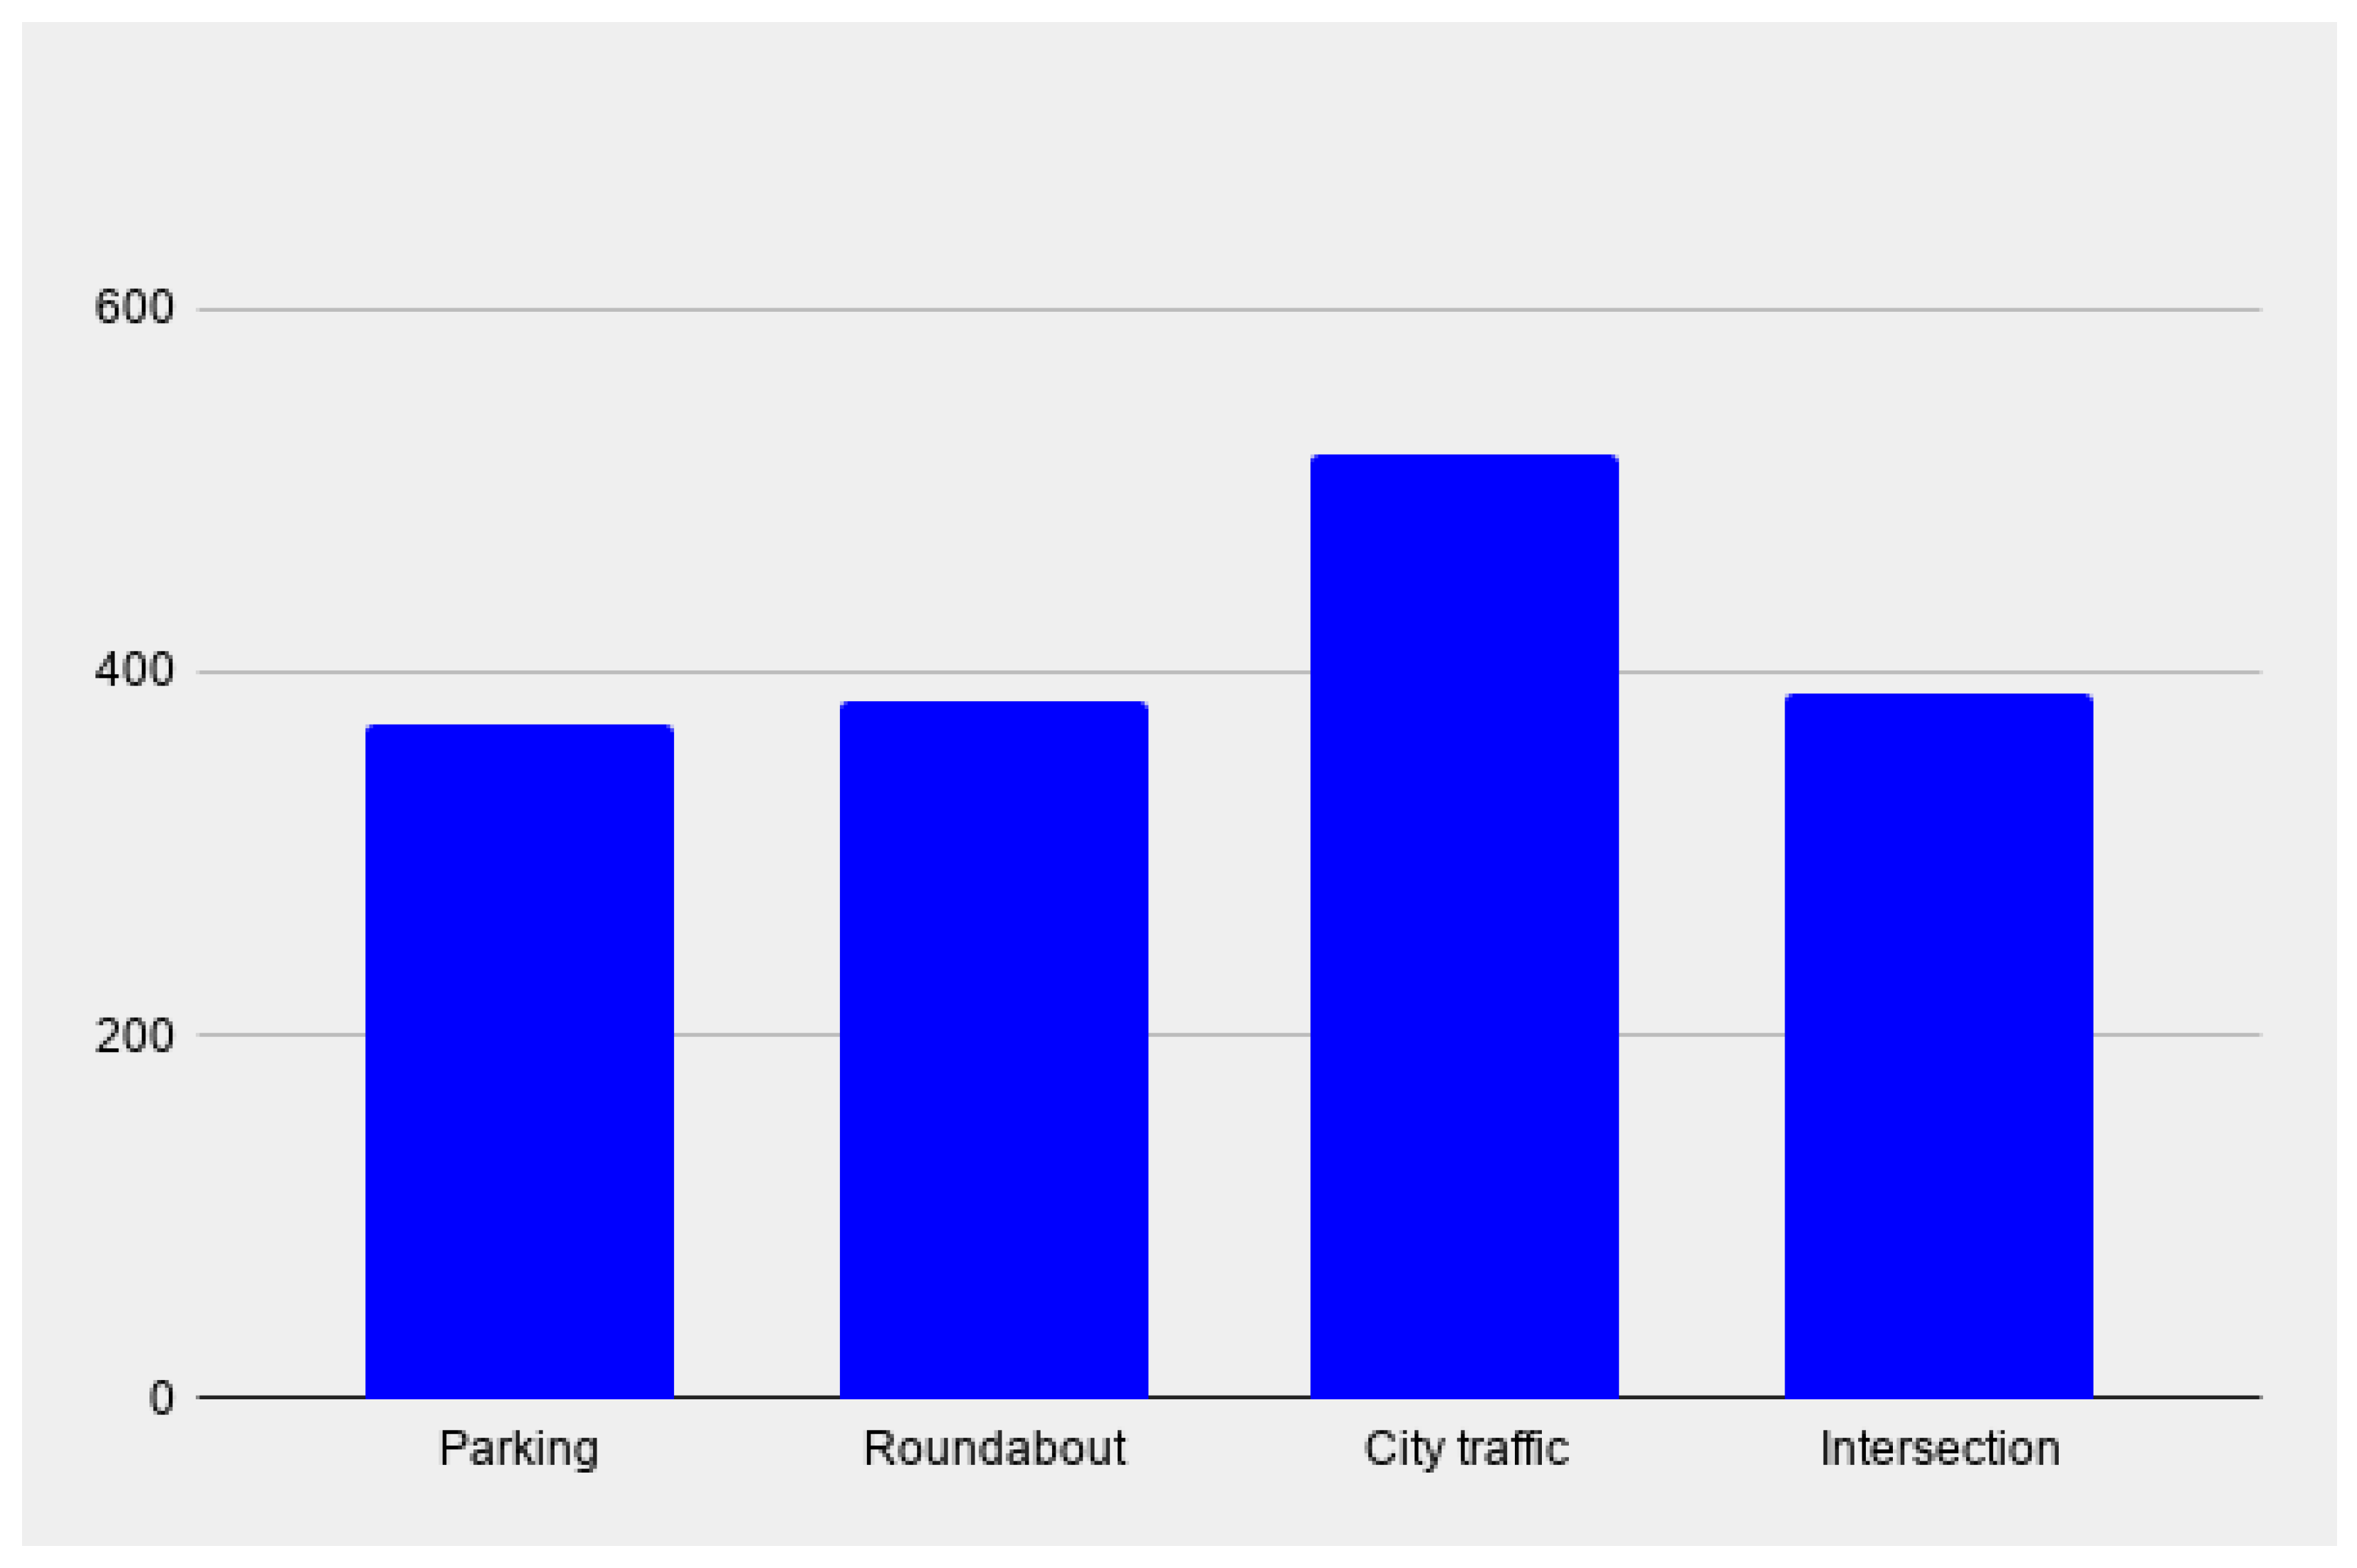
  • parking: 120 recordings,
  • driving through a roundabout: 120 recordings,
  • driving in city traffic: 160 recordings,
  • driving through an intersection: 120 recordings.
Each of these activities can be further divided into categories described in the Section 2.1. We focused on recognizing 4 activities to verify the feasibility of classification based on 1D CNN.
The data were preprocessed before classification in Python 3.7.5 with Pandas, NumPy, Matplotlib and Scikit-learn. The first step was to unify the length of the signals because the length of the original signal vector varies from 320 to 32,357 samples (considering all of the categories). In order to unify the input signals, we took the maximum length value across all the recordings and tiled the shorter vectors to match that value. This approach turned out to be the easiest and the fastest way to standardize input data without losing the inherent characteristics of the signal for each category.
The second step of preprocessing was normalizing the input values to prevent the occurrence of the exploding/vanishing gradient problem [31]. After normalization, the data were divided into training and validation sets. The best performance was achieved with validation split equal to 20%. The number of samples in both sets and for each category was shown in the Figure 5 and Figure 6.

2.3. Classification

In this study, we propose an approach to driver activity recognition using a one-dimensional convolutional neural network (1D CNN). This neural network model has proven its effectiveness in signal classification, yielding state-of-the-art results [32,33]. Because biological signals have non-linear characteristics, convolutional neural networks are an adequate choice, as they are precisely developed for recognizing non-linear patterns in the data [34]. Considering that there have not been established patterns in EOG signals related to driver’s activity, we applied 1D CNN due to the ability of automatic extraction of features. By using convolutional layers, we can also visualize the set of filters after training and try to learn which characteristics of the input signal are related to certain activity.
The architecture of the proposed model is shown in Figure 7.
The architecture consists of the following elements:
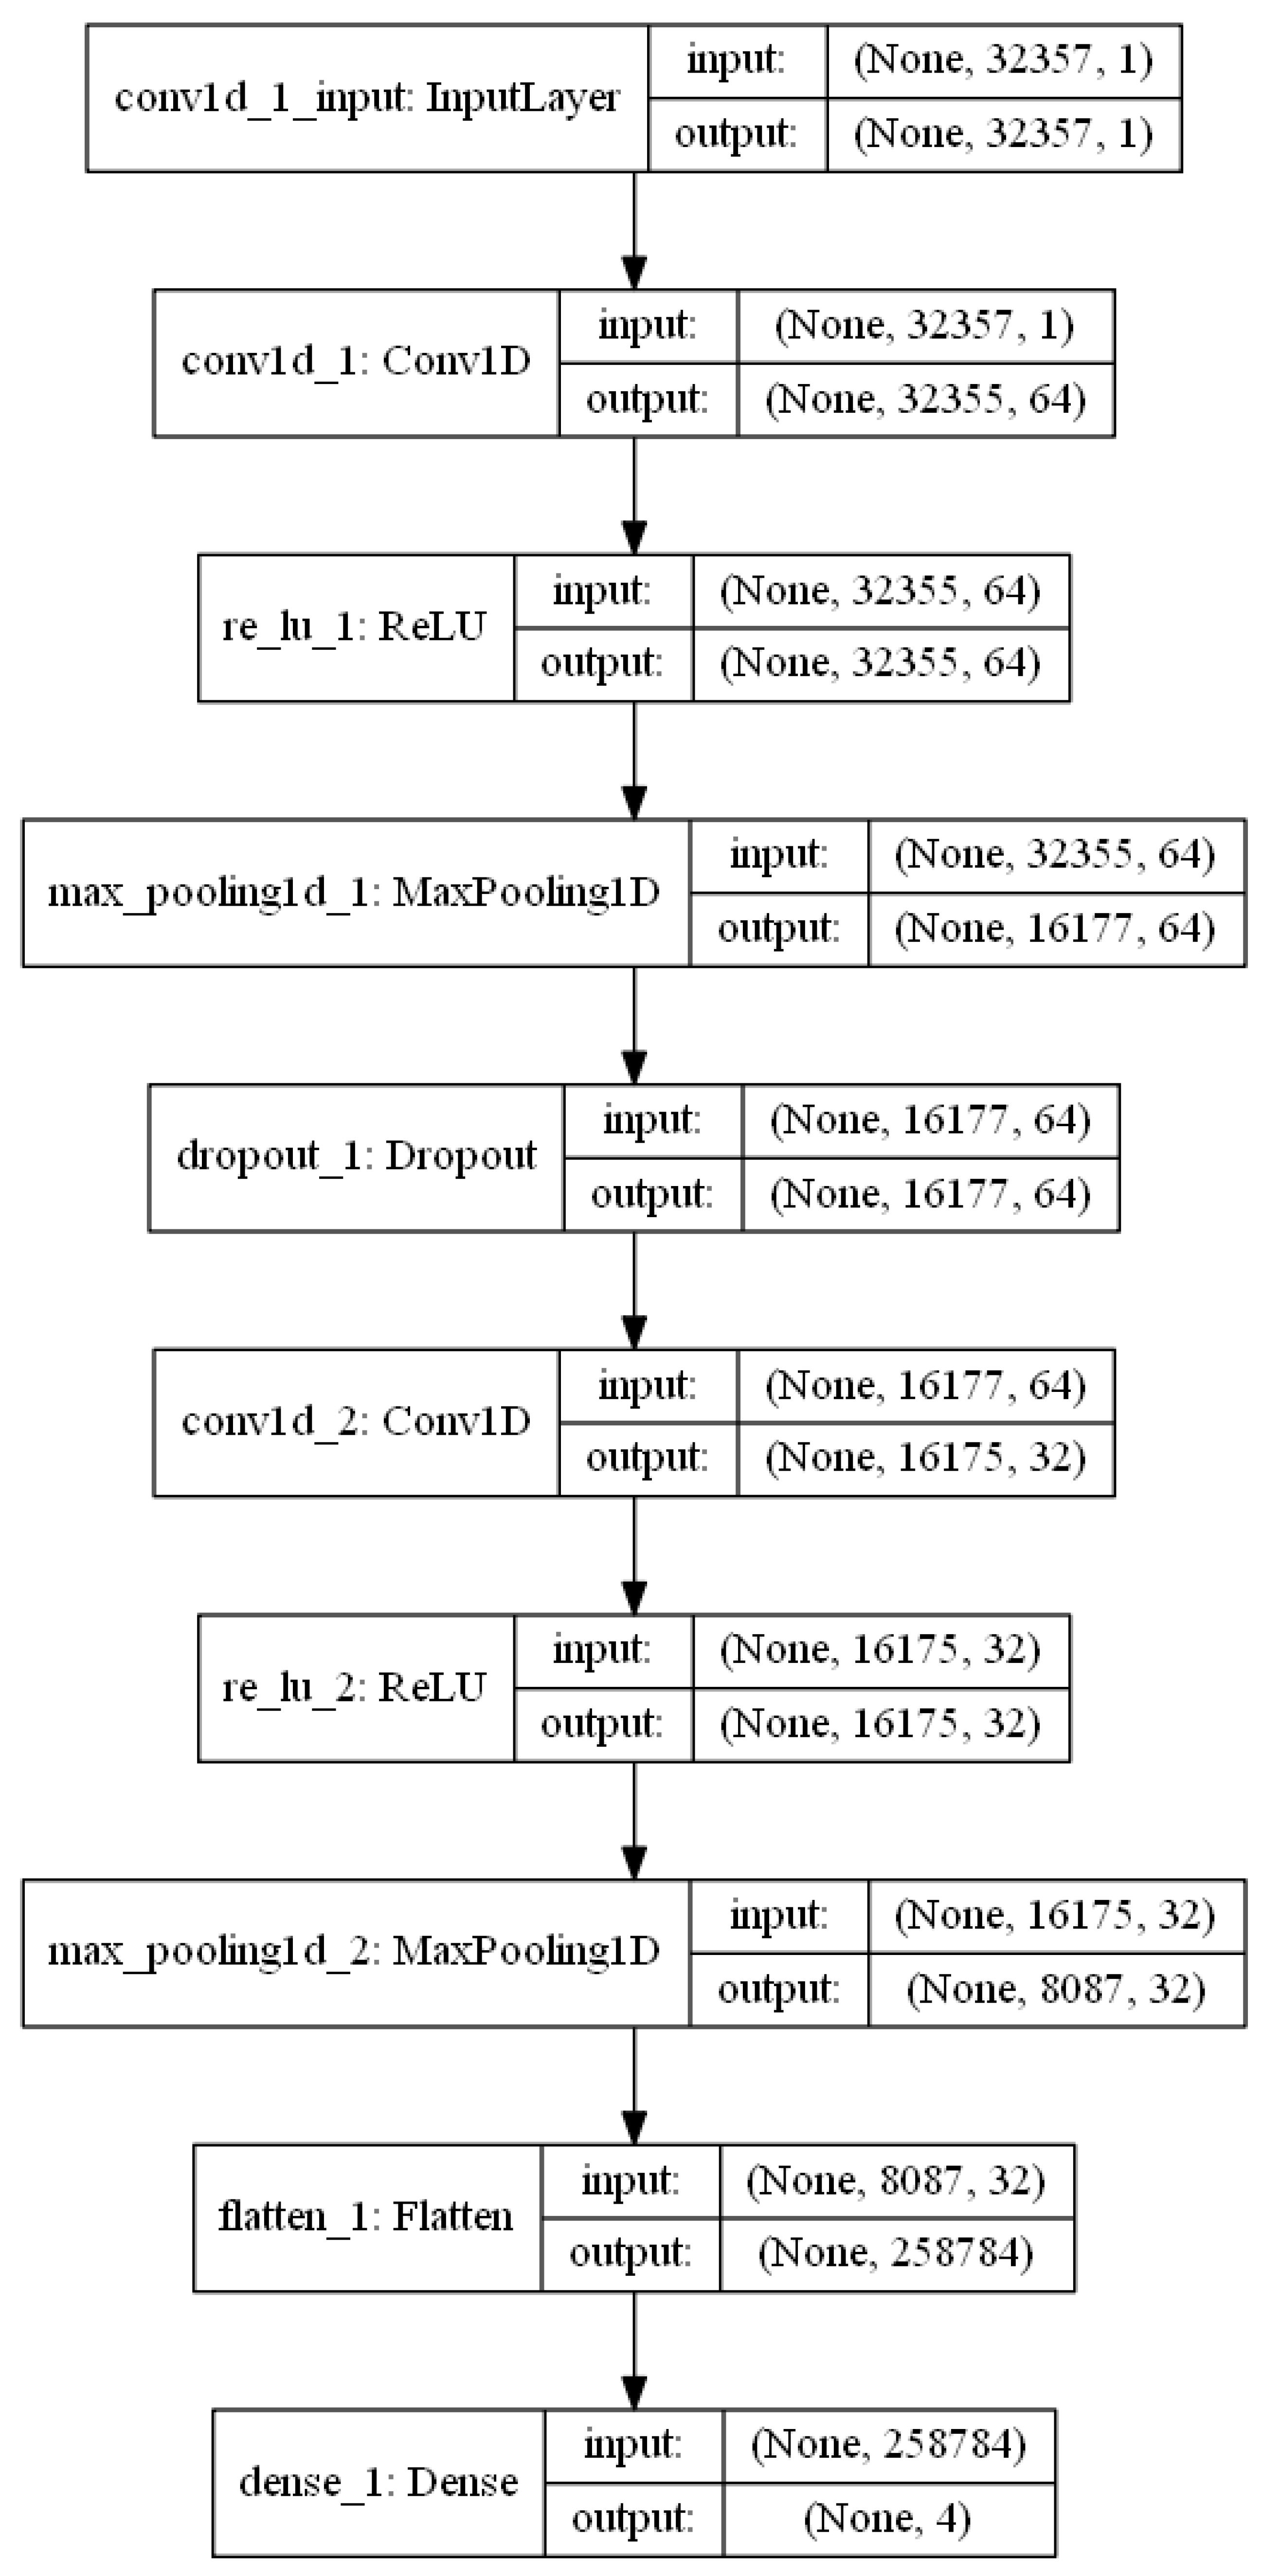
  • Convolution with max pooling block—first convolution layer produces 64 feature maps which are then processed by activation function in order to capture non-linear patterns and followed by pooling layer with kernel size of two to reduce the extracted information. The second convolution layer generates 32 feature maps with kernel of size three (as in the first block), followed again by rectified linear unit (ReLU) and pooling layer [35]. Although the kernel size of convolutional layer may be much higher in the case of 1D CNN than in their two-dimensional (2D) counterpart, the best results were achieved with the smaller kernel.
  • Dropout layer—the dropout layer was set with the rate of 0.5. This layer turned out to be the key element because it prevents overfitting at the beginning of the training phase [36].
  • Dense and flatten blocks—after obtaining the data from the second convolutional pooling block, the feature maps are mapped into their one-dimensional representation and classified with the single and final layer consisting of four neurons followed by softmax probability activation function.
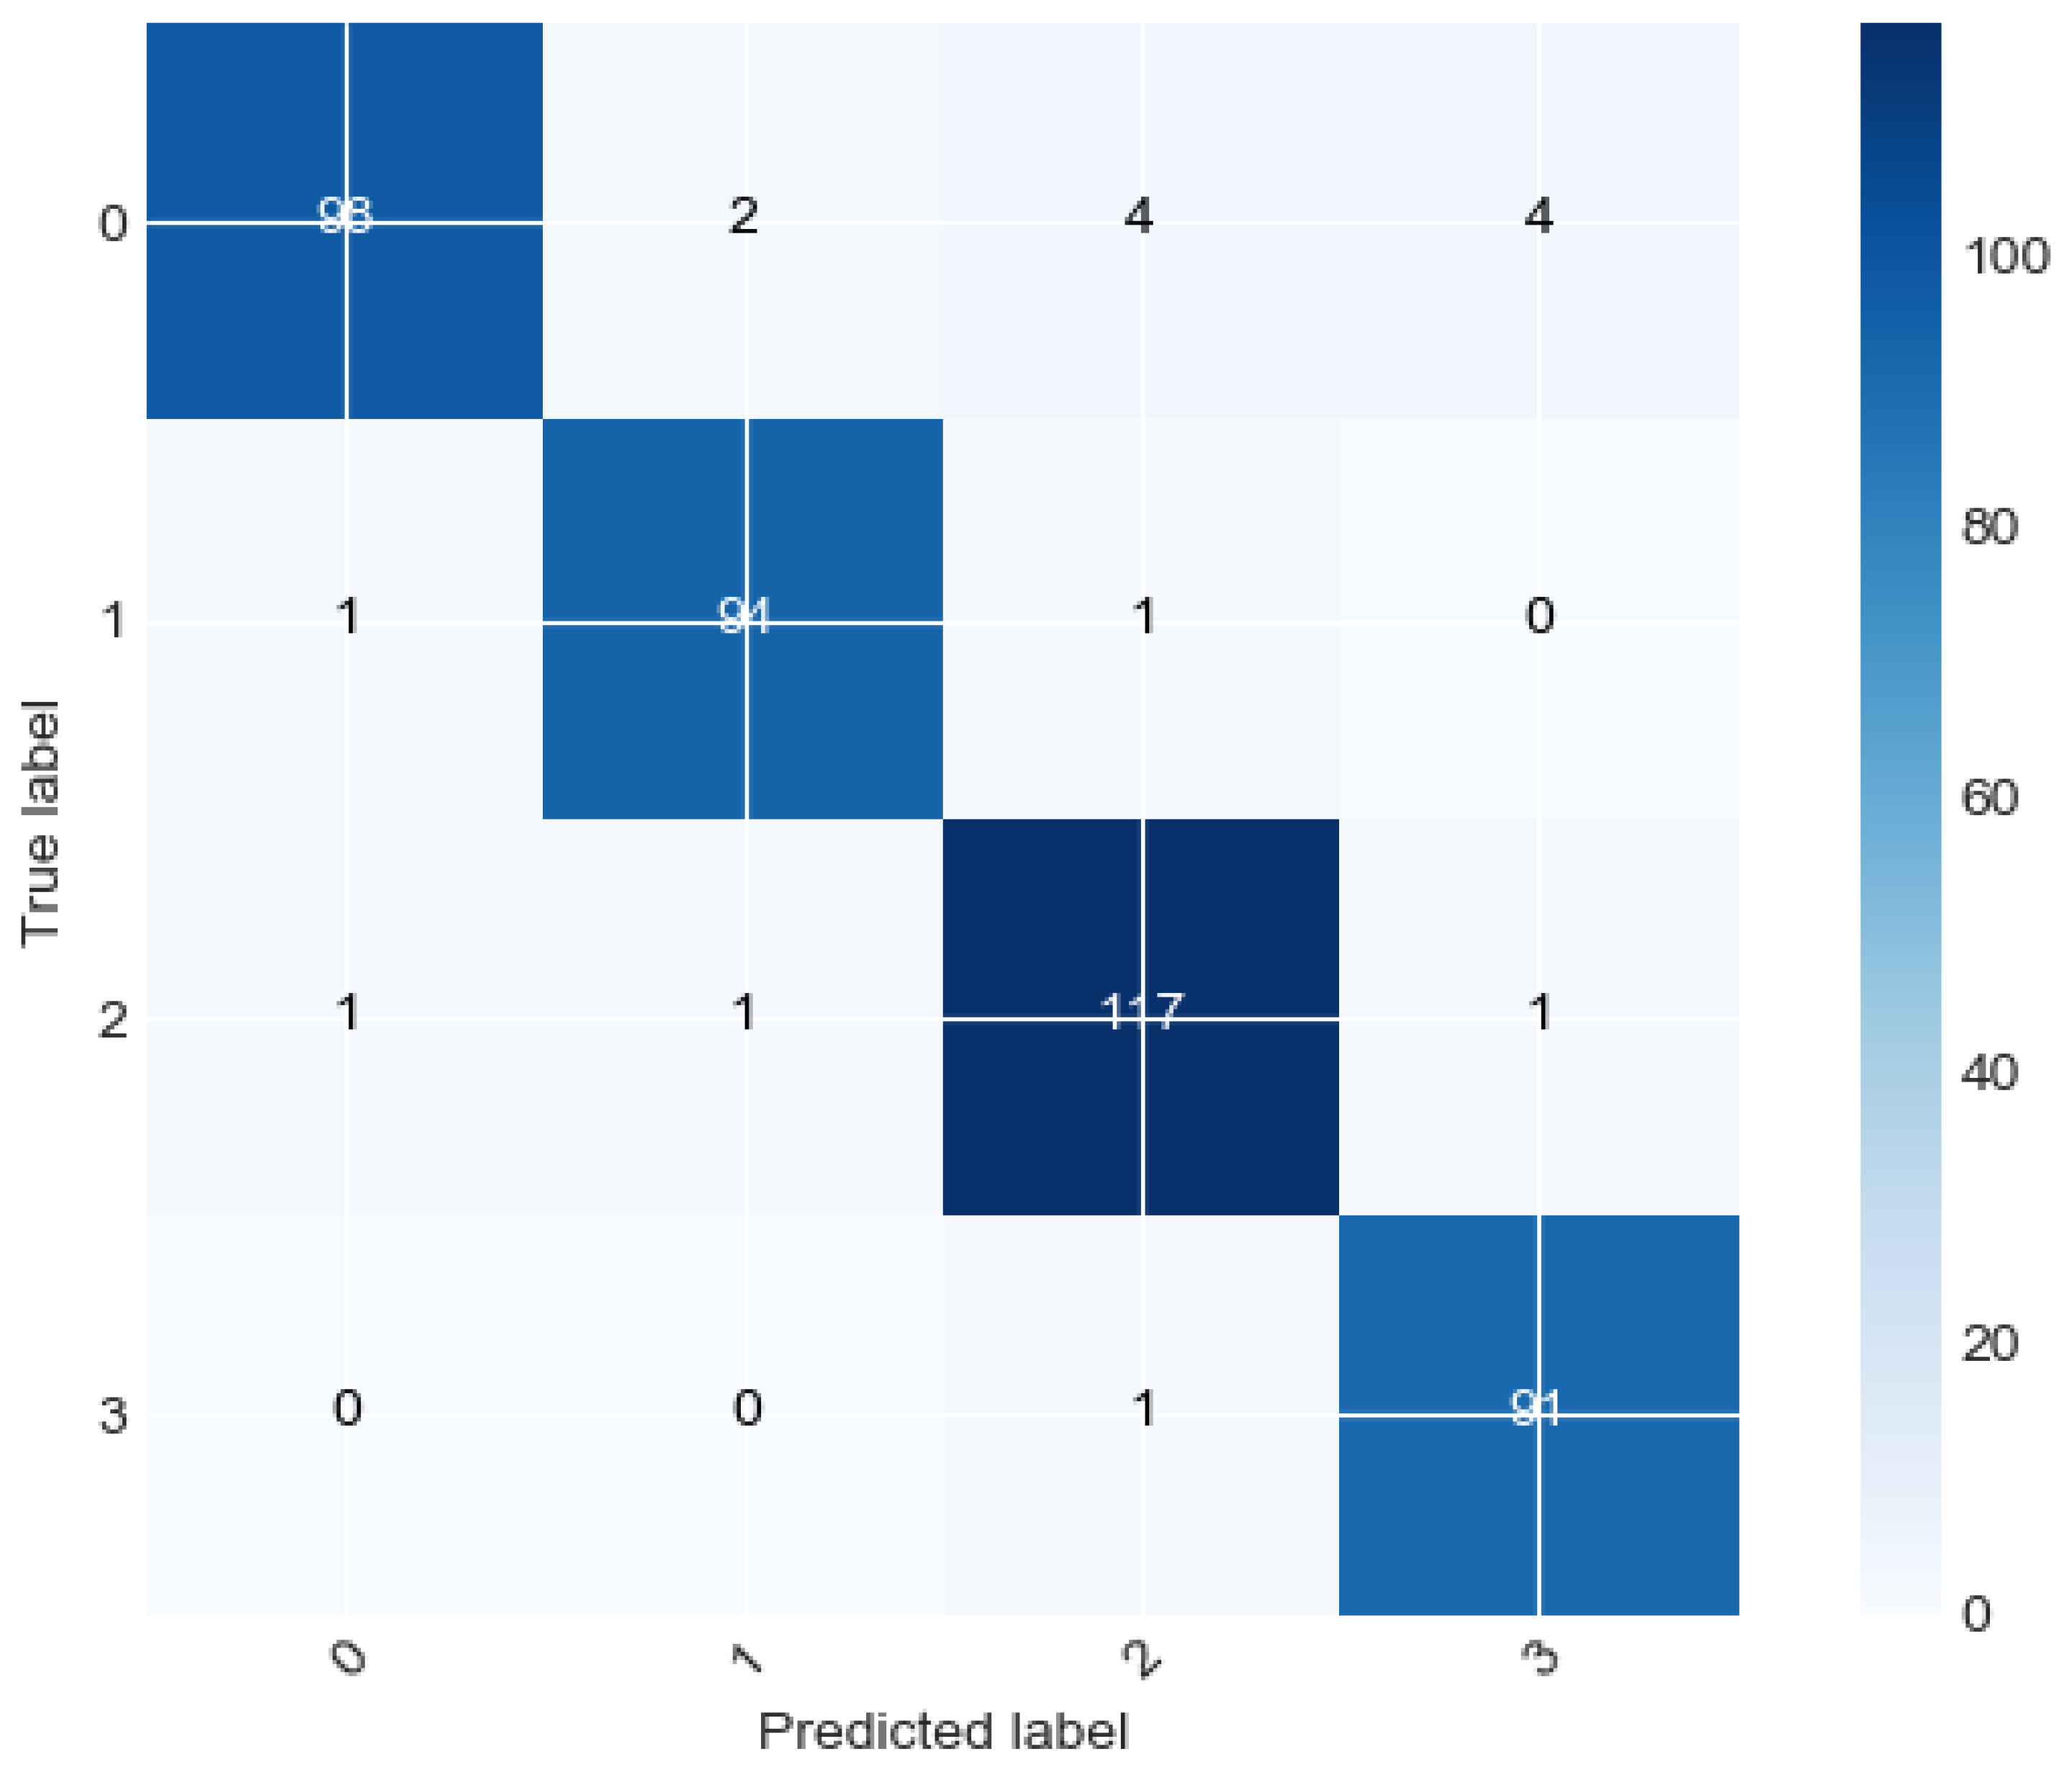
The conducted training process lasted 100 epochs, the batch size was 20 and the decaying learning rate was 0.001 at the start. The 1D CNN model was developed in Python 3.7.5 using Keras library with Tensorflow version 2.1 as the backend. To accelerate the computation, we set up the GPU (graphics processing unit) support with Nvidia CUDA (Compute Unified Device Architecture) version 10.1.
Data preprocessing and classification of 520 labeled recordings was run on the Nvidia GTX 1060 with 6 GB of VRAM (Video RAM) and training the proposed model for 100 epochs took circa 10–15 min. The source code of classifier was made publicly available at IEEE DataPort [29].

3. Results

This section provides and describes the results of classification of four analyzed driving scenarios registered in 520 labeled recordings using 1D CNN.
The accuracy on the training set was 99.8% on and 95.6% on the validation set. The performance of the training process was presented as the learning curves and the decaying learning rate curve on Figure 8, Figure 9 and Figure 10.
The accuracy curve shows the correctness of the model’s performance among the epochs. Both train and test accuracy achieved high values (above 90%) after circa 40 epochs.
The loss function is the sum of errors made after each epoch. After circa 40 iterations, loss stabilizes (circa 0 for training set and below 0.2 for validation set).
Figure 10 shows how the learning rate was changed among iterations. In this case, the learning rate was halved after five epochs if the validation loss did not decrease.
The performance of the proposed classifier is presented in the form of confusion matrix (Figure 11) and receiver operating characteristic (ROC) curves for each activity (see Figure 12).
The confusion matrix presents the numbers of cases classified to a specific group (predicted label) in comparison with their real classification (true label). The correctness of the classification is as follows:
  • for parking—ten out of 108 signals were classified incorrectly (two as driving through a roundabout, four as driving in city traffic and four as driving through an intersection);
  • for driving through a roundabout—two out of 96 signals were classified incorrectly (one as parking and one as driving in city traffic);
  • for driving in city traffic—three out of 120 signals were classified incorrectly (as one of each group);
  • for driving through an intersection—one out of 92 signals was classified incorrectly (as driving in city traffic).
Based on the confusion matrix, the following parameters (adapted for multi-category classification) were calculated:
  • Precision is the proportion of positive samples out of the retrieved samples (true positive and false positive).
    P r e c i s i o n = T r u e P o s i t i v e T r u e P o s i t i v e + F a l s e P o s i t i v e
  • Recall (sensitivity) measures how accurate is the model within all the positive samples.
    R e c a l l = T r u e P o s i t i v e T r u e P o s i t i v e + F a l s e N e g a t i v e
  • F1 score—combination of the two aforementioned metrics which rises when both precision and recall increases.
    F 1 S c o r e = 2 × P r e c i s i o n × R e c a l l P r e c i s i o n + R e c a l l
The calculated values of aforementioned metrics are presented in the Table 1.
The highest precision was obtained for parking (0.98), the highest recall was obtained for driving through a roundabout and driving through and intersection (0.98 in both cases) and the highest F1-score for driving through a roundabout. The lowest precision was obtained for city traffic, and the lowest recall and F1-score was obtained for parking.
The ROC curve measures the capability of distinguishing given classes by the analyzed model and is presented as true positive rate to false positive rate. With the multi-class problem, we measure this ratio for each single category against all the other categories [37]. The receiver operator characteristic curve shows that the created model was well trained, without overfitting and underfitting. It also shows that there are no unbalanced ratios between true positives and false positives, which again leads to the conclusion that the model was not biased.
Based on the confusion matrix and ROC curve, we can observe that most of the misclassified samples belong to the parking activity (see Figure 11). The reason is the fact that parking can be performed in different ways (angle, perpendicular, parallel) and is also associated with frequent movement of head and eyeballs reflected in the EOG signal. However, the EOG signals linked to parking may resemble the other activities, such as driving on a roundabout.

4. Discussion

We built the classifier of driver’s activity based on 1D CNN. Its accuracy was 99.8% on the training set and 95.6% on the validation set. The accuracy of our classifier is higher than in other studies, especially:
  • Doniec et al.’s study, which used BFS approach with 2-fold cross validation on seven activities (62% driving on a highway, parking in front, parallel parking, slope parking, driving around a roundabout, driving in city traffic, driving in residential traffic) and four activities (85% for driving on a freeway, city traffic, parking, driving in a residential area) [17];
  • Jiang et al. study which used k-nearest neighbors (kNN) and SVM classifying approach on signals from wearable devices (90%) [38];
  • Vora et al.’s study which used driver’s eye tracking in video recording and CNN-based classifier (95.2%) [25];
  • Galarza et al.’s study, which used a video recording of the driver’s face, statistical model and Google API-based classifier (93.37%) [39];
  • Mulhall et al.’s study, which used binary logistic regression for recognition of lane departures (73%) and microsleeps (96%) during driving in real road conditions [40].
This classifier has proven its high accuracy in classifying four driving scenarios (parking, driving through a roundabout, driving in city traffic and driving through an intersection). Its inherent ability to capture non-linear patterns in the sensor data makes 1D CNN a powerful tool in processing biologically related signals. The main drawback of this approach is the fact that it needs a fixed size input. The performance of 1D CNN deep learning model is at least 14%, better than BFS approach with soft assignment to specific configurations for the same data set. The results obtained for both data sets (training and validation sets) emphasize two points: the superiority of automatically learned functions over manually created ones used in [17], and the stability of 1D CNN deep learning architectures.
The type of dominant features fed to the classifier in [17] depend on the size of the sliding window and the BFS entropy of the extracted data frames. Moreover, the 1D CNN model is among the most efficient methods, which underlines the stability of this model and suggests its good ability to generalize on various data sets [41], including medical data [33]. The accuracy of studies on the drivers’ behavior was based on monitoring one or two signals; the accuracy ranged from 60% to 80% [42].
In this study, we have proven the feasibility of driver’s activity recognition based solely on EOG data, regardless of his/her experience and style of driving, which can be determined based on accelerometer and gyroscope data. Therefore, this approach may be applied to numerous real-world scenarios, such as building a system that may help improve the driving skills and driving safety, especially in smart vehicles.
Due to the increasing number of vehicles on roads, changing the paradigm of the driver training process is necessary to prevent the growth of road accidents and fatalities. The opportunity to measure the drivers’ perception can provide valuable insight into drivers’ attention. Accurate and inexpensive driver assistant systems may help encourage safe driving. However, real-time monitoring of behavior and driving conditions imposes technical challenges and the need for monitoring the state of the driver, especially dizziness caused by long trips, extreme changes in lighting, reflections of the glasses or the weather conditions on the road.
In future, we will address the limitations of our study: the need of providing fixed-sized input signals and misclassification of some recordings linked to parking activity. We propose developing a variable-size model which will operate on global pooling instead of a flatten layer to overcome the first limitation. With that approach, we may propose a new method of determining the length of the input vector based on the information from additional sensors. To overcome the second limitation, we propose differentiating variants of parking and providing more robust architecture. Although we achieved satisfactory results with 1D CNN, we consider ensemble classifiers or multi-input deep learning models for recognizing a wider range of activities in the long term.

Supplementary Materials

The research data are available online at IEEE DataPort: https://dx.doi.org/10.21227/q163-w472.

Author Contributions

Conceptualization: R.J.D. and S.S.; Investigation: R.J.D. and K.M.-P.; Methodology: R.J.D., S.S. and K.M.D.; Writing—Original Draft Preparation: R.J.D., S.S. and N.J.P.; Writing—Review & Editing: R.J.D., S.S., K.M.D., N.J.P. and E.J.T.; Validation: K.M.D.; Visualization, K.M.D.; Supervision, E.J.T. All authors have read and agreed to the published version of the manuscript.

Funding

This research received no external funding.

Acknowledgments

We would like to thank the volunteers who participated in the study and the driving school for providing the opportunity to acquire signals on learner drivers. We also would like to thank the reviewers for useful comments.

Conflicts of Interest

The authors declare no conflict of interest.

Ethical Statements

The study was conducted in accordance with the Declaration of Helsinki, and the protocol was approved by the Bioethics Committee of the Medical University of Silesia on 16 October 2018 (KNW/0022/KB1/18).

Abbreviations

The following abbreviations are used in this manuscript:
1DOne-dimensional
2DTwo-dimensional
BFSBest fit sequence[s]
CNNConvolutional neural network
CUDACompute unified device architecture
ECGElectrocardiogram
EEGElectroencephalogram
EOGElectrooculography
GANGenerative adversarial network
GPUGraphics processing unit
IMUInertial measurement unit
kNNK-nearest neighbors
LSTMLong short-term memory
MARSMasking action relevant stimuli
RNNRecurrent neural network
ReLURectified linear unit
ROCReceiver operating characteristic
SVMSupport vector machine
VRAMVideo RAM

References

  1. Salvucci, D.D. Modeling Driver Behavior in a Cognitive Architecture. Hum. Factors 2006, 48, 362–380. [Google Scholar] [CrossRef] [PubMed] [Green Version]
  2. Braunagel, C.; Geisler, D.; Rosenstiel, W.; Kasneci, E. Online Recognition of Driver-Activity Based on Visual Scanpath Classification. IEEE Intell. Transp. Syst. Mag. 2017, 9, 23–36. [Google Scholar] [CrossRef]
  3. Bulling, A.; Ward, J.A.; Gellersen, H.; Tröster, G. Eye movement analysis for activity recognition. In Proceedings of the 11th International Conference on Ubiquitous Computing, Orlando, FL, USA, 30 September–3 October 2009; pp. 41–50. [Google Scholar] [CrossRef] [Green Version]
  4. Bulling, A.; Ward, J.A.; Gellersen, H.; Troster, G. Eye movement analysis for activity recognition using electrooculography. IEEE Trans. Pattern Anal. Mach. Intell. 2011, 33, 741–753. [Google Scholar] [CrossRef] [PubMed]
  5. Huda, K.; Hossain, M.S.; Ahmad, M. Recognition of reading activity from the saccadic samples of electrooculography data. In Proceedings of the 2015 International Conference on Electrical Electronic Engineering (ICEEE), Rajashi, Bangladesh, 4–6 November 2015; pp. 73–76. [Google Scholar] [CrossRef]
  6. D’Souza, S.; Natarajan, S. Recognition of EOG based reading task using AR features. In Proceedings of the International Conference on Circuits, Communication, Control and Computing (I4C), Bangalore, India, 20–22 November 2014; pp. 113–117. [Google Scholar] [CrossRef]
  7. Xing, Y.; Lv, C.; Wang, H.; Cao, D.; Velenis, E.; Wang, F.Y. Driver Activity Recognition for Intelligent Vehicles: A Deep Learning Approach. IEEE Trans. Veh. Technol. 2019, 68, 5379–5390. [Google Scholar] [CrossRef] [Green Version]
  8. Sigari, M.H.; Pourshahabi, M.R.; Soryani, M.; Fathy, M. A Review on Driver Face Monitoring Systems for Fatigue and Distraction Detection. Int. J. Adv. Sci. Technol. 2014, 64, 73–100. [Google Scholar] [CrossRef]
  9. Niwa, S.; Yuki, M.; Noro, T.; Shioya, S.; Inoue, K. A Wearable Device for Traffic Safety—A Study on Estimating Drowsiness with Eyewear, JINS MEME; SAE Technical Paper Series; SAE International: Detroit, MI, USA, 2016. [Google Scholar] [CrossRef]
  10. Joseph, D.P.; Miller, S.S. Apical and basal membrane ion transport mechanisms in bovine retinal pigment epithelium. J. Physiol. 1991, 435, 439–463. [Google Scholar] [CrossRef]
  11. Lagodzinski, P.; Shirahama, K.; Grzegorzek, M. Codebook-based electrooculography data analysis towards cognitive activity recognition. Comput. Biol. Med. 2017, 95. [Google Scholar] [CrossRef]
  12. Grzegorzek, M. Sensor Data Understanding; Logos Verlag Berlin GmbH: Berlin, Germany, 2017. [Google Scholar]
  13. Shirahama, K.; Köping, L.; Grzegorzek, M. Codebook Approach for Sensor-Based Human Activity Recognition. In Proceedings of the 2016 ACM International Joint Conference on Pervasive and Ubiquitous Computing: Adjunct, UbiComp ’16, Heidelberg, Germany, 12–16 September 2016; Association for Computing Machinery: New York, NY, USA, 2016; pp. 197–200. [Google Scholar] [CrossRef]
  14. JINS MEME. JINS MEME Glasses Specifications. Available online: https://www.cnet.com/reviews/jins-meme-preview/ (accessed on 17 June 2020).
  15. Braunagel, C.; Kasneci, E.; Stolzmann, W.; Rosenstiel, W. Driver-activity recognition in the context of conditionally autonomous driving. In Proceedings of the 2015 IEEE 18th International Conference on Intelligent Transportation Systems (ITSC), Las Palmas, Spain, 15–18 September 2015; pp. 1652–1657. [Google Scholar] [CrossRef]
  16. Khushaba, R.N.; Kodagoda, S.; Lal, S.; Dissanayake, G. Driver drowsiness classification using fuzzy wavelet-packet-based feature-extraction algorithm. IEEE Trans. Biomed. Eng. 2011, 58, 121–131. [Google Scholar] [CrossRef] [Green Version]
  17. Doniec, R.; Sieciński, S.; Piaseczna, N.; Mocny-Pachońska, K.; Lang, M.; Szymczyk, J. The Classifier Algorithm for Recognition of Basic Driving Scenarios. In Information Technology in Biomedicine; Piętka, E., Badura, P., Kawa, J., Więcławek, W., Eds.; Springer: Cham, Switzerland, 2020; pp. 359–367. [Google Scholar] [CrossRef]
  18. Stapel, J.; Hassnaoui, M.E.; Happee, R. Measuring Driver Perception: Combining Eye-Tracking and Automated Road Scene Perception. Hum. Factors J. Hum. Factors Ergon. Soc. 2020. [Google Scholar] [CrossRef]
  19. Gao, Z.K.; Li, Y.L.; Yang, Y.X.; Ma, C. A recurrence network-based convolutional neural network for fatigue driving detection from EEG. Chaos Interdiscip. J. Nonlinear Sci. 2019, 29, 113126. [Google Scholar] [CrossRef]
  20. Karuppusamy, N.S.; Kang, B.Y. Multimodal System to Detect Driver Fatigue Using EEG, Gyroscope, and Image Processing. IEEE Access 2020, 8, 129645–129667. [Google Scholar] [CrossRef]
  21. Jiao, Y.; Deng, Y.; Luo, Y.; Lu, B.L. Driver sleepiness detection from EEG and EOG signals using GAN and LSTM networks. Neurocomputing 2020, 408, 100–111. [Google Scholar] [CrossRef]
  22. Shin, J.; Kim, S.; Yoon, T.; Joo, C.; Jung, H.I. Smart Fatigue Phone: Real-time estimation of driver fatigue using smartphone-based cortisol detection. Biosens. Bioelectron. 2019, 136, 106–111. [Google Scholar] [CrossRef] [PubMed]
  23. Gao, Z.; Wang, X.; Yang, Y.; Mu, C.; Cai, Q.; Dang, W.; Zuo, S. EEG-Based Spatio–Temporal Convolutional Neural Network for Driver Fatigue Evaluation. IEEE Trans. Neural Networks Learn. Syst. 2019, 30, 2755–2763. [Google Scholar] [CrossRef]
  24. Najafabadi, M.M.; Villanustre, F.; Khoshgoftaar, T.M.; Seliya, N.; Wald, R.; Muharemagic, E. Deep learning applications and challenges in big data analytics. J. Big Data 2015, 2. [Google Scholar] [CrossRef] [Green Version]
  25. Vora, S.; Rangesh, A.; Trivedi, M.M. Driver Gaze Zone Estimation Using Convolutional Neural Networks: A General Framework and Ablative Analysis. IEEE Trans. Intell. Veh. 2018, 3, 254–265. [Google Scholar] [CrossRef]
  26. Act of 5 January 2011 on Vehicle Drivers. Journal of Laws of the Republic of Poland (Dz.U. 2011 nr 30 poz. 151). Available online: http://prawo.sejm.gov.pl/isap.nsf/DocDetails.xsp?id=WDU20110300151 (accessed on 24 November 2020).
  27. Act of 6 September 2001 on the road traffic. Journal of Laws of the Republic of Poland (Dz.U. 1997 nr 28 poz. 152). Available online: http://isap.sejm.gov.pl/isap.nsf/download.xsp/WDU20011251371/U/D20011371Lj.pdf (accessed on 24 November 2020).
  28. Regulation of the Minister of Infrastructure of 28 June 2019 on Examining Applicants for Driving Licenses, Training, Examining and Obtaining Qualifications by Examiners and Samples of Documents Used in These Matters. Journal of Laws of the Republic of Poland (Dz.U. 2019 poz. 1206). Available online: http://isap.sejm.gov.pl/isap.nsf/DocDetails.xsp?id=WDU20190001206 (accessed on 24 November 2020).
  29. Doniec, R.; Duraj, K.; Mocny-Pachońska, K.; Piaseczna, N.; Sieciński, S.; Tkacz, E. Drivers’ Activity Tracking With JINS MEME Smart Glasses. 2020. Available online: https://ieee-dataport.org/documents/drivers-activity-tracking-jins-meme-smart-glasses (accessed on 24 November 2020).
  30. Van Leeuwen, P.M.; de Groot, S.; Happee, R.; de Winter, J.C.F. Differences between racing and non-racing drivers: A simulator study using eye-tracking. PLoS ONE 2017, 12, e0186871. [Google Scholar] [CrossRef] [Green Version]
  31. Philipp, G.; Song, D.; Carbonell, J.G. The exploding gradient problem demystified—Definition, prevalence, impact, origin, tradeoffs, and solutions. arXiv 2017, arXiv:1712.05577. [Google Scholar]
  32. Kiranyaz, S.; Ince, T.; Abdeljaber, O.; Avci, O.; Gabbouj, M. 1-D Convolutional Neural Networks for Signal Processing Applications. In Proceedings of the ICASSP 2019—2019 IEEE International Conference on Acoustics, Speech and Signal Processing (ICASSP), Brighton, UK, 12–17 May 2019; pp. 8360–8364. [Google Scholar] [CrossRef]
  33. Amiri, P.; Abbasi, H.; Derakhshan, A.; Gharib, B.; Nooralishahi, B.; Mirzaaghayan, M. Potential Prognostic Markers in the Heart Rate Variability Features for Early Diagnosis of Sepsis in the Pediatric Intensive Care Unit using Convolutional Neural Network Classifiers. In Proceedings of the 2020 42nd Annual International Conference of the IEEE Engineering in Medicine & Biology Society (EMBC), Montreal, QC, Canada, 20–24 July 2020; pp. 1031–1034. [Google Scholar] [CrossRef]
  34. Zubarev, I.; Zetter, R.; Halme, H.L.; Parkkonen, L. Adaptive neural network classifier for decoding MEG signals. NeuroImage 2019, 197, 425–434. [Google Scholar] [CrossRef]
  35. Yamashita, R.; Nishio, M.; Do, R.K.G.; Togashi, K. Convolutional neural networks: An overview and application in radiology. Insights Imaging 2018, 9, 611–629. [Google Scholar] [CrossRef] [Green Version]
  36. Srivastava, N.; Hinton, G.; Krizhevsky, A.; Sutskever, I.; Salakhutdinov, R. Dropout: A Simple Way to Prevent Neural Networks from Overfitting. J. Mach. Learn. Res. 2014, 15, 1929–1958. [Google Scholar] [CrossRef]
  37. Kumar, R.; Indrayan, A. Receiver operating characteristic (ROC) curve for medical researchers. Indian Pediatr. 2011, 48, 277–287. [Google Scholar] [CrossRef] [PubMed]
  38. Jiang, L.; Lin, X.; Liu, X.; Bi, C.; Xing, G. SafeDrive: Detecting Distracted Driving Behaviors Using Wrist-Worn Devices. Proc. ACM Interact. Mob. Wearable Ubiquitous Technol. 2018, 1, 144:1–144:22. [Google Scholar] [CrossRef]
  39. Galarza, E.E.; Egas, F.D.; Silva, F.M.; Velasco, P.M.; Galarza, E.D. Real Time Driver Drowsiness Detection Based on Driver’s Face Image Behavior Using a System of Human Computer Interaction Implemented in a Smartphone. In Proceedings of the International Conference on Information Technology & Systems (ICITS 2018), Libertad City, Ecuador, 10–12 January 2018; Rocha, Á., Guarda, T., Eds.; Springer: Cham, Switzerland, 2018; pp. 563–572. [Google Scholar] [CrossRef]
  40. Mulhall, M.D.; Cori, J.; Sletten, T.L.; Kuo, J.; Lenné, M.G.; Magee, M.; Spina, M.A.; Collins, A.; Anderson, C.; Rajaratnam, S.M.; et al. A pre-drive ocular assessment predicts alertness and driving impairment: A naturalistic driving study in shift workers. Accid. Anal. Prev. 2020, 135, 105386. [Google Scholar] [CrossRef] [PubMed]
  41. Li, F.; Shirahama, K.; Nisar, M.; Köping, L.; Grzegorzek, M. Comparison of Feature Learning Methods for Human Activity Recognition Using Wearable Sensors. Sensors 2018, 18, 679. [Google Scholar] [CrossRef] [PubMed] [Green Version]
  42. Choi, M.; Koo, G.; Seo, M.; Kim, S.W. Wearable Device-Based System to Monitor a Driver’s Stress, Fatigue, and Drowsiness. IEEE Trans. Instrum. Meas. 2018, 67, 634–645. [Google Scholar] [CrossRef]
Figure 1. Experiment setup. The driver (left) is wearing JINS smart glasses connected to the computer (foreground) while recording the signals.
Electronics 09 02002 g001
Figure 2. The test route chosen for the study (map data: Google).
Electronics 09 02002 g002
Figure 3. Bird’s eye view of two roundabouts: (a) small roundabout (the diameter of circle island: 20 m); (b) large roundabout (the diameter of circular island: 54 m). Map and satellite images: Google, CNES, Airbus, Maxar Technologies, 2020.
Electronics 09 02002 g003
Figure 4. Bird’s eye view of the public parking lots at the Artura Street in Radzionków, Poland (map and satellite image: Google, CNES, Airbus, Maxar Technologies, 2020).
Electronics 09 02002 g004
Figure 5. Number of samples in each category in training set.
Electronics 09 02002 g005
Figure 6. Number of samples in each category in validation set.
Electronics 09 02002 g006
Figure 7. Architecture of the proposed 1D convolutional neural network (CNN) model generated by Keras and graphviz. None is the variable batch size.
Electronics 09 02002 g007
Figure 8. Accuracy of the proposed 1D CNN model.
Electronics 09 02002 g008
Figure 9. Loss of the proposed 1D CNN model.
Electronics 09 02002 g009
Figure 10. Learning rate decay.
Electronics 09 02002 g010
Figure 11. Confusion matrix of the classifier.
Electronics 09 02002 g011
Figure 12. Precision recall curves of the classifier.
Electronics 09 02002 g012
Table 1. The performance of the classification of four driving scenarios.
CategoryPrecisionRecallF1-Score
0—parking0.980.9070.942
1—roundabout0.970.980.97
2—city traffic0.950.9750.96
3—intersection0.950.980.968
Publisher’s Note: MDPI stays neutral with regard to jurisdictional claims in published maps and institutional affiliations.

