Abstract
A model for detecting unauthorized Apps use events by combined analysis of situation information in an offline service and user behavior in an online environment is proposed. The detection and response to abnormal behavior in the O2O service environment can be focused on providers, whose decisions change dynamically based on the offline market status and conditions. However, the method for identifying the user’s tools and detecting the usage pattern of the service user were developed in the existing online service environment. Thus, in order to identify abnormal behavior in the O2O service environment, we conducted an experiment to identify the abnormal behavior of providers of smart mobility services, a representative O2O service. In the experiment, the range of normal behavior of a taxi drivers was identified, which was prepared on the basis of the test result directly executed by an expert. The optimal features were selected in order to effectively detect abnormal behavior from the event data relating to the service call acceptance behavior. In addition, by processing the collected data based on the selected features by using various machine-learning classification algorithms, we derived a detection and prediction model that is 98.28% accurate with a prediction result of more than 74% based on the F1 score. Based on these results, we expect to be able to respond to abnormal behavior that may occur in various types of O2O services.
1. Introduction
As the service connection environment between providers and users is moving from offline to online, the online to offline (O2O) service market has grown rapidly. However, this change in the service environment encourages the use of abnormal methods and appears to be harmful to fair market competition. Thus, to ensure the healthy growth of the industry in the future, it is necessary to remove and control harmful factors in advance by actively responding to negative factors that may appear, along with industry growth.
The way we move is transforming because of ICT technology, especially mobility services, for which significant growth is expected in the O2O service market in the near future. The Mobility as a Service (MaaS) market is projected to grow at a Compound Annual Growth Rate (CAGR) of 31.7% from 2020 to 2030, and the market size is expected to grow from USD 6.8 billion in 2020 to USD 106.8 billion by 2030 [1].
A variety of on-demand ride services, such as Uber, Lyft, Grab, and Didi, are growing into future intelligent movement services as a result of the convergence of smart mobile devices and transportation services. The smartphone has continued to push the boundaries of online and offline businesses. Because of the smartphone, we have an always-on environment that enables us to use services online and provides the basis for the development of real-time O2O services. The Smart Mobility service is a typical on-demand O2O service, which has become possible, owing to disruptive technologies and the generalization of smartphone usage.
The convergence of smart devices and transportation services as on-demand ride services with a high degree of freedom among the mobility services that we use in our daily lives is exemplified by the taxi-hailing service. This service is an on-demand ride service in the O2O market, and the service environment has also been changed rapidly by the companies that provide the taxi-hailing service platform. The way in which we take a taxi on the road is moving forward to a smart mobility environment because of convenience and efficiency. The typical taxi calling service by way of phone calls has been useful to connect passengers with a taxi driver, but it is evolving into a taxi-hailing service using smartphone applications. This change has shifted from a business, in which taxi drivers increasingly drive around to search for passengers, to an “on-call” business in which the taxi moves to the location of departure in response to calls from passengers. Figure 1 shows the movement within the taxi service environment.
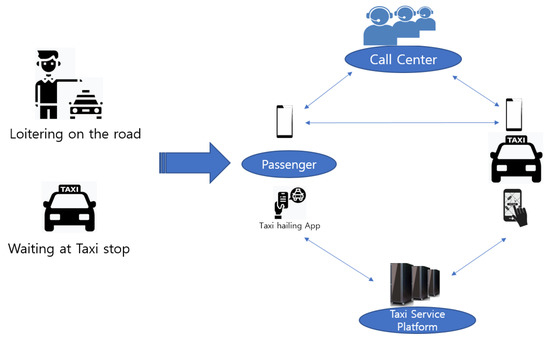
Figure 1.
Movement within the taxi service environment.
Accessibility, credibility, and comfort are the benefits of taking a taxi by using the taxi-hailing service [2].
(1) Accessibility: nobody wants to waste time waiting on the street, but it would be a typical way to take a taxi. However, using a taxi-hailing app on a smartphone would therefore save time and make it easier to take a taxi.
(2) Credibility: the provider of the taxi-hailing service platform could improve the service in order to ensure the credibility of the service. The taxi driver’s information could be registered, and the platform could provide real-time movement information managed by the provider of the service platform.
(3) Comfort: passengers would not have to explain the location of their point of departure and destination. This is one of the major advantages of using a taxi-hailing service.
The smartphone app could be used to call a taxi to the point of departure, and the taxi driver could respond to the call by using the driver’s app provided on the taxi-hailing service platform. Once the call matches the user and supplier, the taxi driver drives to the point of departure assisted by optimized navigation, after which the passenger can travel to the target location quickly and conveniently. The providers of taxi-hailing service platforms have been striving to provide travelers with convenience and efficiency and provide taxi drivers with opportunities to earn more income as suppliers. Nevertheless, competition among taxi drivers intensifies because of the imbalance between supply and demand during times when demand is concentrated in the commuting time. Under these circumstances, taxi drivers are trying to use unauthorized methods in order to earn more money.
Organization of the Paper
In Section 2, we explain the reason to use unauthorized programs that were not provided by taxi service platform providers. We review related works pertaining to several similar markets, as discussed in Section 3. The explanation of automated program apps for taxi drivers is presented in Section 4. An analysis of the call acceptance event data of the taxi drivers for identifying unauthorized program users is presented in Section 5. In Section 6, we discuss our findings and limitation. Finally, we conclude the paper in Section 7.
2. Background
In the taxi-hailing service market, there is an increasing situation that threatens the trust and fairness of the service by not following the procedures and methods that are offered by taxi service platform companies. This is because providing a service when the demand and supply are unbalanced, such as during commuting time or late at night is considered disadvantageous. Taxi services can only be provided by those authorized by the state or an administrative agency, but the growth of the taxi operation environment and industry is dependent on the market conditions [3]. A smartphone-based taxi-hailing platform service quickly matches passengers wishing to hail a taxi with taxi drivers who can provide the service. Consequently, the platform provides taxi drivers with opportunities to streamline their operations and grow their profits by minimizing their driving and waiting times, which are often disengaged. However, the current mobility service market is characterized by many conflicts in the taxi-hailing service market, because of the decrease in income resulting from competition among various shared mobility services [4,5]. According to the Korean transportation report [6], citizens of Seoul spend an average of 41.8 min to travel to work and 54.6 min. to travel home after work. Korea’s commuting time is the highest among the Organization for Economic Cooperation and Development (OECD) countries.
People who use public transportation to commute in cities prefer taxis as a more convenient and faster way of transportation. In particular, in places where taxi fares are inexpensive, and the IT environment is developed, such as in Seoul, the proportion of taxi calls using smartphones is increasing. As of December 2018, the number of taxis operating in Korea was 252,254 [7], and the sales generated by the taxi service market in 2018 was approximately 7.1 billion dollars [8]. The total cost of operating the taxis was approximately 4.8 billion dollars, which was proportional to the driving distance and time, but it excluded the cost of fuel of approximately 22.6%, insurance premium of 5.7%, and other maintenance costs of 21.2%. Taxi drivers’ annual income was approximately 56.2% of total sales. Expenses were approximately 16 thousand dollars (including labor costs), and monthly earnings were approximately 1.4 thousand dollars [9]. Therefore, taxi drivers with limited income are always trying to maximize their profits in a situation, in which an imbalance exists between supply and demand.
According to the Mobility Reporter [10] of 2018, the number of available taxis exceeds demand, excluding the rush hour and late-night hours, as shown Figure 2. Unfair competition among taxi drivers. The providers of the taxi-hailing service platform are making efforts to improve service efficiency and enhance the career value for taxi drivers by increasing their income and by balancing the supply by using high-tech dispatch algorithms. Despite these changes and efforts, many passengers still feel that the availability of taxis remains insufficient during the rush hour and at night.
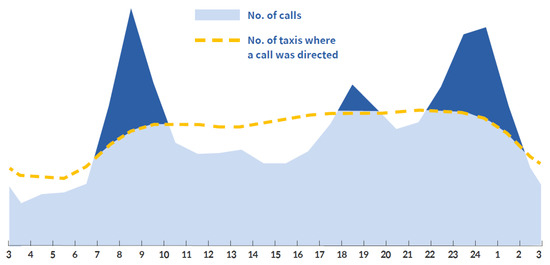
Figure 2.
Time-based taxi supply and demand in the Seoul metropolitan area in 2018 [10].
In the taxi-hailing service, the users as passengers and suppliers as drivers are the relationship between demand and supply. The imbalance between the demand and supply of the taxi-hailing service market is evident from the increase in the use of unauthorized apps, such as macro-program apps that are used in an attempt to maximize earnings. In the midst of demand and supply imbalances, certain taxi drivers try to use unauthorized apps in order to enable them to automatically select only those calls that have preferred conditions or even without certain conditions to maximize profits. This type of behavior by taxi drivers can negatively affect fair competition in the taxi service market. Therefore, the taxi-hailing service providers who provide the service platforms are considering enhancing the service environment to enable smart and efficient movement based on fairness and trust. In this regard, the providers of the taxi-hailing service platforms are continuously trying to resolve the underlying imbalances in taxi demand and supply.
2.1. Profit Structure for Taxi Drivers
Taxi drivers earn profits through taxi driving if the dispatch successfully culminates in the collection of people wishing to travel by road or responding to the user’s call. At that time, in order to maximize the taxi drivers’ profits, it is necessary to increase the actual driving earnings and minimize the actual driving costs as well as the costs that are associated with dispatch preparation.
Equation (1) is used in order to calculate the taxi driver’s net income N(i). In this equation, the net income is the driving profit DP(i), excluding the real cost for driving RC(i), call dispatch preparation cost PC(i), and maintenance cost (approximately 25% of the driving profit) MC(DP(i) × 0.25). The difference between the driving profit DP(i) and the real cost of driving RC(i) is the actual driving profit. The real cost of driving is determined by the time of driving TD(i), average profit per time AT(i), and fuel costs FC(i). The call dispatch preparation cost PC(i) is the result of dividing the obtained result by multiplying the time for call ready TR(h) by the average profit per time and then adding the cost of fuel for dispatching by weight (0 ≤ W ≤ 1), which is based on the call frequency at the destination. The time for call ready is the sum of the waiting time for the call ready Wt(h) and the time that is spent traveling to the pick-up location St(h). However, we do not consider the weight in this study because of the limitation of data collection.
For example, if a taxi driver with an average hourly income of $20 travels for 30 min and earns $40 in driving revenue and spends $5 on fuel, the real cost for driving is $15 and the real driving revenue is $25. At this time, the taxi driver waited for 10 min. to receive the call, and the traveling time to collect the customer was 5 min., fuel expense was $1, and the customer was driven downtown where the weight of the destination is 1 in that the frequency of calls is the highest. In this case, the call dispatch preparation cost totals $6. Therefore, when considering the above conditions, a taxi driver can earn a net profit of $19 for one trip of 45 min. However, a subtraction of approximately 25% for maintenance costs, including for insurance and other vehicle maintenance expenses, leaves an actual net income of approximately $9 for the taxi driver.
Figure 3a shows the change in net income according to the waiting time until call accepting under the previously assumed operating conditions. It shows that if the driver waits for 40 minutes or more, the actual net income can be a deficit. Figure 3b shows the simulated result of net income according to the spending time to pick-up location instead of waiting time with the same condition as Figure 3a.
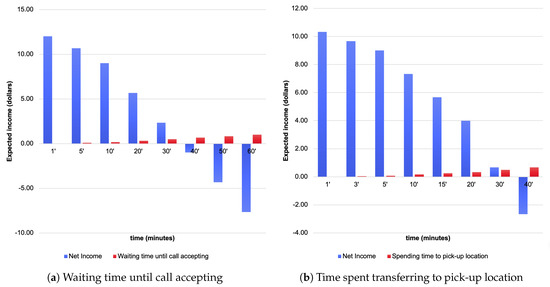
Figure 3.
Simulation of the income to determine the preferred conditions.
Figure 3 shows a simulated data graph of income that is based on the preferred conditions that are waiting time and spending time by Equation (1). The waiting time for call acceptance Figure 3a and time to relocate to the pick-up location Figure 3b are features that affect all of the dispatch preparation costs that arise while taxi drivers are driving or waiting in a specific area to receive a call from a customer. Once successfully matched with a user, they transfer to the departure location from which the user wishes to depart, depending on the location of the call. Transferring to the departure location of the call could incur traveling time and fuel costs, which reduces the opportunity to earn a profit. The results of the simulation Figure 3 indicate that a longer waiting time for call acceptance, and a longer time that is required to transfer to the departure location could reduce a taxi driver’s profits. Therefore, many taxi drivers are motivated to maximize profits by minimizing the call waiting time through fast call acceptance.
2.2. Survey of Taxi Drivers
A one-on-one questionnaire survey was conducted among taxi drivers in order to determine the actual conditions preferred by taxi drivers. The targets and survey period were 106 drivers, who were encountered while traveling in a taxi in Seoul and Gyeonggi province, from January to April 2020. Of the taxi drivers who responded to the survey, 32.1% and 67.9% were corporate and private taxi drivers, respectively.
Figure 4 shows the results of the survey among taxi drivers. The results indicated that the preferred conditions when accepting the requesting call was the distance to the passenger pick-up location (81.13%), the location of destination (75.47%), the unconditional acceptance (70.75%), and the estimated time spent transferring to the passenger pick-up location (66.04%). The four conditions that accounted for the most selection rate were found to have very high preferences for the conditions of acceptance.
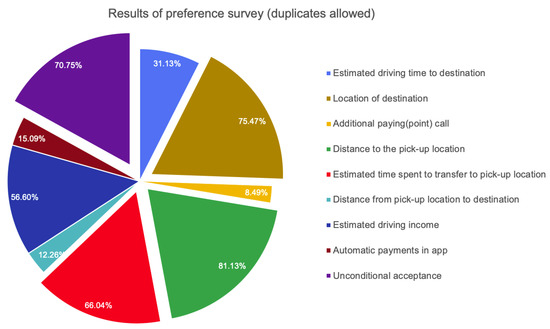
Figure 4.
Results of taxi driver survey.
The distance to the user’s departure location and the time that is required to reach the passenger’s location are highly correlated with each other. The reason for the preference based on distance instead of time which is informed in the taxi driver app is higher that is based on the driver’s experience (based on distance and location) rather than the time provided by the taxi service platform company, because it determines the actual travel time on which it depends. The next preferred condition from taxi drivers was the location of destination. we believe that long-distance driving could expect more taxi fare at one time and avoid wasting time to pick up the next passenger.
Unconditional acceptance was the third preferred condition from taxi drivers. This is believed to be the result of taxi drivers attempting to reduce the waiting time and increase profits by undertaking as many trips as possible, rather than covering the conditions by competing for the acceptance of calls as a result of an imbalance between supply and demand. In particular, it was found that the tendency to choose unconditional acceptance was higher when receiving calls in a homecoming situation or in an area where the frequency of calls is not high. The estimated time spent transferring to the passenger pick-up location was also preferred by taxi drivers. They know that a taxi driver should spend time and fuel cost until pick-up the passenger. Additionally, if the estimated time is long, then the cancellation of the taxi call could be a risk for the taxi driver, because they already paid to move to the pick-up location.
As an additional response, Estimated driving income (56.60%), Estimated driving time to destination (31.13%), Automatic payment in app (15.09%), Distance from pick-up location to destination (12.26%), and Additional paying (point) as tips call (8.49%) were answered from the survey.
3. Related Work
The use of computers in everyday life requires the development of automated programs. Programs, such as macro-programs, automatically accept input data and click events that continuously perform specific tasks on behalf of human users. A macro-program is “a program developed with the purpose of increasing user convenience and work efficiency by allowing the operations to be performed sequentially through the input of several commands in a computer environment with one keystroke operation” [11]. This characteristic of macro-programs provides the user with the opportunity to increase their profits by facilitating the selection of specific information, acquisition of game items, or preemption of tickets.
As for advertisement, game, and ticket services, services provided in the existing offline environment have changed to online as the Internet has developed. These services have optimal conditions for maximizing the utilization effect of macro-programs. The use of ‘macro’, an automated program in the online advertising market, Bot, which is known as automatic hunting and play program in the online game environment, and automated programs in the online ticket market, has increased. Many cases of unfair competition in various services based on online environments, such as online advertising, online games, and online ticketing, have emerged.
3.1. Relation to Advertising
Research on misbehavior methods in the online advertising market has been carried out for a long time. The effect of online advertising may differ from that of advertisers’ expectations. It is determined by inputting keywords through the keyboard and selecting actions while using a mouse, such as a case of manipulating public opinion through the registration of a large number of comments on the Internet [12], automatic clicking to generate high-ranking search terms, and using macro-programs for posting advertisements. An inaccurate online advertising market report that results from automated programs could seriously affect the interests of advertisers. Some vendors provide inaccurate information to advertisers about their advertising campaigns [13], and non-intentional traffic adversely affects both general analytics and predictive models [14]. The action of repeating the work of the keyboard and mouse using an automatic macro-program that uses a computer instead of a potential human customer directly distorts the value of the keywords traded in the online advertising market, thereby confusing the market and decreasing reliability.
In the online advertising environment, the reliability of the service greatly influences the market value because of the nature of online transactions, where the other party cannot be seen directly. This situation has led to various studies to detect macros to maintain the reliability of the online advertising market. In the online advertising market, weblogs have been used to understand consumer behavior, target advertising, and recommend sales products, as well as for classification and data-driven tasks. Research on automated programs in the online advertising market has mainly been based on mouse movement and click behavior, and user IP address and connection time information. By identifying and filtering the IP addresses of users and servers, the accuracy of identification for advertising users could be improved [15,16], analysis of traffic for a set of honeypot websites can be used for impression fraud, and, in particular, enables us to identify these users and servers [17]. Recent studies evaluated the efficiency of different vendors in the detection and filtering of fraud [18,19,20].
3.2. Relation to Online Gaming
Online games are designed and implemented with the expectation that the results of the games reflect the actions of humans, because people compete and play with each other in cyberspace. The superiority of gameplay varies according to the ability of game users, and the ecosystem of the game is maintained by providing a reward system of experience and items in proportion to the user’s effort and time. Using a macro-program, such as a bot, in an online game could result in unfair competition, because it has a much greater impact on the game in terms of experience and rewards with less consumption of time and energy when compared with human players. A bot could be the cause of the increase in complaints due to unfair circumstances in the case of competing human and computer programs and the collapse of the game balance by an automated program
The problem that is caused by unfairness in the online gaming environment has become an opportunity for active research on game bots, which are automated programs. In the online game service, the use of a game bot that can obtain experience points and desired game items more easily than normal game users is considered to be a type of hacking [21]. Widely used methods for detecting and blocking the participation of bots in games include actively monitoring a process [22] and using a CAPTCHA(Completely Automated Public Turing test to tell Computers and Humans Apart) [23]. Other approaches involve blocking automatic mouse macros, the prevention of memory debugging, server authentication [24], encryption of game clients [25], encryption of communication packets with the server, and identification of normal users and macros through the analysis of touch events [26], among others.
Using the play pattern of game log data [27,28] and identification by analyzing the keyboard log and mouse input information [29,30], the movement patterns in online games [31,32,33,34] were analyzed to respond to new bots. Machine learning detection models [35,36], using self-similarity, when considering the nature of game bots as main features were also studied. In addition, a study to detect game bots based on the user’s behavior time interval [37,38] was used in order to distinguish between normal users and game bots as a method to detect game bots, regardless of the type of game. Unlike general users, a study [39] to detect online game bots by identifying the extent to which the behavioral patterns differ from those of normal users was conducted by analyzing social activities based on features specializing in obtaining cyber assets quickly.
3.3. Relation to Online Ticketing
On March 1, 2019, as the race to acquire tickets for the BTS tour ended, a large amount of ticket scalping surfaced on the same day, and tickets for the tour sold for prices as high as $4019 (£3037). This caused dismay among netizens who are fans of the BTS [40]. Ticket scalping is the practice of reselling tickets to popular events at a rate that is significantly above the face value [41]. The recent growth in the secondary ticket market is largely due to the use of ticket purchasing software or “bots” in online ticket sales [42,43]. The ticket sales market quickly moved to an online transaction environment owing to the growth of the Internet, and competition for pre-occupying tickets has also become fierce because of the easily accessible transaction environment. As purchases using ticket programs became popular, it became increasingly difficult for general consumers to purchase tickets, and it has been pointed out that this hinders consumers’ ability to transact fairly. Despite the time that fans spend to acquire a ticket, they often fail because bots have an advantage.
Choi and Ran researched the use of macro-programs for online ticket booking and suggested that their illegality should be discussed [11]. In the USA, the Better Online Ticket Sales (BOTS) Act of 2016 makes it illegal for bots to purchase tickets or resell tickets that were bought by bots [44]. England amended the Consumer Rights Act in 2015 and introduced the Digital Economy Act in 2017 [45]. One of the most useful solutions to counter bots, an online ticket purchase program along with legal regulations, is CAPTCHA (Completely Automated Public Turing test to tell Computers and Humans Apart), which is based on text, audio, image, and video [46]. In addition, online tickets have characteristics (such as QR codes) that enable buyers to use them at physical sites. Based on these characteristics, as a way to prevent the use of online ticket automation programs, Ben Nissan tried to solve the problem by using sophisticated authentication systems [47] and operators identified ticket buyers by introducing face recognition technology, thereby making efforts to eliminate the incentive for illegal ticket scalping and resale [48]. An integrated method, called SADM(Scalping Anomaly Detection Method), for detect ingthe special abnormal behavior, scalping is proposed by combine statistic method and subspace method RPCA-ADMM (Robust PCA-Alternating Direction Method of Multipliers) for a more robust feature set. [49].
3.4. Moving Forward
The use of macro-programs has created an unfair market environment in which humans and computers compete, and the side-effects are gradually increasing, owing to the use of automated programs. For the studies in O2O environment, there was some of the works have been done on predicting the state of humans and detecting fake actions by using behavior visualizing and analyzing the customer click events [50], geolocation features [51], and user profile [52]. Although, as we have reviewed the related works in the previous section, O2O service environment has widely opened to unauthorized methods and abnormal behaviors, because the business was conducted in the existing offline environment has changed and is now being conducted in the online environment.
Table 1 shows the comparison of related works and O2O service. All of the works have common concerns regarding behavior taking the place of human action. However, O2O service has more dependence on the offline environment than others even in the future. In the other works, automation programs were identified based only on online information, and research on identifying unauthorized behavior through combination with offline information was not conducted. Therefore, we are expecting an effective model to detect abnormal behavior events in order to identify users who do unauthorized actions by combining online events and offline conditions in O2O service. This has motivated the need for more research on the detection and response to the use of unauthorized methods that could be potential risks in the O2O service environment.

Table 1.
The summary of comparison in Advertising, Online Gaming, and Online Ticketing.
4. Automated Program Apps for Taxi Drivers
As discussed above, taxi drivers prefer conditions to move quickly and short distances to the passenger pick-up location when accepting calls to maximize profits. This demand to pick calls up on preferred conditions faster than competitors has created a desire to use automated programs, such as macros in the taxi-hailing service market.
As discussed above, taxi drivers’ preferred conditions are to quickly reach and travel short distances to the user’s pick-up location when accepting calls, with the aim of maximizing profits. This objective to collect the user faster than competitors has created a desire to use automated programs, such as macros, in the taxi-hailing service market. The process of calling and dispatching taxis using the taxi app provided by the taxi service platform has the following steps: ① the taxi driver waits for the user’s call in the state to receive the user’s call signal through the update of the driver app’s status of going to work. ② The user calls a taxi by using an app on their smartphone. ③ The user’s call request is delivered to the driver’s app, which specifies the call information at a certain distance from the departure point, and then the acceptance button on the driver’s app is activated. ④ The driver sends a response to the requested call by clicking the activated acceptance button. ⑤ The server on which the taxi service platform resides matches the taxi driver who responded with the fastest acceptance and ⑥ sends the information of the matched taxi to the user.
Our simulations of the profit structure in Section 2.1 and the survey results of taxi drivers in Section 2.2 indicated that taxi drivers would prefer to quickly preempt whether a call occurs with or without certain conditions. Rather than allowing fair competition between taxi drivers by using the authorized app provided by the service platform provider, these drivers aim to increase their driving opportunities relative to those of competing drivers by using unauthorized apps to automatically perform the four steps presented in Figure 5. The following two types of automation programs prevail in the taxi-hailing service market:
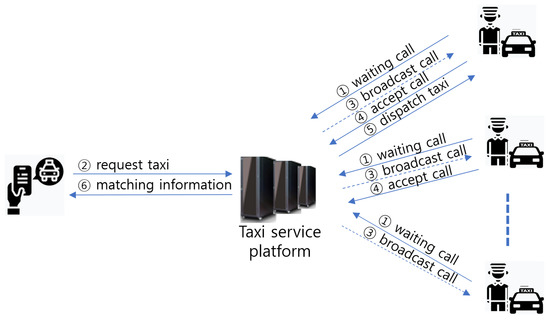
Figure 5.
Dispatching flow of the taxi app.
- Type 1.
- An automated program that includes the ability to select calls that match the optimal conditions to maximize profits;
- Type 2.
- A program that allows for quick selection without conditions.
A macro-app offers a selection method without conditions as a substitute for human click behavior. These apps have the advantage of being relatively easy and simple to use when compared with an automated program that requires certain conditions. More than 80 macro-apps, such as that in Figure 6, which simply click, were registered on the Google Play Store in April 2020, and more than 11 of these apps were downloaded by more than one-million users, as they are easy to use. Figure 6 is one of the popular and downloaded macro-apps and it could help us for a better understanding of macro-apps. These kinds of apps only need to set click position and time for the repeat action of a mouse click to use without complicated configurations. Taxi drivers’ interest in the simple selection method of macro-apps has been increasing, as they aim to secure more driving opportunities to increase their incomes in the taxi service market where an imbalance exists between supply and demand. Therefore, this study aims to contribute toward creating an environment in which a fair service ecosystem can be maintained by identifying and preventing the use of unauthorized automated programs, including macro-apps.
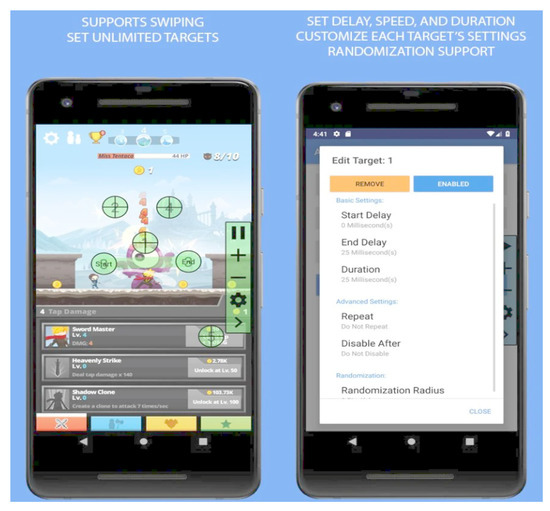
Figure 6.
A macro-app without certain conditions (automatic clicker) [53].
5. Event Data Analysis
Taxi drivers are able to maximize their profits by quickly selecting a call that meets their preferred conditions, such as taking a short time to reach the pickup location. Alternatively, they could use an automated program, such as a macro-program, to quickly accept an incoming call. Humans are known to have an average response speed of 284 ms and a typical lag of approximately 30 ms on a computer screen [54]. The speed at which a person reacts differs from the speed at which an automated program responds when the call acceptance button is activated on the driver’s app. In particular, the activation of the acceptance button on the driver’s app after receiving the call signal includes the following steps: ① the driver’s eye detects the output that the acceptance button needs to be activated, ② the driver’s brain receives the signal and gives the command after determining the situation, ③ the brain command is transmitted to the finger, and ④ the process of clicking the accept button by the finger from the command can be skipped when using an automated macro-program.
The click of the acceptance button by the macro-program excludes human perception and judgment and inevitably leads to unfair competition among taxi drivers in terms of the mechanism that is first implemented based on the call acceptance order when a taxi call occurs. In this study, we analyzed and experimented with real data that more than millions call acceptance events that were collected from one of the largest taxi-hailing services in South Korea for one week (Sunday to Saturday) in April.
5.1. Target Action Selection
The use of unauthorized apps is reflected in the behavioral event data of actual drivers. Using a bot to rapidly select more items in a short time in an online game is similar to accepting calls faster in competition with other drivers in the taxi-hailing service market. Game bots are characterized by repeating the same action [29] or by using repetitive courses of action [33,34], and the time interval of the action is similar [37,38]. Clicking the call acceptance button while using a macro-program mimics a bot with a repetitive course of action, and clicking the call acceptance button is the same. The similarity of the interval between clicks of the acceptance button is another characteristic of the bot. Therefore, the action data of the driver app were collected and information from the state of the market and offline conditions was considered to identify the use of unauthorized apps, such as macro-programs.
5.2. Distribution of Acceptance Time
We measured the time that it takes for drivers to click the acceptance button when a call occurs. Table 2 presents the time that it took to click the acceptance button after activated. An acceptance period of between 2 and 3 s was the largest, at 37.48%, and only 3.00% of acceptance clicks occurred in less than 1 s.
Table 2.
Acceptance button click time count per second.
Based on the assumption that the time an abnormal app would require to click a button to indicate acceptance would be short, we conducted a more detailed analysis in order to count the acceptances in less than 5 s, which accounts for 89% of the total number of acceptances. Acceptance event counts of less than 5 s were classified in units of 100 ms and are displayed in Figure 7. We found that 3.7% of the clicks occurred in less than 1.2 s (the first peak), and the second peak at which the highest acceptance rate was reached, was at 2.3 s, after which the clicks decreased. Based on these results, we could infer that there were two types of click behavior for call acceptance.
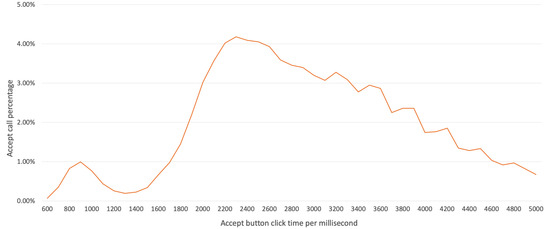
Figure 7.
Acceptance button click rates per 100 ms.
5.3. Human Test Result
Our investigation of the time that is required to click the acceptance button enabled us to confirm that two types of acceptance were occurring in Section 5.2. This section presents the details of the experiment conducted to extract the characteristics of the acceptance behavior of humans. In this experiment, five highly skilled experts participated in collecting data by performing a total of 300 acceptance actions for 13 days. Those experts used the taxi driver app for more than one year and well-known the working process of the app. In order to perform the fast acceptance time, each expert predicted that the call would occur and it was ready to press the acceptance button and, when the acceptance button was activated, they did not judge the calling condition and proceeded to immediately click the button. By analyzing the collected data, we investigated the patterns that may appear when the actual taxi driver directly presses the call acceptance button and attempted to define the time that is required for fast acceptance action that would result from a human driver’s direct acceptance behavior.
Figure 8 shows the results of a statistical analysis of 300 acceptance actions performed by experts. Without considering the conditions when the acceptance button was activated, the fastest acceptance time in the test when the accept button was pressed immediately was 1.041 s, the average time was 1.458 s, and the maximum time was 3.88 s. According to the results, it would be very difficult for a human driver to accept the call within 1 s, even if the user were to click the accept button immediately after recognizing the activation of the call acceptance button.
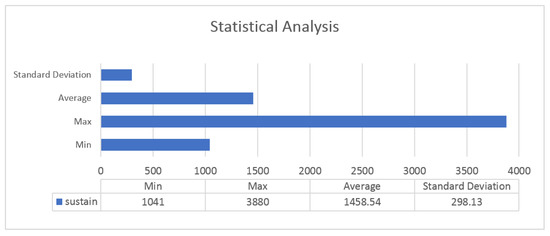
Figure 8.
Statistical analysis of 300 acceptances.
Figure 9 shows the distribution of the call acceptance count over time. The test proceeded well as intended because 96.33% of the call acceptance actions occurred in the 1–2 s interval, 3% in the 2–3 s interval, and 0.67% in the 3–4 s interval. The detailed analysis showed that the acceptance count rate that was between 1.0 and 1.2 s was 10.33%, which, between 1.2 and 1.4 s, was 38.0%, and that between 1.4 and 1.6 s was 42.67%. Thus, 91.0% of the total acceptance counts occurred between 1.0 and 1.6 s. This result confirmed that the fast acceptance interval when the acceptance action is carried out by a highly skilled driver is 1.0–1.6 s.
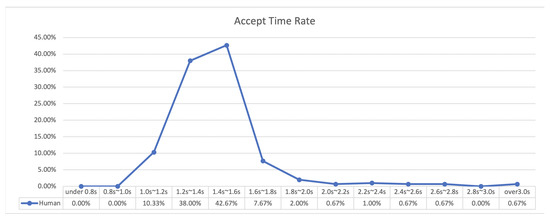
Figure 9.
Acceptance counts by human test.
In addition, in this experiment, the click-point positions on the accept button during 300 acceptance actions were analyzed. Figure 10 shows the click point positions of the acceptance actions; furthermore, in the test result, it was confirmed that the clicks did not occur at the same position even once.
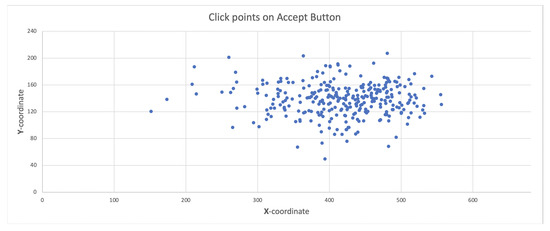
Figure 10.
Click point positions on accept button.
Therefore, from the obtained experimental results, we were able to define the following criteria for the case of direct call acceptance behavior by a human taxi driver.
- (1)
- A taxi driver requires more than 1 s to click the accept button.
- (2)
- Taxi drivers are highly unlikely to click the accept button in exactly the same position.
To summarize, if the acceptance time is shorter than 1 s or the click positions of the accept button overlap, then the action is not that of a human taxi driver, and it can be strongly assumed that the acceptance action is that of an unauthorized appm such as a macro-program.
5.4. Feature Extraction
In this section, we describe the data features for effective detection. In this study, to consider the characteristics of an O2O service, 16 features were collected from taxi drivers’ acceptance events that are collected in taxi-hailing service platforms in general. The collected data were used in order to identify abnormal behavior. These 16 features are listed in Table 3.
Table 3.
Feature descriptions.
We processed the collected original values in order to obtain three variables that were expected to be significant in identifying abnormal behavior. The first feature is “wtime”, which reflects the changes in supply and demand. Taxi drivers’ motivation for clicking an acceptance call is closely related to the supply and demand situation of the market. Thus, we defined a time-based categorizing feature based on the supply and demand to reflect the motive behind the behavior of the driver’s acceptance. The six time zones that are specified for each event are listed in Table 4, and the supply and demand in the Seoul taxi market in 2018 is described in Section 2.
Table 4.
Categorized working time by supply and demand.
The second feature, the distance from the center of the acceptance positions on the button, is displayed as "dist". Hence, the scattering information of the click position for each driver can be included in the data of each event. The third feature, the spatial information indicated by the horizontal and vertical x- and y-coordinate values, respectively, is displayed using the variable “size” to include information on the acceptance click position of the articles, and included in the data pertaining to each event.
We classified the features into six categories (listed in Table 5), and conducted an experiment to find the best combinations of features that could identify abnormal behavior. Case 1 was defined while using all 16 features that were collected, Case 2 was defined using 13 features that expressed the original information excluding connoted features, Case 3 was defined using seven features that were collected in an online environment, Case 4 was defined using six features collected in an offline environment, Case 5 was defined using three features that were created from the collected value, and Case 6 was defined using six features that would be able to obtain the optimal result by combining the online and offline information. When defining the features included in Case 6, the "os", "device", "view", "dispatch", and "desti" features, which were primarily low impact, were excluded by the importance feature selection verification, after which six features were selected as representing the best performance.
Table 5.
Categorization of features by case.
5.5. Feature Selection
We analyzed the event data that we extracted from the taxi-hailing service, including the driving distance, pickup distance, and payment type. We used event data to identify abnormal behavior that may indicate the use of unauthorized apps. We expected to classify a sample of thousands of inappropriate drivers. We experimentally compared the performance by using the decision tree algorithm with the six cases that are identified in Table 5. The data used for the performance comparison were the acceptance event data for one week of April (Sunday to Saturday).
Figure 11 shows the experimental results for the six cases. First, in terms of the processing speed, it was shown that cases 4 (six features), 5 (three features), and 6 (six features) were processed relatively faster than the others (Figure 11a). The detection accuracy of all six cases was good and was more than 98.6% (Figure 11b), and the performance of Case 6 with six features selected for optimization was higher than that of Case 1, which involved all the features. This experiment was designed in order to enable us to build a model that would more accurately detect abnormal behavior, such as the use of unauthorized apps, and it would minimize the number of false positives for normal users. The comparison of the performance in terms of identifying abnormal behavior indicated that the results for Case 4 were relatively inaccurate, whereas Case 6 had the best performance (Figure 11c). In addition, the average result for the use of the macro-program (Figure 11d), based on the confusion matrix that reflects the true positive (TP) and true negative (TN) results together, confirmed that Case 6 had the best performance. Figure 12 summarizes the results of the comparison of the feature selection.
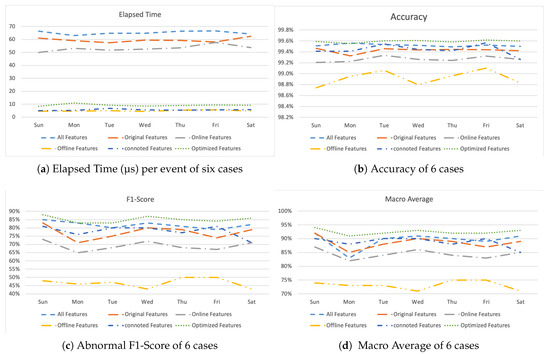
Figure 11.
Comparison of feature selection.
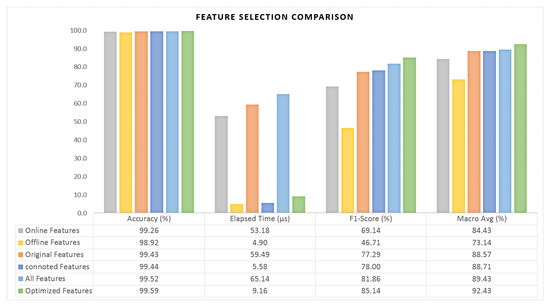
Figure 12.
Comparison result summary of feature selection.
5.6. Detection of Abnormal Behavior
Our intention is to detect abnormal behavior using a machine learning classification model and to evaluate its performance using a confusion matrix. Table 6 summarizes the cases that can be made using the results predicted by the machine learning model.
Table 6.
Matrix of number of cases.
The correct answer is Driver (Human). If the model predicts Driver (Human) as A (TP), the correct answer is Driver (Human). If the model predicts Abnormal (macro) as B (FN), the correct answer is Driver (Human). If the model predicts Driver (Human) as C (FP), the correct answer is Abnormal (macro), and if the model predicts Abnormal (macro) as D (TN), the correct answer is Abnormal (macro). Thus, A and D are the correct answers, and B and C are the wrong answers, as per the model. The confusion matrix provides a large amount of information about the performance of the classifier, but it is summarized by precision and recall. Precision is the probability that a (randomly selected) retrieved document is relevant. Recall is the probability that a (randomly selected) relevant document is retrieved in a search.
A classification evaluation that considers both precision and recall is known as the F1-score (F-measure).
In general, the performance of the model can be confirmed on the basis of its accuracy, but in actual service, in order to implement the policy to prevent the use of unauthorized apps by detecting and identifying abnormal behavior, we would have to consider avoiding unexpected harmful consequences for normal users. Because it is necessary to detect D (TN) as accurately as possible, and B (FN) is guaranteed, we compared the performance of the model using the F1-score of driver (human) and abnormal (macro). The macro average of the F1-score that reflects both of the results to compare the performance measurement results was used.
5.7. Performance of Detection Model
In order to select an effective algorithm for the identification of abnormal behavior in the O2O service environment, we applied various machine-learning-based classification algorithms to compare their performance. The data based on the features selected in Section 5.5 was used for the performance comparison, comprising more than millions call acceptance events from the taxi driver app for one week (Sunday to Saturday) in April to reflect the characteristics of the day of the week and the work schedule of drivers. The experiment was conducted by dividing it into daily units in consideration of taxi drivers’ work schedules (the start and end of their working day), and the performance was compared based on the experimental results for a week. The experimental environment was an i7 2.8 GHz quad-core processor with 16 GB memory and 2133 MHz LPDDR3. A GPU was not used, because the performance was tested with a general machine learning model.
In this experiment, the performance of 11 supervised learning classification algorithms [55] provided with Python’s machine learning library was compared. Table 7 lists these algorithms.
Table 7.
Classification algorithms.
Figure 13 compares the processing speed of the 11 algorithms that were used in the experiment. In the order of decreasing speed, these are: GauNB > CNB > DT > LogReg > KNN > AdaB > XGB > SGD > GraB > RF > SVC. The event unit average processing speed was measured to range from 1.4 to 176 µs. However, the SVC algorithm was unsuitable for application to real-time services, because the unit average processing speed of this algorithm was 68.98 ms, which was significantly lower than that of the other algorithms. Thus, the SVC algorithm was not included in the accuracy performance evaluation in the next step.
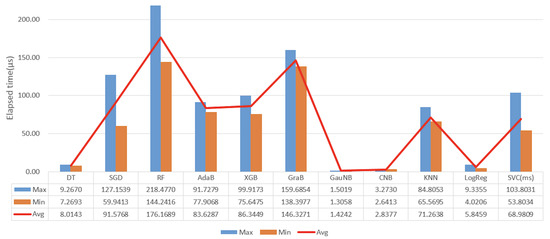
Figure 13.
Comparison chart for the elapsed time of per event in a µs.
Figure 14 shows the results of the evaluation and compares the performance in terms of the accuracy for the 10 classification algorithms. The SVC algorithm, which had a significantly low processing speed, was excluded from the evaluation. The collected data were divided into a training dataset (90%) and a test dataset (10%) in order to evaluate the accuracy.
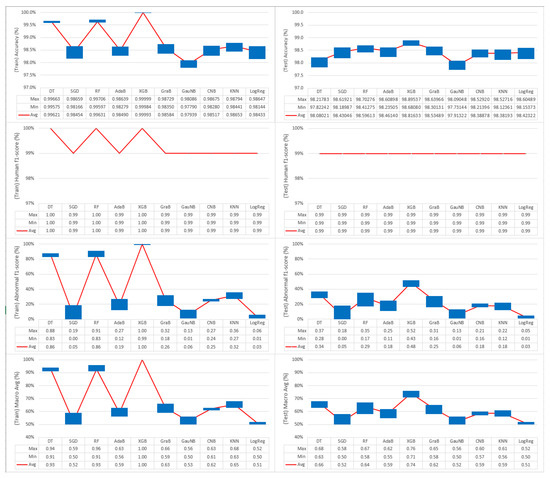
Figure 14.
Accuracy and F1-score comparison of classification algorithms
A comparison of the evaluation results while using the training dataset (Table 8) revealed the three algorithms with the highest accuracy in the order of XGB (99.99%), RF (99.96%), and DT (99.62%). For the macro-average of the confusion matrix, XGB achieved 100%, and RF and DT each achieved 93% in the results. Thus, XGB, RF, and DT are expected to show good performance in the verification evaluation while using the test dataset.
Table 8.
Results for the training dataset.
Table 9 shows the results of the prediction verification using the test dataset, which consisted of 10% of the data collected after learning by using the training dataset. All of the algorithms were generally highly ① accurate in the order of XGB (98.82%) > RF (98.60%) > GraB (98.54%) > AdaB (98.46%) > SGD (98.43%) > LogReg (98.42%) > CNB (98.39%) > KNN (98.38%) > DT (98.08%) > GauNB (97.91%). However, in terms of the ③ abnormal F1-score, the results were, as follows: XGB (48%) > DT (34%) > RF (29%) > GraB (25%) > AdaB, CNB, KNN (18%) > GauNB (6%) > SGD (5%) > LogReg (3%). For the ④ macro average, the results were as follows: XGB (74%) > DT (66%) > RF (64%) > GraB (62%) > AdaB, CNB, KNN (59%) > SGD, GauNB (52%) > LogReg (51%) because of the influence of the abnormal detection accuracy in the form of the F1-score. The results of this experiment showed that the XGB algorithm was able to most accurately recognize abnormal behavior, and the processing speed was also good (<100 µs). Therefore, the XGB algorithm can be recommended as an effective algorithm for application to actual services.
Table 9.
Result for the test dataset.
6. Limitations and Discussion
In this study, in order to effectively detect abnormal behavior in O2O services, we proposed a detection model that was based on feature selection that combines online and offline information. The detection model was verified while using data from a taxi-hailing service, a representative O2O service, and abnormal behavior as a result of the use of unauthorized programs, such as macros, was effectively detected. Abnormal behavior detection in online services is possible by identifying behavior that follows programmed rules when using the service. However, in the O2O service, where the standards of the provider’s behavior change dynamically according to the market conditions, it was verified that reflecting the situation and information of the offline market is effective for increasing the accuracy with which abnormal behavior can be detected. This detection method has the advantage of being able to identify abnormal behavior by any kind of unauthorized app, because it can identify abnormal behavior based on behavior event data of the providers.
Features that enabled the use of unauthorized apps for taxi call acceptance were selected in order to effectively detect abnormal behavior. These features allowed us to efficiently determine whether drivers were using unauthorized apps.
- (1)
- Feature wtime: the time at which unauthorized apps are used is affected by supply and demand in the market.
- (2)
- Feature sustain: unauthorized apps require less time to click the accept button.
- (3)
- Feature tpsg: drivers using unauthorized apps spend less time to travel to the passenger pick-up location.
- (4)
- Feature dist: the use of unauthorized apps does not result in a wide distribution of click points.
- (5)
- Feature size: the use of unauthorized apps results in a similarly sized click space.
- (6)
- Feature payment: when using unauthorized apps, drivers may prefer automatic payment.
Among the above characteristics, the travel time feature to the passenger pick-up location was related to the taxi driver’s profit structure and the preferred conditions from the survey result, and it may convince taxi drivers to use unauthorized apps in order to maximize profits.
This study confirmed that the supply and demand situation in the market is highly related to abnormal behavior. However, the supply and demand of the market change dynamically in response to various conditions, such as weather, performance, and region. Because of the difficulties that are associated with collecting data related to such dynamically changing conditions, this study had to be limited. Thus, in this study, the identification accuracy is insufficient for detecting abnormal behavior. However, in a future study, we aim to improve the accuracy by reflecting the dynamic conditions in additional features. In addition, with the dynamic situation in the service market, research to identify unique behavior patterns of individual drivers by considering the call acceptance time and behavior data will be conducted. The addition of a model that identifies abnormal behavior compared with normal behavior by analyzing individual behavioral patterns would enable the number of false positives for normal behavior to be minimized, whereby the detection performance of abnormal behavior will improve. The identification of features that are able to more accurately detect abnormal behavior would allow for us to determine the needs and motivations of suppliers that encourage the use of unauthorized apps. Furthermore, by ensuring that fair competition exists in the market, its growth is expected to be maintained in the future.
7. Conclusions and Future Work
Existing solutions for detecting the unauthorized use of automated programs, such as macro-programs, are problematic, in that it is possible to implement a method for avoiding detection. This is because these solutions rely on information in an online environment when the method is activated. Although a method that uses static detection rules would generate fewer false positives, the problem faced is the increased probability of true negatives. To solve these issues, we built a model in order to identify abnormal behavior in O2O service environment. This model combines information that reflects the offline market situation, offline environment, and user behavior in the online environment.
A human driver’s response to request calls is irregular. Drivers who use unauthorized apps have characteristically regular acceptance, but the drivers who use legitimate apps accept request calls randomly. Because the use of programs that are not approved by the service provider may harm the fairness of or trust in the services, there is a need to regulate the use of these programs. However, owing to the value-neutral nature of macro-programs, restrictions by law have their limitations. Therefore, preventing the use of macro-programs would require service providers to prohibit the use of unauthorized methods by using terms and conditions, and to strengthen their ability to respond technically. However, it is not easy to control a large number of unknown automation programs that are being developed and are emerging on a daily basis. In order to overcome these limitations, it is necessary to identify abnormal behavior that is based on the characteristics of users’ behavior patterns by using data analysis. In this study, we verified that in the O2O service environment, when considering the state of the service market, combining offline and online information allows for abnormal behavior to be detected more effectively. In addition, although the need for the improvement of the detection accuracy remains, the high detection accuracy of 98.82% of the model suggests that the use of unauthorized apps in the actual service environment should be blocked.
In the future, we aim to devise a model with faster detection and improved accuracy performance that can be deployed in a real service environment. We plan to design the model in order to analyze information regarding the dynamically reflected market situation, such as weather, events, and destinations, and to offer additional features that are based on offline information, such as the driving route and driving distance. Finally, we would like to emphasize that the prevention of the use of abnormal programs would have to be accompanied by mature civic cooperation in order to maintain fair market competition along with efforts to strengthen technical measures by service business companies.
Author Contributions
Conceptualization, methodology, experiment and writing, C.K.; review, editing and discussion, H.K.K. All authors have read and agreed to the published version of the manuscript.
Funding
The study was funded by Institute for Information and communications Technology Promotion (Grant No. 2020-0-00374, Development of Security Primitives for Unmanned Vehicles).
Acknowledgments
The study was supported by Institute for Information and communications Technology Promotion under the Grant No. 2020-0-00374, Development of Security Primitives for Unmanned Vehicles.
Conflicts of Interest
The authors declare no conflict of interest.
References
- Mobility as a Service Market by Service (Ride Hailing, Car Sharing, Micro Mobility, Bus Sharing, Train), Solution, Application, Transportation, Vehicle Type, Operating System, Business Model and Region—Global Forecast to 2030. Available online: https://www.marketsandmarkets.com/Market-Reports/mobility-as-a-service-market-78519888.html (accessed on 17 October 2020).
- Lee, E.-J.; Kim, S.-I. A study on user experience of kakao taxi. J. Digit. Converg. 2018, 16, 359–364. [Google Scholar]
- The TNC Regulatory Landscape. Available online: https://www.sfcta.org/sites/default/files/2019-03/TNC_regulatory_020218.pdf (accessed on 17 October 2020).
- Uber Is a ’Cancer,’ Say Defiant London Cab Drivers. Available online: https://www.cnet.com/news/uber-london-taxi-drivers/ (accessed on 17 October 2020).
- New York City Taxi Drivers Rally for Limits on Uber. Available online: https://www.wsj.com/articles/new-york-city-taxi-drivers-rally-for-limits-on-uber-1527630628 (accessed on 17 October 2020).
- National Transport Survey of 2016. Available online: http://www.molit.go.kr/USR/NEWS/m_71/dtl.jsp?lcmspage=3&id=95080800 (accessed on 17 October 2020).
- Korea National Joint Conference of taxi Association, Taxi and Driver Number Report 2018. Available online: http://www.taxi.or.kr/04/01_view.php?no=151 (accessed on 17 October 2020).
- KOrean Statistical Information Service, Domestic Statistics-Statistics by Theme-Construction, Transportation, and Logistics-Transportation-Transportation Business Survey-Industry and Sales Scale. Available online: http://kosis.kr/eng/ (accessed on 17 October 2020).
- Ministry of Land, Infrastructure and Transport, Research on Improvement Measures for the Establishment of the 4th Taxi Total Number Management System. Available online: http://www.prism.go.kr/homepage/researchCommon/downloadResearchAttachFile.do?work_key=001&file_type=CPR&seq_no=001&pdf_conv_yn=Y&research_id=1613000-201800043 (accessed on 17 October 2020).
- Kakaomobility Report 2018. Available online: https://brunch.co.kr/@kakaomobility/19 (accessed on 17 October 2020).
- Ran, C. Study on criminalization of macro program using in the onlineticket-booking-system. J. Law Technol. 2008, 24, 243–285. [Google Scholar]
- Opinion-Rigging Scandal Rattles Cheong wa Dae. Available online: http://english.chosun.com/site/data/html_dir/2018/04/19/2018041901474.html (accessed on 17 October 2020).
- Marciel, M.; Cuevas, R.; Banchs, R.; González, R.; Traverso, S.; Ahmed, M.; Azcorra, A. Understanding the detection of view fraud in video content portals. In Proceedings of the 25th International Conference on World Wide Web, Montréal, QC, Canada, 11–15 April 2016; pp. 357–368. [Google Scholar]
- Stitelman, O.; Perlich, C.; Dalessandro, B.; Hook, R.; Raeder, T.; Provost, F. Using Co-Visitation Networks for Classifying Non-Intentional Traffic. 2013. Available online: http://www0.cs.ucl.ac.uk/staff/w.zhang/rtb-papers/co-visit-fraud.pdf (accessed on 17 October 2020).
- Baek, Y.J.; Hong, S.W.; Park, J.H.; Kang, G.W.; Kim, S.B. A macro attacks detection model based on trace back information. Converg. Secur. J. 2018, 18, 113–120. [Google Scholar]
- Callejo, P.; Cuevas, R.; Cuevas, A.; Kotila, M. Independent auditing of online display advertising campaigns. In Proceedings of the 15th ACM Workshop on Hot Topics in Networks, Atlanta, GA, USA, 9–10 November 2016; pp. 120–126. [Google Scholar]
- Springborn, K.; Barford, P. Impression fraud in on-line advertising via pay-per-view networks. In Proceedings of the 22nd (USENIX) Security Symposium ((USENIX) Security 13), Washington, DC, USA, 14–16 August 2013; pp. 211–226. [Google Scholar]
- Chen, L.; Zhou, Y.; Chiu, D.M. Analysis and detection of fake views in online video services. ACM Trans. Multimed. Comput. Commun. Appl. (TOMM) 2015, 11, 1–20. [Google Scholar] [CrossRef]
- Zhang, Q.; Ristenpart, R.; Savage, S.; Voelker, G.M. Got traffic? An evaluation of click traffic providers. In Proceedings of the 2011 Joint WICOW/AIRWeb Workshop on Web Quality, Hyderabad, India, 28 March–1 April 2011; pp. 19–26. [Google Scholar]
- Stone-Gross, B.; Stevens, R.; Zarras, A.; Kemmerer, R.; Kruegel, C.; Vigna, G. Understanding fraudulent activities in online ad exchanges. In Proceedings of the 2011 ACM SIGCOMM Conference on Internet Measurement Conference, Berlin, Germany, 2–4 November 2011; pp. 279–294. [Google Scholar]
- Lee, E.; Woo, J.; Kim, H.; Kim, H.K. No silk road for online gamers using social network analysis to unveil black markets in online games. In Proceedings of the 2018 World Wide Web Conference, Lyon, France, 23–27 April 2018; pp. 1825–1834. [Google Scholar]
- Nprotect Gameguard Hack Detection. Available online: https://gameguard.nprotect.com/en/index.html (accessed on 17 October 2020).
- Ahn, L.V.; Blum, M.; Hopper, N.J.; Langford, J. CAPTCHA: Using Hard AI Problems for Security. EUROCRYPT 2003; Lecture Notes in Computer Science; Springer: Berlin/Heidelberg, Germany, 2003; Volume 2656, pp. 294–311. [Google Scholar]
- Golle, P.; Ducheneaut, N. Preventing bots from playing online games. Comput. Entertain. (CIE) 2005, 3, 3. [Google Scholar] [CrossRef]
- Laurens, P.; Paige, R.F.; Brooke, P.J.; Chivers, H. A novel approach to the detection of cheating in multiplayer online games. In Proceedings of the 12th IEEE International Conference on Engineering Complex Computer Systems (ICECCS 2007), Auckland, New Zealand, 11–14 July 2007; pp. 97–106. [Google Scholar]
- Kim, J.-H.; Lee, S.-J. A study on macro detection using information of touch events in android mobile game environment. J. Korea Inst. Inf. Secur. Cryptol. 2015, 2, 1123–1129. [Google Scholar] [CrossRef]
- Kang, A.R.; Jeong, S.H.; Mohaisen, A.; Kim, H.K. Multimodal game bot detection using user behavioral characteristics. SpringerPlus 2016, 5, 523. [Google Scholar] [CrossRef] [PubMed]
- Feng, W.-C.; Kaiser, E.; Schluessler, T. Stealth measurements for cheat detection in on-line games. In Proceedings of the NetGames08: Network and Systems Support for Games, Worcester, MA, USA, 21–22 October 2008; pp. 15–20. [Google Scholar]
- Thawonmas, R.; Kashifuji, Y.; Chen, K.-T. Detection of mmorpg bots based on behavior analysis. In Proceedings of the 2008 International Conference on Advances in Computer Entertainment Technology, Yokohama, Japan, 3–5 December 2008; pp. 91–94. [Google Scholar]
- Kim, H.; Hong, S.; Kim, J. Detection of auto programs for mmorpgs. In Australasian Joint Conference on Artificial Intelligence, AI 2005; Lecture Notes in Computer Science; Springer: Berlin/Heidelberg, Germany, 2005; Volume 3809, pp. 1281–1284. [Google Scholar]
- Schaal, S.; Ijspeert, A.J.; Billard, A.; Vijayakumar, S.; Meyer, J.-A. Learning human-like Movement Behavior for Computer Games. In From Animals to Animats 8: Proceedings of the Eighth International Conference on the Simulation of Adaptive Behavior; MIT Press: Cambridge, MA, USA, 2004; pp. 315–323. [Google Scholar]
- Huang, X.; Fan, J.; Gao, S.; Hu, W. Online game bot detection based on extreme learning machine. In Transactions on Edutainment XIV; Lecture Notes in Computer Science; Springer: Berlin/Heidelberg, Germany, 2018; Volume 10790, pp. 155–165. [Google Scholar]
- van Kesteren, M.; Langevoort, J.; Grootjen, F. A step in the right direction: Botdetection in mmorpgs using movement analysis. In Proceedings of the 21st Belgian-Dutch Conference on Artificial Intelligence (BNAIC 2009), Eindhoven, The Netherlands, 29–30 October 2009; pp. 129–136. [Google Scholar]
- Mitterhofer, S.; Kruegel, C.; Kirda, E.; Platzer, C. Server-side bot detection in massively multiplayer online games. IEEE Secur. Priv. 2009, 7, 29–36. [Google Scholar] [CrossRef]
- Lee, E.; Woo, J.; Kim, H.; Mohaisen, A.; Kim, H.K. You Are a Game Bot!: Uncovering Game Bots in MMORPGs via Self-similarity in the Wild. In Proceedings of the NDSS Symposium, San Diego, CA, USA, 21–24 February 2016. [Google Scholar]
- Kwon, H.; Kim, T.; Yu, S.J.; Kim, H.K. Self-similarity based lightweight intrusion detection method for cloud computing. In Asian Conference on Intelligent Information and Database Systems; ACIIDS 2011. Lecture Notes in Computer Science; Springer: Berlin/Heidelberg, Gemany, 2011; Volume 6592, pp. 353–362. [Google Scholar]
- Kang, Y.G.; Kim, H.K. Game bot detection based on action time interval. J. Korea Inst. Inf. Secur. Cryptol. 2018, 28, 1153–1160. [Google Scholar]
- Chen, K.-T.; Hong, L.-W. User identification based on game-play activity patterns. In Proceedings of the 6th ACM SIGCOMM Workshop on Network and System Support for Games, Melbourne, Australia, 19–20 September 2007; pp. 7–12. [Google Scholar]
- Kang, A.R.; Woo, J.; Park, J.; Kim, H.K. Online game bot detection based on party-play log analysis. Comput. Math. Appl. 2013, 65, 1384–1395. [Google Scholar] [CrossRef]
- BTS Fans Angry as Resale Prices for Sold Out Tickets Hit $4,000. Available online: https://www.hollywood.com/general/bts-fans-angry-as-resale-prices-for-sold-out-tickets-hit-4000-60744971/ (accessed on 17 October 2020).
- Criscuolo, P.J. Reassessing the ticket scalping dispute: The application, effects and criticisms of current anti-scalping legislation. Seton Hall J.Sport L. 1995, 5, 189. [Google Scholar]
- Kramer, A. Pushy ticket-buying bots feel heat from federal, state officials. 16 Computer Tech. L. Rep. (BNA) 2015, 7, 184. [Google Scholar]
- McFadden, R.J. The bots act: A small step for fankind when a giant leap is needed. Washburn LJ 2015, 55, 427. [Google Scholar]
- Better Online Ticket Sales Act. Available online: https://www.ftc.gov/enforcement/statutes/better-online-ticket-sales-act (accessed on 17 October 2020).
- GAO U.S. Government Accountability Office, Event Ticket Sales: Market Characteristics and Consumer Protection Issues. 2018. Available online: https://www.gao.gov/assets/700/691247.pdf (accessed on 17 October 2020).
- Vaithyasubramanian, S. Array CAPTCHAs (completely automated public turing test to tell computer and human apart). Asia Life Sci.-Asian Int. J. Life Sci. 2017, 1, 247–254. [Google Scholar]
- Nissan, B. An Arms Race on Broadway: Bot-Based Ticket Scalping Hounds Blockbuster Musicals. 2017. Available online: http://www.cs.tufts.edu/comp/116/archive/fall2017/bnissan.pdf (accessed on 17 October 2020).
- Okumura, A.; Handa, S.; Hoshino, T.; Nishiyama, Y. Identity confirmation to issue tickets using face recognition. In International Conference on Human-Computer Interaction; Communications in Computer and Information Science; Springer: Cham, Switzerland, 2016; Volume 617, pp. 488–493. [Google Scholar]
- Wu, C.; Yu, K.; Wu, X. Scalping Anomaly Detection Based on Mobile Internet Traffic Data. In Proceedings of the 2nd International Conference on Telecommunications and Communication Engineering (ICTCE 2018), Beijing, China, 28–30 November 2018; Association for Computing Machinery: New York, NY, USA, 2018; pp. 237–244. [Google Scholar]
- Du, Y.; Wang, C.; Li, C.; Yin, H. BehaviorTracker: Visual Analytics of Customer Switching Behavior in O2O Market. In Proceedings of the 11th International Symposium on Visual Information Communication and Interaction, Växjö, Sweden, 13–15 August 2018; pp. 17–24. [Google Scholar]
- Deng, R.; Ruan, N.; Jin, R.; Lu, Y.; Jia, W.; Su, C.; Xu, D. SpamTracer: Manual Fake Review Detection for O2O Commercial Platforms by Using Geolocation Features. In Proceedings of the Information Security and Cryptology: 14th International Conference, Inscrypt 2018, Fuzhou, China, 14–17 December 2020; p. 384. [Google Scholar]
- Shin, J.; Shin, D.; Shin, D. Predicting of abnormal behavior using hierarchical markov model based on user profile in ubiquitous environment. In Proceedings of the International Conference on Grid and Pervasive Computing; Grid and Pervasive Computing, GPC 2013, Seoul, Korea, 9–11 May 2013; pp. 612–622. [Google Scholar]
- Automatic Clicker, Simplehat Software. Available online: https://play.google.com/store/apps/details?id=simplehat.clicker (accessed on 17 October 2020).
- Reaction Time Statistics. Available online: https://humanbenchmark.com/tests/reactiontime/statistics (accessed on 17 October 2020).
- Supervised Learning. Available online: https://scikit-learn.org/stable/supervised_learning.html#supervised-learning (accessed on 17 October 2020).


Publisher’s Note: MDPI stays neutral with regard to jurisdictional claims in published maps and institutional affiliations. |
© 2020 by the authors. Licensee MDPI, Basel, Switzerland. This article is an open access article distributed under the terms and conditions of the Creative Commons Attribution (CC BY) license (http://creativecommons.org/licenses/by/4.0/).