Article

An Adaptive Delay-Tolerant Routing Algorithm for Data Transmission in Opportunistic Social Networks

1
School of Computer Science and Engineering, Central South University, Changsha 410083, China
2
“Mobile Health” Ministry of Education-China Mobile Joint Laboratory, Changsha 410083, China
*
Authors to whom correspondence should be addressed.
Electronics 2020, 9(11), 1915; https://doi.org/10.3390/electronics9111915
Submission received: 24 September 2020 / Revised: 30 October 2020 / Accepted: 6 November 2020 / Published: 13 November 2020
(This article belongs to the Special Issue Delay Tolerant Networks and Applications)

Abstract

:
In opportunistic networks, the requirement of QoS (quality of service) poses several major challenges to wireless mobile devices with limited cache and energy. This implies that energy and cache space are two significant cornerstones for the structure of a routing algorithm. However, most routing algorithms tackle the issue of limited network resources from the perspective of a deterministic approach, which lacks an adaptive data transmission mechanism. Meanwhile, these methods show a relatively low scalability because they are probably built up based on some special scenarios rather than general ones. To alleviate the problems, this paper proposes an adaptive delay-tolerant routing algorithm (DTCM) utilizing curve-trapezoid Mamdani fuzzy inference system (CMFI) for opportunistic social networks. DTCM evaluates both the remaining energy level and the remaining cache level of relay nodes (two-factor) in opportunistic networks and makes reasonable decisions on data transmission through CMFI. Different from the traditional fuzzy inference system, CMFI determines three levels of membership functions through the trichotomy law and evaluates the fuzzy mapping from two-factor fuzzy input to data transmission by curve-trapezoid membership functions. Our experimental results show that within the error interval of 0.05~0.1, DTCM improves delivery ratio by about 20% and decreases end-to-end delay by approximate 25% as compared with Epidemic, and the network overhead from DTCM is in the middle horizon.

1. Introduction

Opportunistic social networks [1] are a special combination of opportunistic networks and wireless multi-hop networks, in which clients carrying wireless mobile devices communicate with their peers in a communication area [1]. Without a stable and relay communication link in remote areas, data transmission in opportunistic social networks undergoes intermittent connection and delay, therefore the “store-carry-forward” strategy has also been used in this type of wireless networks [2]. As a special type of wireless multi-hop network, opportunistic networks (OPPNET) are derived from wireless Ad-Hoc networking and delay-tolerant networking [2]. At the dawn of 5G and big data, opportunistic networks are not only a special topological structure, but also a specific form of data routing and forwarding. The hot research areas on opportunistic networks include mobile model, routing algorithm, security mechanism, and application scenario [3]. Due to the intermittent connection and variable network structure of opportunistic social networks, the source node in unpredictable location attempts to communicate with the destination without an end-to-end path [4]. Consequently, the end-to-end communication connection between sources and destinations can be implemented by the opportunistic communication created by node mobility [5]. Recently, the primary application areas on opportunistic networks consist of wildlife monitoring and rescue [6], vehicle networks [7], network in underdeveloped areas [8], networks in disaster relief [9], and social networks [10].
Routing algorithm is the key issue in the research area of opportunistic networks because of its utility and specificity [11]. To face the challenge of the intermittent communication connectivity, the “store-carry-forward” mechanism has been utilized to develop an end-to-end data transmission path [12]. Recently, cache-aware routing protocols have received the increasing attention of researchers [13]. This is because the improvement of cache spaces is helpful to alleviate the problem of data congestion [14]. Relay node is a short-time station for data packets in the “store-carry-forward” mechanism [15]. Since the cache management mechanism is improved, the capacity of information processing of relay node becomes more efficiently and prompt, which enhances the delivery ratio and declines delay [16]. In addition, energy consumption is another important limitation in opportunistic networks [17]. As the energy of the mobile nodes is going to be exhausted, they must delay the data transmission [18]. To this end, this implies that energy and cache are two significant cornerstones for the establishment of an opportunistic network routing algorithm [19]. In other words, routing algorithm should consider not only whether there is enough cache to store data information, but also whether there is sufficient energy to carry and transmit information. More importantly, an adaptive approach is needed for routing algorithm to dynamically evaluate the combined influence of the two factors [20].
Limited cache and energy are two major challenges for opportunistic network routing protocols. However, most of those algorithms tackle the issue of limited network resources from the perspective of the deterministic method, which could be formalized as a linear or nonlinear mathematical expression. Most existing routing algorithms, such as Prophet [21], RubbleRap [22], SCORP [23], DABBER [24], and ICMD [25] consider the issue of limited network resources as a deterministic problem and lack of an adaptive transmission mechanism. To demonstrate a more explicit comparison, we establish Table 1 to illustrate the implement details of these routing protocols. On the contrary, the relationship between the two-factor (energy and cache) and data transmission is actually a special type of fuzzy uncertain expression, while should be defined as the degree of membership in fuzzy inference system from the theoretical perspective. The fuzzy inference system is able to define a complex relationship as the membership degree or fuzzy subset, and then evaluates whether the two-factor is closely related to data transmission through the method of defuzzification.
To this end, this paper proposes an adaptive two-factor routing algorithm using curve-trapezoid CMFI [26], namely DTCM. DTCM evaluates both the remaining energy level and the remaining cache level of relay nodes (two-factor), and then makes reasonable decisions on data transmission through CMFI. For the sake of comprehensively evaluating the impact of two-factor on data transmission, this paper proposes curve-trapezoid CMFI [27,28,29,30], which determines the fuzzy uncertain relationship between two-factor and data transmission and evaluates the fuzzy control result by the de-deblurring component. DTCM is an extensible algorithm because of its high adaptability. Data packages will be transmitted from message carriers to their future two hops based on the proposed two-hop feedback mechanism. Overall, the main contributions of this paper are summarized as follows:
  • To analyze the fuzzy uncertain impact of the remaining energy and cache on data transmission, CMFI has been proposed. As an adaptive and extensible method for energy and cache, CMFI optimizes the selections of the next hop from neighbors via three fuzzy components.
  • Different from traditional one-hop relay node selection [12,15,18], a novel two-hop feedback mechanism has been developed in this paper to consider not only neighbor nodes but also the second-hop nodes.
  • Our experimental results show that within an error interval of 0.05~0.1, DTCM improves delivery ratio by about 20% and decreases end-to-end delay by approximate 25% as compared with Epidemic, and the network overhead from DTCM is in the middle horizon.
The remaining sections of this paper are constructed as follows: In Section 2, the related works are introduced, and Section 3 develops the system model and gives the analysis of the algorithm complexity; the simulation evaluation and comparison analysis are introduced in Section 4. Section 5 and Section 6 summarize this paper and outlooks the future work related to this field.

2. Related Works

2.1. The State of the Art of the Routing Algorithm Based on Cache

Recently, cache-aware opportunistic network routing algorithms have attracted increasing attention from researchers. Various routing approaches have been proposed for various application scenarios. These routing algorithms usually leverage two different strategies to improve network performance: one is cache management, and the other deletes unnecessary messages. Typical representatives for cache management are references [7,25,31]. In [25], the author proposes an information cache management and data transmission algorithm and [31] introduces an information transmission probability and cache management method. With the support of the cache management, the two routing algorithms increase the delivery ratio by storing data information in idle nodes that have enough cache spaces. However, because of the ignorance of the remaining energy, the two cache-aware routing algorithms only slightly increase the delivery ratio and cannot decrease the network delay. To this end, reference [7] recommended an energy-efficient method that is utilized to minimize the cache management cost in wireless body area networks (WBANs) [3]. A network cost minimization approach has been proposed to improve the quality of service and synchronously minimizing the network throughput [11] in each communication link of WBANs. The simulation results show a slightly enhancement of network delay because of the lack of an adaptive approach for energy and cache.
To tackle the issue of limited cache space of nodes, routing algorithms that use the mechanism of deleting unnecessary messages are another important strategy. Chen et al. [10] proposed a Prophet-based routing algorithm [32], which establishes a communication link through the information associated with data duplicate routing policy in opportunistic networks. Combined with the Prophet routing protocol [33], this buffer management mechanism comprehensively considers the cache spaces of nodes, the link-state of nodes, the transmission probability of nodes, and the number of message copied, and then deletes unnecessary nodes cache packet. The biggest problem in this algorithm is that this buffer management mechanism does not improve the average end-to-end delay in opportunistic networks. Xiao Z. et al. [34] propose a new data fragmenting algorithm that is used to limit the communication duration and delete invalid data information, and it is suitable for short-duration contact between nodes. The disadvantage of this algorithm is that it does not make good use of the characteristics of cache cooperation between each relay nodes in opportunistic networks.

2.2. The State of the Art of the Routing Algorithm Based on Energy

The energy-based routing algorithm optimizes the performance of opportunistic networks from the perspectives of energy harvesting, residual energy evaluation, and energy consumption. Energy harvesting pays attention to the energy acquisition approaches of mobile nodes, including charging, solar energy, wind energy, etc. Bae et al. [35] analyzed the achievable throughput of opportunistic spectrum access in wireless cognitive radio networks with energy harvesting. This considers the cognitive radio network under each application user and optimizes the method of energy harvesting by assessing the joint influence of multiple sensing probabilities. Beside, Mayank Sharma et al. [36] recommend a middle position dynamic energy algorithm, which develops an efficient communication link between the source node and the destination node in WSN, which is known as MDOR [37]. Energy evaluation will be analyzed in communication links. Kang and Chung [38] introduced a PRoPHET-based routing algorithm, which proposed that the end-to-end data transmission between source and destination could be developed base on the remaining battery and delivery predictability. They provide a comparison between PRoPHET [39] and PRoPHET with periodic sleep. The PRoPHET-based routing algorithm leverages the remaining battery to determine the delivery predictability and select suitable next hops.
For the application scenario of wireless social network, a routing algorithm can solve the problem of limited energy from the aspects of node similarity, community division, node centrality, and node trust. Lai et al. [40] developed a rotated-algebraic path-time codes (RA-PTC) routing algorithm to face the technological challenges in networks with energy-harvesting mobile devices, in which a complete path from source to destination can harvest enough energy for data transmission. Kulkarni et al. [41] recommended a privacy protection mechanism, which is constructed based on the trust value of mobile vehicles. The energy consumption of data routing and forwarding can be employed to evaluate the incentive scheme and trust value of nodes. Wei He [42] proposed an energy-saving routing approach based on K-means and FAH, namely the KAK routing algorithm. The objective of this algorithm is to handle the issue of node energy constraints, low delivery ratio, and sort network cycle, with the support of energy consumption reducing mechanism. Loreti, et al. [43] introduces a novel analytic model optimizing the number of discovered peers for a given energy budget, which aims to optimize the minimal network detection energy consumption by dynamically tracking the optimum even in non-stationary state. L. Bracciale et al. [44] constructed a neighbor discovery algorithm based on the duty cycle length to the time-varying context and contact duration. The goal of this approach is mainly to make a tradeoff between energy consumption and network performance.

3. System Model Design

The routing algorithm is a primary issue in the research field of opportunistic networks because of its particularity. The improvement of the transmission environment is reflected in increasing the delivery ratio and decreasing end-to-end delay in opportunistic networks. Recently, many routing algorithms have been proposed based on different application scenarios. However, most routing algorithms tackle the issue of limited network resources using a deterministic approach, which lacks an adaptive data routing mechanism [45]. Moreover, these methods show relatively low scalability because they are probably built up on the basis of some special scenarios rather than general ones. This will likely cause a low quality of service from networks to clients. On the other hand, when the cache of nodes is insufficient, they cannot store and process the data information obtained from message carriers [46]. Consequently, this paper comprehensively considers the significant two-factor including cache space and energy consumption through the fuzzy inference CMFI system.

3.1. The Frame of Adaptive Curve-Trapezoid Mamdani Fuzzy Inference and Decision-Making System

The limited energy and cache are two severe challenges for opportunistic networks. However, few routing algorithms consider the combined impact of the two factors on data transmission. Besides, most routing protocols tackle this issue from a deterministic perspective, which can be formalized as a linear or nonlinear mathematical expression. On the contrary, the relationship between the data transmission and two-factor (energy and cache) is in actuality a type of fuzzy uncertain relationship, while should be defined as the level of membership in a fuzzy system. Therefore, we propose an adaptive two-factor data transmission algorithm based on CMFI. As shown in Figure 1, a numerical comparison is an intuitive way for message carrier or source node to make decisions on data transmission, but it neither discovers the impact of variable change on data transmission, nor distinguishes the influence degree on data transmission between different factors. Therefore, the CMFI system has been considered as a significant approach to achieve the above two goals. In this section, we will introduce the overall structure of the CMFI step by step, as follows:
Step 1: to accurately determine the pattern recognition of data transmission capability of nodes, CMFI system obeys the tripartite method rule from Mamdani fuzzy inference system [37,38], thereby developing three levels of membership functions (low membership function, medium membership function, and high membership function) and the corresponding three levels of fuzzy subsets for each fuzzy input.
Step 2: the nodes in opportunistic social networks are defined as message users who carry several mobile devices, and two-factor fuzzy input could be regarded as fuzzy factor set from CMFI. The message carriers collect two-factor fuzzy input from their neighbor nodes and compute membership degrees for each of fuzzy inputs based on three levels of membership functions (low, medium, and high). In addition, three levels of fuzzy subsets (low, medium, and high) are determined by the three levels of membership functions.
Step 3: with the support of ‘If-Then’ fuzzy rules [36], there are nine different combination that can be generated from fuzzy subsets between the first-fuzzy and second-fuzzy inputs. These nine various combinations reflect nine levels of data processing from nodes, respectively. Besides, neighbor nodes of message carriers are divided into three categories: active next-hop, potential next-hop, and under-resourced next-hop.
Step 4: Due to the specificity of two-factor fuzzy input, CMFI is employed to evaluate the impact of two-factor fuzzy input on the data transmission in opportunistic social networks. The abscissa and ordinate in each of the six membership degrees could produce a closed area with the corresponding level of membership function. The final control result can be acquired from the overlap of these six areas based on the centroid method [38].
Step 5: Through systematic and artificial parameter adjustment, CMFI can optimize the fuzzy control result, which provides support to node classification and to make data transmission more suitable and reliable in opportunistic social networks.
To this end, after the above five interconnected steps, message carriers can evaluate the ability of data storage and routing of neighbor nodes by calculating and comparing their fuzzy control result, thereby continuously optimizing node classification and the selection of the next-hop in the routing table of message carriers.

3.2. The First-Factor Fuzzy Input: Computation of the Remiaing Energy Level

In opportunistic social networks, the purpose of routing algorithm is to construct an end-to-end communication connectivity from the source to the destination. However, wireless mobile devices with limited energy are hardly able to implement the long-distance communication connectivity [47]. To this end, it is a challenge for routing algorithm to use the limited energy of nodes to route data packets. DTCM focuses on the relationship between the residual energy and data transmission, thereby constructing a novel routing strategy for opportunistic networks [37,38].
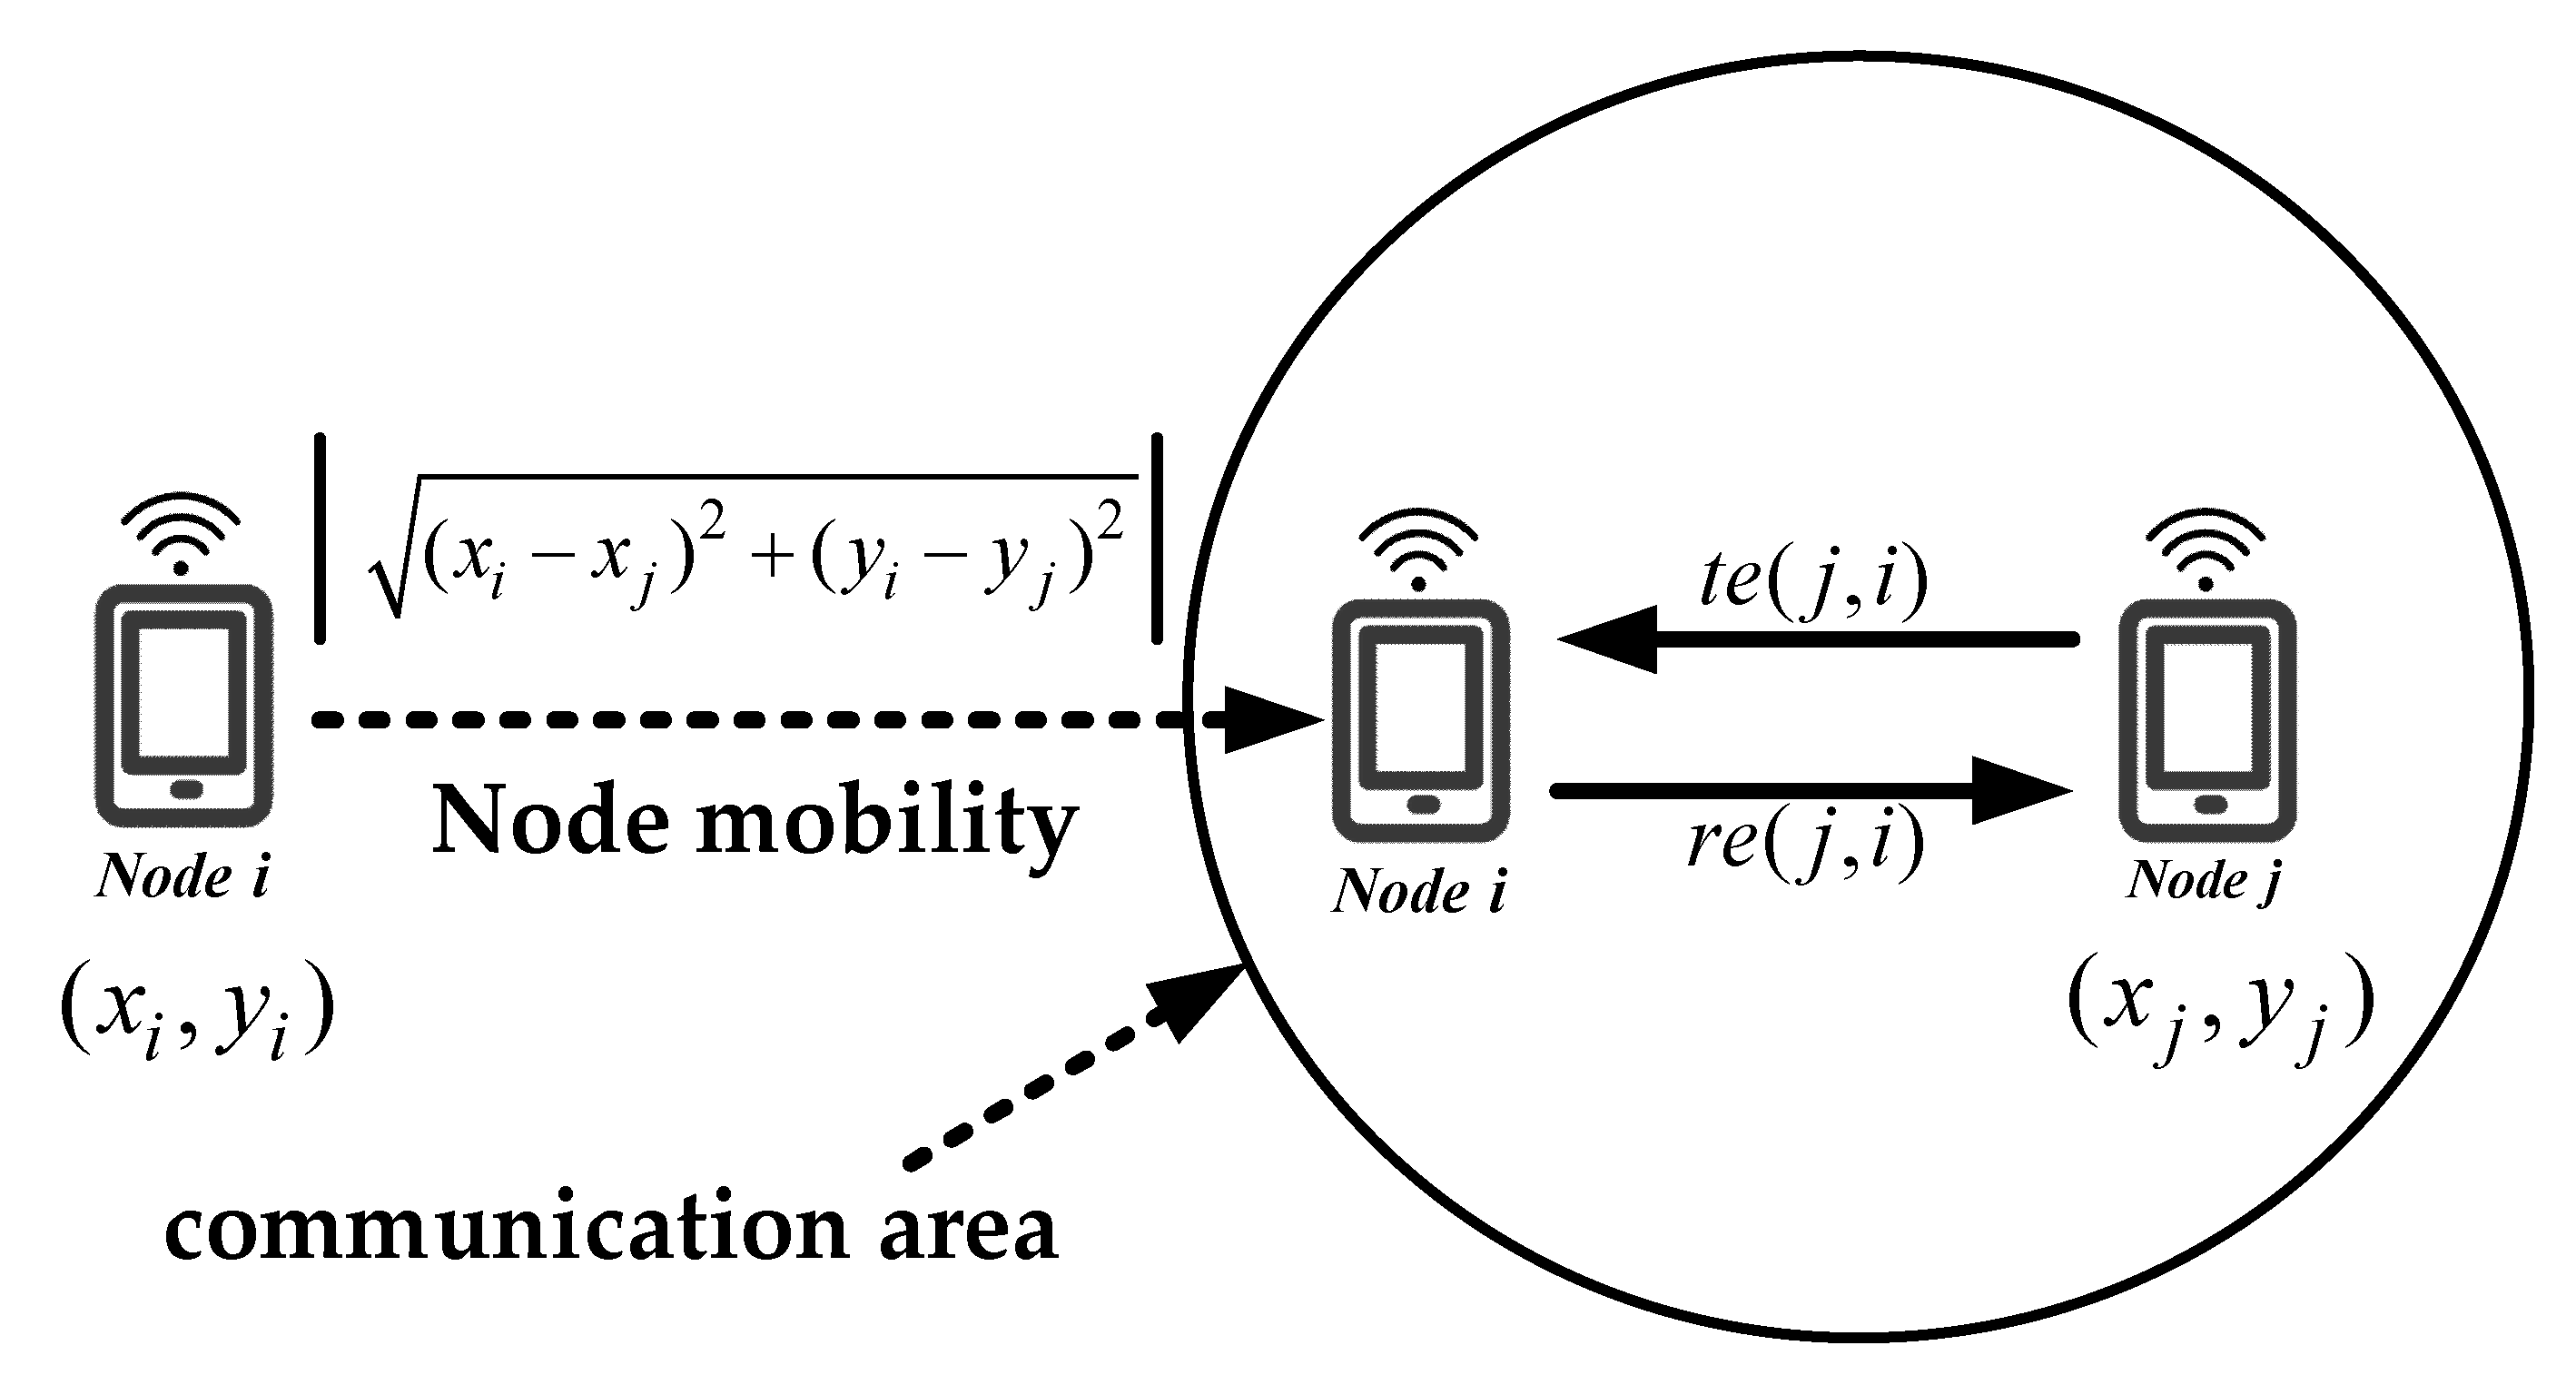
As shown in Figure 2, when n o d e i moves to communication area of n o d e j and communicates with n o d e j , energy consumption is related to mobility distance and the number of data packets. To quantify the whole process, we fist define e ( i , j ) as the energy consumption from data communication between n o d e i and n o d e j . Since the communication between two nodes can only occur in the same communication area, n o d e i needs to move to some locations that are covered by communication area of n o d e j . Accordingly, energy consumption e ( i , j ) can be divided into two aspects of energy consumption: communication energy consumption and mobility energy consumption. Therefore, e ( i , j ) c o m and e ( i , j ) m o b can be regarded as communication energy consumption and mobility energy consumption, respectively, and then the energy consumption e ( i , j ) between n o d e i and n o d e j can be computed by e ( i , j ) = e ( i , j ) c o m + e ( i , j ) m o b .
Since the mobility energy consumption between a pair of nodes is related to the distance between them, we can calculate it from the perspective of movement and unit loss rate. On the other hand, the communication energy consumption rate is related to the amount of data that needs to be transmitted. Then, we denote x and y as the horizontal and vertical coordinate of relay node in two-dimensional geographical position, and define e u n i t m o b as the energy consumption per unit distance, so e ( i , j ) m o b and e ( i , j ) c o m can be calculated by:
{ e ( i , j ) m o b = d ( i , j ) × e u n i t m o b = ( x i x j ) 2 + ( y i y j ) 2 × e u n i t m o b e ( i , j ) c o m = r e ( j , i ) + t e ( j , i )
where x i , x j , y i , and y j are the horizontal and vertical coordinates of n o d e i and n o d e j , respectively. As shown in Figure 1, r e ( j , i ) and t e ( j , i ) are the energy consumption rate of n o d e j receiving data from n o d e i and the energy consumption rate of n o d e j transmitting data to n o d e i , respectively.
Message carriers select a next hop based on the energy consumption from the communication between neighbor nodes and the destination node. Since the energy consumption of each neighbor node and destination node is different, the probability of each neighbor node being selected as a relay node is also different, and this probability can be calculated as:
P ( j , v ) = e ( j , v ) k R e ( k , v ) + e ( j , k )
where n o d e j is a neighbor node of n o d e i and R is a set of relay nodes that have been selected by n o d e j to forward data packets to the destination n o d e v . Only when P ( j , v ) from n o d e j is above those from other neighbor nodes, n o d e j will it be regarded as a reliable relay node and n o d e i will forward data packets to it. Through the evaluation of energy consumption and selecting probability, the energy consumption level of mobile node can be defined as the ratio of the energy consumption of the current node to the energy consumption of all neighboring nodes. To this end, L ( n o d e i ) c from n o d e j can be expressed as:
L ( n o d e j ) e P ( j , v ) k R p ( k , v )
in which R is the se of neighbor nodes of n o d e j .
To maintain the stability of data transmission environment in the networks, we set a lower bound on the remaining energy level of mobile nodes in the network. When the remaining energy level of mobile node is equal to or below this lower bound, the node needs to replenish energy and cannot participate in the routing and transmission of messages. Therefore, the remaining energy level L ( n o d e j , Δ t ) r e form n o d e j (as shown in Equation (1)) can be updated as:
L ( n o d e j , Δ t ) r e = max { L i n i e L ( n o d e j ) e , L min e } L i n i e
where L min e is the lower bound of the remaining energy level from mobile nodes in networks and L i n i e is the initial energy level of mobile nodes. Since the nodes move around randomly in the same communication area and constantly communicate with each other, they update their remaining energy level L ( n o d e j , Δ t ) r e at different time stamps Δ t . Because of L i n i e > L min e , the above Equation (5) holds that L ( n o d e j , Δ t ) r e ( 0 , 1 ] .

3.3. The Second-Factor Fuzzy Input: Computation of the Remiaing Cache Level

Congestion control is one of the most important issue in opportunistic networks because of the limited cache space of mobile devices. In general, there are two mainstream ways to effectively implement congestion control: limiting the number of message copies to avoid generating unnecessary packets and deleting unnecessary packets in a timely manner. However, message carriers decide whether to forward data information to its neighbor nodes by analyzing their storage capacity. To this end, the selection of the next hop node is determined by evaluating the membership level of cache space of neighbor nodes. This is equivalent to the phenomenon of congestion can be effectively avoided once the relationship between data information and cache space is determined.
To avoid data congestion in the data transmission process, DTCM algorithm takes into account the average size of data packets that need to be transmitted, the number of these data packets, and the remaining cache spaces of nodes. We first define C R ( n o d e i ) as the residual cache ratio, which is the ratio between the remaining cache spaces of n o d e i and the size of the data packets transmitted to n o d e i , and it is formalized as:
C R ( n o d e i ) = C S ( n o d e i ) r e m s = 1 u n u s × s i s
where C S ( n o d e i ) r e m is the remaining cache spaces of n o d e i and u represents the total number of messages that received by n o d e i . Moreover, n u s denotes the number of data packets in the message s , and s i s is the average size of each data packet in the message s . When C R ( n o d e i ) 1 , it means that n o d e i has enough cache spaces to store the data group, and data congestion can be effectively avoided, so n o d e i can be considered as a candidate for the next hop; otherwise, data congestion may occur in cache spaces of n o d e i , and message copies will not be forwarded to n o d e i .
With the aim of comparing the storage capacity between each neighbor node, we convert the residual cache ratio C R ( n o d e i ) to the remaining cache level L ( n o d e i ) c , which can be expressed as:
L ( n o d e i ) c = C R ( n o d e i ) k R C R ( n o d e k )
where R is the se of neighbor nodes of n o d e i . The larger the value of L ( n o d e i ) c , the greater the storage capacity from n o d e i than that from other nodes in the same communication area. Also, to maintain the stability and sustainability of the data transmission process, we set a lower bound on the remaining cache level of mobile nodes L min c in the network, and the remaining cache level can be updated to:
L ( n o d e j , Δ t ) r e = L min c L ( n o d e c ) c
where Δ t represents the time stamp for updating the remaining cache level. Equation (A1) satisfies L ( n o d e j , Δ t ) r e ( 0 , 1 ] when L ( n o d e c ) c > L min c , which indicates that the cache capacity of the n o d e i at Δ t is greater than the average cache space horizon of network. Otherwise, L ( n o d e j , Δ t ) r e > 1 means n o d e i is not a reliable next hop in the network, with insufficient caching capacity. In other words, data congestion can be effectively controlled in DTCM algorithm by two assumptions: C R ( n o d e i ) 1 and L ( n o d e j , Δ t ) r e > 1 .

3.4. Computation of Transmission Evaluation Value Based on CMFI

It is well known that most routing algorithms in opportunistic networks tackle the issue of data transmission from the perspective of deterministic problems, which can be formalized as linear or nonlinear mathematical expression. However, the relationship between data transmission and two-factor (energy and cache) is actual a type of fuzzy uncertain mapping, while should be defined as the level of membership in a fuzzy system. In this section, we consider the issue as the membership relationship between data-transmission capability of nodes and their two-factor fuzzy input (the remaining cache and remaining energy). The Mamdani fuzzy inference system [13,23] will be regarded as the model used in the proposed algorithm due to its high extensibility and applicability, and it consists of three components: the fuzzy component, the fuzzy inference component, and the De-Blurring component [13,24,25]. We introduce the rough process of each component in this section and the implement details of CMFI will be described in Appendix A.

3.4.1. The Fuzzy Component

The objective of the inference component is to determine the membership degree and fuzzy subset of nodes. With the support of the method of tripartition, we develop the fuzzy component by three levels of membership functions (low, medium, and high). In general, a fuzzy input can generate three levels of membership degrees and each of them corresponds to one level of fuzzy subset (low, medium and high). There are many distribution models that can be adopted in several application scenes in the control engineering theory, such as the normal distribution, the F distribution and the parabolic distribution, etc. [13,21] As the remaining energy or cache is below a certain lower limit, the node may be dead or unable to move; also, these two values must be below a network adaptable upper limit, so the two-factor fuzzy inputs follow a half trapezoid or trapezoid distribution. To this end, curve trapezoid membership function will be utilized to compute the membership degree of the two-factor fuzzy inputs [23,25] in the proposed improved fuzzy system, namely the Curve-trapezoid Mamdani Fuzzy Inference System (CMFI). After the process of the fuzzy component, each of two-factor fuzzy inputs (energy or cache) can generate three fuzzy degrees and fuzzy subsets.

3.4.2. The Fuzzy Inference Component

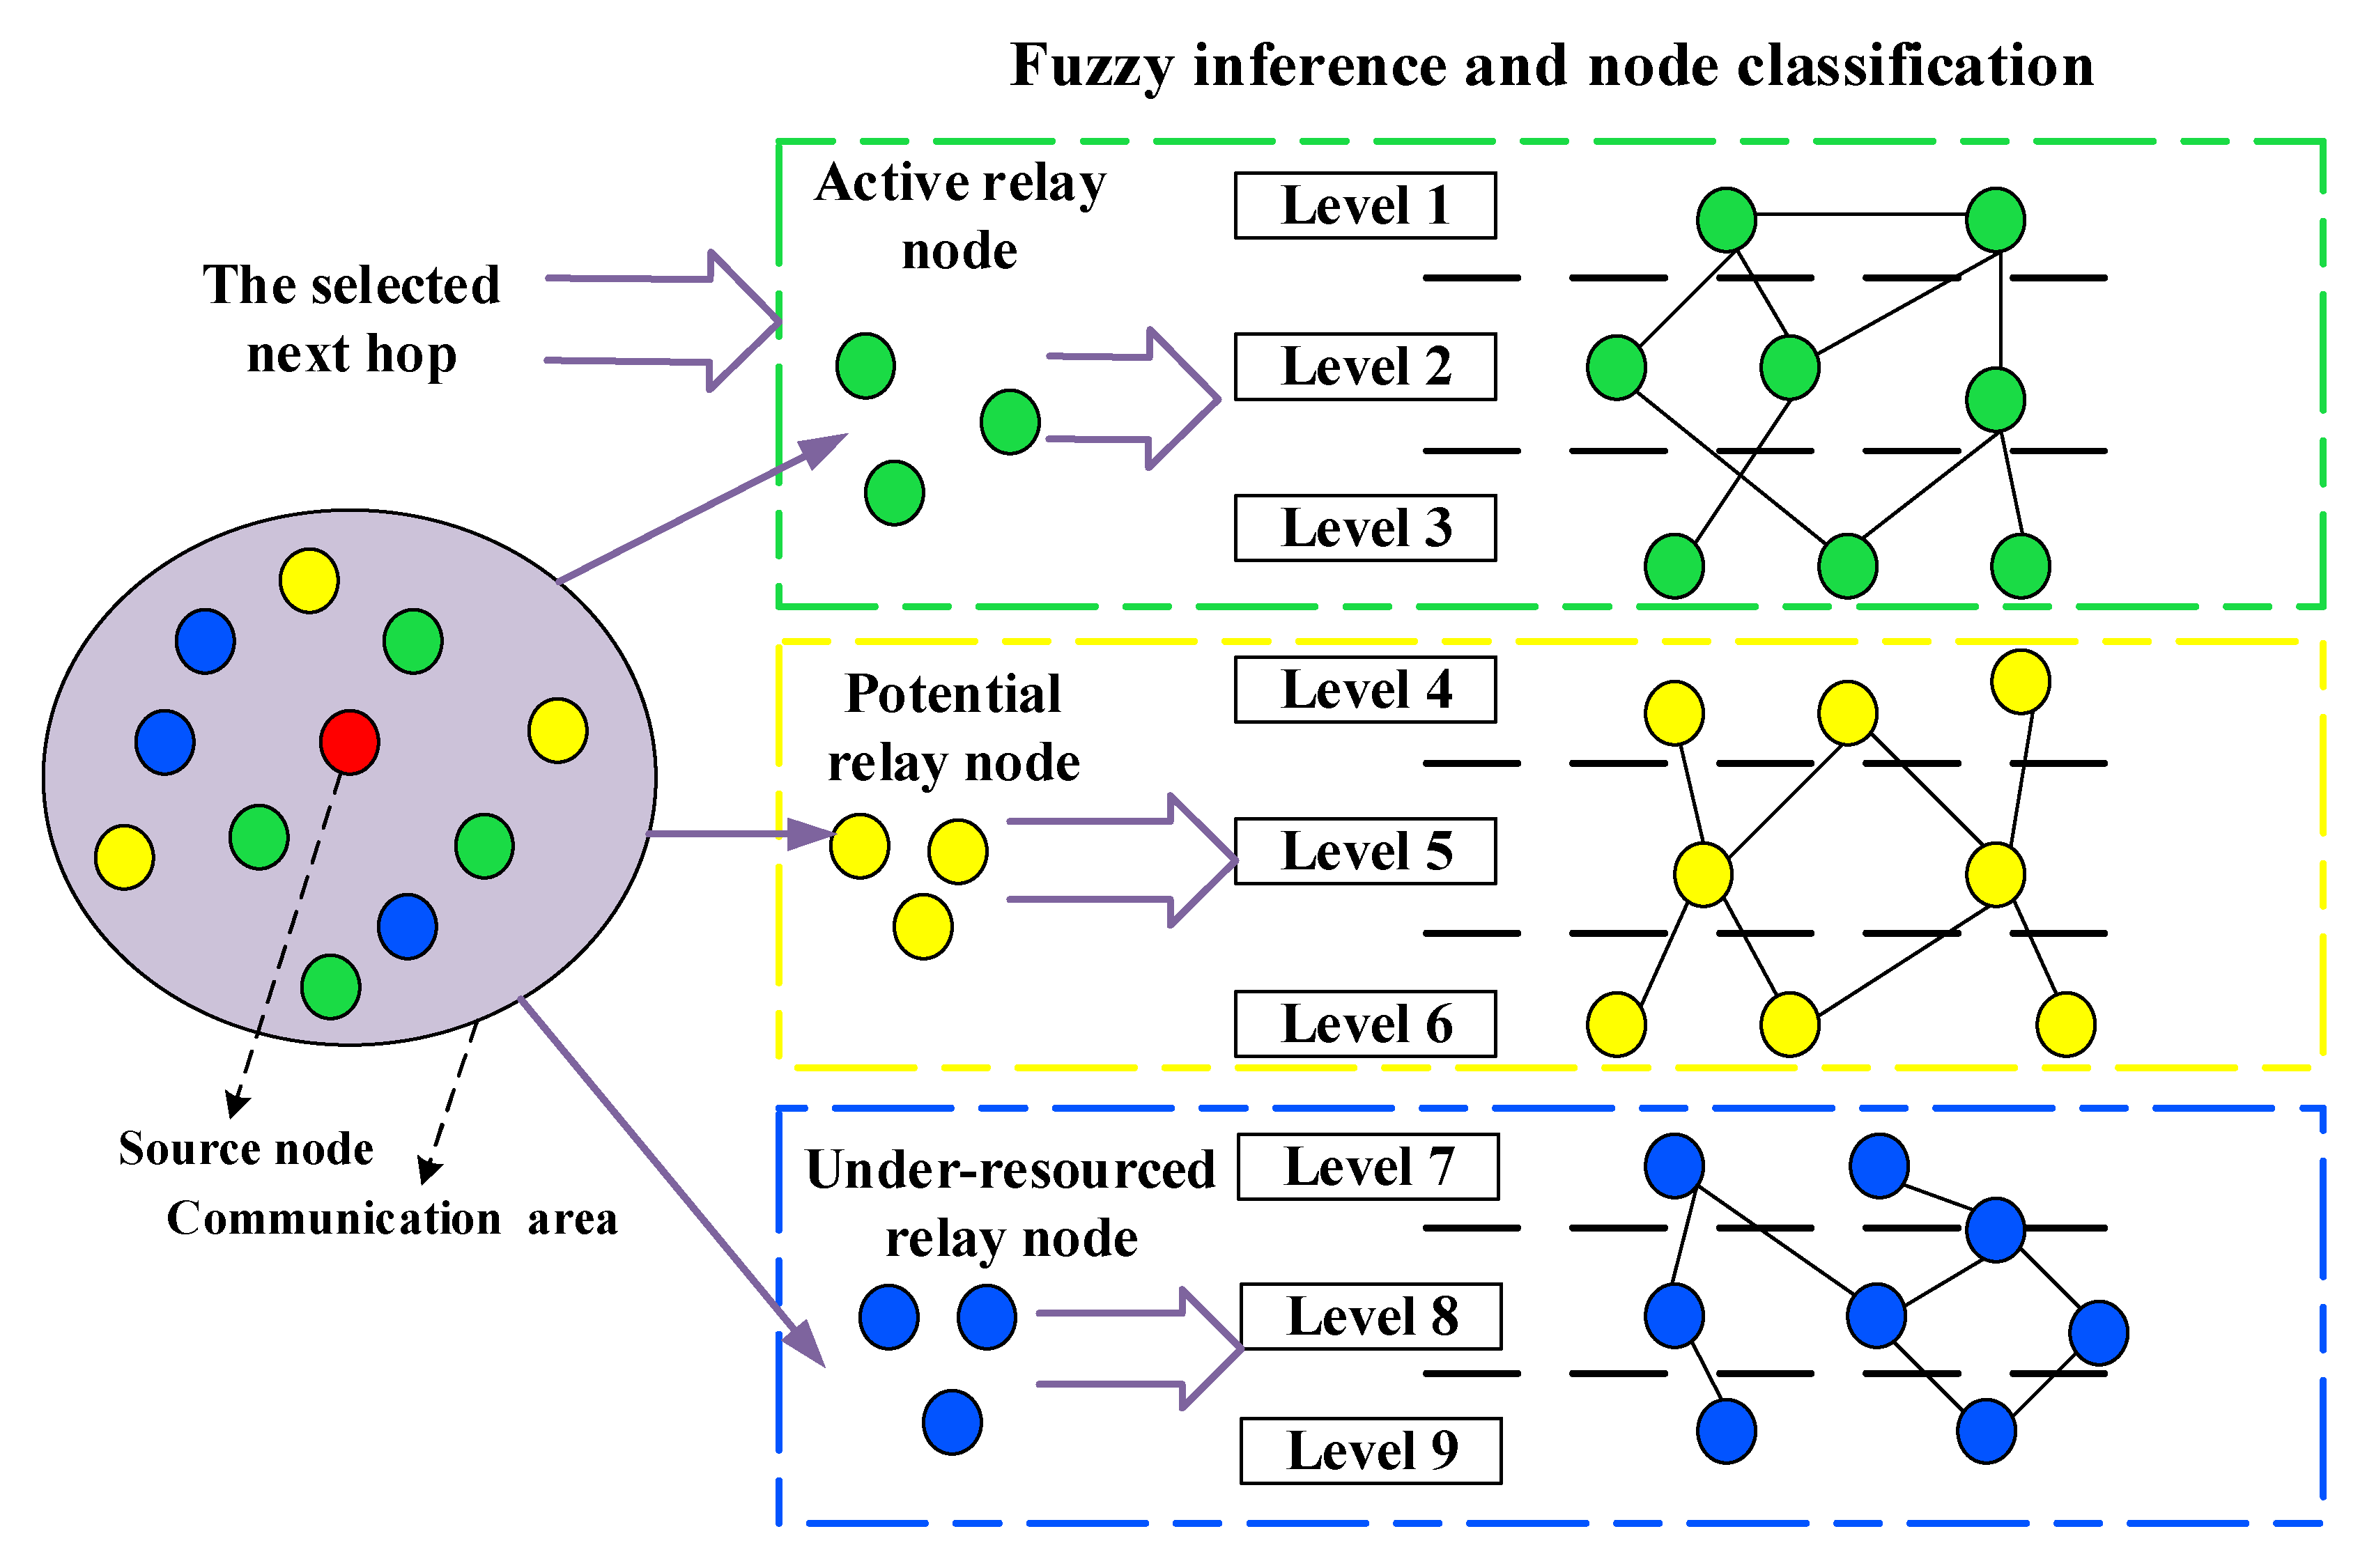
According to ‘If-Then’ fuzzy rules [36], there are nine different combinations that can be generated from the fuzzy subsets between the first-fuzzy and second-fuzzy inputs (the remaining cache and remaining energy). These nine various combinations represent nine different levels of processing data packages. Moreover, neighbor nodes can be classified as three different categories based on the two-condition nine-rule fuzzy inference logic [37,38], where active, potential and under-resourced relay nodes correspond to high (levels 1, 2, and 3), medium (levels 4, 5, and 6), and low (levels 7, 8, and 9) membership levels, respectively. The active relay nodes are the users that move frequently and have high information processing capacity with high energy and cache priority [20,23]. On the contrary, under-resourced nodes could be considered as dead users due to their low remaining energy and cache space. Potential relay nodes may be regarded as reliable next hop users in the future. Accordingly, the source node will select those active rely nodes as its next hop to route and forward data information through the dynamic fuzzy evaluation of data processing capability. This is only a preliminary fuzzy assessment, and the final decision-making requires digital metrics, which can be determined from the De-Blurring component.

3.4.3. The De-Blurring Component

The proposed curve trapezoid Mamdani fuzzy inference system uses the maximum membership principle [13] to compute the corresponding membership degree, which can also be expressed as the method of “first OR then AND” operation [22]. The abscissa and ordinate in each of membership degree can produce a closed area with the corresponding level of membership function. Obeying the mathematics expression of De-Blurring theory [38], we adopt the centroid of the overlap of these six areas to represent the fuzzy control result for two-factor fuzzy inputs. The fuzzy control result is applied to optimize the classification of neighbor nodes, by which the source node or message carrier is able to make a suitable decision on data routing or forwarding in the data transmission process in opportunistic social networks.

3.5. Data Routing Based on Two-Hop Feedback Mechanism

In opportunistic networks, most traditional routing algorithms only consider the selection of the next hop in the data transmission process. On the contrary, the proposed algorithm in this paper pays attention to not only the next hop but also to the second hop [36,37], which obtains a continuity of data transmission. We called it “two-hop feedback mechanism” in this paper.
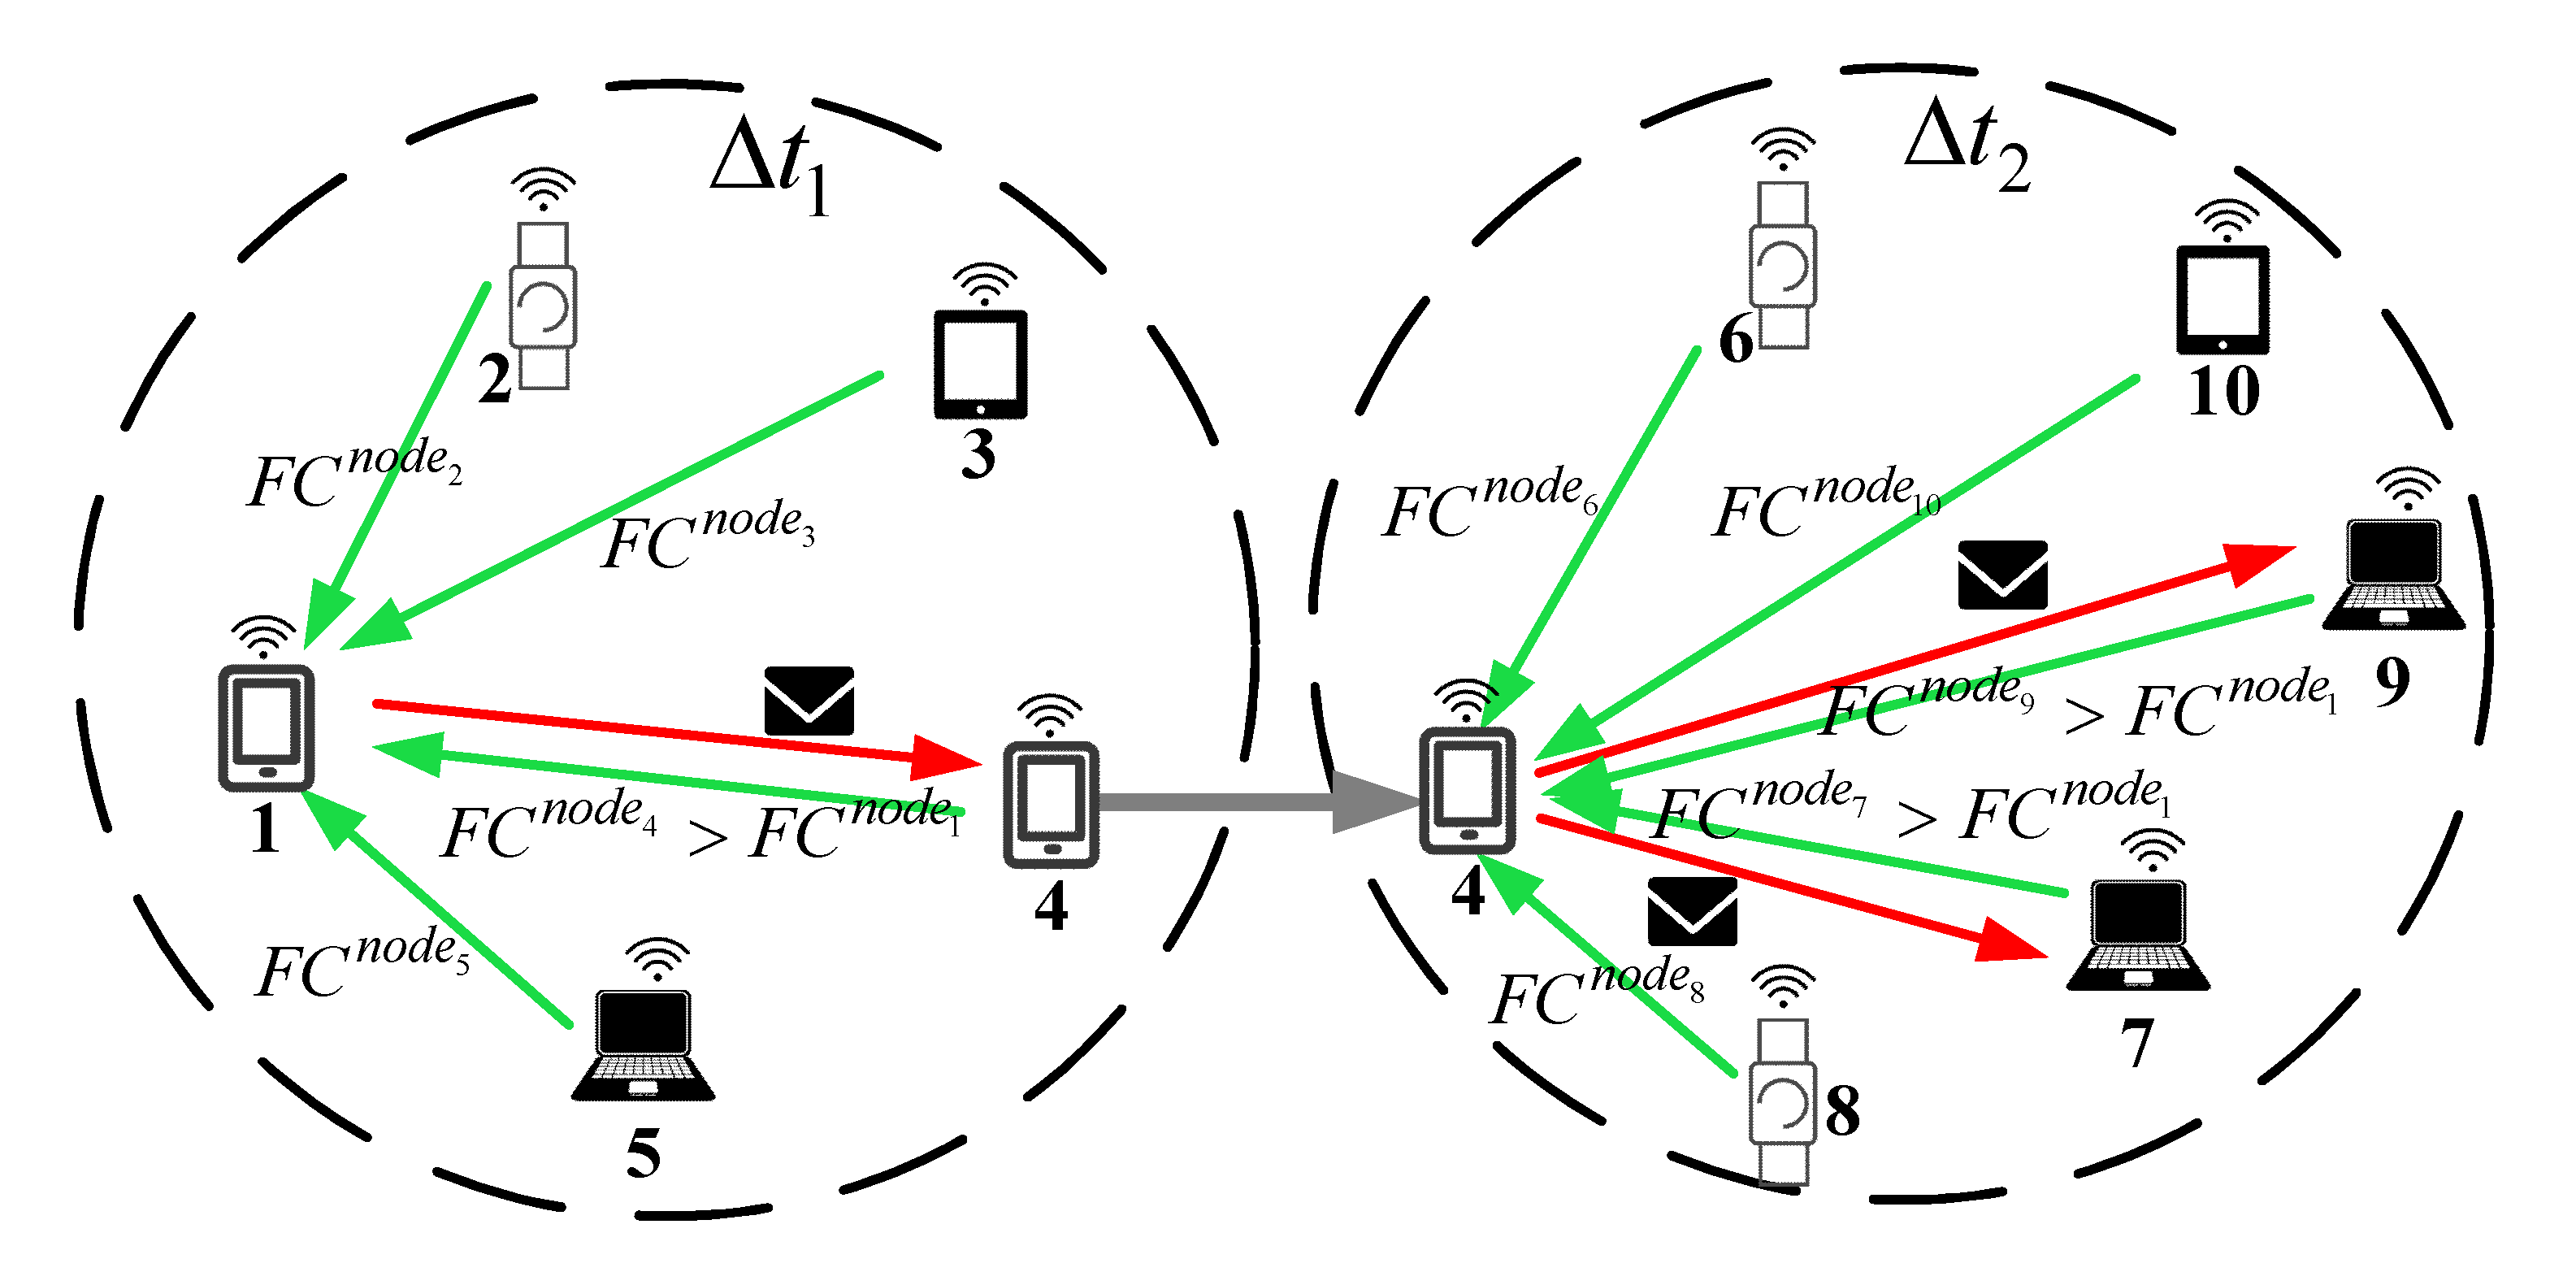
In general, message carriers in routing algorithms of opportunistic networks find a suitable relay node just from the neighbor nodes, while the two-hop feedback mechanism proposes that message carriers seek those nodes with a higher transmission evaluation value than that of themselves as the next hop [43]. As illustrated in Figure 3, the implementation process of the two-hop feedback mechanism is based on two significant assumptions:
Assumption 1.
The n o d e 4 is in two intersecting communication areas simultaneously and will not leave the two communication areas for a very short time. Mobile devices in opportunistic networks communicate with each other by wireless short-range signals, so each of them have different sizes of communication coverage. This also opens up the possibility of this premise and n o d e 4 can acquires information from two communication area.
Assumption 2.
The n o d e 4 has enough processing and storage capacity, which could be a laptop, a vehicle. It is an ambassador between two communications and is responsible for collecting and distributing data associated with the final control result of each node. In practice, the amount of data that needs to be transmitted is small, because message carrier n o d e 1 only needs the value of the final control evaluation from each node.
From Figure 3, Δ t 1 and Δ t 2 are two very close time stamps. The source n o d e 1 and its neighbor nodes n o d e 2 , n o d e 3 , n o d e 4 , n o d e 5 are located in the same communication area at the time stamp Δ t 1 , while n o d e 4 , n o d e 6 , n o d e 7 , n o d e 8 , n o d e 9 , and n o d e 10 stay in another communication area at the time stamp Δ t 2 . The green arrows represent gathering information related with the transmission evaluation value, while the red arrows are the process of routing and forwarding messages. According to the above assumptions, the process of two-hop feedback mechanism transmission can be implemented as follows:
Step 1: Each node determines its own final control evaluation value F C and analyzes the membership level of fuzzy inputs on data transmission.
Step 2: The n o d e 4 collects the final transmission evaluation value F C from its neighbor nodes n o d e 6 , n o d e 7 , n o d e 8 n o d e 9 , and n o d e 10 , then forwards these data information to message carrier n o d e 1 .
Step 3: The message carrier or the source n o d e 1 collects the final transmission control result from its neighbor nodes n o d e 2 , n o d e 3 , n o d e 4 , and n o d e 5 as well as the second-hop nodes n o d e 6 , n o d e 7 , n o d e 8 , n o d e 9 , and n o d e 10 .
Step 4: The n o d e 1 compares the collected final transmission result with its own value and optimizes the classification of nodes (active, potential and under-resourced relay nodes).
Step 5: Because F C n o d e 4 > F C n o d e 1 , F C n o d e 7 > F C n o d e 1 , and F C n o d e 9 > F C n o d e 1 , the source node n o d e 1 only transmits data to its neighbor n o d e 4 , and then sends messages to n o d e 7 and n o d e 9 , the messages can be forwarded to the destination eventually through the two-hop feedback mechanism.
Theoretically, the node with a larger final transmission control value has the greater capacity to process and store data information. The network performance can be further improved if the data packet is processed by these nodes. To this end, if data information is lost, cannot be collected or there is no node’s transmission control value that is greater than message carrier, the n o d e 1 will keep message duplicates in its own cache space and find active relay nodes by randomly moving to another communication area. Since the amount of data associated with transmission control value that needs to be transmitted is extremely small, the relevant data can be collected promptly, even in the dynamical topology structure of opportunistic networks.

3.6. Algorithm Complexity Analysis

For the analysis of expandability and applicability, Algorithm 1 is reasonably developed to analyze the complexity of the proposed DTCM algorithm. From Algorithm 1, during the process of information collecting and updating, the nodes transmit state information queue to the peers they encounter, so the time complexity of this process is O ( n ) . Additionally, each node adopts two-factor fuzzy inputs to determine transmission evaluation value in the second loop, therefore, the time complexity of this process is O ( n ) . Eventually, the time complexity of two-hop feedback mechanism is O ( log 2 n ) . To this end, the overall time complexity of DTCM algorithm is O ( n + n + log 2 n ) = O ( n ) . Compared with the time complexity of the DTCM algorithm, the time complexity of FCNS algorithm is O ( n ) , and those from Spray and Wait [47] and Epidemic algorithms [48] are O ( n log n ) and O ( n ) , respectively.
Algorithm 1. Data routing and forwarding in a delay-tolerant routing (DTCM) algorithm based on the (curve-trapezoid Mamdani fuzzy inference) CMFI system.
Input: the source n o d e s , neighbor nodes n o d e 1 n o d e n , and the destination n o d e d
Output: F C n o d e 1 , F C n o d e 1 F C n o d e n
1 Begin
2    For (int i = 1; in; i++) do
3      n o d e 0 collects state queue information S Q ( n o d e i ) from n o d e i ;
4      n o d e i collects state queue information S Q ( n o d e i + 1 ) from n o d e i + 1 ;
5    End for
6    For (int i = 1; in; i++) do
7     computing their own two-factor fuzzy input L ( n o d e i ) c and L ( n o d e i ) r e ;
8     determining the fuzzy evaluation subset F M ( x j n o d e i ) and membership degree μ x j n o d e i ;
9     assessing the transmission evaluation value F C n o d e i ;
10     output F C n o d e 1 , F C n o d e 1 F C n o d e n ;
11   End for
12   If ( n o d e 0 . i s M e s s a g e C a r r i e r ( ) n o d e i . i s N e i g h b o r ( n o d e 0 ) ) then
13    If ( F C n o d e 0 > F C n o d e i F C n o d e i > F C n o d e j ) then
14      the source n o d e 0 forwards messages to its neighbor n o d e i ;
15     the relay node n o d e i transmits messages to its neighbor n o d e j ;
16    End if
17   End if
18 End

4. Simulation

In this section, we conduct experimental studies in a realistic network mobility model where all the theoretical assumptions of the proposed algorithm do not hold, which provides a fair comparison among it and the compared protocols. The simulation not only illustrates the improved performance under DTCM algorithm, but also provide insight in the suitable selection of network paraments such as the remaining level of network energy L min e and the remaining level of network cache L min c , etc. In this simulation, we first evaluate the energy and cache assumption of DTCM algorithm via a benchmark protocol, and then give a fair comparison between five routing protocols under the same experimental environment. The result demonstrates that the proposed protocol outperforms other ones in terms of delivery ratio and end-to-end delay within a reasonable fault-tolerant interval.

4.1. Simulation Setup

4.1.1. Introduction of Benchmark and the Compared Protocols

In opportunistic networks, there are several paradigms of the mobile model that can be adopted to demonstrate the real mobile characteristics of peopel. To evaluate the resource consumption of DTCM algorithm, a suitable candidate, namely Epidemic [48], which heavily relies on resource supply, can be chosen as the benchmark protocol in this simulation. Moreover, to fully reflect the performance of DTCM algorithm, it will be compared against other four protocols: FCNS (a fuzzy routing algorithm using comprehensive node similarity) [13], P&F (Predict and Forward routing algorithm) [18], Spray and Wait [47], and Epidemic [48]. Performance comparison among the five algorithms is summarized at length, mainly focusing on three aspects: delivery ratio, end-to-end delay, and network overhead. To comprehensively evaluate the details of implementation and performance of each approaches, this paper develops Table 2 to demonstrate the significant differences among the five routing algorithms, from a perspective of theoretical analysis. This comparison provides an effective benchmark for the above five routing algorithms when data congestion has been controlled.

4.1.2. Experimental Parameter Setting

To provide a fair comparison, we give the same experimental setup to the five routing algorithms and the only difference is the method of selecting the next suitable hop. HCMM (Health Capability Maturity Model), which has been well known as a real community-based human mobile scenario, is used to test the performance of those algorithms. We allow Spray and Wait and Epidemic to implement the data transmission across node communities, because they do not rely on the node community. Opportunistic Network Environment (ONE) is regarded as a tool package to conduct this simulation. Furthermore, the other common experimental parameter setup is demonstrated in Table 3.
It is worth noting that this experiment consists of 16 groups and each group conducts the tests 5 times. In the HCMM model, each node is assigned a community, and the nodes tend to the community they are interested in. The nodes in the same community are randomly distributed, and the communication between them is more frequent than the nodes from two different communities. Overall, HCMM simulates a real social scene in which nodes move randomly between communities. Additionally, on the basis of general performance indexes from ONE platform, this experiment mainly focuses on the following five indicators:
  • Energy consumption: this parameter represents the total energy consumption from the network, including node mobility, data transmission, task processing, etc.
  • The remaining cache: this parameter indicates that the size of the remaining cache space of a node after it stores enough data grouping.
  • Delivery ratio: this indicator represents the ratio of the number of data packages accepted by destination to the total number of packages sent from message carriers. This indicator is calculated by DR = PA/PS, in which PA is the number of messages from all successful data transmission and PS is the number of messages sent from all mobile nodes.
  • Average end-to-end delay: this definition includes the delay from data routing, node waiting, and data transmission in a successful data transmission between a pair of mobile nodes. It is formalized as AD = TD/m, in which TD represents the total network delay and m is the number of data deliveries.
  • Network overhead: this indicator denotes the total network overhead from the whole data transmission process among all nodes in the communication area, in which routing and forwarding delay, energy consumption, and memory usage are included.

4.2. Analysis of Experimental Results

4.2.1. Algorithm Performance Comparison between Five Routing Algorithms

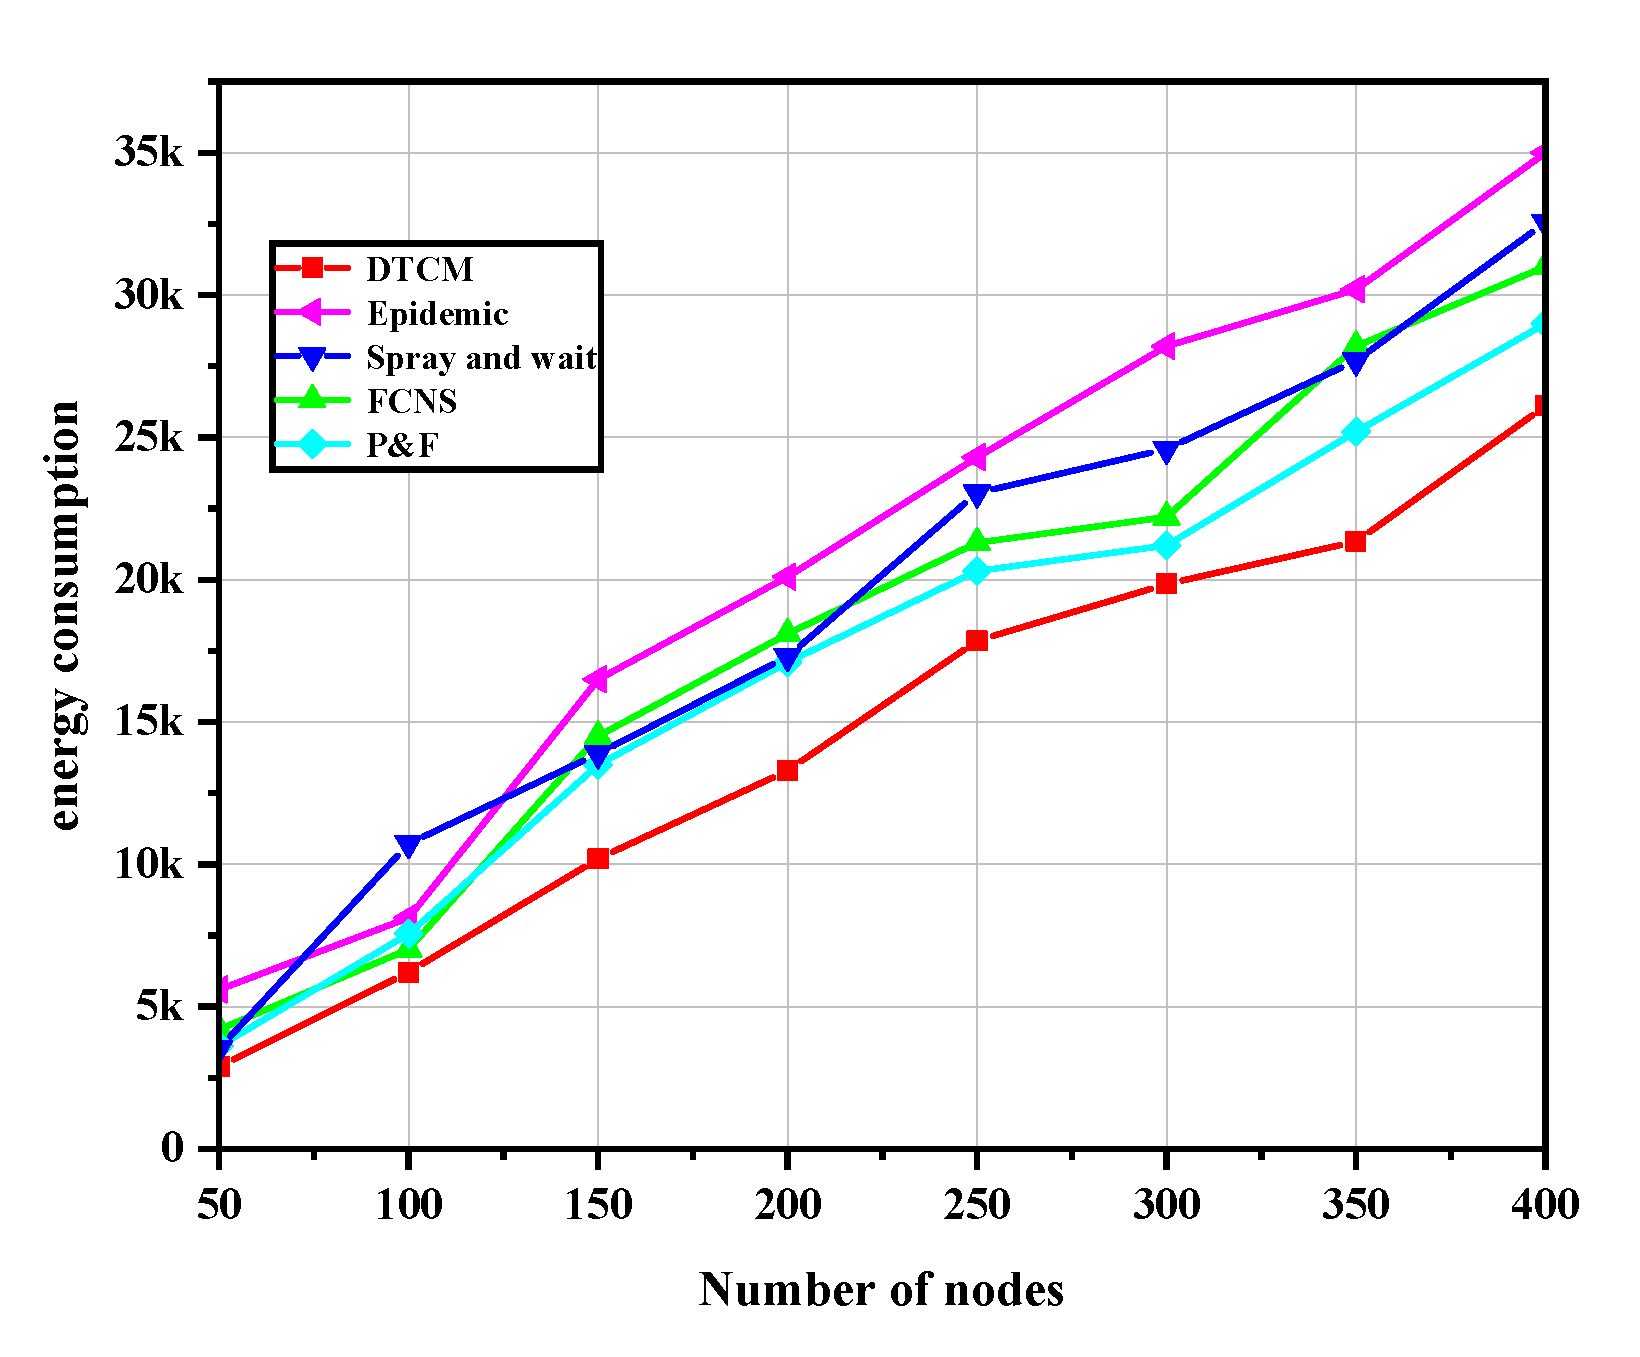
Figure 4 plots the total network energy consumption between five routing algorithms for a various number of nodes. As seen in Figure 4, the total energy consumption is proportional to the number of nodes, which is due to the fact that energy assessment mechanisms weed out nodes whose energy levels are below the average level. Since the increasing number of nodes indicates more relay nodes involved in the data transmission process, the total energy consumption consistently and sharply rises up. As a benchmark protocol, Epidemic shows a highest energy consumption (35,000) as the number of nodes increase from 150 to 400. The flooding model adopted in Epidemic is able to realize the frequent data exchange among nodes and maximize the data grouping, which leads to a relatively high energy consumption. DTCM adopts the fuzzy inference system to evaluate the residual energy of nodes and ensure that the next hop has enough energy to process data information, so the energy consumption under DTCM is the lowest among the five routing algorithms. The implementations of P&F and FCNS do not consider the energy control and are based on a complex structure, so the total energy consumption from them is at a mid-horizon as the number of nodes increase from 150 to 400. The Energy consumption from Spray and Wait is slightly superior to that from Epidemic because of the flooding strategy with the control of the number of data packages.
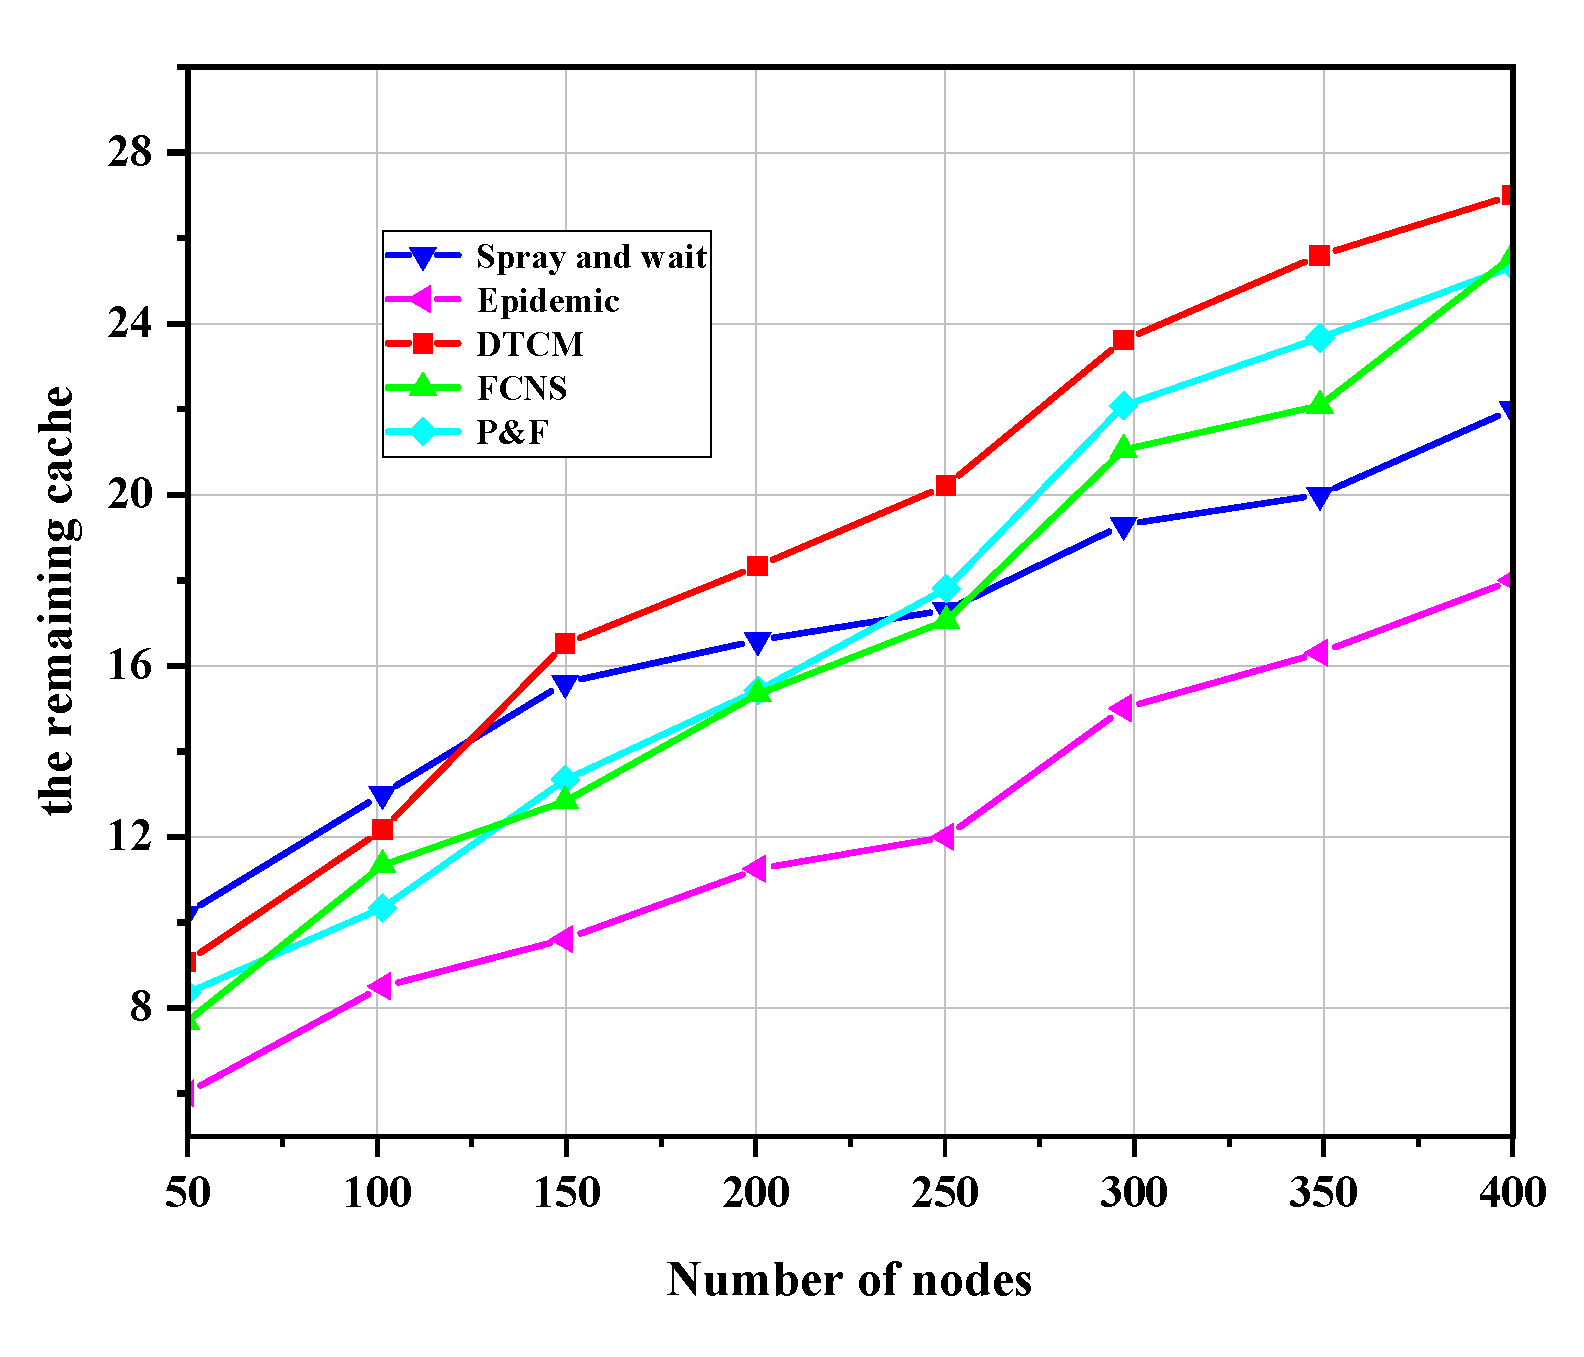
Figure 5 shows that the comparison on the average remaining cache for per node among the five routing protocols when given the initial cache space is 35 Mb. As shown from Figure 5, the benchmark protocol (Epidemic), FCNS, and P&F are inferior to DTCM in terms of this evaluation parameter as the number of nodes increase from 50 to 400. This is because Epidemic, FCNS, and P&F fail to judge whether the node has enough cache space to store data grouping and even allows all message carriers to transmit data grouping to any node they encounter. On the contrary, DTCM adopts a type of cache assessment method to analyze the remaining cache spaces of each node and then select the node with the enough cache spaces as the next hop. Moreover, the remaining cache level L min c sets a lowest bound for all nodes in the networks, due to which DTCM shows a higher average remaining cache than Spray and wait when the number of nodes increase from 150 to 400. However, when the number of nodes is between 50 to 150, their sparse distribution results in a declines of the frequency of information exchange, and also Spray and Wait has controlled the number of data packages, therefore, the remaining energy consumption from it lower than that from DTCM during this period.

4.2.2. Performance Comparison between the Five Algorithms

In this section, we provide a fair comparison on the performance of the five algorithms based on the same simulation environment, and analyze the distribution of error, standard deviation, etc. To this end, the accuracy of experimental results can be guaranteed.
As shown in Figure 6, the delivery ratio from the Epidemic algorithm is lower than that from the other algorithms all the time. The reason for that is Epidemic is based on the flooding model, under which massive data groups lead to network congestion and performance degradation. The delivery ratios from P&F and Spray and Wait are at the medium horizon all the time. This is because they utilize a two-phase mechanism to control the number of message duplicates and then to avoid data congestion.
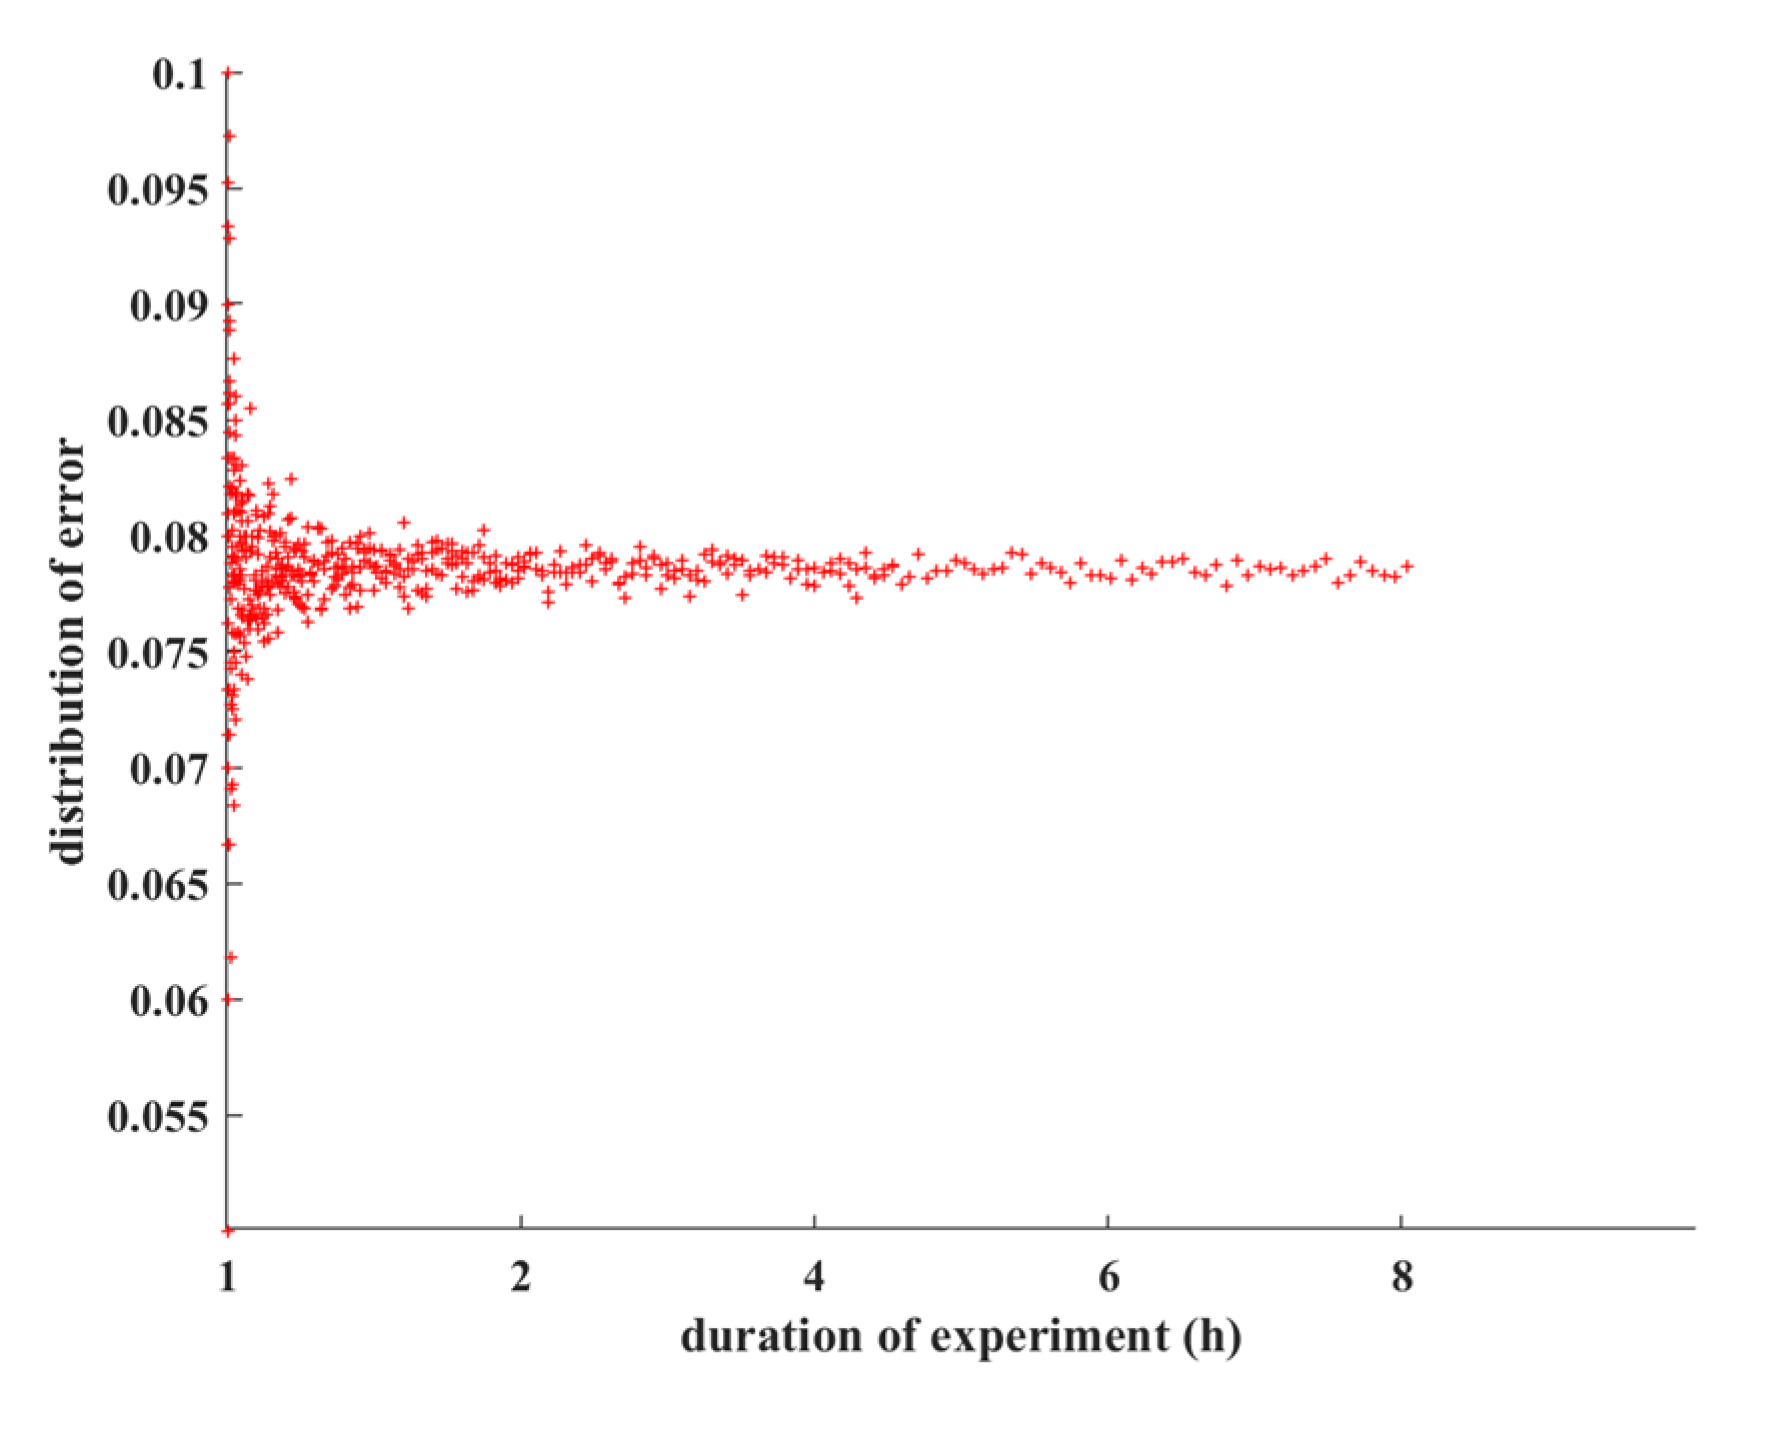
As we seen in Figure 6, THE delivery ratio from DTCM is approximately 0.75 as the cache increases from 10 to 35 Mb. DTCM evaluates the ability of each node to process messages through cache and energy and adopts a comprehensive fuzzy evaluation method to determine the special relationship between the two-factor and data transmission. More reliable relay nodes participate in the data transmission process, so the total number of hops from source to destination decreases and the delivery ratio is improved. When the cache space is 15 Mb, the delivery ratio from FCNS is higher than that from DTCM, because FCNS improves the selection of relay nodes through their similarity. However, FCNS cannot handle the data congestion when the size of cache space increases from 15 to 30 due to its simple structure. Figure 7 plots distribution of errors from experiments on delivery ratio comparison. From Figure 7, it is shown that those errors obey an approximate normal distribution and converge to 0.078 with the increases of the duration of the experiment. This is an acceptable fault tolerance interval of 0.05~0.1.
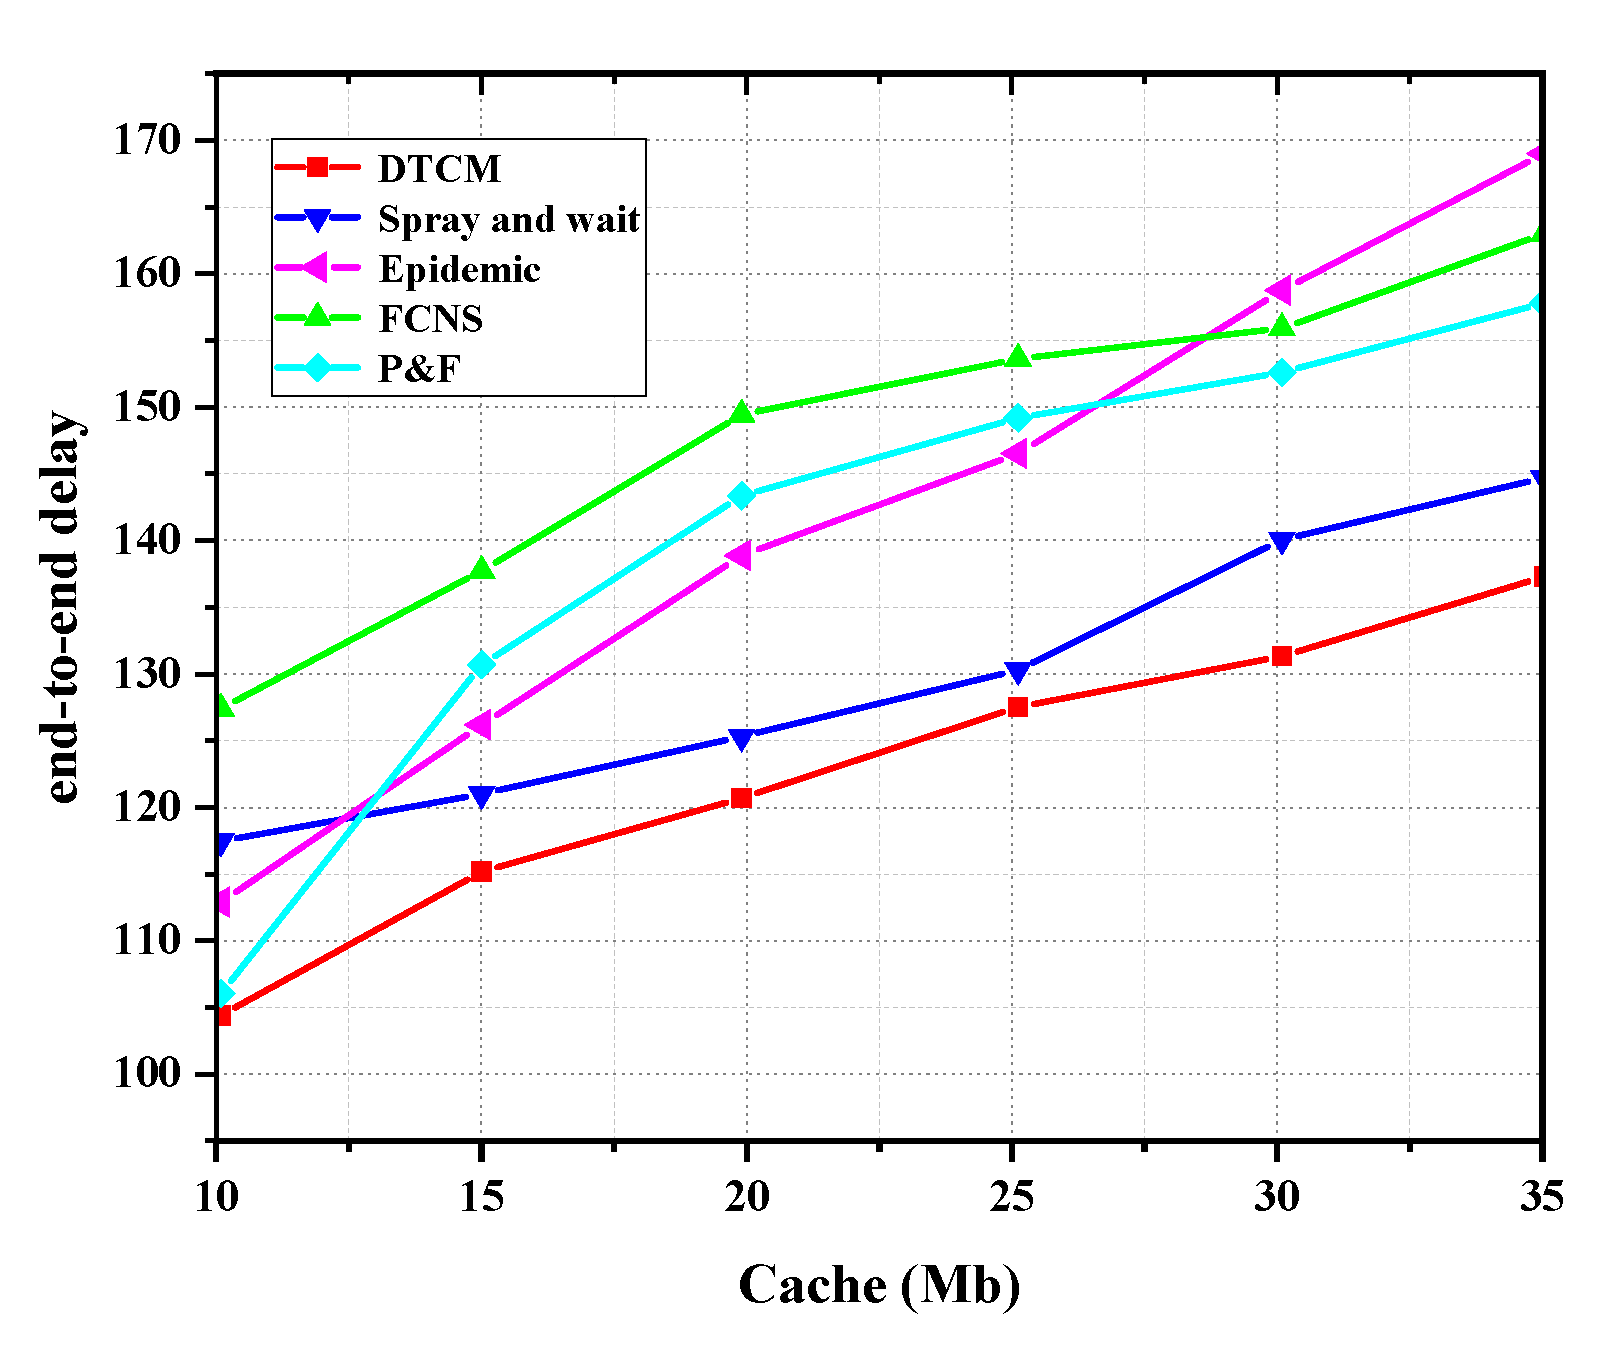
Then, the performance evaluation comparison between the five algorithms in terms of average end-to-end delay is exhibited in Figure 8. As the cache space increases from 10 to 35 Mb, average end-to-end delay from Epidemic, FCNS, and P&F algorithms is higher than that from DTCM and Spray and Wait. Due to the small amount of data transmission, the delay from Spray and Wait is closest to the optimal.
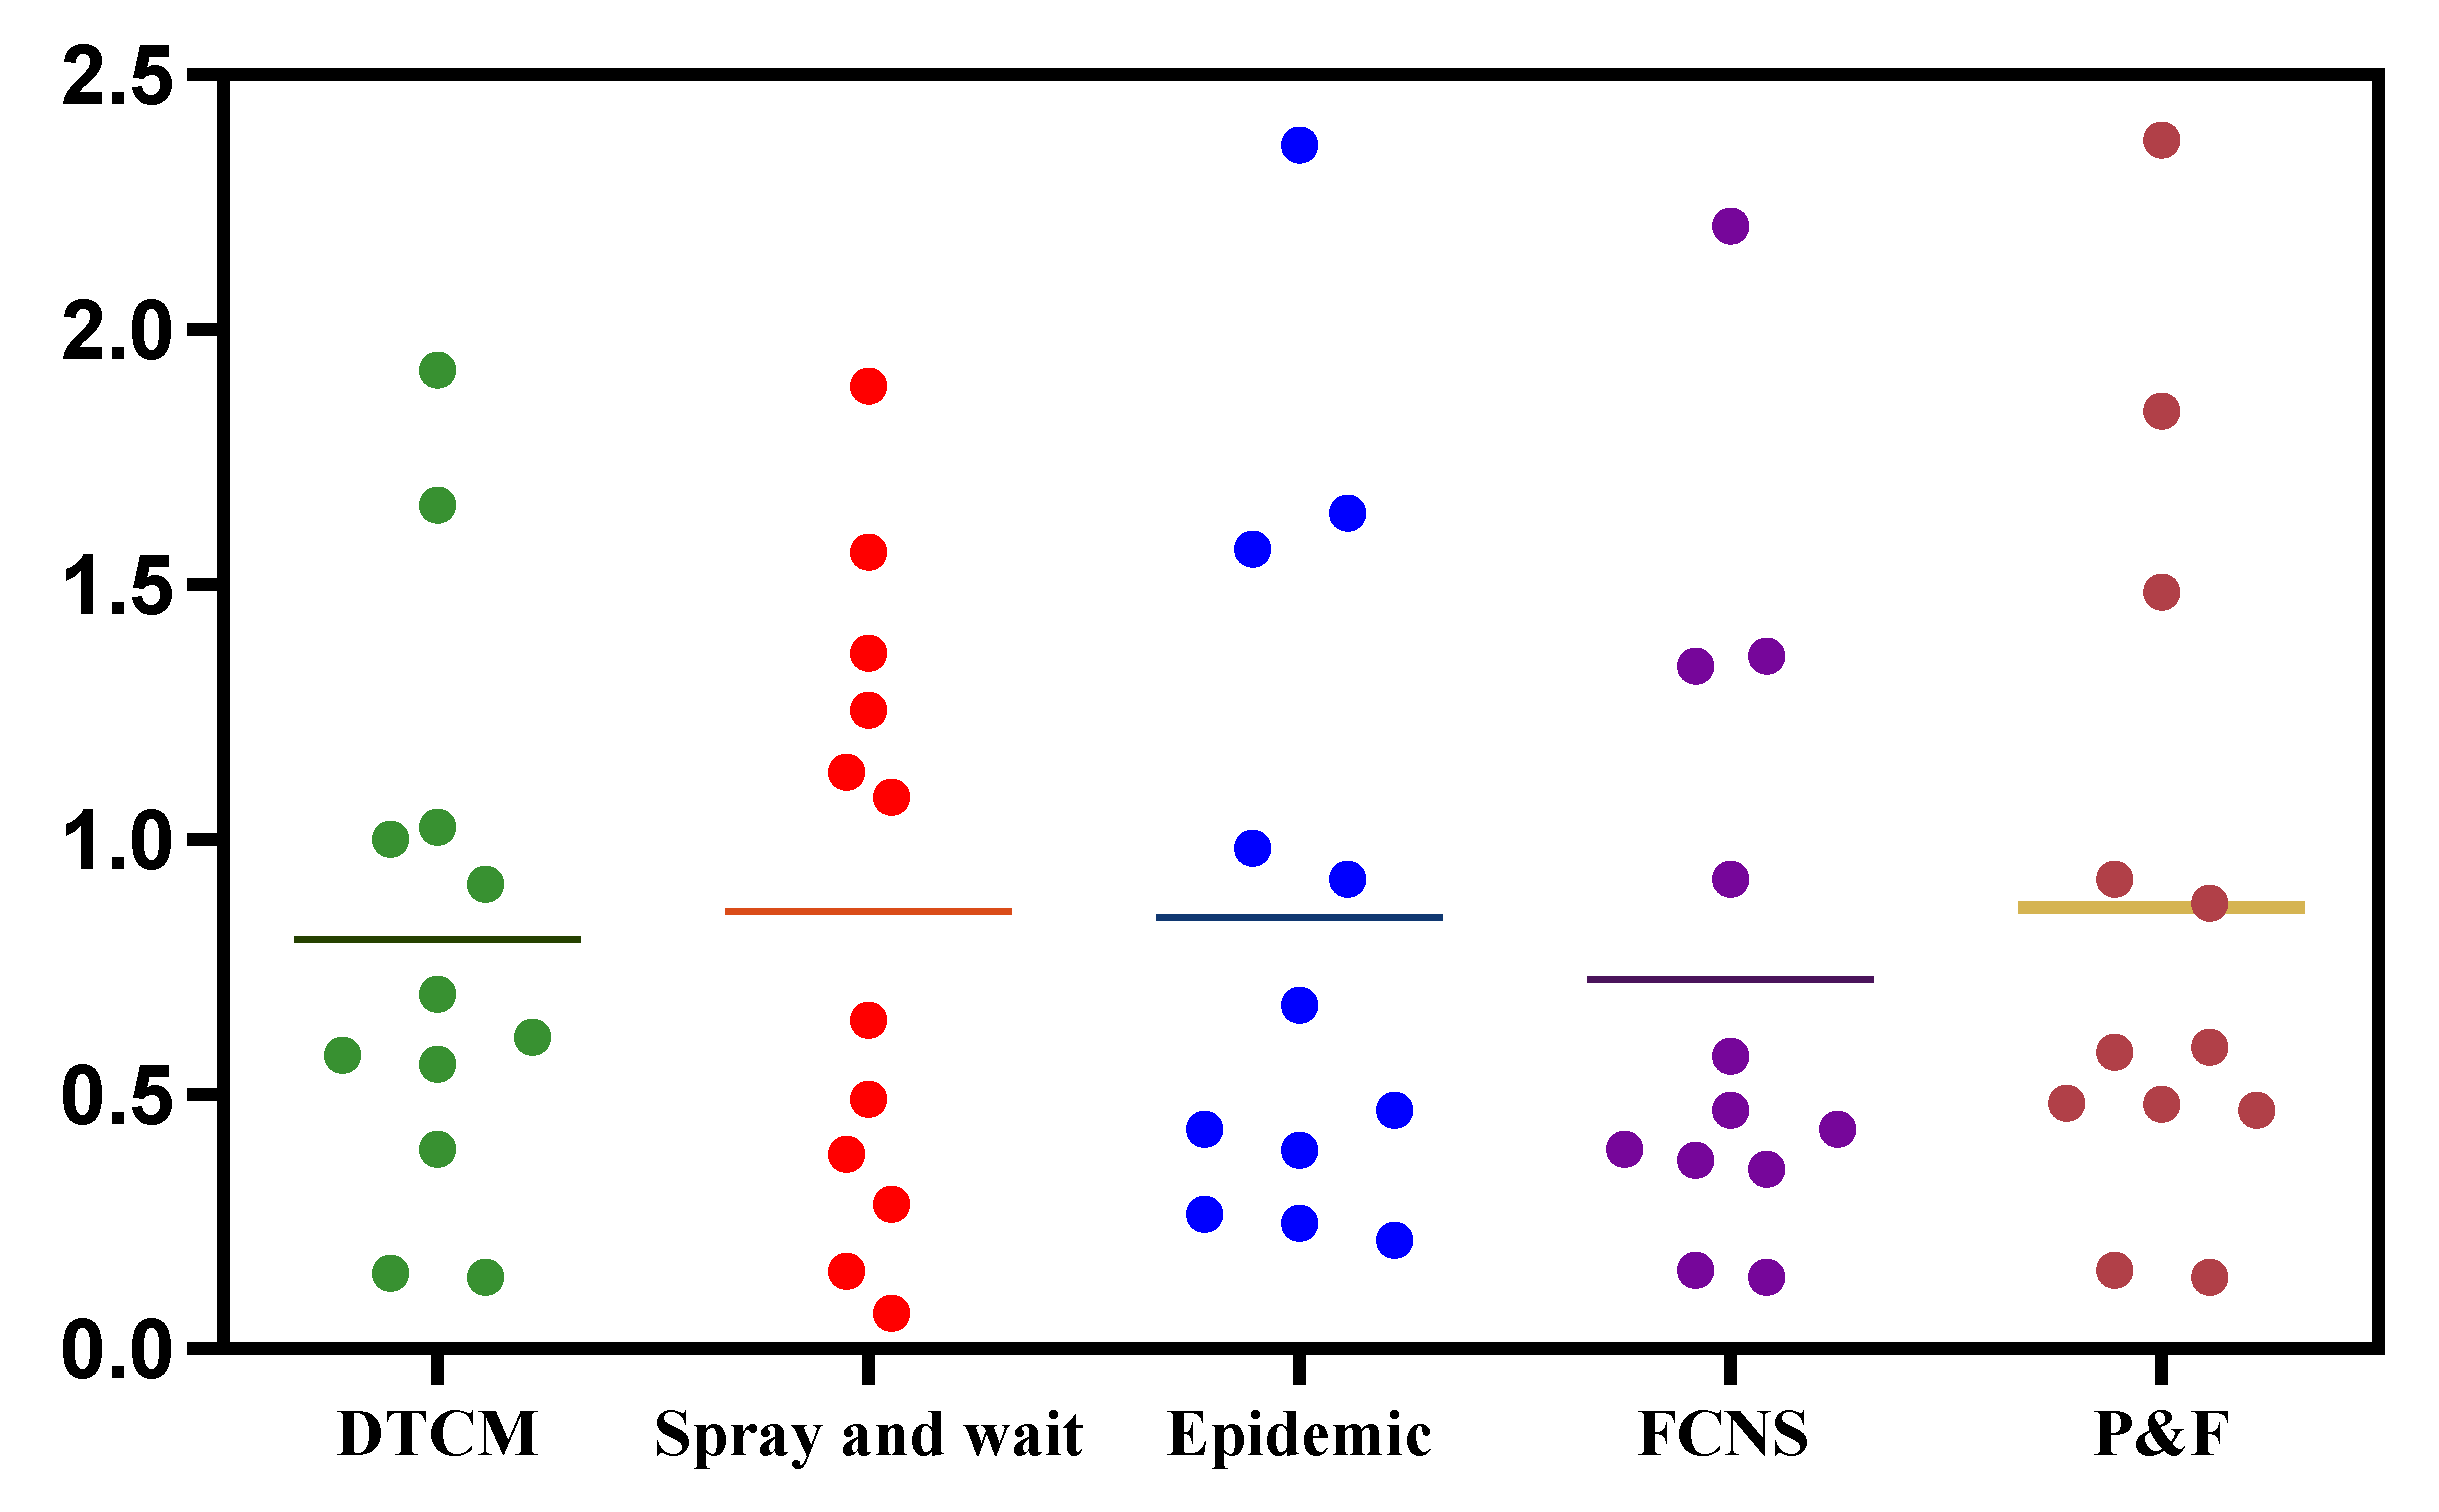
As a type of two-phase scheme, P&F involve a special period that is known as “wait stage”, in which a long waiting for destination will increase the end-to-end delay. Epidemic demonstrates an average end-to-end delay of about 140 min because of a large of message duplicates in the networks. As shown in Figure 8, the fuzzy inference system in DTCM is helpful in reducing the influence of independent variable change on decision uncertainty. To this end, the average end-to-end delay from DTCM remains a relatively low level all the time. FCNS is significantly inferior to FCNS in term of average end-to-end delay. On the one hand, energy and cache space are two of the most significant metrics to be considered in the data transmission process. On the other hand, the structure of curve-trapezoidal distribution adopted by CMFI is simpler than that of the normal distribution used in FCNS, which meets the requirements of low computing and low energy consumption in most mobile devices. Overall, average end-to-end delay from DTCM decreases nearly 25% than that from FCNS. In Figure 9, the dots represent the distribution of standard deviations from multiple experiments, and the horizontal line represents the mean of these standard deviations. The mean of standard deviation from DTCM and Spray and Wait are about 0.8 and 0.9, respectively. The distribution of standard deviation from the other three algorithms is sparser, which means the accuracy of the experiments on DTCM and Spray and wait is higher than those on the other three algorithms.
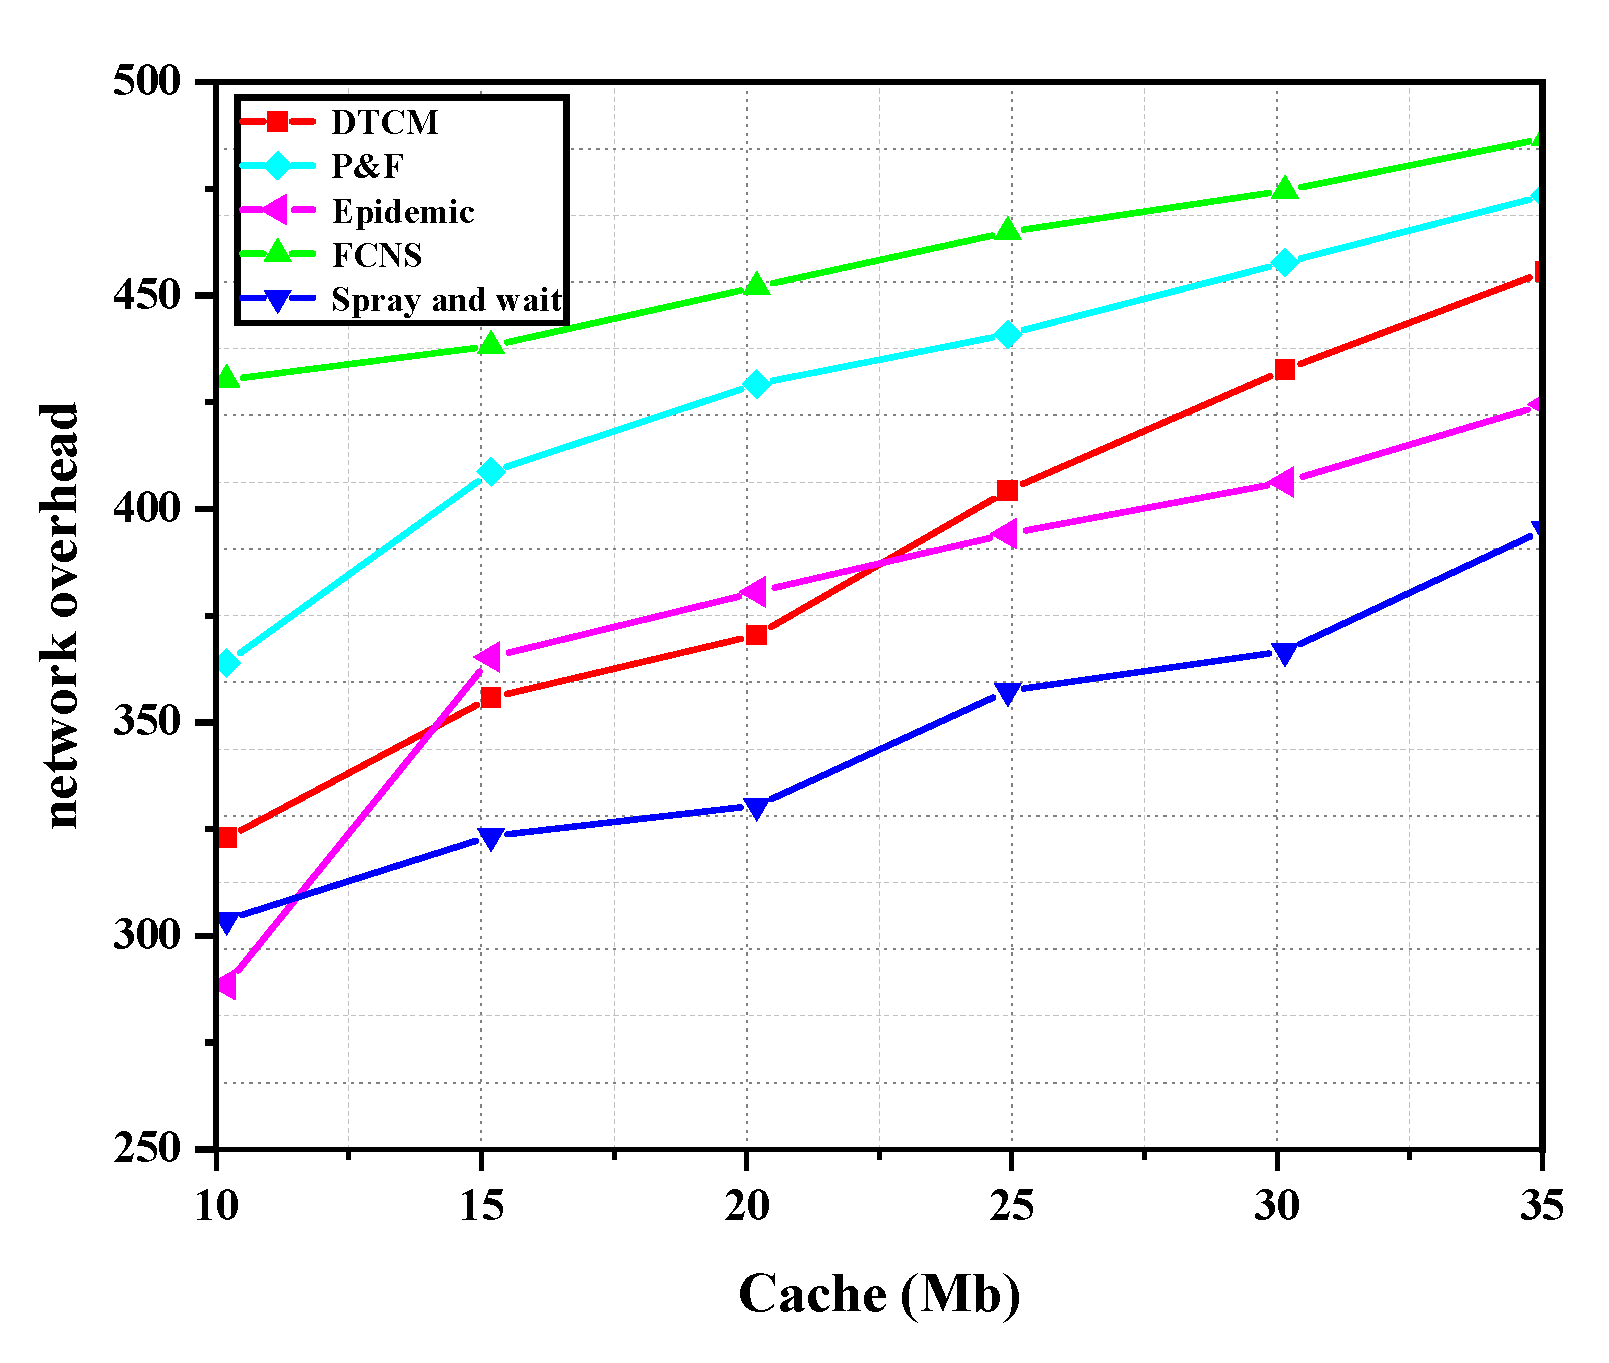
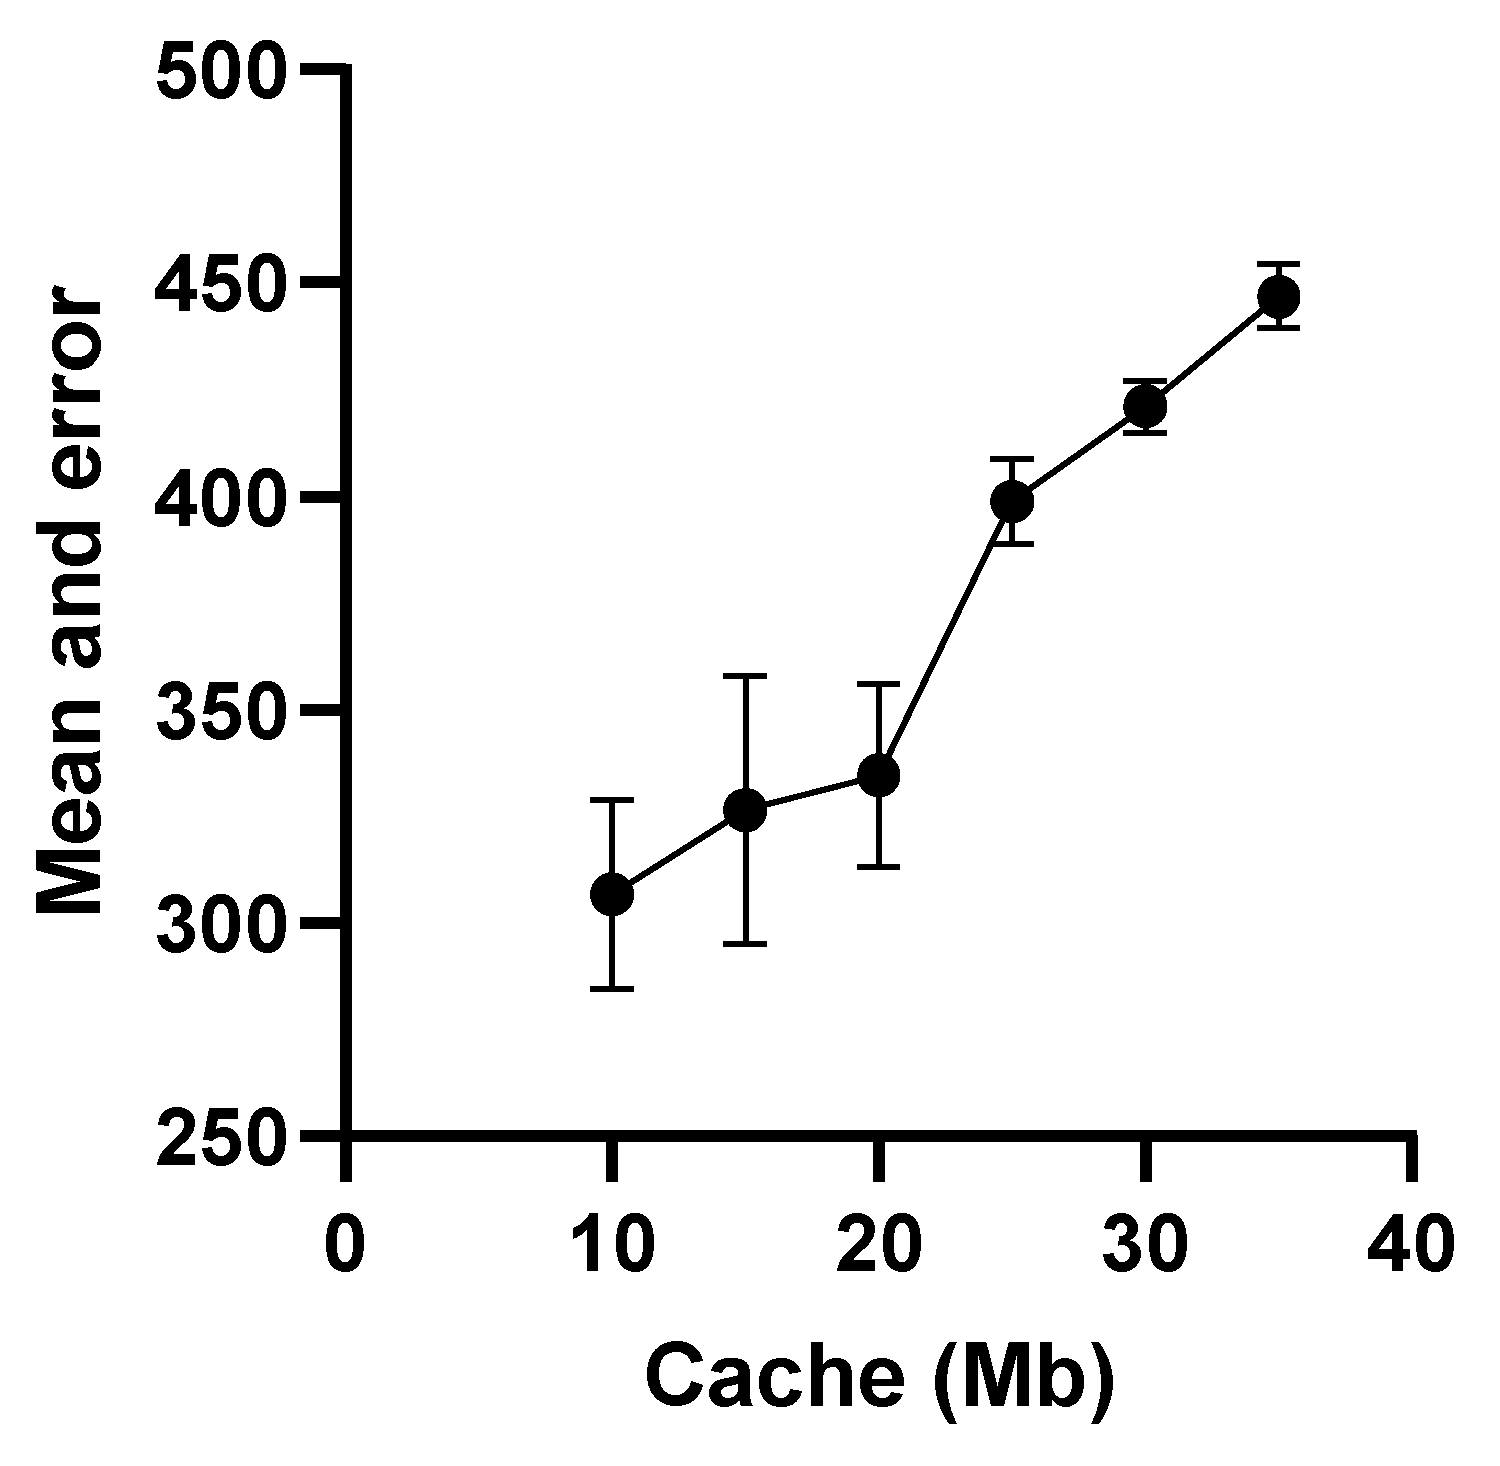
Figure 10 illustrates performance comparison in term of network overhead. The network overheads from FCNS and P&F are higher than those from the other three methods, because they consume more processing and storage resources with a higher complexity. The network overhead from DTCM always keeps medium horizon among those from the five routing methods, with an average value of 400. As the cache space increases from 10 to 35 Mb, each node under DTCM can store, process, and forward more information, and network resources are constantly consuming. To this end, the network overhead from DTCM rises from 325 to 450, and it reaches the maximum as cache space is 35 Mb. As we can see in the Figure 10, the network overhead from FCNS rises slowly. When the cache space is 20 Mb, the node can obtain more information about network state, and network overhead is at the lowest value of 320, because DTCM uses an adaptive method to reduce energy consumption and avoid data congestion. With a simple structure and the flooding model, Spray and Wait and Epidemic need less network resources to transmit messages, so they demonstrate a relatively low horizon of network overhead. Figure 11 shows the distributions of mean and error of network overhead from DTCM. As we can see, the error from the experiments as the parameters of the cache are 10, 15, and 20 Mb higher than those when the parameters of the cache are 25, 30, and 35. In other words, with the situation of a larger setting for cache, the experimental results have a greater reference value.
To sum up, through several experiments and different parameter settings, we comprehensively compare the performance of the five routing algorithms from three indicators. Moreover, we analyze the error, mean, and standard deviation of these experiments. Our experimental results demonstrate that within the error interval of 0.05~0.1, DTCM improves delivery ratio by nearly 20% and decreases end-to-end delay by approximate 25% as compared with the Epidemic algorithm, and the network overhead from DTCM is in the middle horizon.

5. Discussion

It might confound us, as to what would be the performance of DTCM without fuzzy inference system and why the fuzzy inference system plays such an important role in DTCM. From the perspective of theoretical analysis, since the complex relationship between influence factor and data transmission is not a type of mathematical mapping, and cannot be simply formalized as a deterministic or stochastic function. However, fuzzy inference can compute the membership degree of different influencing factors and determine their membership level, thereby judging whether the selection on data routing is reasonable or not. On the other hand, from the application level, without a fuzzy inference system, DTCM makes decisions on data routing through the amount of the remaining energy and cache space, but it is not clear how much impact they have on data transmission and which one presents a greater influence. Dynamic weight adjustment and the optimization of node classification are difficult to achieve. As the number of nodes increases, decisions on data routing from the DTCM will be more and more unreliable, so this type of algorithm lacks extensibility and self-adaptability.
Another issue that needs to be discussed is the energy level of mobile devices in the real world. DTCM is a type of linear optimization algorithm that can be processed in polynomial time, which indicates that it also can be implemented in mobile devices (mobile phone, laptop, etc.) with limited energy. Meanwhile, the mobility model, data storage, and energy consumption set in this experiment all mimic the real application scenario. To this end, DTCM shows a certain degree of extensibility and applicability in real application scenarios.

6. Conclusions

This paper proposes a type of adaptive delay-tolerant routing algorithm using a curve-trapezoid Mamdani fuzzy inference system in opportunistic social networks (DTCM). Different from the latest algorithms, DTCM brings in the mechanism of fuzzy inference to establish the process of data routing and transmission. DTCM investigates the combined impact of remaining energy and cache space on data transmission from the perspective of the fuzzy uncertain method. The objective of the DTCM is to determine the fuzzy mapping from the two-factor to data transmission and to optimize the results of node classification with manual and systematic parameter adjustment. Another vital innovation in this paper is that an improved two-hop feedback mechanism is proposed, in which data can be transmitted from message carriers to their future two hops based on the membership level of fuzzy input. The experimental results demonstrate that within a tolerable error interval of 0.05~0.1, DTCM improves the delivery ratio by nearly 20% and decreases the end-to-end delay by about 25% as compared with Epidemic, and the network overhead from DTCM is in the middle horizon.

Author Contributions

S.C., Z.C., J.W. and K.L. conceived the idea of the paper. S.C. and K.L. designed and performed the experiments; S.C. and K.L. analyzed the data; Z.C. and J.W. contributed reagents/materials/analysis tools; S.C. and K.L. wrote the paper; S.C., Z.C., J.W. and K.L. revised the paper. All authors have read and agreed to the published version of the manuscript.

Funding

This research was funded by the National Natural Science Foundation of China (61672540); Hunan Provincial Natural Science Foundation of China (2018JJ3299, 2018JJ3682). Fundamental Research Funds for the Central University of Central South University (2020zzts597).

Conflicts of Interest

The authors declare no conflict of interest.

Appendix A. The Details of Curve-Trapezoid Mamdani Fuzzy Inference System

The remaining cache and energy evaluate the capacity of a node to store and process information shared from message carriers. However, these two factors are also influenced by other elements, such as the total number of tasks in the node, the way to supply the energy or the caching protocol of the node. To this end, the levels of remaining cache and remaining energy may change over time. If the transmission evaluation value between nodes is computed via the constantly variational index, the message carrier may make an inaccurate data transmission decision. Accordingly, we construct the transmission evaluation value by adopting a strategy of fuzzy inference, which assesses the special relationship between the two factor and data transmission from the perspective of the level of ambiguity, rather than the determined value, and more importantly, greatly reduces the interference of other uncertain factors to the final data transmission decision. A fuzzy inference system can be developed to evaluate the impact of two-factor on data transmission and to compute the transmission evaluation value. The Mamdani fuzzy inference system [13,23] will be regarded as the system model used in the proposed algorithm due to its high extensibility and applicability, and it includes three components: a fuzzy component, a fuzzy inference component, and a De-Blurring component [13,24,25]. Next, we will introduce the construction process of each component proposed in this paper in detail.

Appendix A.1. The Fuzzy Component

As a regular component in the Mamdani fuzzy inference system, the fuzzier determines the specific membership degree of the two-factor fuzzy input (two-factor fuzzy inputs) by determining different membership functions. According to the trichotomy law from the Mamdani fuzzy inference system [24], three different levels of membership degrees for each fuzzy input can be determined by three different levels of membership functions: low membership function, medium membership function, and high membership function. Different levels of membership functions can determine the influence of each fuzzy input on the data transfer decision to different degrees of importance. There are many different reference models that can be adopted in different application scenes in control engineering theory, such as the normal distribution, the F distribution, and the parabolic distribution, and so on. [13,21]. As the remaining energy or cache is below a certain lower limit, the node may be dead or unable to move; and these two values must be below a network adaptable upper limit, so the two-factor fuzzy inputs follow a half trapezoid or trapezoid distribution. To this end, curve trapezoid membership function will be utilized to compute the membership degree of the two-factor fuzzy inputs [23,25] in the proposed improved fuzzy system, namely Curve-trapezoid Mamdani Fuzzy Inference System (CMFI). The traditional trapezoidal distribution membership function is linear, but that proposed in this paper is curvilinear, which is favorable for expressing the smooth relationship between two-factor input and data transmission.
As demonstrated in Figure 1, the remaining cache and energy level are defined as the two-factor fuzzy input of CMFI system, the domain of which can be regarded as U f = { L ( n o d e i , Δ t ) r e , L ( n o d e j , Δ t ) r e } and U f ( 0 , 1 ] . to express fuzzy input concisely, the two-factor fuzzy input values (the remaining cache level and energy level) can be formalized as the following Equation (A1), in which x 1 n o d e i and x 2 n o d e i represent the remaining energy level and the remaining cache level from the n o d e i , respectively.
x j n o d e i = { L ( n o d e i , Δ t ) r e j = 1 L ( n o d e i , Δ t ) c j = 2
Then the domain of factor subset, also namely factor subset, can be transformed as. For a fuzzy subset A ˜ from a given domain U f , a fuzzy mapping from U f to an interval ( 0 , 1 ] can be represented by μ A ˜ : U f ( 0 , 1 ] , where μ A ˜ is a membership function that corresponds to the fuzzy set A ˜ . Therefore, a fuzzy inference mapping from the domain U f to the interval ( 0 , 1 ] can be represented by:
x j n o d e i μ A ˜ ( x j n o d e i ) ( 0 , 1 ] ( j = 1 , 2 )
Obeying the rule of trichotomy law in Mamdani fuzzy inference system, the fuzzy subsets from the given domain U f could be defined as three different levels including low, medium, and high, the combination of which F ( U f ) , namely fuzzy power set or evaluation subset, can denoted as
F ( U f ) = A ˜ ( x j n o d e i ) = { A ˜ l o w , A ˜ m e d i u m , A ˜ h i g h }
where A ˜ l o w , A ˜ m e d i u m , A ˜ h i g h represent low, medium and high levels of membership subsets from two-factor fuzzy input, respectively. In fuzzy set theory, except that the membership degree is 1 and 0, belonging and not belonging have no clear meaning, so the fuzzy power set can be computed by:
F ( U f ) = { A ˜ | μ A ˜ : U f ( 0 , 1 ] }
From the perspective of mathematical theory, F ( U f ) is a mapping from the domain U f to the an interval ( 0 , 1 ] . However, because belonging and not belonging are fuzzy and indeterminate, the fuzzy power set F ( U f ) is the general form of the ordinary power set P ( U f ) , which can be represented as F ( U f ) P ( U f ) . Consequently, the fuzzy relationship between two-factor fuzzy input and the data transmission process can be evaluated by a classical Mamdani fuzzy inference system.
After establishing the fuzzy mapping from factor subset to evaluation subset in the domain ( 0 , 1 ] , CMFI needs to define a valid membership function for each fuzzy input. Referring to the membership function of the traditional trapezoidal distribution and the variation trend of node information in the simulation experiment, we set the low, medium, and high membership functions in the proposed curve trapezoid Mamdani fuzzy inference system [21] for the two-factor fuzzy input from the node n o d e i as the following Equations (A5)–(A7), respectively.
μ A ˜ l o w = { 1 x j n o d e i p 1 ( p 2 x j n o d e i p 2 p 1 ) k p 1 x j n o d e i p 2 0 x j n o d e i > p 2
μ A ˜ h i g h = { 0   x j n o d e i p 1 ( x j n o d e i p 1 p 2 p 1 ) k p 1 x j n o d e i p 2 1   x j n o d e i > p 2
μ A ˜ m e d i u m = { 0 x j n o d e i < p 1 ( x j n o d e i p 1 p 2 p 1 ) k p 1 x j n o d e i < p 2 1 p 2 x j n o d e i < p 3 ( p 4 x j n o d e i p 4 p 3 ) k p 3 x j n o d e i < p 4 0 p 4 x j n o d e i
For the low membership functions, when the energy and cache level are between 0 and p 1 , the node can effectively process data information. On the other hand, when the remaining energy or cache level is higher than the highest level of the network p 2 , the node will be assigned more heavy tasks from the network and consume a lot of network resources. For the medium membership function, when a node’s energy or cache level is higher than the network’s highest level p 3 or lower than the network’s lowest level p 2 , the node’s membership level continues to decline due to heavier network tasks and fewer network resources. For the high membership function, when the energy and cache level is lower than p 1 , the node will die. Moreover, when it is higher than the maximum energy level of the network p 2 , the membership level of this node is 1 all the time. For each of two-factor fuzzy input, three levels of membership degree can be generated from the three levels of membership function. With Zadeh representation notation, the three levels of membership subsets for the two-factor fuzzy input from the node n o d e i can be represented by:
{ A ˜ l o w = μ A ˜ l o w ( x 1 n o d e i ) x 1 n o d e i + μ A ˜ l o w ( x 2 n o d e i ) x 2 n o d e i A ˜ m e d i u m = μ A ˜ m e d i u m ( x 1 n o d e i ) x 1 n o d e i + μ A ˜ m e d i u m ( x 2 n o d e i ) x 2 n o d e i A ˜ h i g h = μ A ˜ h i g h ( x 1 n o d e i ) x 1 n o d e i + μ A ˜ h i g h ( x 2 n o d e i ) x 2 n o d e i
Meanwhile, the coordinate graphs of the three levels of membership functions (low, medium, and high curve trapezoid membership functions) are demonstrated in Figure A1, where (a), (b), and (c) represent the low, medium, and high curve trapezoid membership functions, respectively. As shown in the subfigures (a), (b), and (c) and the above Equations (A5)–(A7), p 1 , p 2 , p 3 , p 4 represent four different syncopation points and k is the exponent of different levels of trapezoid function. Beside, three different levels of membership degrees μ l o w , μ m e d i u m , and μ h i g h corresponding to three different levels of membership functions for each fuzzy input (remaining cache level of remaining energy level) can be determined. Due to the requirement of low computation and cache in mobile devices, the three levels of membership function represent the linear distribution between two-factor fuzzy input and membership degree.
Figure A1. Three different levels of membership functions for the CMFI system.
Electronics 09 01915 g0a1

Appendix A.2. The Fuzzy Inference Component

To be specific, the fuzzy inference component is the mapping from the fuzzy factor subset to fuzzy evaluation subset, where the fuzzy factor subset can be defined as the membership level responding to membership degree and the fuzzy evaluation subset can be regarded as the membership level responding to transmission evaluation value. From the mathematic expression of the control engineering theory, the fuzzy factor subset of the proposed fuzzy inference system can be formalized as:
F I n o d e i ( x j n o d e i ) = { A ˜ l o w x j n o d e i , A ˜ m e d i u m x j n o d e i , A ˜ h i g h x j n o d e i } ( j = 1 , 2 )
In the above Equation (A10), F I n o d e i ( x j n o d e i ) represents the fuzzy factor subset of different levels of membership degree from the n o d e i , and A ˜ l o w x j n o d e i , A ˜ m e d i u m x j n o d e i , A ˜ h i g h x j n o d e i are low, medium, and high fuzzy subsets responding to low, medium, and high membership degree for the two-factor fuzzy input from the n o d e i , respectively. For each fuzzy input, the proposed fuzzy system constructs three levels of fuzzy factor subsets, so for two different fuzzy inputs, there are six different subsets of fuzzy evaluation, and nine different fuzzy rules and nine different subsets of fuzzy evaluation subset will be generated in the system. Therefore, the mapping relationship R from factor subsets to evaluation subsets can be represented as:
F R ( x j n o d e i ) : U f { A ˜ l o w x j n o d e i , A ˜ m e d i u m x j n o d e i , A ˜ h i g h x j n o d e i } ( j = 1 , 2 )
Based on the computation method of the maximum membership principle from Mamdani fuzzy inference system [13], the final determined fuzzy subset of each fuzzy input μ x n o d e i for the two-factor fuzzy input from the node n o d e i can be represented as the union before intersection of its three levels of fuzzy factor subsets, which can be shown as:
μ x n o d e i = j = 1 2 { μ A ˜ l o w ( x j n o d e i ) μ A ˜ m e d i u m ( x j n o d e i ) μ A ˜ h i g h ( x j n o d e i ) }
Table A1 demonstrates nine fuzzy rules from the two-factor fuzzy subsets to the evaluation fuzzy subsets based on ‘If-Then’ fuzzy rules of the curve-trapezoid Mamdani fuzzy inference system. From Table A1, it is evident that the impact of the remaining energy level of nodes on data transmission is deeper than those of the remaining cache level of nodes. This is because nodes will die automatically when their energy is exhausted or below the minimum network energy limit; otherwise, when they are not sufficiently cached, nodes simply cannot store the data information from the message carrier but still alive. As shown in Table 1, different combinations of fuzzy subset inputs correspond to different fuzzy subset outputs, each of which indicates the membership degree of the corresponding fuzzy rule on the data transmission process, representing the fuzzy uncertain relationship between the two-factor fuzzy input and data transmission in opportunistic networks [36,37,38].
Table A1. Nine ‘If-Then’ rules for the proposed CMFI system.
Rule No.If (And)Then (Membership Level)
x 1 n o d e i x 2 n o d e i
1HighHighAbsolutely high (level 1)
2HighMediumVery high (level 2)
3HighLowhigher (level 3)
4MediumHighhigh (level 4)
5MediumMediummedium (level 5)
6MediumLowlow (level 6)
7LowHighlower (level 7)
8LowMediumVery low (level 8)
9LowLowAbsolutely low (level 9)
According to two-condition nine-rule fuzzy inference logic from CMFI, Figure A2 illustrates the classification process of neighbor nodes from source node utilizing trichotomy law, in which active, potential, and under-resourced relay nodes correspond to high (levels 1–3), medium (levels 4–6), and low (levels 7–9) membership levels, respectively. Active relay nodes are users who move frequently and have a high information processing capacity with high energy and cache priority. On the contrary, under-resourced nodes can be considered as dead users due to their low remaining energy and cache space. Potential relay nodes may be regarded as reliable next hop users in the future. Accordingly, the source node will select those active rely nodes as its next hop to route and forward data information through the dynamic fuzzy evaluation of the data processing capability of the relay nodes.
However, this is only a preliminary fuzzy assessment, and the final decision-making requires digital metrics, which can be determined from the De-Blurring component.
Figure A2. Fuzzy inference and node classification based on “If-Then” rules from the CMFI system.
Electronics 09 01915 g0a2

Appendix A.3. The De-Blurring Component

The proposed curve trapezoid Mamdani fuzzy inference system uses the maximum membership principle to compute the corresponding membership degree, which also can be expressed as the method of “first OR then AND” operation [13,22]. However, fuzzy evaluation subsets can only be regarded as the primary classification of nodes in terms of reliability of data transmission, rather than the final decision assessment value. To this end, the De-Blurring component will be constructed to determine a precise classification value for node classification, judging whether the current node n o d e i is a reliable next hop or not. In the classical fuzzy inference system, De-Blurring component could adopt a centroid method, average weighting approach, or maximum membership method. Because the independent variables with small changes in the centroid method will present large differences in the dependent variables, contributing to a relatively high classification accuracy, it could be adopted in the proposed fuzzy system.
To provide the way of manual adjustment of parameters, we define W ( w 1 , w 2 ) as the weight matrix for two-factor fuzzy input U f = { L ( n o d e i , Δ t ) r e , L ( n o d e j , Δ t ) r e } , consisting of two different weight values w 1 and w 2 for L ( n o d e i , Δ t ) r e and L ( n o d e j , Δ t ) r e , therefore the fuzzy relationship matrix M r can be defined as:
M r = [ μ A ˜ l o w ( x 1 n o d e i ) μ A ˜ m e d i u m ( x 1 n o d e i ) μ A ˜ h i g h ( x 1 n o d e i ) μ A ˜ l o w ( x 2 n o d e i ) μ A ˜ m e d i u m ( x 2 n o d e i ) μ A ˜ h i g h ( x 2 n o d e i ) ]
Combined with the weight adjustment matrix W ( w 1 , w 2 ) , the fuzzy transformation from factor set U f = { x j n o d e i } to evaluation set F ( U f ) can be defined as:
F T n o d e i = W ( w 1 , w 2 ) M r = ( w 1 , w 2 ) [ μ A ˜ l o w ( x 1 n o d e i ) μ A ˜ m e d i u m ( x 1 n o d e i ) μ A ˜ h i g h ( x 1 n o d e i ) μ A ˜ l o w ( x 2 n o d e i ) μ A ˜ m e d i u m ( x 2 n o d e i ) μ A ˜ h i g h ( x 2 n o d e i ) ] = ( f c l o w x n o d e i , f c m e d i u m x n o d e i , f c h i g h x n o d e i )
where f c l o w x n o d e i , f c m e d i u m x n o d e i , f c h i g h x n o d e i represent different levels of single fuzzy control result of two-factor fuzzy input for low, medium, and high levels of fuzzy subset, respectively. After normalization, these three levels of single fuzzy control result can be formalized as:
F T n o d e i = ( f c l o w x n o d e i , f c m e d i u m x n o d e i , f c h i g h x n o d e i ) = ( f c l o w f c l o w x n o d e i + f c m e d i u m x n o d e i + f c h i g h x n o d e i , f c m e d i u m x n o d e i f c l o w x n o d e i + f c m e d i u m x n o d e i + f c h i g h x n o d e i , f c h i g h x n o d e i f c l o w x n o d e i + f c m e d i u m x n o d e i + f c h i g h x n o d e i )
According to the maximum membership principle, the final fuzzy control result F C n o d e i is the maximum of three single membership control values after the first “OR” then ”AND” operation, and this process can be expressed as the union of f c l o w x n o d e i , f c m e d i u m x n o d e i , f c h i g h x n o d e i , which is shown as:
F C n o d e i = { f c l o w x n o d e i f c m e d i u m x n o d e i f c h i g h x n o d e i }
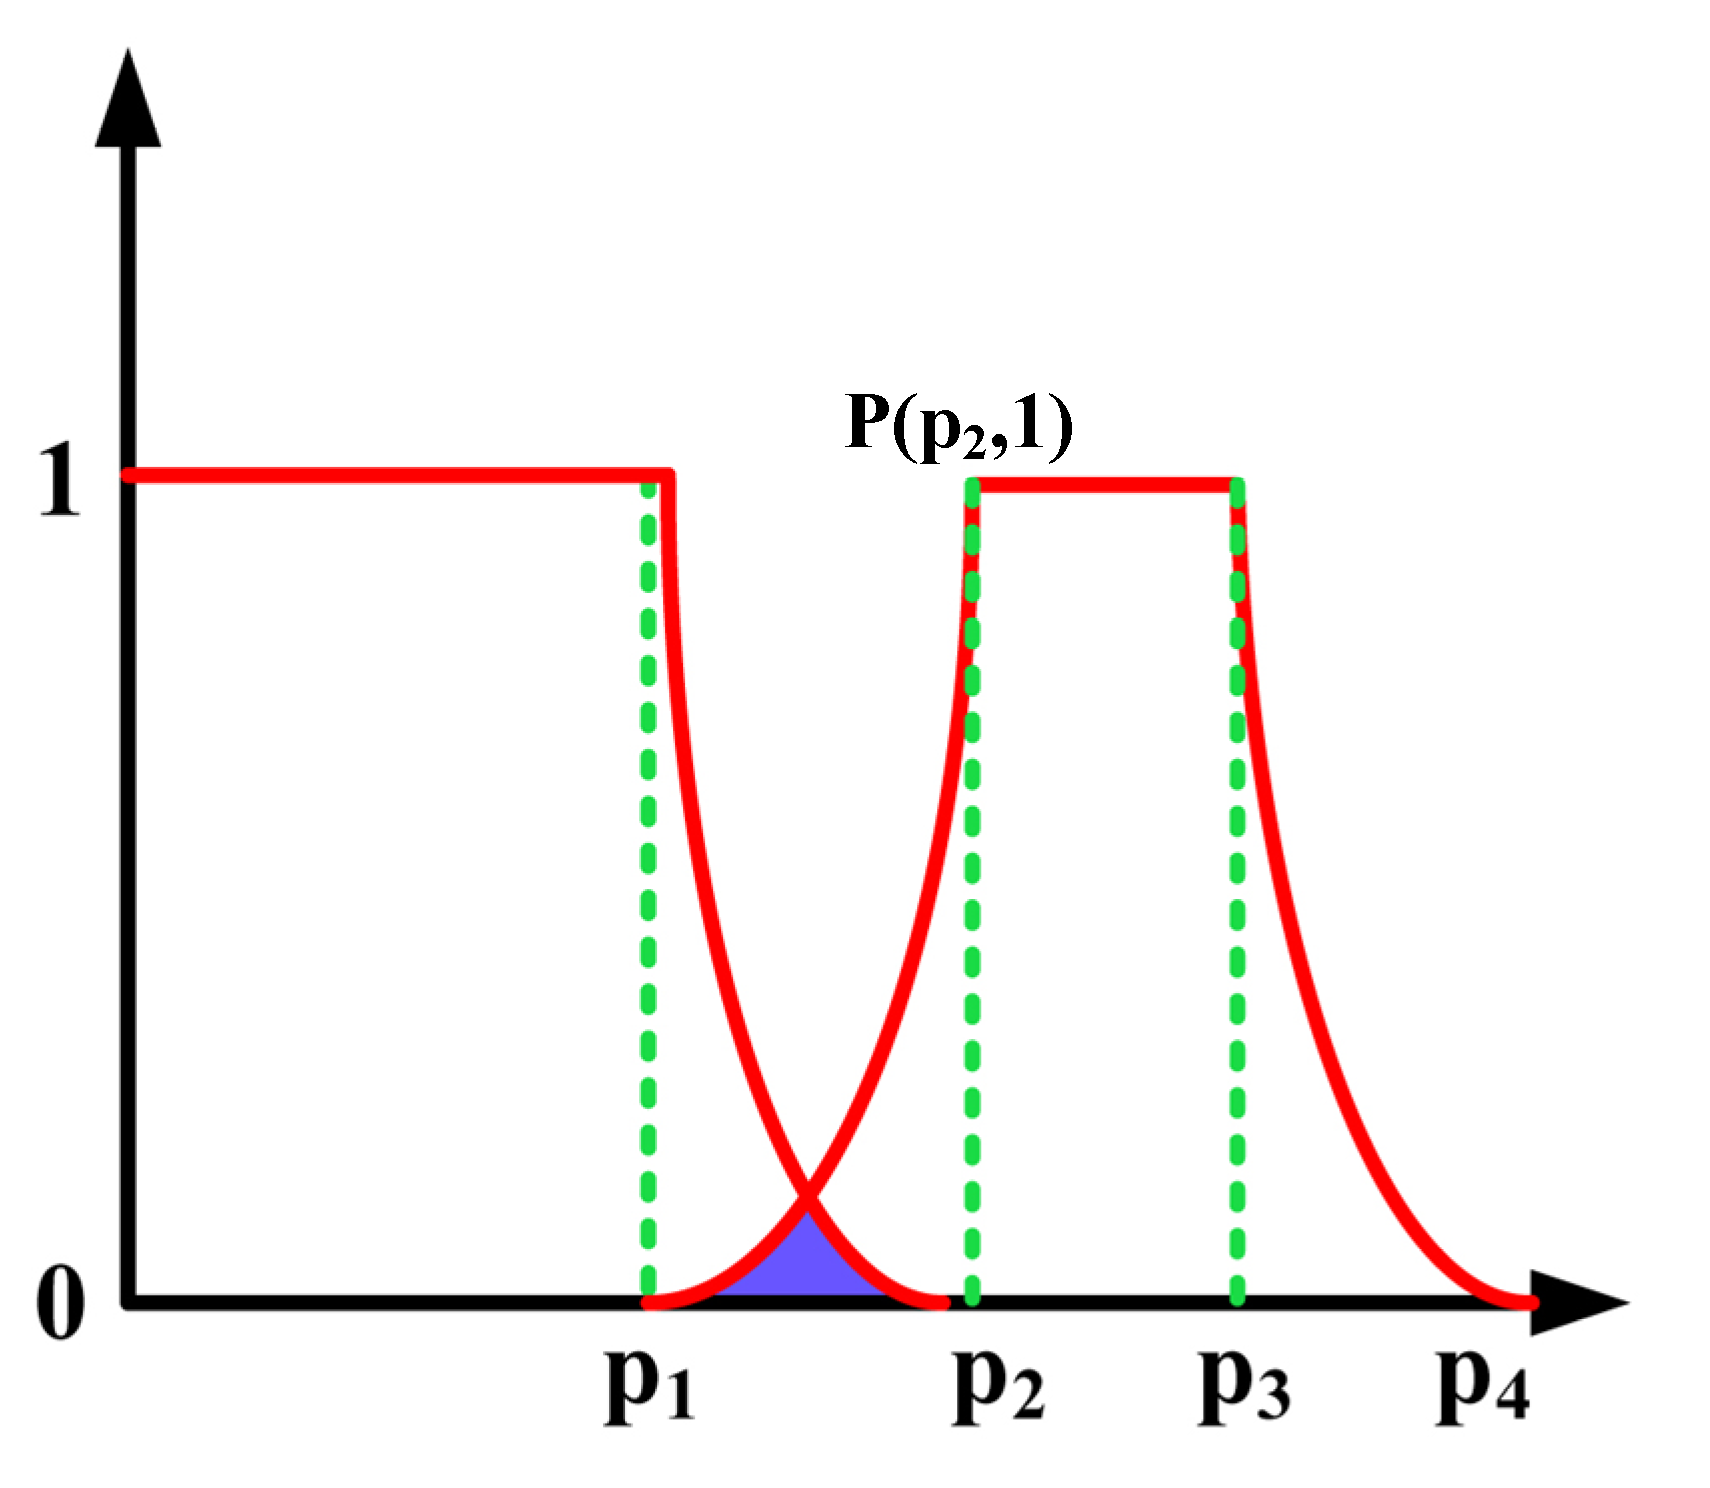
To effectively distinguish the impact of two-factor fuzzy input on data transmission, we adopt the centroid method to evaluation the final fuzzy control result. Following the centroid method, the proposed fuzzy system utilizes the method of first “OR” and then “AND” operation to determine the final fuzzy control result, where the control result value of each single fuzzy inference rule can be calculated by “OR” operation and the minimum control result value of nine fuzzy inference rules will be computed by “AND” operation. To be specific, as shown in Figure A3, if the high membership degree of one fuzzy input is the coordinate point P ( p 2 , 1 ) , then the blue shaded region is the control result for this type of fuzzy rule by “OR” operation. Moreover, for two-factor fuzzy input, this fuzzy system generates six different subsets of fuzzy evaluation, nine different fuzzy rules, and six different blue shaded areas by “OR” operation., On the basis of “AND” operation, the overlap of these six blue shaded areas, which is the blue shaded areas shown in Figure 6, can be regarded as the final control result for the coordinate point P ( p 2 , 1 ) .
Figure A3. The De-Blurring control result for high membership function in the CMFI system.
Electronics 09 01915 g0a3
Obeying the formal expression of mathematics, we adopt the centroid of the overlap of these six blue shaded areas to represent the final fuzzy control result for two-factor fuzzy input L r e ( p 2 , 1 ) and L c ( p 2 , 1 ) , which can be shown as:
F C n o d e i = b = 1 n x b n o d e i × y b n o d e i b = 1 n y b n o d e i
where F C n o d e i represents the final control result for the node n o d e i with six different single blue shaded areas, and then x b n o d e i and y b n o d e i respectively represent abscissa value and ordinate value at the boundary coordinates of the blue shaded area in Figure A4; besides, n is the number of the boundary coordinates of the blue shaded area in Figure A4. Actually, x b n o d e i and y b n o d e i are, respectively, the fuzzy input and the corresponding membership degree from the remaining cache and energy level of the node n o d e i . During the data transmission process in opportunistic social networks, the source node or message carrier make a reliable data routing or forwarding decision by computing and comparing transmission evaluation value (the final control value) of their neighbor nodes.
Figure A4. The final De-Blurring control result for nine fuzzy rules in the CMFI system.
Electronics 09 01915 g0a4

References

  1. Passarella, A.; Conti, M. Analysis of Individual Pair and Aggregate Intercontact Times in Heterogeneous Opportunistic Networks. IEEE Trans. Mob. Comput. 2012, 12, 2483–2495. [Google Scholar] [CrossRef]
  2. Wu, J.; Chen, Z.; Zhao, M. An efficient data packet iteration and transmission algorithm in opportunistic social networks. J. Ambient. Intell. Humaniz. Comput. 2020, 11, 3141–3153. [Google Scholar] [CrossRef]
  3. Liu, K.; Chen, Z.; Wu, J.; Tan, Y.; Wang, L.; Yan, Y.; Zhang, H.; Long, J. Big Medical Data Decision-Making Intelligent System Exploiting Fuzzy Inference Logic for Prostate Cancer in Developing Countries. IEEE Access 2018, 7, 2348–2363. [Google Scholar] [CrossRef]
  4. Peiyan, Y.; Mingyang, S. Lightweight distributed social distance routing algorithm in mobile opportunistic network. J. Comput. Appl. 2018, 1, 5. [Google Scholar]
  5. Martyna, J. Multicast modelling in mobile opportunistic networks. In Proceedings of the 2014 9th International Symposium on Communication Systems, Networks & Digital Sign (CSNDSP), Manchester, UK, 23–25 July 2014; pp. 238–242. [Google Scholar]
  6. Zhang, J.; Huang, H.; Yang, C. Destination-Aware Social Routing for Mobile Opportunistic networks. In Proceedings of the 2018 IEEE 20th International Conference on High Performance Computing and Communications; IEEE 16th International Conference on Smart City; IEEE 4th International Conference on Data Science and Systems (HPCC/SmartCity/DSS), Exeter, UK, 28–30 June 2018. [Google Scholar]
  7. Samanta, A.; Misra, S. Energy-Efficient and Distributed Network Management Cost Minimization in Opportunistic Wireless Body Area Networks. IEEE Trans. Mob. Comput. 2017, 17, 376–389. [Google Scholar] [CrossRef]
  8. Chakchouk, N. A Survey on Opportunistic Routing in Wireless Communication Networks. IEEE Commun. Surv. Tutorials 2015, 17, 2214–2241. [Google Scholar] [CrossRef]
  9. Kaysina, I.A.; Vasiliev, D.S.; Abilov, A.; Meitis, D.S.; Kaysin, A.E. Performance evaluation testbed for emerging relaying and coding algorithms in Flying Ad Hoc Networks. In Proceedings of the 2018 Moscow Workshop on Electronic and Networking Technologies (MWENT), Moscow, Russia, 14–16 March 2018; pp. 1–5. [Google Scholar]
  10. Chen, W. Buffer Aware Routing Algorithm for Opportunistic Network, Software Guide. 2019; 7, 7.
  11. Yu, L. A Wireless Sensor Networks Energy Multipath Routing Algorithm Based on Dynamic Priority. J. Jianghan Univ. 2019, 47, 239. [Google Scholar]
  12. Luo, J.; Wu, J.; Wu, Y. Advanced Data Delivery Strategy Base on Multi-Perceived Community with IoT in Social Complex Networks. Complexity 2020, 2020, 20. [Google Scholar] [CrossRef]
  13. Liu, K.; Chen, Z.; Wu, J.; Wang, L. FCNS: A Fuzzy Routing-Forwarding Algorithm Exploiting Comprehensive Node Similarity in Opportunistic Social Networks. Symmetry 2018, 10, 338. [Google Scholar] [CrossRef] [Green Version]
  14. Xu, M.; Song, W.; Zhao, Y. Collaborative Data Collection with Opportunistic Network Erasure Coding. IEEE Trans. Parallel Distrib. Syst. 2013, 24, 1941–1950. [Google Scholar] [CrossRef]
  15. Yang, W.; Wu, J.; Luo, J. Effective Date Transmission and Control base on social communication in Social Opportunistic Complex Networks. Complexity 2020, 2020, 13. [Google Scholar]
  16. Jadhav, R.S.; Dongre, M.M.; Devurkar, G. Fuzzy logic-based data dissemination in Vehicular Ad Hoc Networks. In Proceedings of the 2017 International conference of Electronics, Communication and Aerospace Technology (ICECA), Coimbatore, India, 20–22 April 2017; pp. 479–483. [Google Scholar]
  17. Wu, J.; Chen, Z.; Zhao, M. Community recombination and duplication node traverse algorithm in opportunistic social networks. Peer-To-Peer Netw. Appl. 2020, 13, 940–947. [Google Scholar] [CrossRef]
  18. Liu, K.; Chen, Z.; Wu, J.; Xiao, Y.; Zhang, H. Predict and Forward: An Efficient Routing-Delivery Scheme Based on Node Profile in Opportunistic Networks. Futur. Internet 2018, 10, 74. [Google Scholar] [CrossRef] [Green Version]
  19. Zhao, P.; Yang, X. Opportunistic routing for bandwidth-sensitive traffic in wireless networks with lossy links. J. Commun. Netw. 2016, 18, 806–817. [Google Scholar]
  20. Yu, G.; Wu, J. Content caching based on mobility prediction and joint user Prefetch in Mobile edge networks. Peer-To-Peer Netw. Appl. 2020, 13, 1839–1852. [Google Scholar] [CrossRef]
  21. Borah, S.J.; Dhurandher, S.K.; Tibarewala, S.; Woungang, I.; Obaidat, M.S. Energy-Efficient Prophet-PRoWait-EDR Protocols for Opportunistic networks. In Proceedings of the GLOBECOM 2017—2017 IEEE Global Communications Conference, Singapore, 4–8 December 2017. [Google Scholar]
  22. Hui, P.; Crowcroft, J.; Yoneki, E. BUBBLE Rap: Social-Based Forwarding in Delay-Tolerant Networks. IEEE Trans. Mobile Comput. 2011, 10, 1576–1589. [Google Scholar] [CrossRef] [Green Version]
  23. Khan, M.K.M.; Rahim, M.S. Performance Analysis of Social-Aware Routing Protocols in Delay Tolerant Networks. In Proceedings of the International Conference on Computer, Communication, Chemical, Material and Electronic Engineering, Rajshahi, Bangladesh, 8–9 February 2018. [Google Scholar]
  24. Mendes, P.; Sofia, R.C.; Tsaoussidis, V.; Soares, J.; Tsaoussidis, V.; Diamantopoulos, S.; Sarros, C.-A. Information-centric Routing for Opportunistic Wireless Networks. In Proceedings of the 5th ACM Conference on Information-Centric Networking, ICN ’18, New York, NY, USA, 21–23 September 2018; p. 9. [Google Scholar] [CrossRef]
  25. Wu, J.; Chen, Z.; Zhao, M. Information cache management and data transmission algorithm in opportunistic social networks. Wirel. Netw. 2018, 25, 2977–2988. [Google Scholar] [CrossRef]
  26. Kerk, Y.W.; Tay, K.M.; Lim, C.P. Monotone Interval Fuzzy Inference Systems. IEEE Trans. Fuzzy Syst. 2019, 27, 2255–2264. [Google Scholar] [CrossRef]
  27. Das, A.K.; Subramanian, K.; Sundaram, S.; Das Ankit, K. An Evolving Interval Type-2 Neuro-Fuzzy Inference System and Its Meta-Cognitive Sequential Learning Algorithm. IEEE Trans. Fuzzy Syst. 2015, 23, 1. [Google Scholar] [CrossRef]
  28. Cervantes, J.; Yu, W.; Salazar, S.; Chairez, I. Takagi–Sugeno Dynamic Neuro-Fuzzy Controller of Uncertain Nonlinear Systems. IEEE Trans. Fuzzy Syst. 2016, 25, 1601–1615. [Google Scholar] [CrossRef]
  29. Alizadeh, S.; Kalhor, A.; Jamalabadi, H.; Araabi, B.N.; Ahmadabadi, M.N. Online Local Input Selection Through Evolving Heterogeneous Fuzzy Inference System. IEEE Trans. Fuzzy Syst. 2016, 24, 1364–1377. [Google Scholar] [CrossRef]
  30. Abiyev, R.H.; Akkaya, N.; Gunsel, I. Control of Omnidirectional Robot Using Z-Number-Based Fuzzy System. IEEE Trans. Syst. Man Cybern. Syst. 2019, 49, 238–252. [Google Scholar] [CrossRef]
  31. Wu, J.; Chen, Z.; Zhao, M. Information transmission probability and cache management method in opportunistic networks. Wirel. Commun. Mobile Comput. 2018, 2018, 1571974. [Google Scholar] [CrossRef] [Green Version]
  32. Singh, A.K.; Bera, T.; Pamula, R. PRCP: Packet replication control-based prophet routing strategy for delay tolerant network. In Proceedings of the 2018 4th International Conference on Recent Advances in Information Technology (RAIT), Dhanbad, India, 15–17 March 2018; pp. 1–5. [Google Scholar]
  33. Abubakar, H.; Tekanyi, A.; Sani, S. Node Cooperation Strategy on Security Aided and Group Encounter Prophet Routing Protocol of an Opportunistic Network. Int. J. Comput. Appl. 2017, 163, 34–38. [Google Scholar]
  34. Xiao, Z.; Han, G.; Xiujun, W.; Feng, Q. Contact Duration Aware Cooperative Data Caching in Mobile Opportunistic networks. J. Comput. Res. Dev. 2018, 55, 338. [Google Scholar]
  35. Bae, Y.H.; Baek, J.W. Achievable Throughput Analysis of Opportunistic Spectrum Access in Cognitive Radio Networks with Energy Harvesting. IEEE Trans. Commun. 2016, 64, 1399–1410. [Google Scholar] [CrossRef]
  36. Sharma, M.; Singh, Y. Middle Position Dynamic Energy Opportunistic Routing for Wireless Sensor Networks. In Proceedings of the 2015 International Conference on Advances in Computing, Communications and Informatics (ICACCI), Kochi, India, 10–13 August 2015; pp. 948–953. [Google Scholar]
  37. Fradj, H.B.; Bouallegue, M.; Anane, R.; Bouallegue, R. Comparative study of opportunistic routing in Wireless Sensor Networks. In Proceedings of the 2017 13th International Wireless Communications and Mobile Computing Conference (IWCMC), Valencia, Spain, 26–30 June 2017; pp. 775–779. [Google Scholar]
  38. Kang, M.W.; Chung, Y.W. An energy-efficient opportunistic routing protocol in delay tolerant networks. In Proceedings of the 2016 International Conference on Information and Communication Technology Convergence (ICTC), Jeju, Korea, 25–27 May 2016; pp. 655–659. [Google Scholar]
  39. Wang, G.; Tao, J.; Zhang, H.; Pan, D. A improved Prophet routing based on congestion level of nodes in DTN. In Proceedings of the 2017 IEEE 2nd Advanced Information Technology, Electronic and Automation Control Conference (IAEAC), Chongqing, China, 25–26 March 2017; pp. 1666–1669. [Google Scholar]
  40. Lai, I.W.; Lee, C.H.; Chen, K.C.; Biglieri, E. Open-Loop End-to-End Transmission for Multi-hop Opportunistic networks with Energy-Harvesting Devices. IEEE Trans. Commun. 2016, 64, 2860–2872. [Google Scholar] [CrossRef]
  41. Kulkarni, L.; Bakal, J.; Shrawankar, U. Energy based incentive scheme for secure opportunistic routing in vehicular delay tolerant networks. Computing 2020, 102, 201–219. [Google Scholar] [CrossRef]
  42. He, W. Energy-Saving Algorithm and Simulation of Wireless Sensor Networks Based on Clustering Routing Protocol. IEEE Access 2019, 7, 172505–172514. [Google Scholar] [CrossRef]
  43. Loreti, P.; Bracciale, L. Optimized Neighbor Discovery for Opportunistic networks of Energy Constrained IoT Devices. IEEE Trans. Mob. Comput. 2019, 19, 1387–1400. [Google Scholar] [CrossRef]
  44. Bracciale, L.; Loreti, P.; Bianchi, G. The Sleepy Bird Catches More Worms: Revisiting Energy Efficient Neighbor Discovery. IEEE Trans. Mob. Comput. 2016, 15, 1812–1825. [Google Scholar] [CrossRef]
  45. Le Sommer, N.; Mahéo, Y.; Baklouti, F. Multi-Strategy Dynamic Service Composition in Opportunistic networks. Information 2020, 11, 180. [Google Scholar] [CrossRef] [Green Version]
  46. Amah, T.E.; Kamat, M.; Bakar, K.A.; Rahman, S.O.A.; Mohammed, M.H.; Abali, A.M.; Moreira, W.; Oliveira, A., Jr. The Impact of Message Replication on the Performance of Opportunistic networks for Sensed Data Collection. Information 2017, 8, 143. [Google Scholar] [CrossRef] [Green Version]
  47. Cui, J.; Cao, S.; Chang, Y.; Wu, L.; Liu, D.; Yang, Y. An Adaptive Spray and Wait Routing Algorithm Based on Quality of Node in Delay Tolerant Network. IEEE Access 2019, 7, 35274–35286. [Google Scholar] [CrossRef]
  48. Lenando, H.; Alrfaay, M. EpSoc: Social-Based Epidemic-Based Routing Protocol in Opportunistic Mobile Social Network. Mob. Inf. Syst. 2018, 2018, 6462826.1–6462826.8. [Google Scholar] [CrossRef] [Green Version]
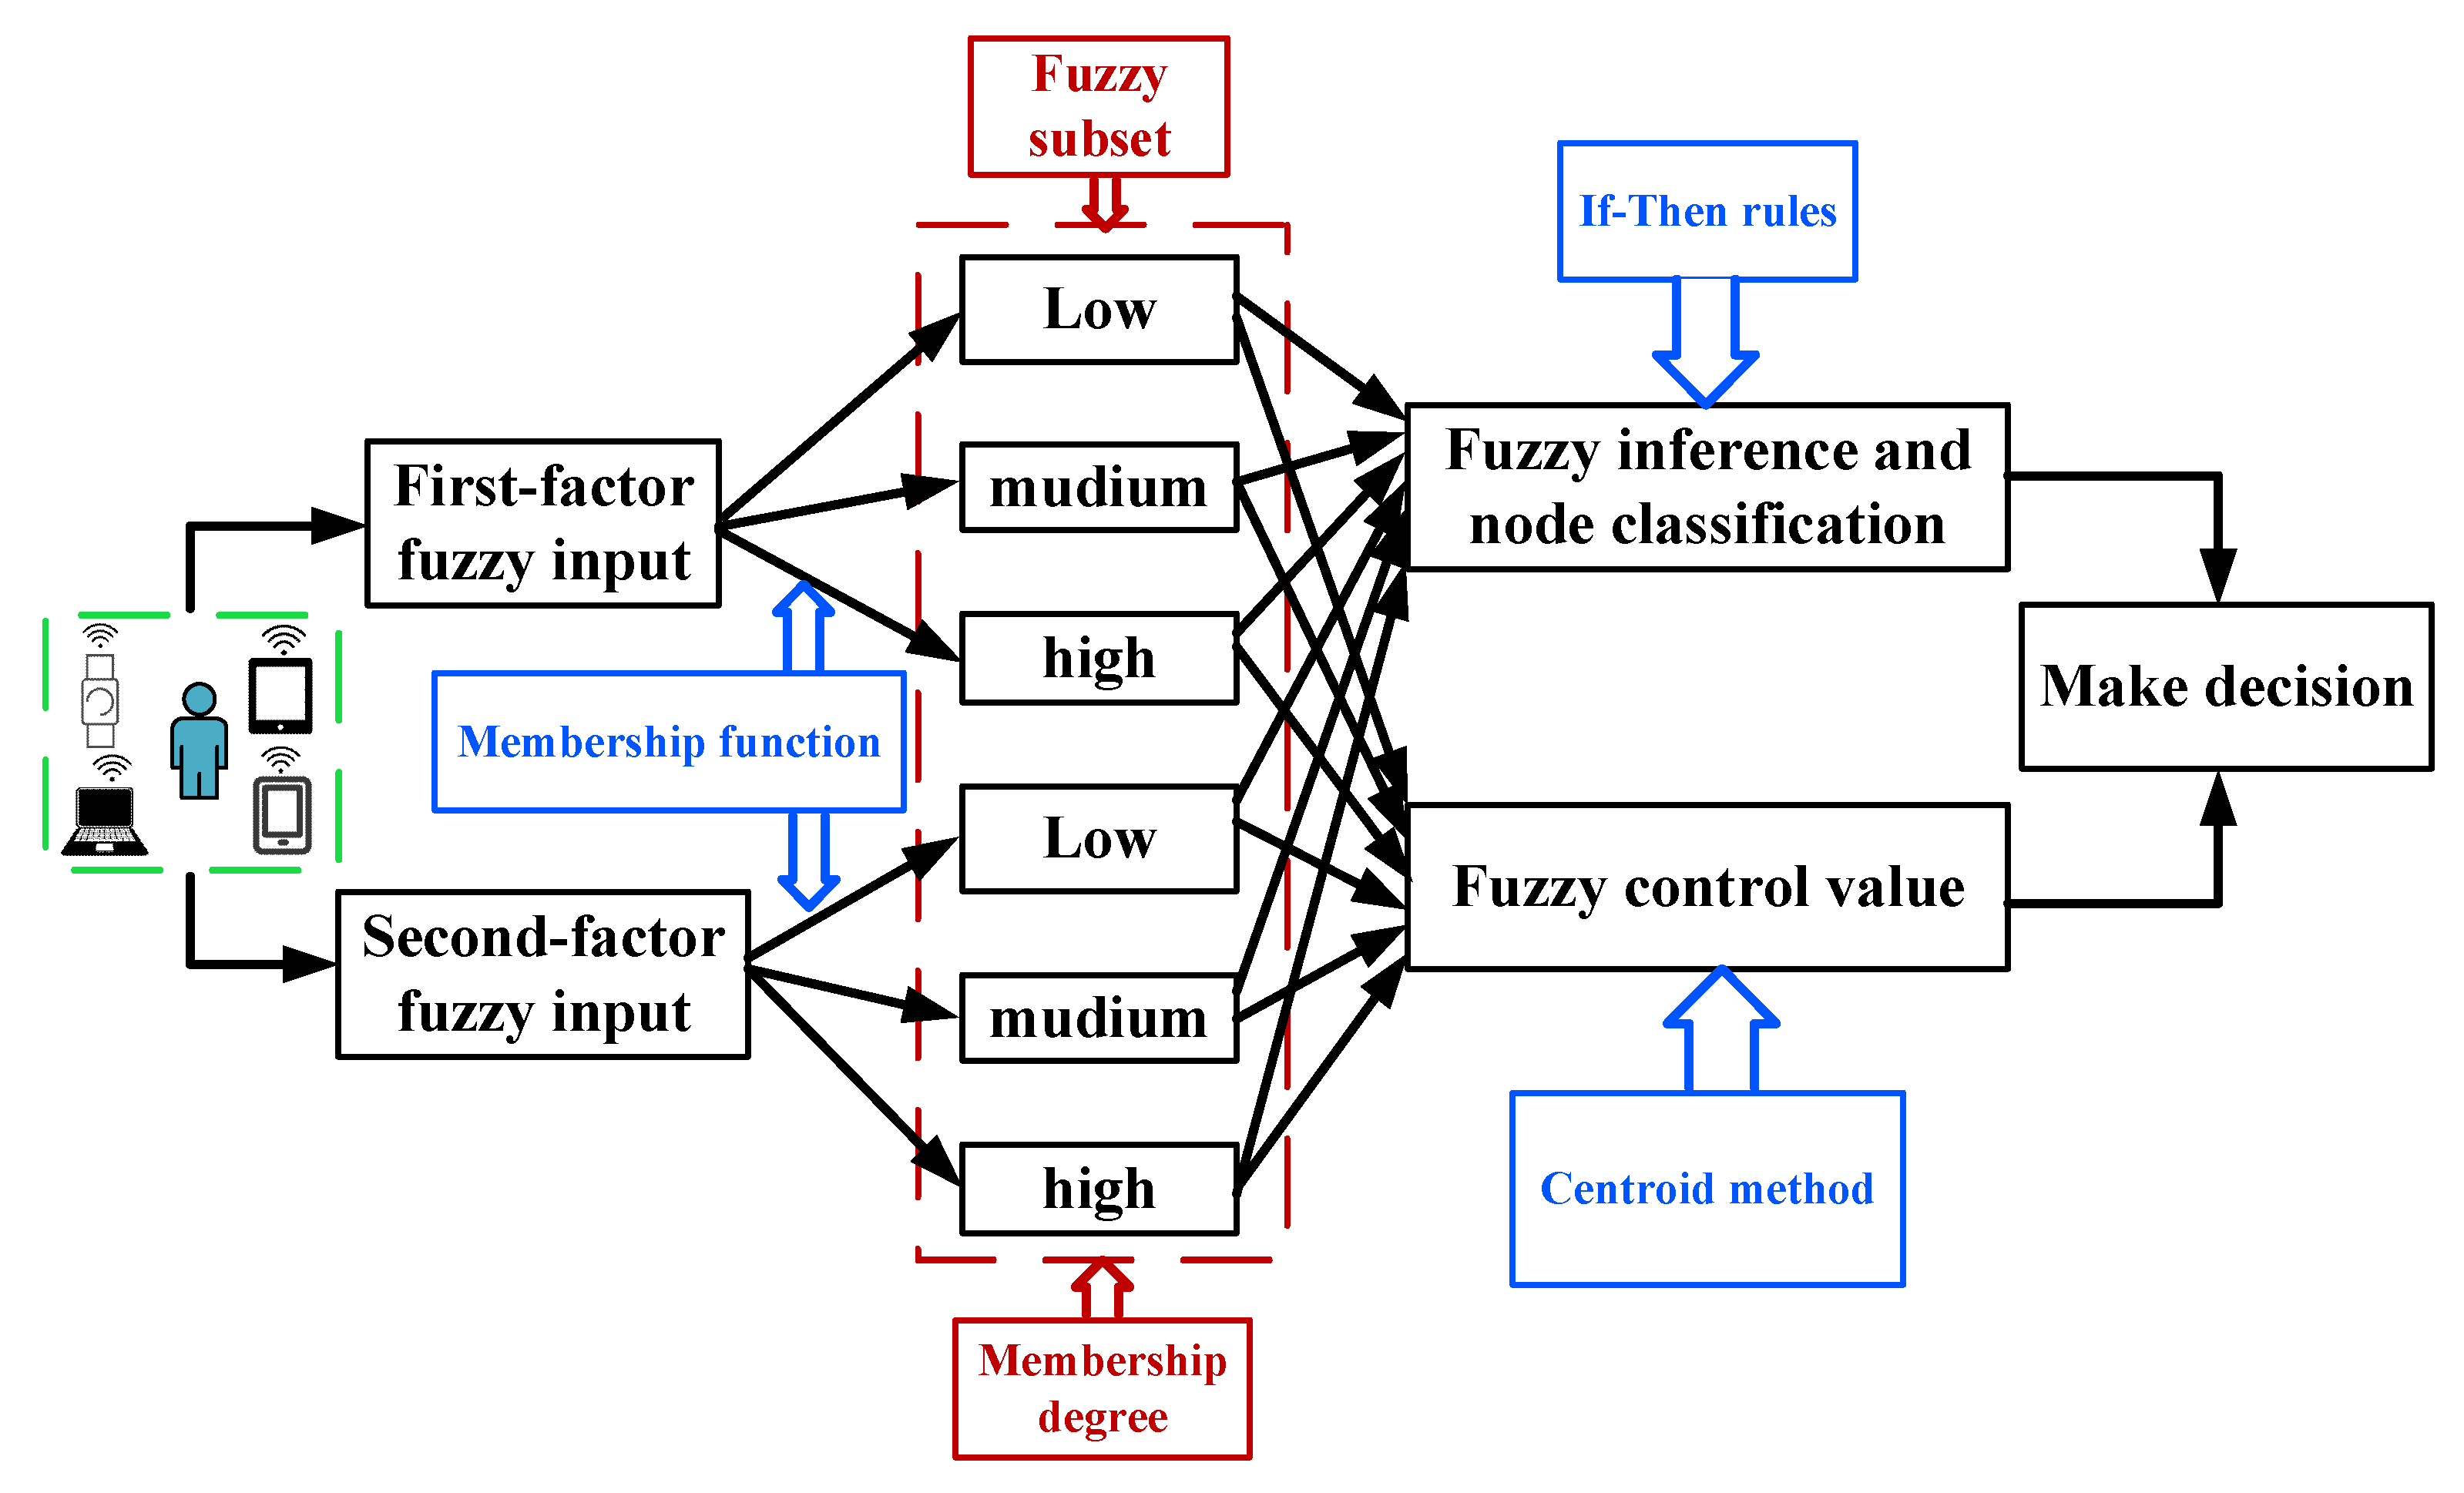
Figure 1. The overall structure of the curve-trapezoid Mamdani fuzzy inference system.
Electronics 09 01915 g001
Figure 2. Energy consumption model for data transmission in opportunistic social networks.
Electronics 09 01915 g002
Figure 3. Data routing and forwarding process in two-hop feedback mechanism.
Electronics 09 01915 g003
Figure 4. Energy consumption comparison between five algorithms with various number of nodes.
Electronics 09 01915 g004
Figure 5. The remaining cache comparison between five algorithms with various number of nodes.
Electronics 09 01915 g005
Figure 6. Delivery ratio comparison from five algorithms with various cache spaces.
Electronics 09 01915 g006
Figure 7. Distribution of error from the experiments on delivery ratio comparison.
Electronics 09 01915 g007
Figure 8. Average end-to-end delay comparison from five algorithms with various cache spaces.
Electronics 09 01915 g008
Figure 9. Distribution of standard deviation from the experiments on delay comparison.
Electronics 09 01915 g009
Figure 10. Network overhead comparison from five algorithms with various cache spaces.
Electronics 09 01915 g010
Figure 11. Mean and error from the experiments on network overhead comparison.
Electronics 09 01915 g011
Table 1. The comparison of wireless opportunistic network routing protocols.
Routing ProtocolImplement of Details
ProphetFrequency of encountering, cache space and contact duration
BubbleRapNode community and centrality, limiting data duplicates
SCORPNode sharing interest, number of encounters and contact duration, storage
DABBEREnergy consumption, storage and other routing metrics
ICMDCache management and node cooperation
Table 2. The details of implementation of the compared five algorithms.
Routing AlgorithmDetails of Implementation
FCNSMamdani fuzzy inference system for node similarity; assessment of node attributes; two-hop transmission.
P&FTwo phases: prediction of meeting probabilities and forwarding of data packets; optimal stopping theory.
Spray and WaitNodes constantly exchange information copies when they meet; limiting the number of data packets.
EpidemicFlooding model: information groups are transmitted to all neighbor nodes in same communication area.
DTCMCurve-trapezoid fuzzy inference system for cache and energy; node classification; two-hop transmission.
Table 3. The common experimental setup for simulation environment.
Environment SettingDescription
SimulatorOpportunistic Network Environment (ONE)
Mobility modelHCMM (Health Capability Maturity Model)
Number of experiments80 (16 groups and 5 time for each group)
Communication area (m2)900
Simulation time (h)1–8
Number of nodes50, 100, 150, 200, 250, 300, 350, 400
Speed of a node (m/s)2–20
Cache of a mobile node (Mb)10 (Initial value), 15, 20, 25, 30, 35
Size of a message (Kb)100
Energy consumption of single delivery (J)10
Total network energy (J)48000
Consumption of a transmission (J)0.1
Number of data packets carried by a node300
Time to live (TTL) (h) 2
Publisher’s Note: MDPI stays neutral with regard to jurisdictional claims in published maps and institutional affiliations.