Article

An Artificial Neural Network Approach and a Data Augmentation Algorithm to Systematize the Diagnosis of Deep-Vein Thrombosis by Using Wells’ Criteria

by
María Berenice Fong-Mata 
1,2,
Enrique Efrén García-Guerrero 
1,
David Abdel Mejía-Medina
2,
Oscar Roberto López-Bonilla 
1,
Luis Jesús Villarreal-Gómez 
2,
Francisco Zamora-Arellano
1,
Didier López-Mancilla 
3 and
Everardo Inzunza-González 
1,*
1
Faculty of Engineering, Architecture and Design, UABC, Ensenada 22860, Mexico
2
Faculty of Engineering and Technology Sciences, UABC, Tijuana 21500, Mexico
3
Centro Universitario de los Lagos, Universidad de Guadalajara, Jalisco 47460, Mexico
*
Author to whom correspondence should be addressed.
Electronics 2020, 9(11), 1810; https://doi.org/10.3390/electronics9111810
Submission received: 30 September 2020 / Revised: 26 October 2020 / Accepted: 28 October 2020 / Published: 2 November 2020
(This article belongs to the Special Issue Recent Advances on Circuits and Systems for Artificial Intelligence)

Abstract

:
The use of a back-propagation artificial neural network (ANN) to systematize the reliability of a Deep Vein Thrombosis (DVT) diagnostic by using Wells’ criteria is introduced herein. In this paper, a new ANN model is proposed to improve the Accuracy when dealing with a highly unbalanced dataset. To create the training dataset, a new data augmentation algorithm based on statistical data known as the prevalence of DVT of real cases reported in literature and from the public hospital is proposed. The above is used to generate one dataset of 10,000 synthetic cases. Each synthetic case has nine risk factors according to Wells’ criteria and also the use of two additional factors, such as gender and age, is proposed. According to interviews with medical specialists, a training scheme was established. In addition, a new algorithm is presented to improve the Accuracy and Sensitivity/Recall. According to the proposed algorithm, two thresholds of decision were found, the first one is 0.484, which is to improve Accuracy. The other one is 0.138 to improve Sensitivity/Recall. The Accuracy achieved is 90.99%, which is greater than that obtained with other related machine learning methods. The proposed ANN model was validated performing the k-fold cross validation technique using a dataset with 10,000 synthetic cases. The test was performed by using 59 real cases obtained from a regional hospital, achieving an Accuracy of 98.30%.

1. Introduction

Venous thromboembolism (VTE), which includes deep-vein thrombosis (DVT) and pulmonary embolism (PE), in countries like the United States of America (USA) may affect up to 900,000 patients per year, with more than 300,000 deaths per year [1]. DVT is a vascular condition in which a venous thrombus breaks off and travels through the bloodstream and, if it reaches the lungs, it might cause a fatal pulmonary embolism (PE) [2,3,4]. VTE occurs for the first time in approximately 100 persons per 100,000 inhabitants per year in USA and rises exponentially from <5 cases per 100,000 persons <15 years old to 500 cases (0.5%) per 100,000 persons at 80 years of age. It is associated with substantial morbidity [4]. The activities of modern life such as trans-oceanic flights [5], the demand for high performance in sports [6,7] and even sleep disorders [8] have increased the likelihood of alterations in the circulatory system; hence, it is said that this condition is a universal problem derived from the development of societies based on their geographical, racial, and socio-cultural characteristics [9]. With the early diagnosis of DVT, it is possible to start treatment that prevents the pulmonary manifestation of the disease. Unfortunately, the nature of its symptoms, which may be confused for another condition such as Baker’s Cyst [10] or infectious cellulite [11], may lead to delaying the actual diagnosis of this condition. On the other hand, the high uncertainty in diagnosis [12] can be reduced with the use of diagnostic technologies [13] that have an inverse relationship between cost-uncertainty. The gold standard for diagnosis of DVT [14] is venography, which in addition to being invasive is highly expensive; hence, the most commonly used method in hospital emergency units is compression ultrasound [15]. However, none of the technologies mentioned is usually present in the primary care units [16], which is the first unit to which a patient comes to when feeling a symptom. In addition to this, the lack of experience of physicians regarding thromboembolic disease has caused legal situations where the main lawsuits cited “failure of physicians in the diagnosis and treatment of these diseases” [17]. Although there are probabilistic methods such as Wells [18] and Oudega [19] to indicate the probability or risk that a patient is suffering a DVT, these are rarely used by physicians [20] and, when this happens, most of the decision in continuing with the DVT detection protocol depends on the physicians’s experience and perception.
On the other hand, in [21], the authors mention that computer-aided diagnosis will play a very important role in health care in the near future. It is noteworthy that the systems supporting decision-making are already being widely used by the medical sector, called Clinical Decision Support Systems (CDSS), for support in the diagnosis of several diseases [22,23], and due to its high level of reliability, CDSS are useful for choice and dosage of medications [24,25,26], as well as for classification [27], prediction, and diagnosis of certain diseases [28]. Furthermore, in medicine and biomedical engineering, the use of artificial intelligence (AI) and machine-learning (M-L) techniques is increasing for prediction, diagnosis, classification, and early detection of diseases [29,30,31,32,33]. Nowadays, methods such as support vector machine (SVM) [34], decision trees [35,36], Random Forest (RF) [32] and convolutional neural networks [37,38] are also being used for the classification, diagnosis, and early detection of diseases, which report excellent results when a balanced dataset is available. Recently, some works have reported the efficacy and reliability of M-L techniques for the prediction and diagnosis of thromboembolic diseases [39,40,41,42,43,44,45,46] and other applications [47,48]. Other research efforts include the implementation of M-L algorithms on embedded systems and FPGAs (Field Programmable Gate Array), which allows developing more efficient and portable systems [49].
Artificial Neural Networks (ANNs) provide a powerful tool to help doctors to analyze, model, and make sense of complex clinical data across a broad range of medical applications. Most applications of ANNs to medicine are classification problems [50]. Health care organizations are leveraging machine-learning techniques, such as ANNs, to improve delivery of care at a reduced cost. Applications of ANNs to diagnosis are well-known; however, ANNs are increasingly used to inform health care management decisions [51]. In addition, methods based on ANNs have become more and more attractive in the medical domain as Deep Learning frameworks mature and become popular. One application in this context refers to the use of ANNs to predict the most probable clinical conditions of a patient, given his/her history of hospital/medical admissions [52]. In the diagnosis of thromboembolic diseases, several authors have shown themselves to be in favor of ANNs, achieving better performance [40,45,53] even when compared with other M-L algorithms [41]. Some advantages of using ANNs for predicting medical outcomes [54] are: (i) ANNs require less formal statistical training to develop, (ii) ANNs can implicitly detect complex nonlinear relationships between independent and dependent variables, (iii) ANNs have the ability to detect all possible interactions between predictor variables, and (iv) ANNs can be developed using multiple different training algorithms. Therefore, in this paper, ANN was chosen due to the aforementioned and to the fact that ANNs perform better in natural problems, such as medical diseases with highly unbalanced data.
Data augmentation is a technique commonly used in M-L to increase the dataset that is used in the learning process. It consists of generating new cases from the original data set without altering the pattern of the data. In medical environments, it is mostly used to increase the image dataset for image based diagnosis; see, for example, [37,55,56,57]. In [58], they argue that the medical and M-L communities are relying on the promise of artificial intelligence (AI) to transform medicine through enabling more accurate decisions and personalized treatment. However, progress is slow. Legal and ethical issues around patient data without consent and privacy is one of the limiting factors in data sharing, resulting in a significant barrier in accessing routinely collected electronic health records (EHR) by the machine learning community. Then, they proposed a novel framework for generating synthetic data that closely approximates the joint distribution of variables in an original EHR dataset, providing a readily accessible, legally and ethically appropriate solution to support more open data sharing, enabling the development of AI solutions. In addition, in [52], the authors demonstrated that it is possible to augment clinical data to improve the performance of automatic predictive systems. They introduced two methods to create synthetic clinical histories (trajectories) based on existing data; the first one extracts subsequences of trajectories to emphasize the transition in between hospital admissions; the second method benefits from the hierarchical structure of standard diagnosis codes (like ICD-9) trajectories whose characteristics resemble those of real-world clinics. In [59], they argue that M-L has made a significant impact in medicine and cancer research; however, its impact in these areas has been undeniably slower and more limited than in other application domains. A major reason for this has been the lack of availability of patient data to the broader M-L research community, in large part due to patient privacy protection concerns. High-quality, realistic, synthetic datasets can be leveraged to accelerate methodological developments in medicine. By and large, medical data are high dimensional and often categorical. These characteristics pose multiple modeling challenges. They evaluated three classes of synthetic data generation approaches; probabilistic models, classification-based imputation models, and generative adversarial neural networks. However, based on our understanding, little research has been done for data augmentation in non-image based diagnosis in hospital work. Therefore, in this paper, a new data augmentation algorithm is proposed by using a mixed patterns approach. Thus, it takes into account two patterns: (i) a dataset of 59 instances from a public hospital and (ii) the distribution of instances between classes reported in [60].
To the best of our knowledge and based on the reviewed literature, some works report the use of machine-learning techniques as a support tool for the diagnosis of thromboembolic diseases [39,40,41,42,43,44,45,46]. However, there are still open problems to be solved, such as the development of new methods and algorithms to systematize the diagnosis of DVT. In this manner, the aim of this paper is the introduction of a new prediction model by using a back-propagation neural network, based on the Wells’ probabilistic method to guide the design of computer systems for support in clinical decision-making for the diagnosis of DVT in primary care. Therefore, the main contribution of this research is that physicians in a hospital’s primary care can use a smart tool to improve the diagnosis in the early detection of DVT in lower limbs, the foregoing, based on an intelligent system trained with 10,000 synthetic cases, validated by using k-fold cross validation and the hold-out model. External validation using 59 real cases from a public hospital of Mexico is performed. The above developed with 11 predictors (risk factors) generated by using a new data augmentation algorithm inspired in [61,62,63,64] according to statistical data of real cases reported in [60] and from a public hospital.
The rest of the work is organized as follows: Section 2 presents the protocol currently followed by hospitals to confirm or rule out the diagnosis of DVT. Section 3 describes the proposed method based on a back-propagation type artificial neural network to obtain the Prediction Model that is the basis of a CDSS. Section 4 presents the results obtained in the evaluation of the proposed prediction model and a discussion of the results. Finally, Section 5 summarizes the conclusions of the paper.

2. Hospital Protocol for DVT Diagnosis

DVT is a condition that, due to the unspecific nature of its symptoms, can be confused with other illnesses. A differential diagnosis is required to confirm the existence of DVT. In many countries, including Mexico, the primary care physicians do not have the equipment or experience to perform imaging tests such as ultrasound or venography, resorting, in the best case, to using probabilistic models. The clinical diagnosis of DVT alone is unreliable; therefore, clinical probability models such as the Wells criteria [18,60,65] and the Oudega Rule [19] have been developed to guide their investigation, diagnosis, and treatment [66]. The most studied and validated model is the one suggested by Wells [67], which classifies patients into three groups according to the probability of having DVT.
To perform a good diagnosis, Wells established a number of risk factors. For this reason, to calculate the probability of suffering from DVT, the factors selected from Table 1 must be taken into consideration, and, if an alternative diagnosis is found at least as likely as DVT, two points must be subtracted from the sum [18,60,65]. Once the sum has been completed and, according to the score obtained, the likelihood of suffering of DVT is classified as low risk (−2 to 0 points), moderate risk (1 to 2 points), and high risk (3 to 8 points) [18,60,65].
Figure 1 shows the protocol to be followed for the diagnosis of DVT [68]. Patients who have a low risk or probability of suffering from DVT have a blood test called D-dimer [45] showing high values due to protein degradation in thromboembolic states. Furthermore, some instruments provide their measurements in FEU (Fibrinogen Equivalent Units) and others in D-DU (D-dimer units) with 500 and 230 threshold values, respectively [69]. When the D-dimer is negative, the diagnosis is ruled out. However, when the D-dimer is greater than the threshold value [70], and when the calculated probability/risk is moderate to high, the recommended initial diagnostic method is a Doppler ultrasound [68,71]. Moreover, compression ultrasonography (CUS) is the first-line imaging test in the diagnostic management of suspected deep vein thrombosis (DVT) of the lower extremity [14].
Although Venography [66,67] is considered the gold standard for the diagnosis of DVT [14], its use in clinical applications is limited, mainly because it is an invasive method that requires an injection with contrast (biomaterial) to observe the displacement of blood flow in the circulatory system, which, in addition to being expensive, is risky for the patient’s health, so its use in clinical applications is limited. In contrast, Doppler ultrasound [72,73] is a safe, non-invasive, easy-to-use imaging test, in addition to having a high sensitivity of 88–98% and specificity from 97–100% [74,75]. Therefore, it is one of the fundamental diagnostic methods in multiple disciplines and medical specialties [76]. Ultrasonic equipment bases its operation on the principle of the Doppler Effect to analyze blood flow, and, with it, the diagnosis of thromboembolic diseases is performed.

3. Proposed Method

In Mexico, it is quite difficult to have access to clinical files or statistical data on the occurrence of certain medical cases, at least not with the detail required to conduct research such as the one reported in [18,45,60,65]. Therefore, this paper proposes using a data augmentation technique [61,62,63,64] based on statistical data of real cases reported in [60] and from a public hospital, the above, with the purpose of making up a new dataset of synthetic cases represented by a matrix with 10,000 cases to be used in the training and validation of the proposed ANN model. Validation/test is performed with the well-known k-fold cross validation method. The external validation/test was performed by using historical data with 59 real cases from a public hospital. The study was conducted in accordance with the Declaration of Helsinki, and the protocol was approved on 23 June 2020 by the Ethics Committee of Autonomous University of Baja California, Mexico with project identification code POSG/020-1-03.

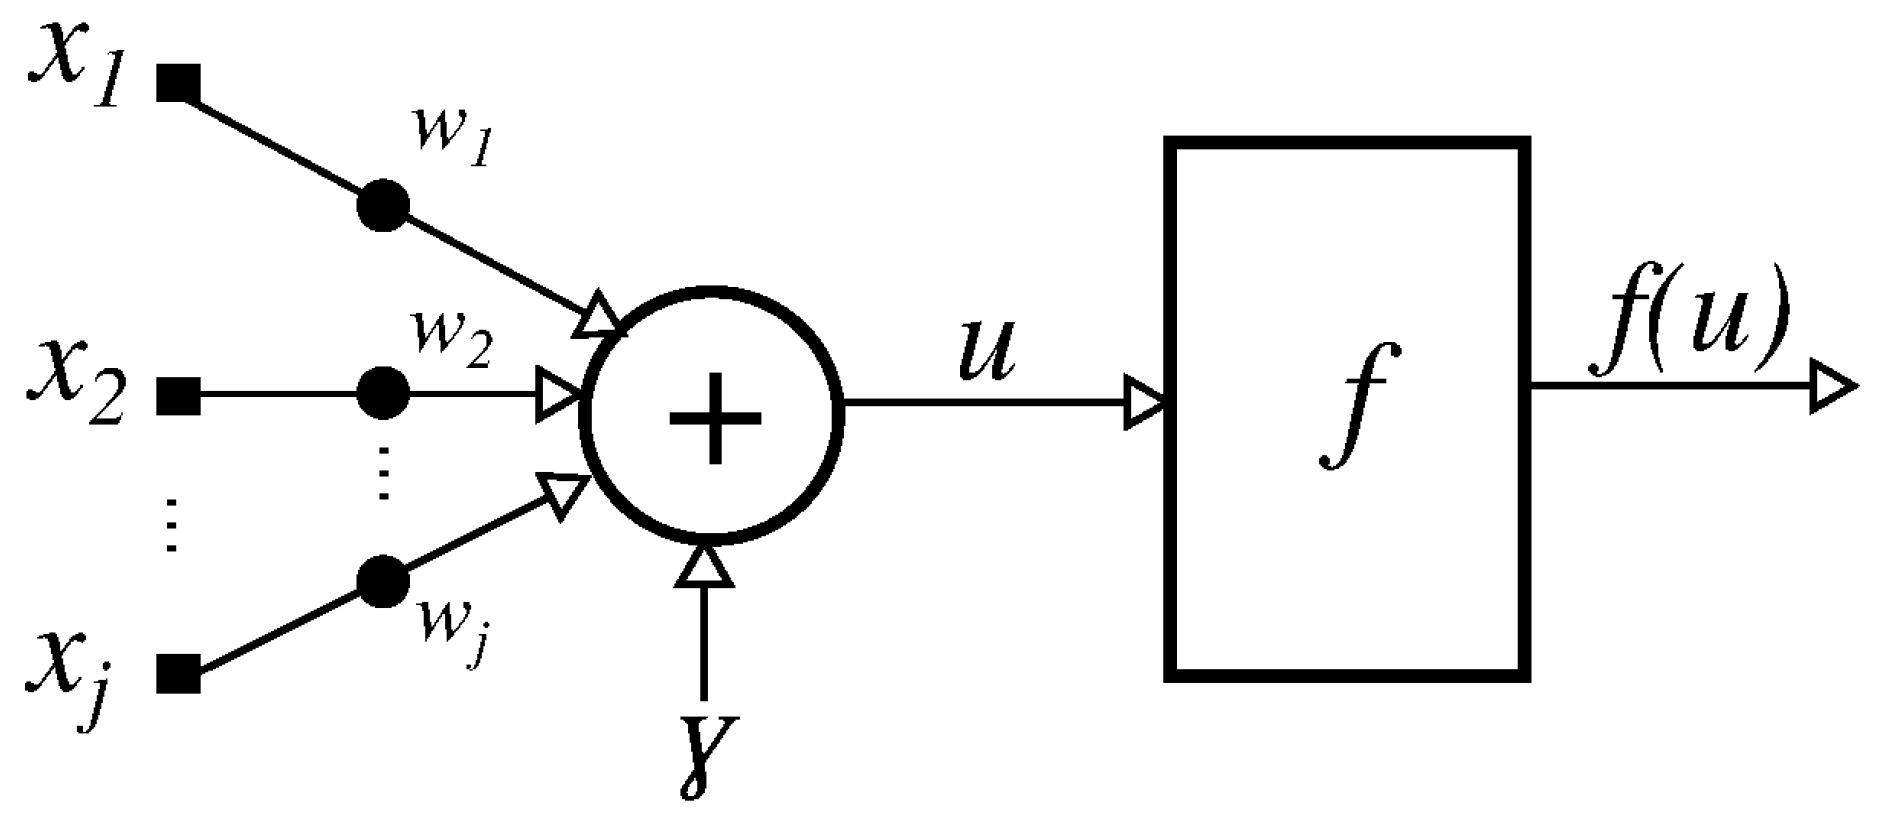
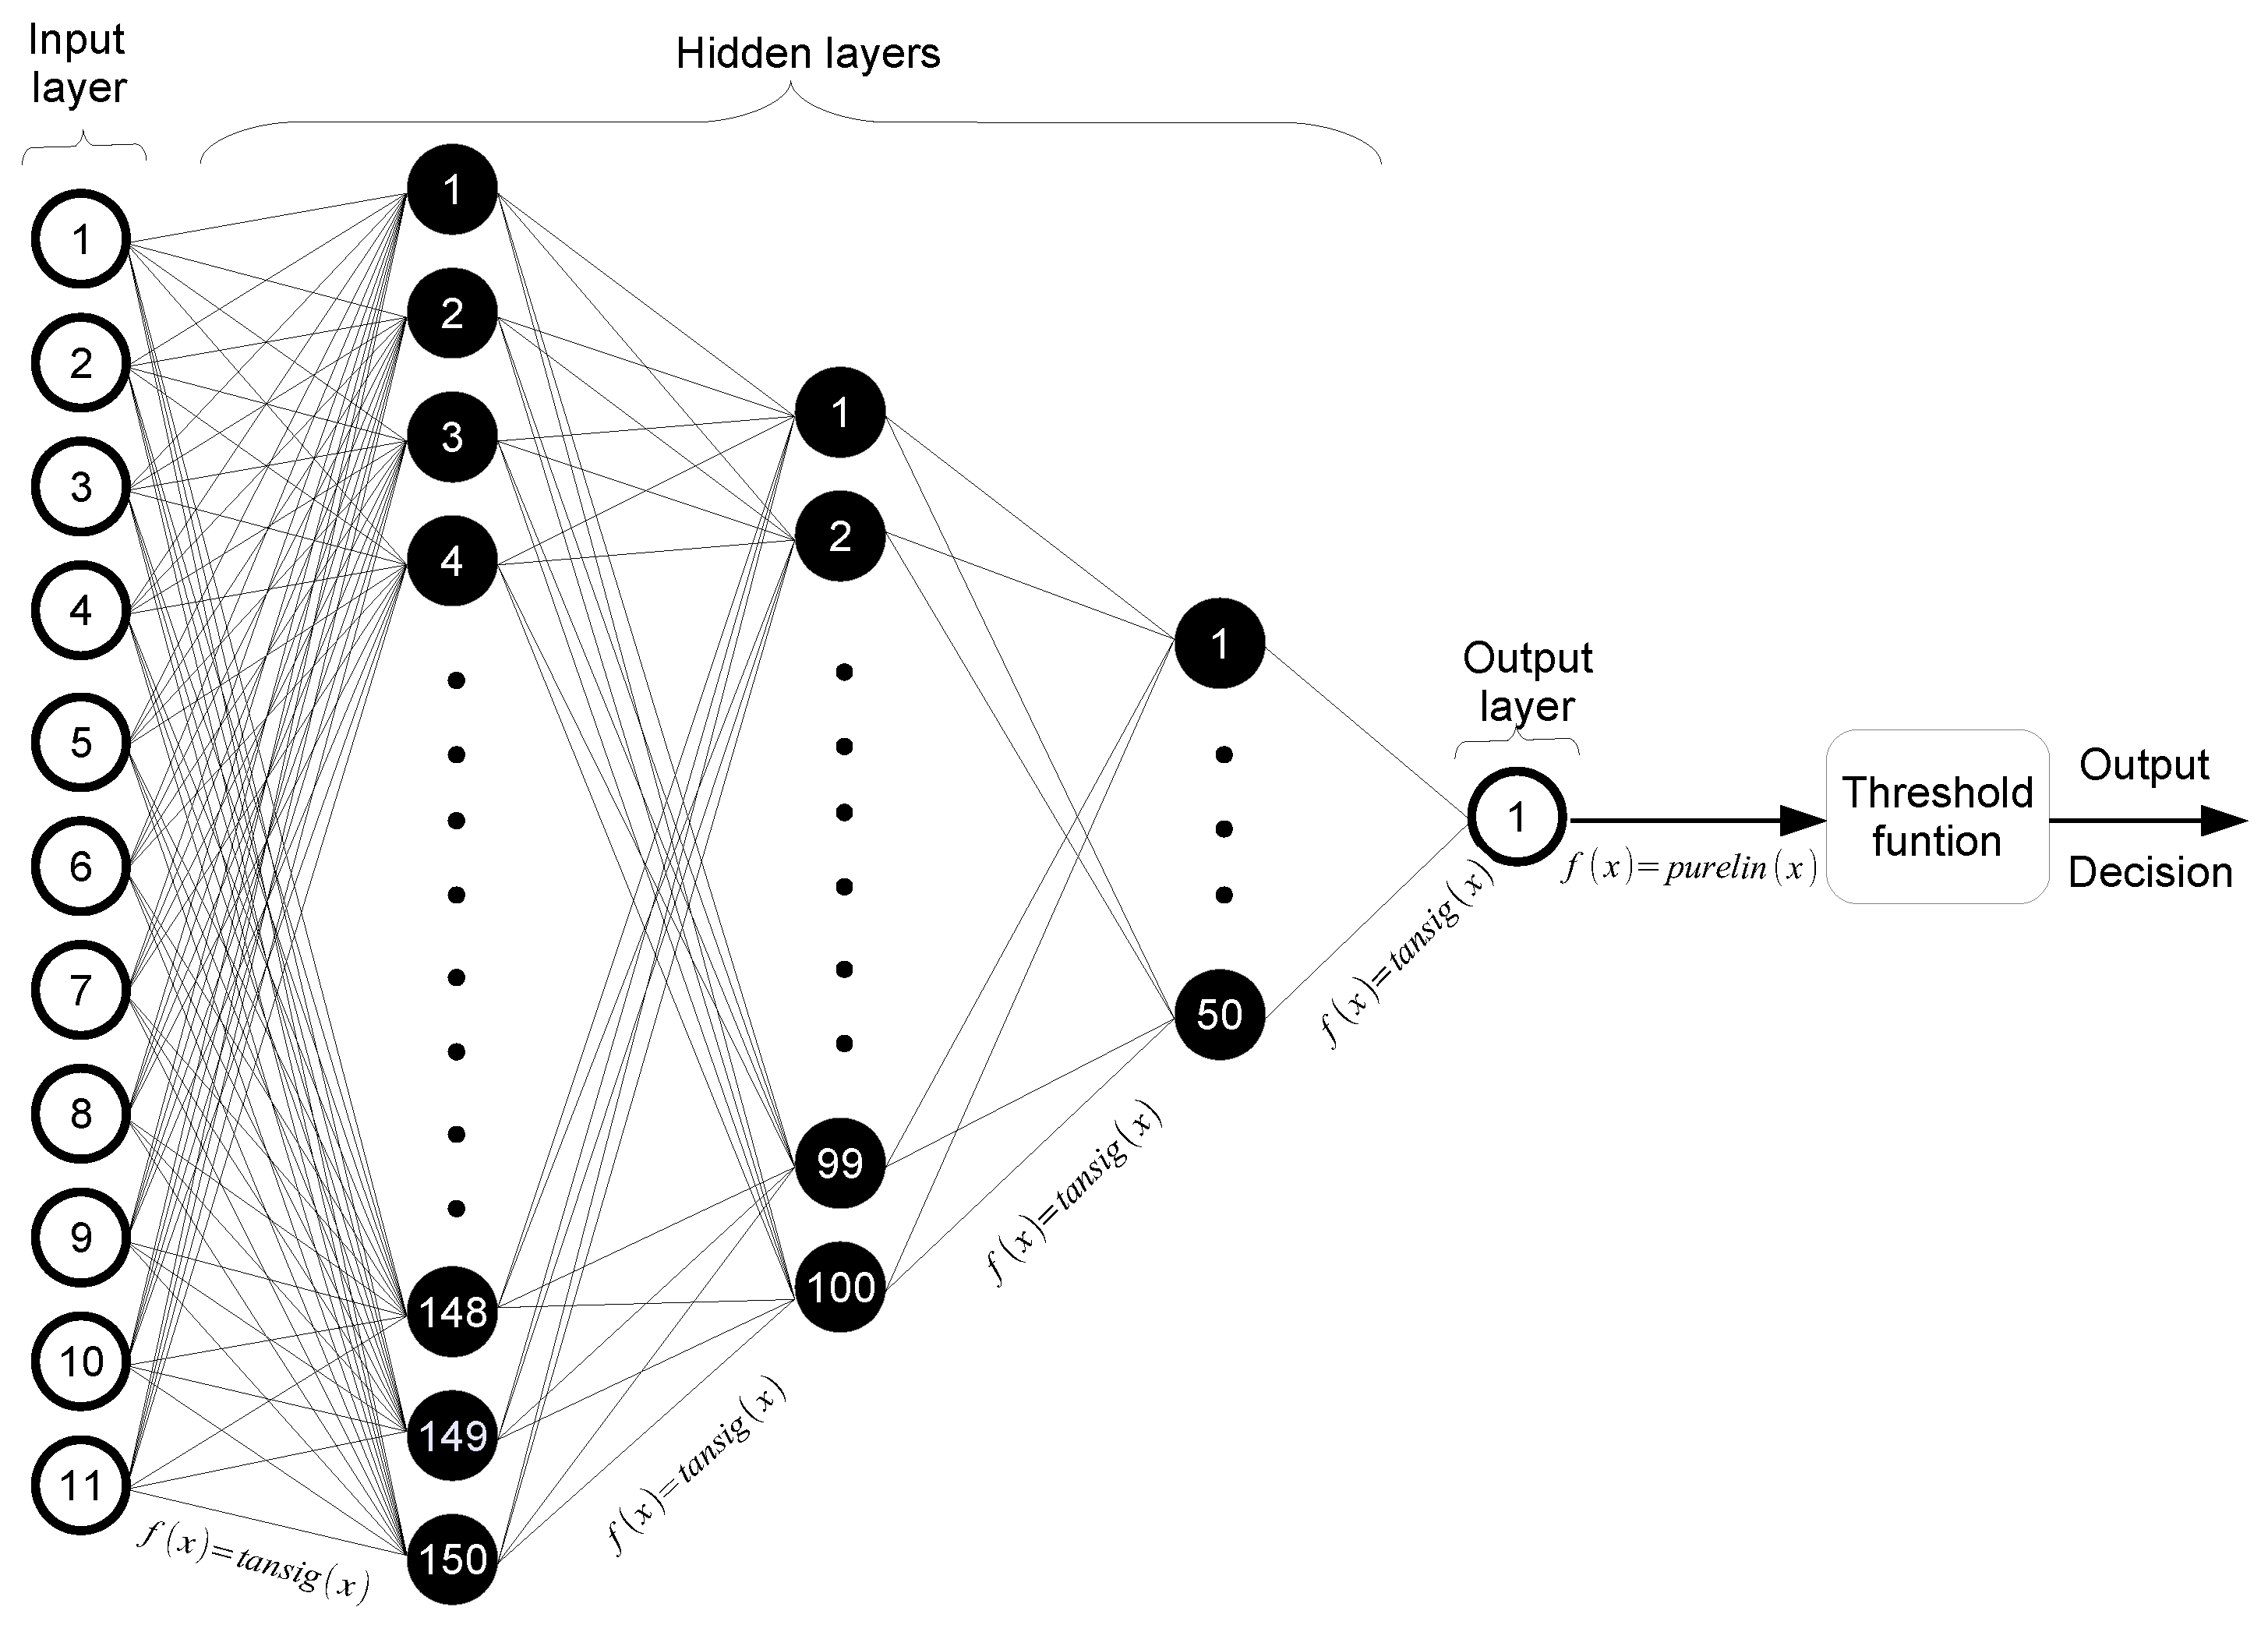
3.1. Artificial Neural Network

Figure 2 depicts the simplest model of the operation of an ANN, which is the perceptron developed by Frank Rosenblatt [77]. ANN is made of artificial neurons connected to one another emulating the functioning of biological neurons in the brain of a human being. A set of input values ( x 1 , x 2 , , x n ) are connected to an artificial neuron, which is switched on by an activation function. Each input value is assigned a weight (w); the products of all the entries and their corresponding weights are added before moving on to the activation function. Unlike the simple perceptron, the multilayer perceptron is made of one or more layers which make it capable of solving nonlinear problems [77,78]. However, there are some algorithms to design the architecture of an ANN, such as the geometric pyramid rule [78,79], the rule based on the mean square error (MSE) [80], and the application of evolutionary algorithms [81]. Actually, a successful ANN configuration depends on the experience of the designer and evaluating different architectures. The number of neurons in the hidden layers used will determine the Accuracy of the ANN model. To select the best ANN model, 100 different ANN architectures were considered and used the rule based on the MSE [80]. Finally, the architecture with the best Accuracy is depicted in Figure 3. ANN are machine-learning algorithms designed to analyze data without a pre-existing hypothesis as to any associations that may exist [45].
For a proper classification/prediction, in addition to the network design, a training algorithm is required. In an ANN, the back-propagation algorithm uses the difference between the produced result and the desired result to change the “weights”of the connections among the artificial neurons. The importance of this process is that, as the network is trained, the neurons of the intermediate layers organize themselves in such a way that the different neurons learn to recognize different characteristics of the total input space. A back-propagation ANN works under the supervised learning scheme, so a set of known data are required to train the network describing the values of the input variables (predictors) as well as the expected output for each set [77]. In the research reported by [45], the authors argue that the use of artificial neural network analysis can improve the risk-stratification of patients presenting with suspected DVT. Furthermore, they conclude that this approach may improve the analysis of complex data to support decision-making in other areas of clinical medicine [45]. In [46], the author argues that predictive analytics by deep machine-learning will be the next generation tool to improve health care; he concludes by encouraging the physicians to have an open mind about artificial intelligence and deep machine-learning, and to embrace the application and use of predictive algorithms that undoubtedly will unfold over the next decade. This is one of the key pathways to cost-effective, efficient, and safe health care. In addition, he argues, we must overcome the fear of the black box concept of artificial intelligence, and physicians need to be confident that large, well-managed datasets can produce tools that will improve patient care.

3.2. Data Augmentation Algorithm

Data Augmentation consists of artificially increasing the volume of the training dataset by applying several distortions to the original information without altering the spatial pattern of target classes [63]. Usually, the distortions are performed during the training time, which allows for doing it on the fly without saving the new information [63]. Data augmentation, which applies deformations and transformations on annotated training samples to generate new training data, is an elegant solution [61,62,63,64]. The main objective of the data augmentation algorithm is to generate a set of synthetic data that adheres to the data observed in real life [61,62,63,64]. Algorithm 1 describes the proposed data augmentation approach, which is proposed to generate each case that will comprise the set of synthetic data for training and validation of the proposed back-propagation ANN model. Therefore, the first task to be performed is to calculate the percentage of positive and negative cases that are present for each type of risk probability of the occurrence of DVT in addition to the percentage for which each of the factors of the Wells Score was observed [18,45,60,65] in the real cases we had access. To calculate the percentage of suspected cases of DVT in each type of risk proposed by Wells [65], historical data from [60] was taken, where it is mentioned that, of all the cases observed, 19% were diagnosed as DVT, while the remaining 81% had a different diagnosis. Furthermore, in [60], it is mentioned that, in the cases detected as Low Risk, only 5% of the cases were diagnosed as positive for DVT, while 17% were diagnosed in Medium Risk, and 53% as High Risk.
Based on the above, this paper proposes a model of linear equations described by (1) to determine the percentage of cases that were presented in each type of risk.
L o w M e d i u m H i g h R i s k R i s k R i s k x + y + z + = 100 , 0.05 x + 0.17 y + 0.53 z + = 19 , 0.95 x + 0.83 y + 0.47 z + = 81 ,
where x is Low Risk cases, y is Medium Risk cases, and z is High Risk cases. Solving (1), it is obtained that x = 60.9 % was classified as Low Risk cases, y = 13.2 % as Medium Risk, and  z = 25.9 % as High Risk. Subsequently, with this information, the distribution of suspected cases of DVT diagnosed as positive and negative is calculated in each type of risk that was used in a new dataset of 10,000 training and validation cases, which are shown in Table 2. This generates an imbalanced data distribution which could lead to misclassification. However, according to [82], the skill of master diagnosticians was not due to a distinctive reasoning process, but instead depended on a clinician’s ability to access knowledge from past experience to generate short lists of possible diagnoses. For this reason, it is preferable to train the predictive model from a dataset where the distribution of suspected and positive cases for DVT are consistent with the way the DVT phenomenon occurs in order to take into account the impact that each one of the symptoms have in the DVT diagnosis, just as physicians do.
Algorithm 1 Data Augmentation
 1:
DataSetGenerator(initial_row, final_row, risk_type)
 2:
# The dataset is stored in a integer matrix with 10,000 rows and 12 columns dimension.
 3:
# The random function random(base, range) generates random numbers from 0 to range-1.
 4:
# It returns the sum of the base plus the generated random number.
 5:
for i=initial_row:final_row
 6:
     switch(risk_type)
 7:
        case 1: symptoms_observed=1           # Low risk has 1 observable symptom
 8:
          diagnosis=1                       # risk_type == 1 is a Low Risk with positive diagnosis
 9:
        case 2: symptoms_observed=1           # Low risk has 1 observable symptom
10:
          diagnosis=0                       # risk_type == 2 is a Low Risk with negative diagnosis
11:
        case 3: symptoms_observed=random(2,2) # Medium risk has 2 o 3 observable symptom
12:
          diagnosis=1                       # risk_type == 3 is a Medium Risk with positive diagnosis
13:
        case 4: symptoms_observed=random(2,2)   # Medium risk has 2 o 3 observable symptom
14:
          diagnosis=0                       # risk_type == 4 is a Medium Risk with negative diagnosis
15:
        case 5: symptoms_observed=random(4,3)   # High risk has 4 to 6 observable symptom (for this study; in real life could be until 9)
16:
          diagnosis=1                       # risk_type == 5 is a High Risk with positive diagnosis
17:
        case 6: symptoms_observed=random(4,3)   # High risk has 4 to 6 observable symptom
18:
          diagnosis=0                       # risk_type == 6 is a High Risk with negative diagnosis
19:
     end switch
20:
   for j=1:symptoms_observed
21:
     symptom=random(2,9)                    #random asignation for the observed symptom
22:
     dataset[i,0]=random(1,8)                   #random asignation for the patient’s age range
23:
     dataset[i,1]=random(0,2)                   #random asignation for the patient’s gender
24:
        while(dataset[i,symptom]==1)           #if the observed symptons is choosed, the next available is asigned 
25:
           symptom++
26:
           if(symptom==11)
27:
            symptom=1
28:
           end if
29:
        end while
30:
     dataset[i,symptom]=1                      #the symptom is asigned as positive (0 is negative)
31:
   end for
32:
end for
Then, the calculation of the distribution of Wells’ factors in the proposed dataset is based on the analysis of the real cases observed. For this purpose, each factor in each case is observed in the statistical data of real cases recorded in a Mexican hospital, and then, each one is divided over 280, being the total risk factors of the Wells’ score identified in the study as described in Equation (2):
% f a c t o r i = ocurrences of factor i ocurrences of all factors .
Therefore, the matrix containing the training dataset is generated row by row, where each row represents a patient, i.e., gender, age, and nine risk factor’s of Well’s score. Initially, the number of synthetic cases of patients to be generated is determined, and the type of risk and the corresponding diagnosis to each of them is calculated. Likewise, the number of occurrences of each of the risk factors of the Wells score is calculated [60,65] to know how many patients that risk factor will be assigned. In each one of the rows, the amount of Wells risk factors is determined randomly that will be marked as present in each patient. In the event of low risk cases, only one factor is specified in all rows; in cases of medium risk, the rows may contain two or three observed factors, while, in high risk, the observed factors vary in a range of 4 or more. Once the number of risk factors are determined, a random number is generated for each of them, used to indicate the observed risk factor in that patient; if the random number represents a risk factor that has already been marked as observed in the patient, then a new random number is generated until one is found that represents a factor not previously observed in the patient; the corresponding column with the value 1 is activated, and the number of cases to which this factor will be assigned is reduced by one. Finally, the value corresponding to the diagnosis of each patient’s case is assigned, which is 0 for negative cases and 1 for positive cases.

3.3. Pre-Processing Scheme of the Dataset

From each medical record of a regional hospital, the data that coincided with the first nine of the criteria established by Wells for the detection of DVT was extracted; in addition, this paper proposes to use gender and age, which helps to improve the risk-stratification of patients presenting suspected DVT [45]. From the obtained data, a matrix was designed composed of clinical cases in which the diagnosis of suffering a DVT can be positive or negative. The rows of the matrix represent the clinical cases or patients, while the columns represent the inputs to the expert system, that is, the first nine criteria taken from the Wells model, in addition to the patient’s gender and age. Each of the inputs to the system was associated with a real numerical value to form the numerical matrix that would serve as training for the system. Therefore, to identify the patient’s gender, zero values were assigned to the male gender and one to the female gender. Then, the clinical cases were grouped using patient age ranges as shown in Table 3. Each interval was coded by a numerical value between 1 and 9.
Table 4 shows that, for each Wells’ criteria agreed by the patient or the physician, the value of one is assigned, while, for the absence of the same, the value of zero is assigned.
Table 5 shows the proposed prediction model for DVT Diagnosis. It consists of an input layer with 11 predictors (age, gender, cancer, immobilization, surgery, tenderness, leg swollen, calf swollen, edema, superficial veins, previous DVT, three hidden layers (150-100-50) and an output layer, which is the DVT diagnosis.
Figure 3 depicts the proposed ANN model, the 11 predictors mentioned in Table 5 are taken as input for the proposed ANN model, a set hidden layers and an output layer, which is the diagnosis of DVT in a patient. The proposed ANN model consists of an input layer with 11 neurons, three hidden layers with 150, 100, and 50 neurons, respectively, and an output layer with a neuron indicating the diagnosis result of DVT. The activation function used in the input layer and in the hidden layers corresponds to the hyperbolic tangent (tansig), while a linear (purelin) function was used in the output layer.

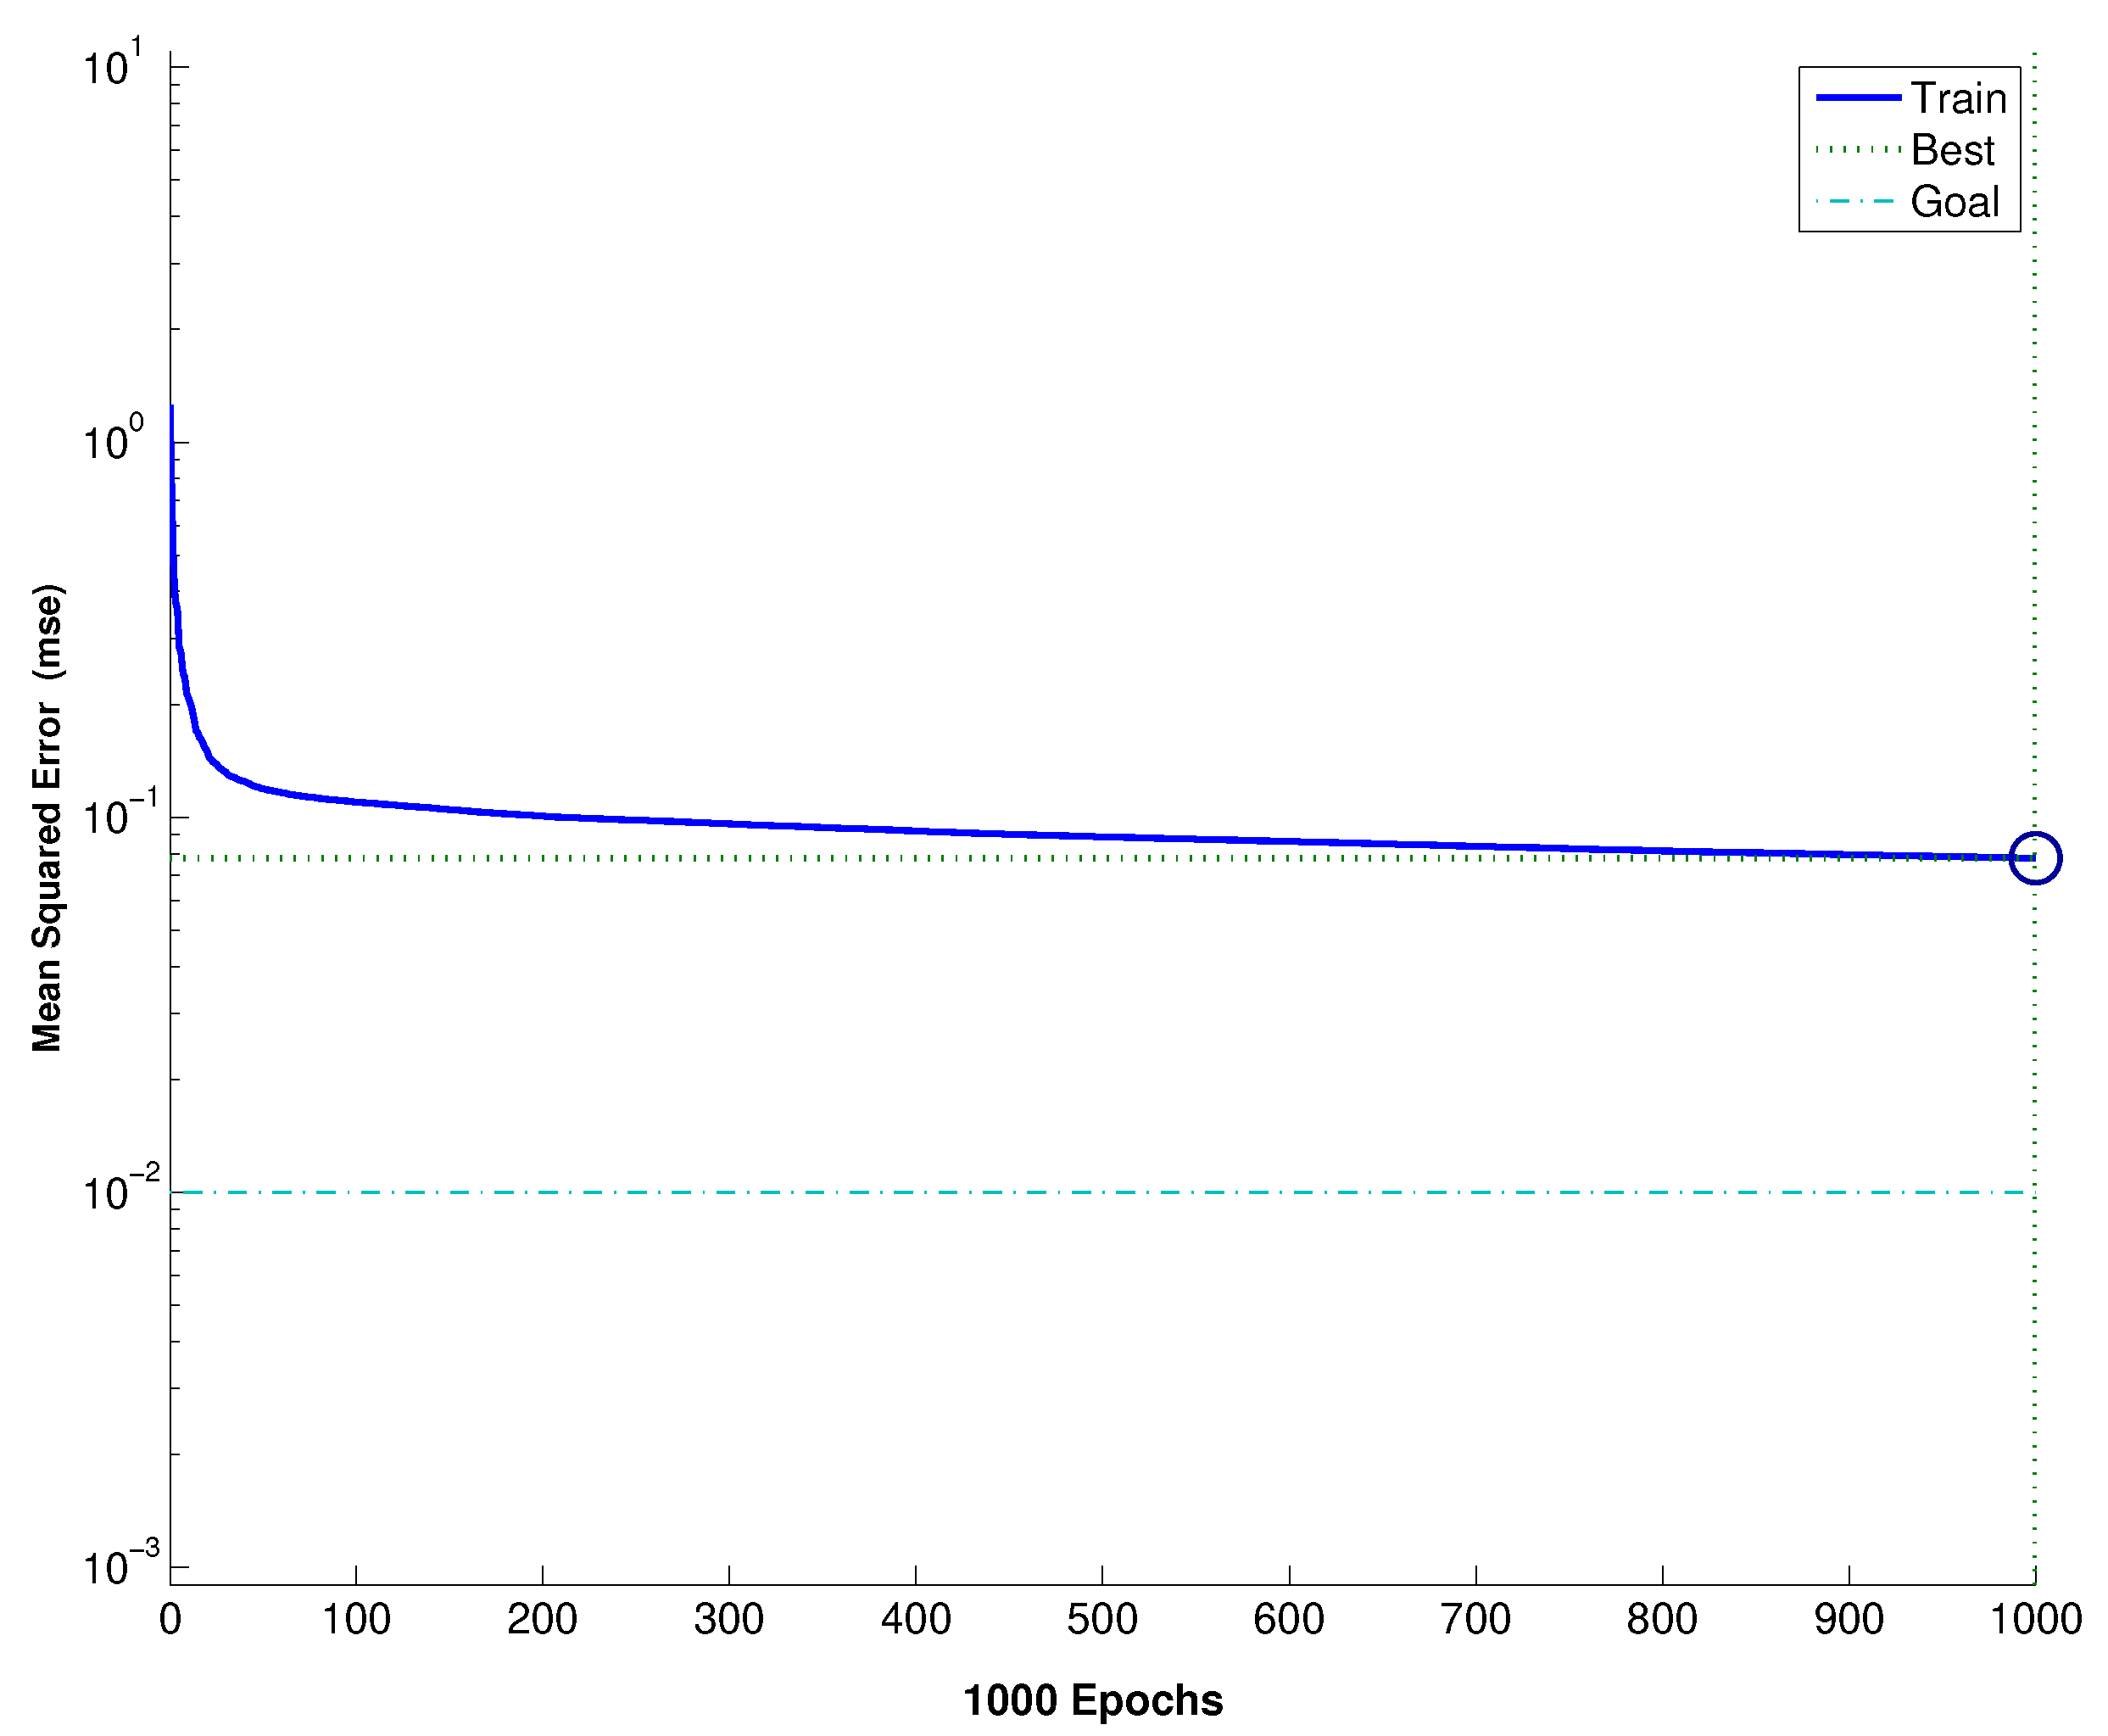
3.4. Training Process for DVT Diagnostic

Traditionally, medical diagnosis is regarded by physicians as an art and depends heavily on the knowledge and experience of each one of them. The diagnostic process is carried out through a combination of activities performed by physicians, which may include physical examination, interview with the patient, review of clinical history, and interpretation of laboratory analysis, among others. This information is used to relate it to known real and academic medical cases, family history and, in some cases, the opinion of colleagues. However, data science opens up new possibilities for medical diagnosis since it allows the analysis of large amounts of data such as the symptoms associated with patient conditions, which can be used in the diagnosis of people with similar symptoms. Nevertheless, one of the hypotheses that arose during this work considers that cases in which patients who showed similar symptoms but opposite diagnosis, negatively affect diagnostic Accuracy in a Decision Support System based, in this case with the proposed ANN model. For this reason, it was deemed necessary to identify and characterize information analysis and establish a training scheme for the generation of an ANN model that allows for improving the Accuracy in the diagnosis of computer-assisted DVT in primary care. To understand the diagnostic process, interviews were conducted with five physicians of different degrees of specialty, who were consulted on how to confirm the suspicion that a patient is suffering an episode of Deep Venous Thrombosis, placing them in a primary care setting, taking as the only additional tool to their knowledge the probabilistic models, particularly the Wells criteria [18,60,65]. In order to train the ANN and determine the experiments that lead to the optimal configuration of the network, the dataset with 11 predictors (see Table 5) was obtained in accordance with the data augmentation Algorithm 1 described in Section 3.2, this by using statistical data of real cases reported in [60] and from a regional hospital. Figure 4 depicts an overview of the training dataset for the proposed ANN model, and all available cases in the dataset were taken into account along with their original diagnosis. It can be seen that 8151 instances have a probability of deep vein thrombosis (DVT) less than 50%, while 570 instances have a 50% probability of DVT and 1279 instances have a probability of DVT greater than 50%.
The hyperparameters used for training the ANN model depicted in Figure 3 were tuned by using the Conjugate Gradient Back-propagation Algorithm with Fletcher–Reeves Restarts, a maximum of 1000 epochs, the learning rate is 1 × 10 2 , the initialization weights is random and the target error minimum is 0.001 to 0.09. The configuration of the computer is: CPU 2.9 GHz Intel Core i5, RAM 8 GB 1867 MHz DDR3, Intel Iris Graphics 6100 1536 MB, MAC operating system Sierra and Software Matlab. Figure 5 depicts the training performance, and it can be seen that the best training performance, also known as Mean Square Error (MSE) is 0.007 at epoch 1000.

3.5. Algorithm to Improve Accuracy/Recall

Algorithm 2 describes the proposed approach to improve the classification threshold to maximize the Accuracy or Sensitivity/Recall of DVT classification. The proposed ANN model is classified through a threshold function, which was defined through an improving process, which consisted of evaluating the Accuracy or Recall of the proposed ANN model with respect to a dataset, taking into account a set of thresholds that had a variation between themselves of 0.001, in a range of 0 to 0.99. For each Threshold, the Accuracy or Recall are obtained.
Thus, for best Accuracy, the threshold function is taken by (3), which indicates when the output of the neural network is greater than or equal to 0.484, then the diagnosis of DVT is considered positive ( f ( x ) = 1 ); otherwise, it is negative ( f ( x ) = 0 ). However, for best Sensitivity/Recall, the threshold function is taken by (4), which indicates that, when the output of the neural network is greater than or equal to 0.138, then the diagnosis of DVT is considered positive ( f ( x ) = 1 ); otherwise, it is negative ( f ( x ) = 0 ).
if x 0.484 then f ( x ) = 1 ; else then f ( x ) = 0 ,
if x 0.138 then f ( x ) = 1 ; else then f ( x ) = 0 .
Algorithm 2 Maximizing Accuracy or Sensitivity/Recall
 1:
# This algorithm is aimed to improve the classification Threshold in order to get the best classification Accuracy or Sensitivity/Recall.
 2:
HighestValue=-1                 # Initializing the Highest Value variable
 3:
for x=1:1000                       # There will be evaluated 1000 Threshold values
 4:
     Threshold=Threshold+0.001;       # The Threshold value is incremented 0.001 each time
 5:
     tp=0;                         # Initializing the True Positives accumulator
 6:
     tn=0;                         # Initializing the True Negatives accumulator
 7:
     fp=0;                         # Initializing the False Positives accumulator
 8:
     fn=0;                         # Initializing the False Negatives accumulator
 9:
     for m=1:10,000                  # The 10,000 synthetic cases in the original Dataset are evaluated in the model
10:
        if dataset(m)>=1             # If the Case m in the Dataset is Positive and,
11:
          if ModelOutputs(m)>=Threshold    # If the Output m is greater or equal to the Threshold value thus
12:
          tp=tp+1                 # The result is classified as True Positive
13:
          else                     # Case m in the Dataset is Positive and the Output m is Negative
14:
          fn=fn+1                 # The result is classified as True Negative
15:
          end
16:
        else                       # If the case m in the Dataset is Negative and,
17:
          if ModelOutputs(m)<Threshold # If the Output m is smaller than the Threshold value thus
18:
          tn=tn+1;                # The result is classified as True Negative
19:
          else                     # Case m in the dataset is Negative and the Output m is Positive
20:
          fp=fp+1;                 # The result is classified as False Positive
21:
          end
22:
        end
23:
     end
24:
     Compute Accuracy or Recall; # Get the Accuracy of the ANN model with the i Threshold value
25:
     if Accuracy or Recall>HighestValue      # If Accuracy or Recall of the ANN model with i-th Threshold value is greater than Highest Value, thus
26:
      OptimizedThreshold=Threshold; # To save the Threshold of the i-th iteration in the optimized Threshold variable
27:
     end
28:
end

4. Results

This section presents the results obtained from the performance of the proposed method. First, a k-fold cross validation by using the 10,000 synthetic cases from the dataset is presented. Subsequently, an analysis of the results from the perspective of the dataset is performed. In addition, comparison of results versus related work is discussed. Later, the results obtained from the validation/test with statistical data of 59 real cases from a regional hospital are shown. Finally, a usage scenario is presented.

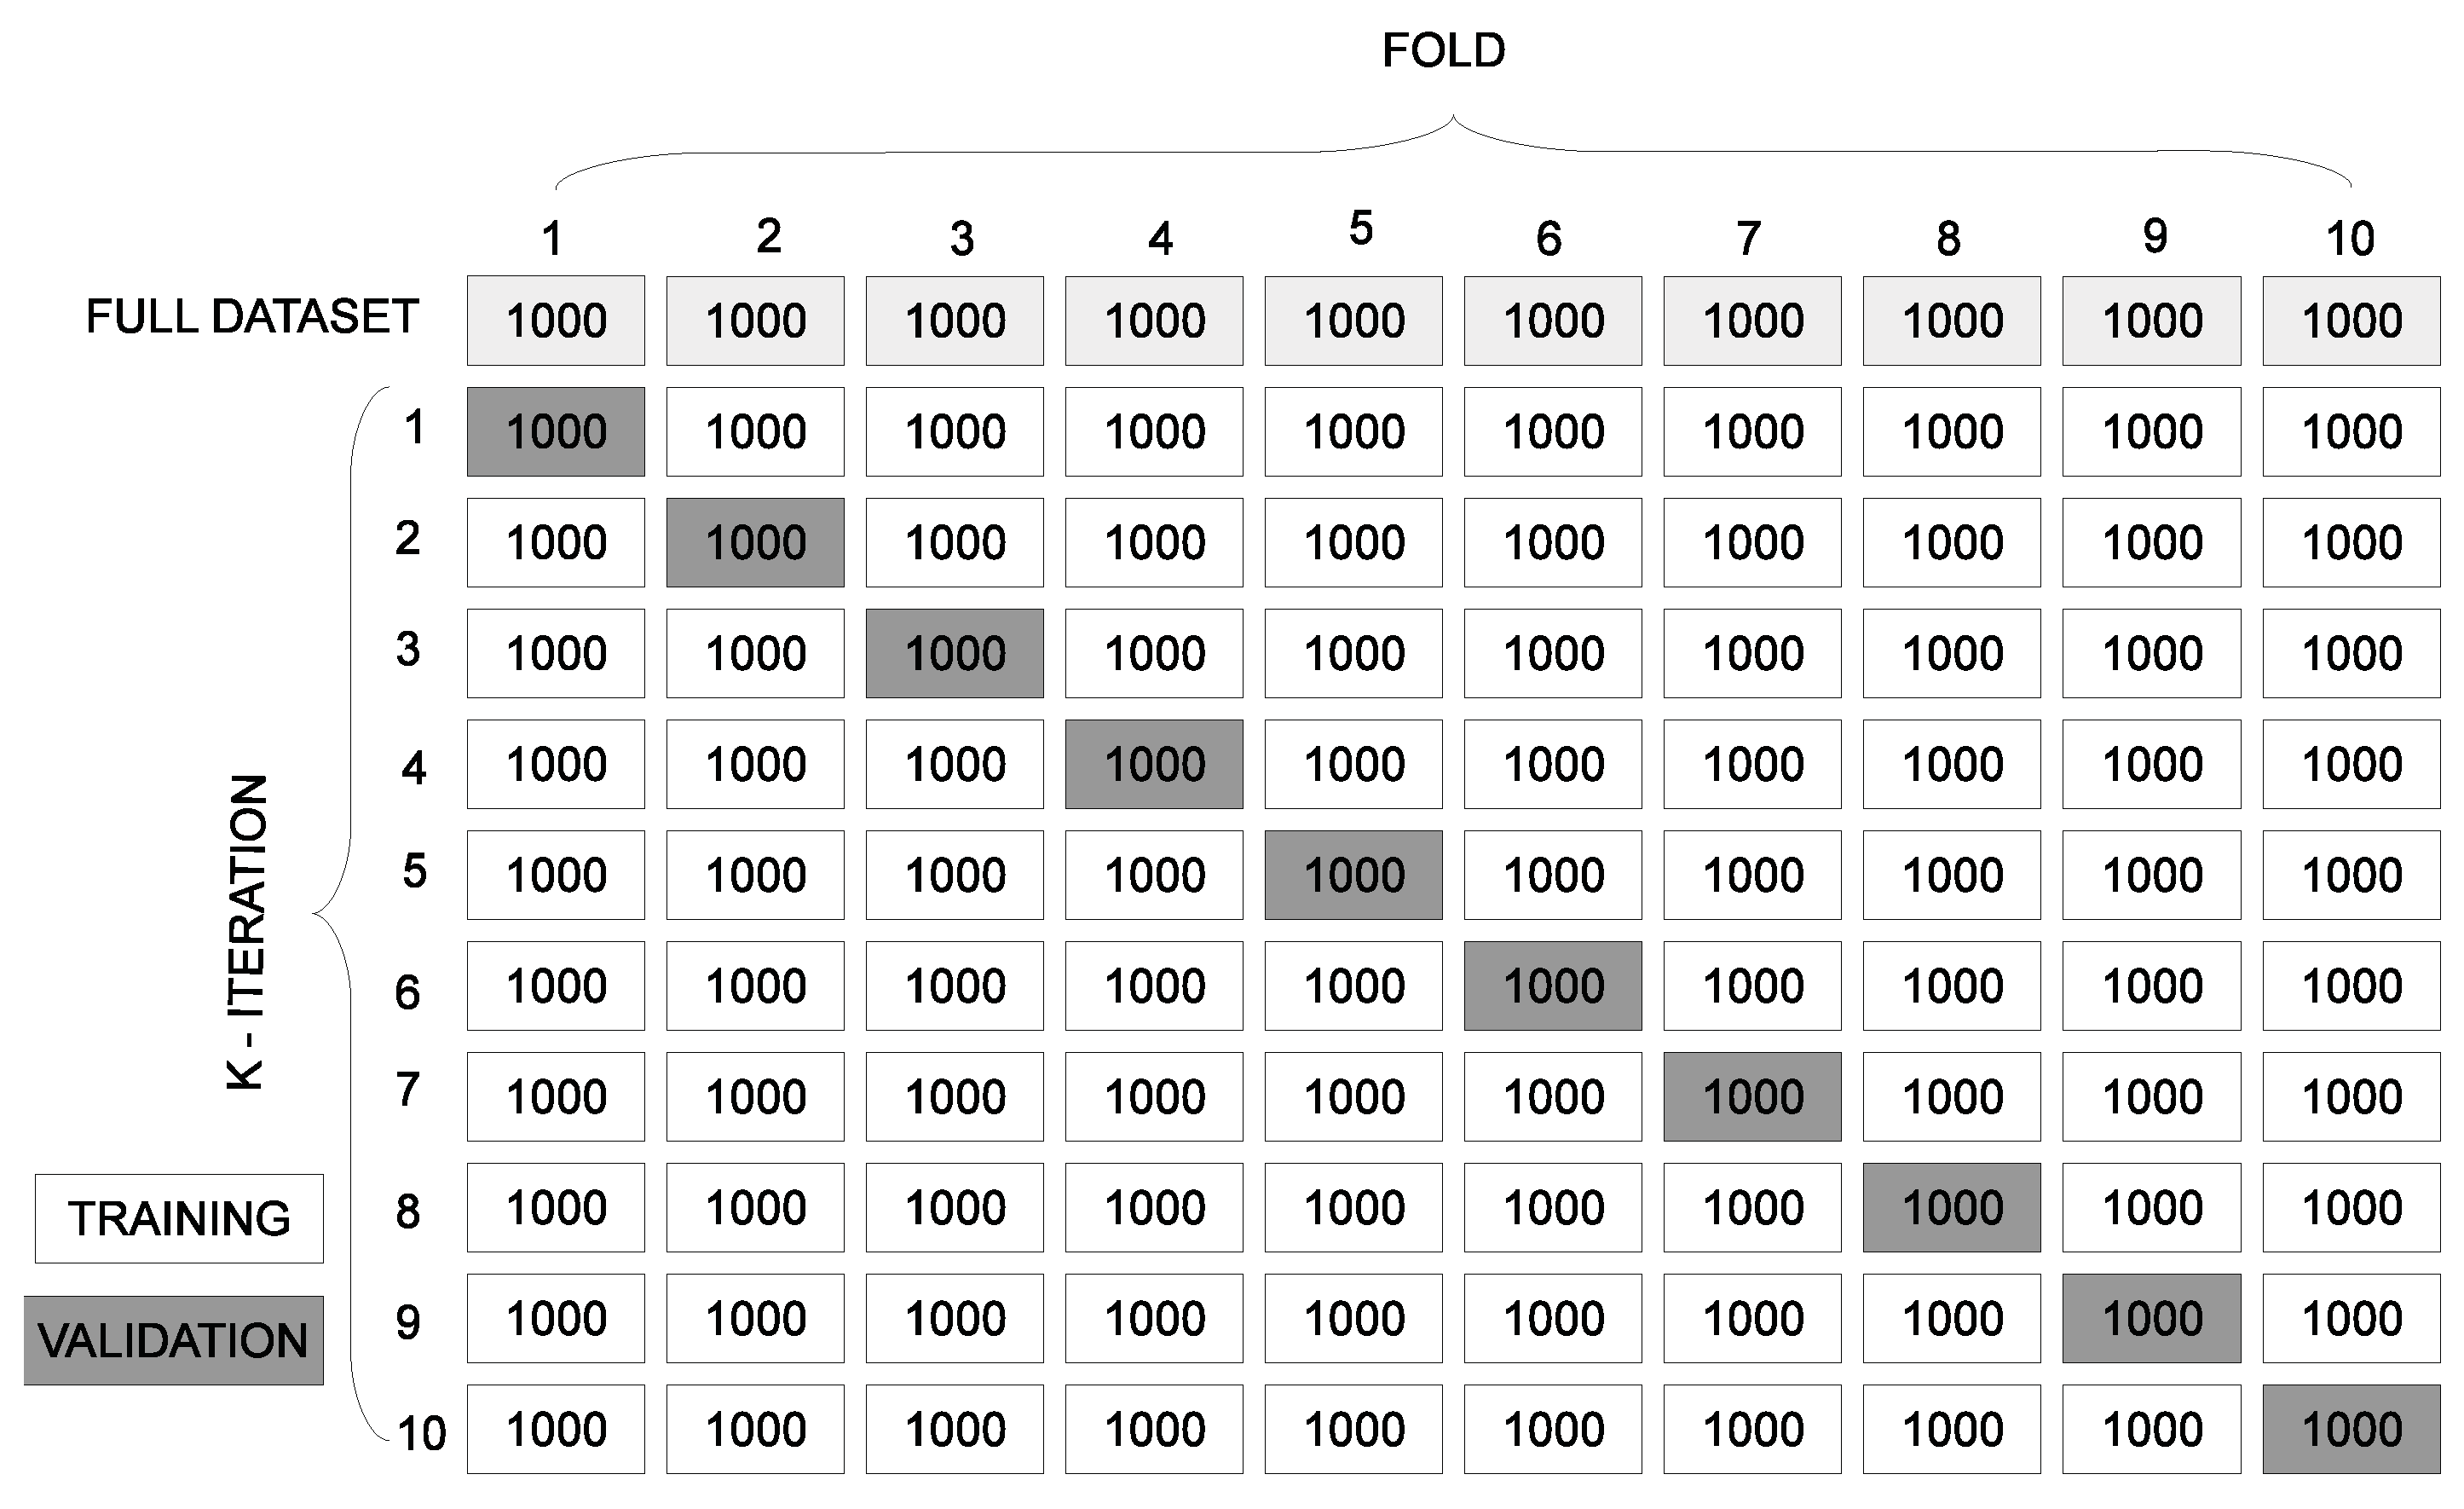
4.1. K-Fold Cross Validation

Regarding the test/validation of the prediction model, there are two main methods that are used as selection criteria for a prediction model: (i) the hold-out model and (ii) the k-fold cross validation model. Both share the characteristic of using a percentage of the dataset for training and retaining a portion for validation. Cross validation is highly adopted as a predictive model selection criterion [83]. Basically, it consists of using a portion of the dataset to build the model and hold-out another portion of the dataset to validate it. However, the main difference lies in the way that data are used for the training and validation process, while the hold-out method is carried out only once, the k-fold cross validation method carries out k times (see Figure 6) and the results of the classification in each interaction are averaged. Therefore, in this article, we decided to perform the test/validation using a k-fold cross validation, since it could help validate the entire synthetic dataset and not to just rely on a random selection of the training and hold-out dataset, since one of the important aspects to consider when using neural networks is that the model should be independent from the dataset used for training and validation. For this purpose, the k-fold cross validation method is perhaps the most widely used to validate the degree of Accuracy of a neural network model regardless of dataset. It consists of dividing the data set into k segments, and, during k times, a different segment is chosen to validate the model, while the remaining k-1 segments were used to train the neural network as shown in Figure 6. The Accuracy of the data are taken from the average Accuracy obtained in each iteration.
According to [84], the most recommended and most commonly used value of k is 10. Therefore, 10 segments of 1000 data are used in this paper. Subsequently, the artificial neural network is trained and validated with these data blocks.
Table 6 shows the confusion matrix of two-class classification [85]; four categories can be observed, (i) positive success (True Positive), which occurs when both the output of the case to be validated and the output estimated by the artificial neural network coincide in a positive diagnosis of DVT, (ii) negative success (True Negative), occurring when both the output of the case to be validated and the output estimated by the artificial neural network coincide in a negative diagnosis of DVT, (iii) False Positive, which occurs when the output of the case to be validated is a negative diagnosis, while the ANN model estimates a positive diagnosis, and (iv) False Negative, occurring when the case is validated as a positive diagnosis, while the ANN model estimates a negative diagnosis.
The performance evaluation of the proposed ANN model was initiated by calculating the S e n s i t i v i t y , S p e c i f i c i t y , P r e c i s i o n , and A c c u r a c y [85,86]. The Sensitivity, also known as Recall [86], it measures the proportion of positives that are correctly identified as such and can be calculated by (5). Similarly, the Specificity measures the proportion of negatives that are correctly identified as such [86] and can be calculated by (6). The Precision is the proportion of true positives among the positive predictions [86]; it can be calculated by (7) and the Accuracy by using (8),
S e n s i t i v i t y = T r u e P o s i t i v e s F a l s e N e g a t i v e + T r u e P o s i t i v e s ,
S p e c i f i c i t y = T r u e N e g a t i v e s F a l s e P o s i t i v e s + T r u e N e g a t i v e s ,
P r e c i s i o n = T r u e P o s i t i v e s T r u e P o s i t i v e s + F a l s e P o s i t i v e s ,
A c c u r a c y = T r u e P o s i t i v e s + T r u e N e g a t i v e s T r u e P o s i t i v e s + F a l s e P o s i t i v e s + T r u e N e g a t i v e s + F a l s e N e g a t i v e s .
Table 7 shows the results of 10-fold cross-validation obtained using the proposed ANN model; it can be observed that the average Accuracy is 90.51% with a standard deviation (Std. Dev.) of 2.67. The True Positive cases are 12.39%, True Negative cases are 78.12%, while False Positive are 2.86% and False Negative are 6.63%. Furthermore, it can be seen that the standard deviation for False Positive cases is 9.54, while, for False Negatives, it is 23.37. As shown in Table 7, the k-fold evaluation showed an average Accuracy of 90.51%. Therefore, it can be said that the proposed ANN model has a confidence range of 90.51%. In addition, it can be observed that the average specificity is 96.46% with a standard deviation of 1.20, while the average precision is 80.96% with a standard deviation of 7.40.
In order to get a stronger validation of the data independency, an additional validation was analyzed using the hold-out model with an 80–20% ratio, obtaining an Accuracy result of 90.35% by using a threshold of 0.484, and a MSE of 0.0714 was obtained. The Sensitivity is 64.30%, the Precision is 81.13%, and the Specificity is 96.47%. Therefore, it can be seen that the results obtained with both validations (k-fold cross validation and hold-out model) are similar.

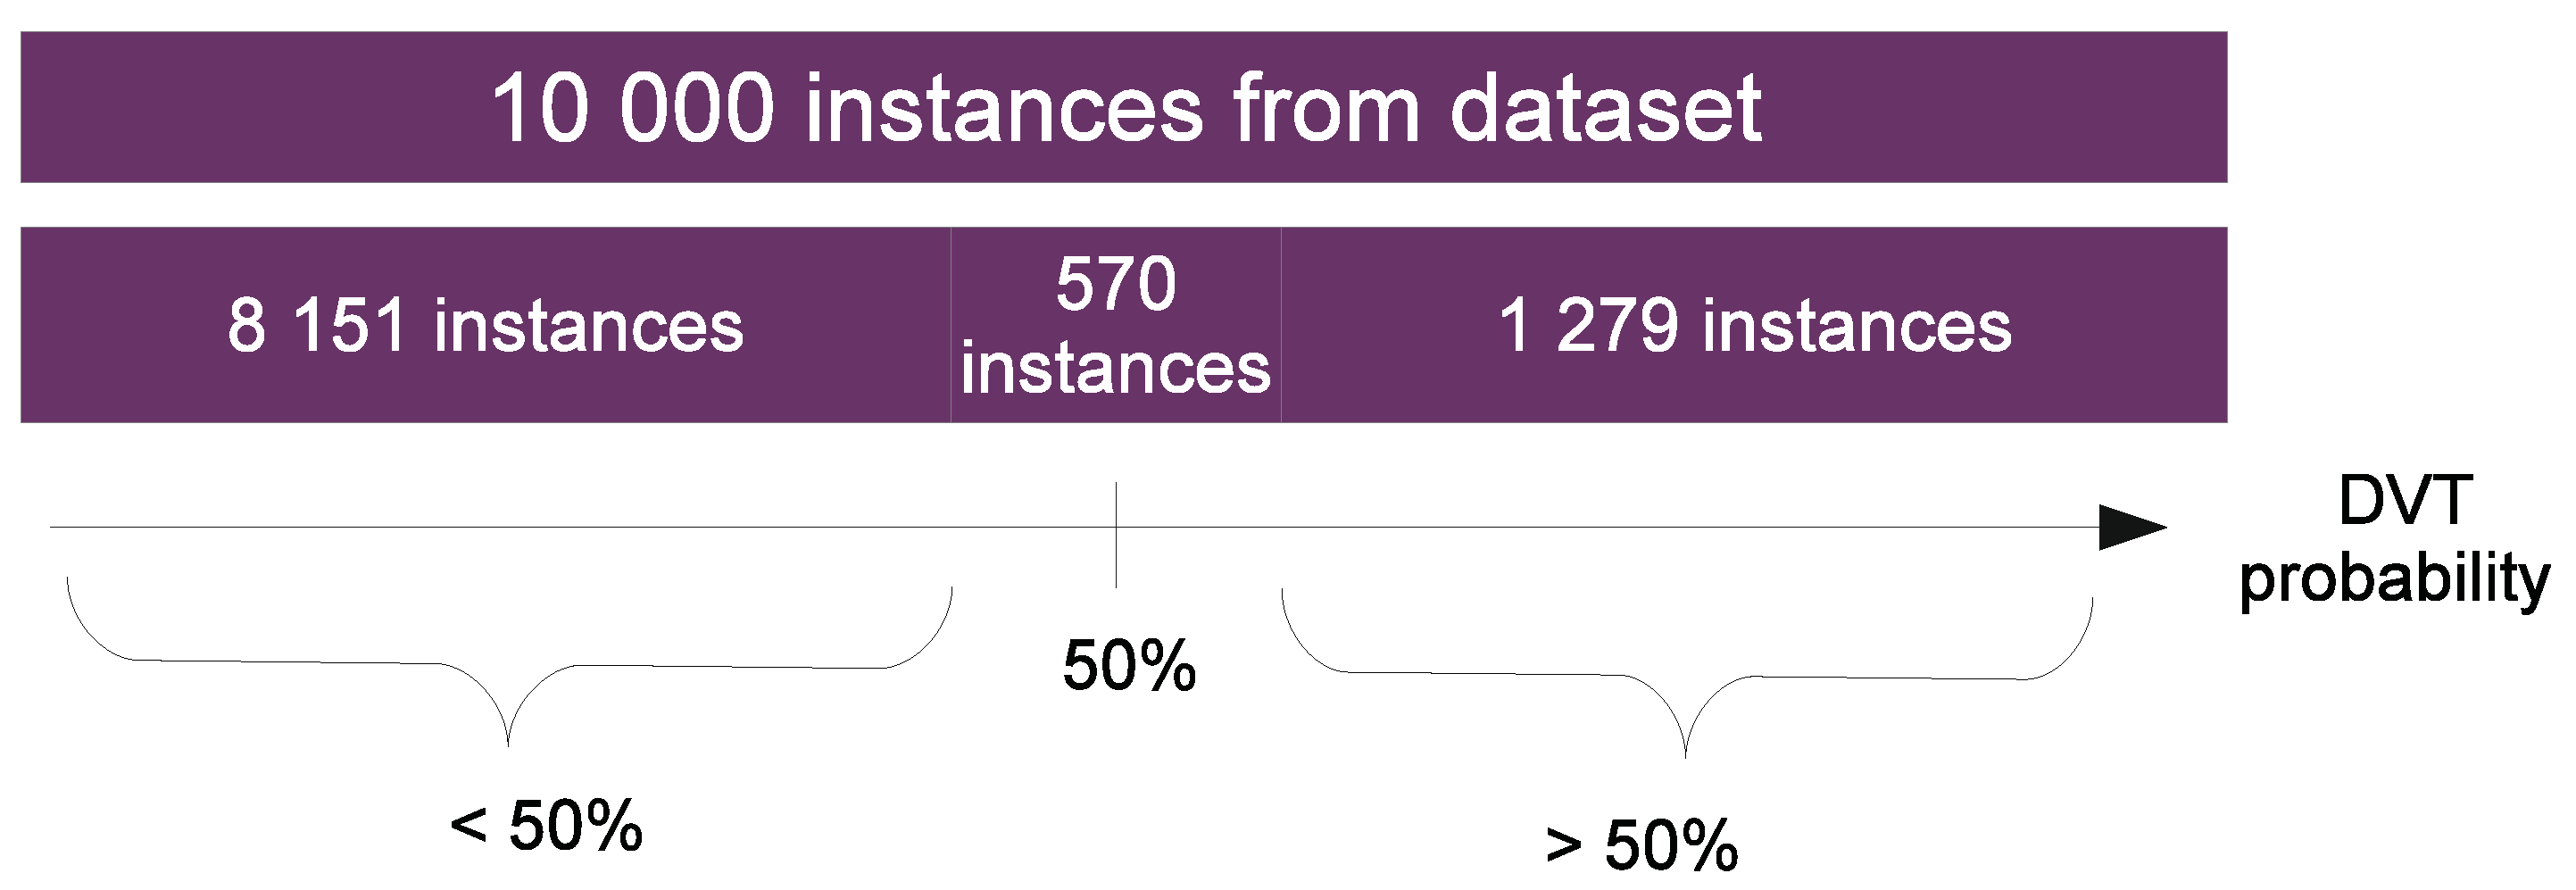
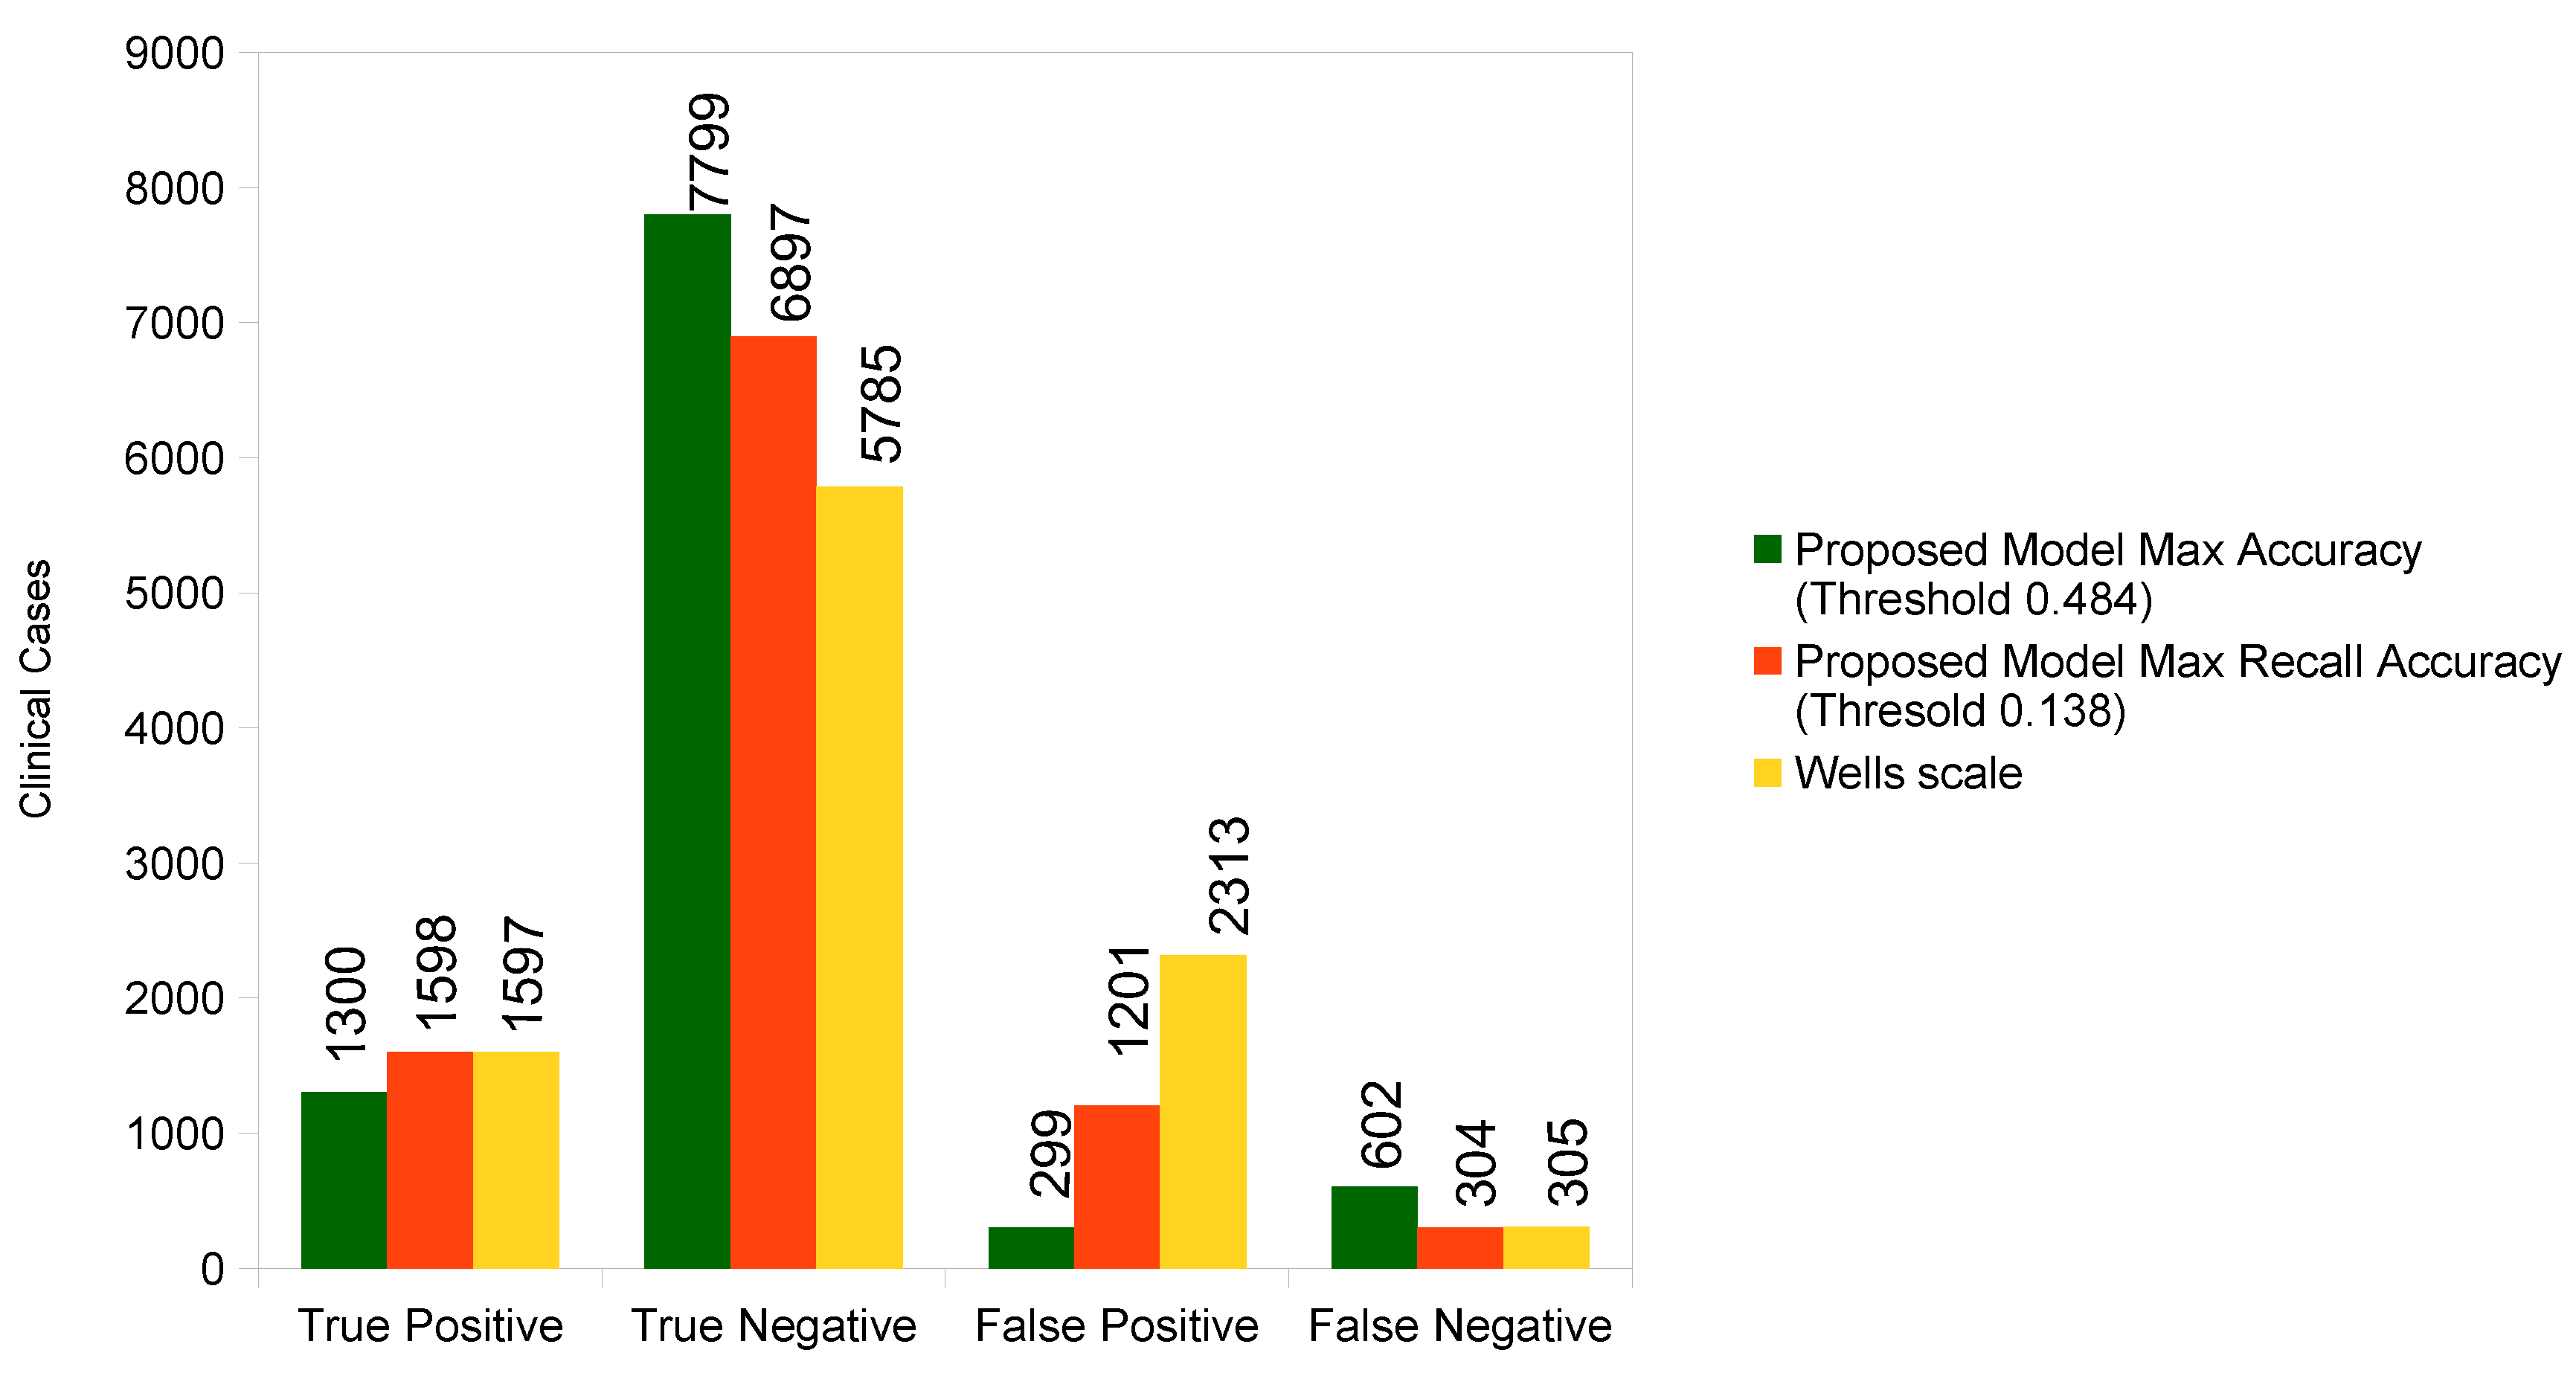
4.2. Results from the Perspective of the Dataset

As mentioned in Section 1, medical diagnosis has a high degree of uncertainty due to the complexity of the biological systems, which can lead to two people with similar characteristics showing different symptoms before the same health condition, or, on the contrary, show opposite health conditions even with the same symptomatology. In terms of the prediction model by using ANNs, we can affirm that the above is similar to clinical cases in which the risk factors representing the input predictors to the system are equal in their entirety, obtaining a different resulting diagnosis as output from the CDSS.
On the other hand, ROC curves and Precision–Recall (PR) curves are the most popular ways to estimate the performance of ANN inference methods [87]. ROC curves do not really emphasize a particular interval of values of this ratio and therefore favor methods that are good for a large range of such values. If one knows for example that the ratio between positives and negatives will be very low when applying the classification model, then one is typically only interested in the bottom-left part of the ROC curve [87]. PR curves, on the other hand, provide a better picture of the performance of a method when the ratio between positives and negatives in the test data are close to the ratio one expects when practically applying the model [87]. Binary classification problems are usually substantially imbalanced in favor of the negative class, as the proportion of interacting pairs among all possible pairs is very small. This speaks in favor of the PR curve over the ROC curve [87]. Therefore, Figure 7 shows the PR curve of the proposed classification model using a threshold of 0.484; it can be seen that the result of varying the pivot that distinguishes a positive case from a negative one. As can be observed, a commitment must be established between reducing cases of False Positives and cases of False Negatives. When minimizing False Positives, False Negatives are increased, and vice versa; in this way, it will be a design decision to determine the appropriate configuration for diagnosis. Regarding the area under the curve (AUC), the resulting values of ROC-AUC is 0.9601 and PR-AUC is 0.9114.
Figure 8 shows a comparison of the confusion matrices of the proposed ANN model by using the proposed dataset. It can be observed that the model correctly classifies 68.34% (1300 of 1902) of the positive cases, and 96.30% (7799 of 8098) of the negative cases, with 3.69% of positive erroneous classifications (299 of 8098) and 31.60% of erroneous negative classifications (602 of 1905), while the evaluation with the Wells criteria yields 83.96% (1597 of 1902) of the positive cases, and 71.43% (5785 of 8098) of the negative cases, with 28.56% of false positive predictions (2313 of 8098) and 16.03% of false negative predictions (305 of 1902).
Figure 9 depicts a comparison of Precision, Sensitivity/Recall and Accuracy percentages obtained with the proposed ANN model for Maximum Accuracy with threshold 0.484, for Maximum Sensitivity/Recall with threshold 0.138 and using Wells’ Score in a traditional way. It can be observed that, when the threshold is 0.484, the maximum Accuracy is 90.99%, the Sensitivity/Recall is 68.35%, and Precision is 81.30%. However, when the threshold is 0.138, the maximum Sensitivity/Recall is 84.01%, the Precision is 57.09%, and Accuracy is 84.95%. When Wells’ Score is used in the traditional way, the Accuracy is 73.82%, Sensitivity/Recall is 83.96%, and Precision is 40.84%.
This paper presents an alternative to evaluate the diagnosis of DVT by using an ANN model based on the Wells’ score [60]. As a variant, in this paper, the Age and gender of the patients are added to improve the Accuracy of the prediction model. For this reason, an analysis was carried out to know the impact that the inputs have on the final result obtained; in its original form, the Accuracy is 90.99%. Table 8 shows an analysis of the importance in case of missing a risk factor (some input). It can be observed that the input that most impacts the result is Age, since eliminating the age produces an Accuracy of 84.59%, which means a decrease of more than 6% with respect to the original value of 90.99% obtained by the trained model considering all the inputs. This influence is quite different from the average between the other variables, which is 88.17% (Standard Deviation of 0.5%). The above can be explained from the stratification that each variable (input) contributes to the ANN model; practically, all the inputs offer a binary segmentation, so it is not surprising that they have a similar influence on the model’s Accuracy, unlike the Age that can assume nine different values, which allows the ANN model to better distinguish due to the stratification that this variable provides.

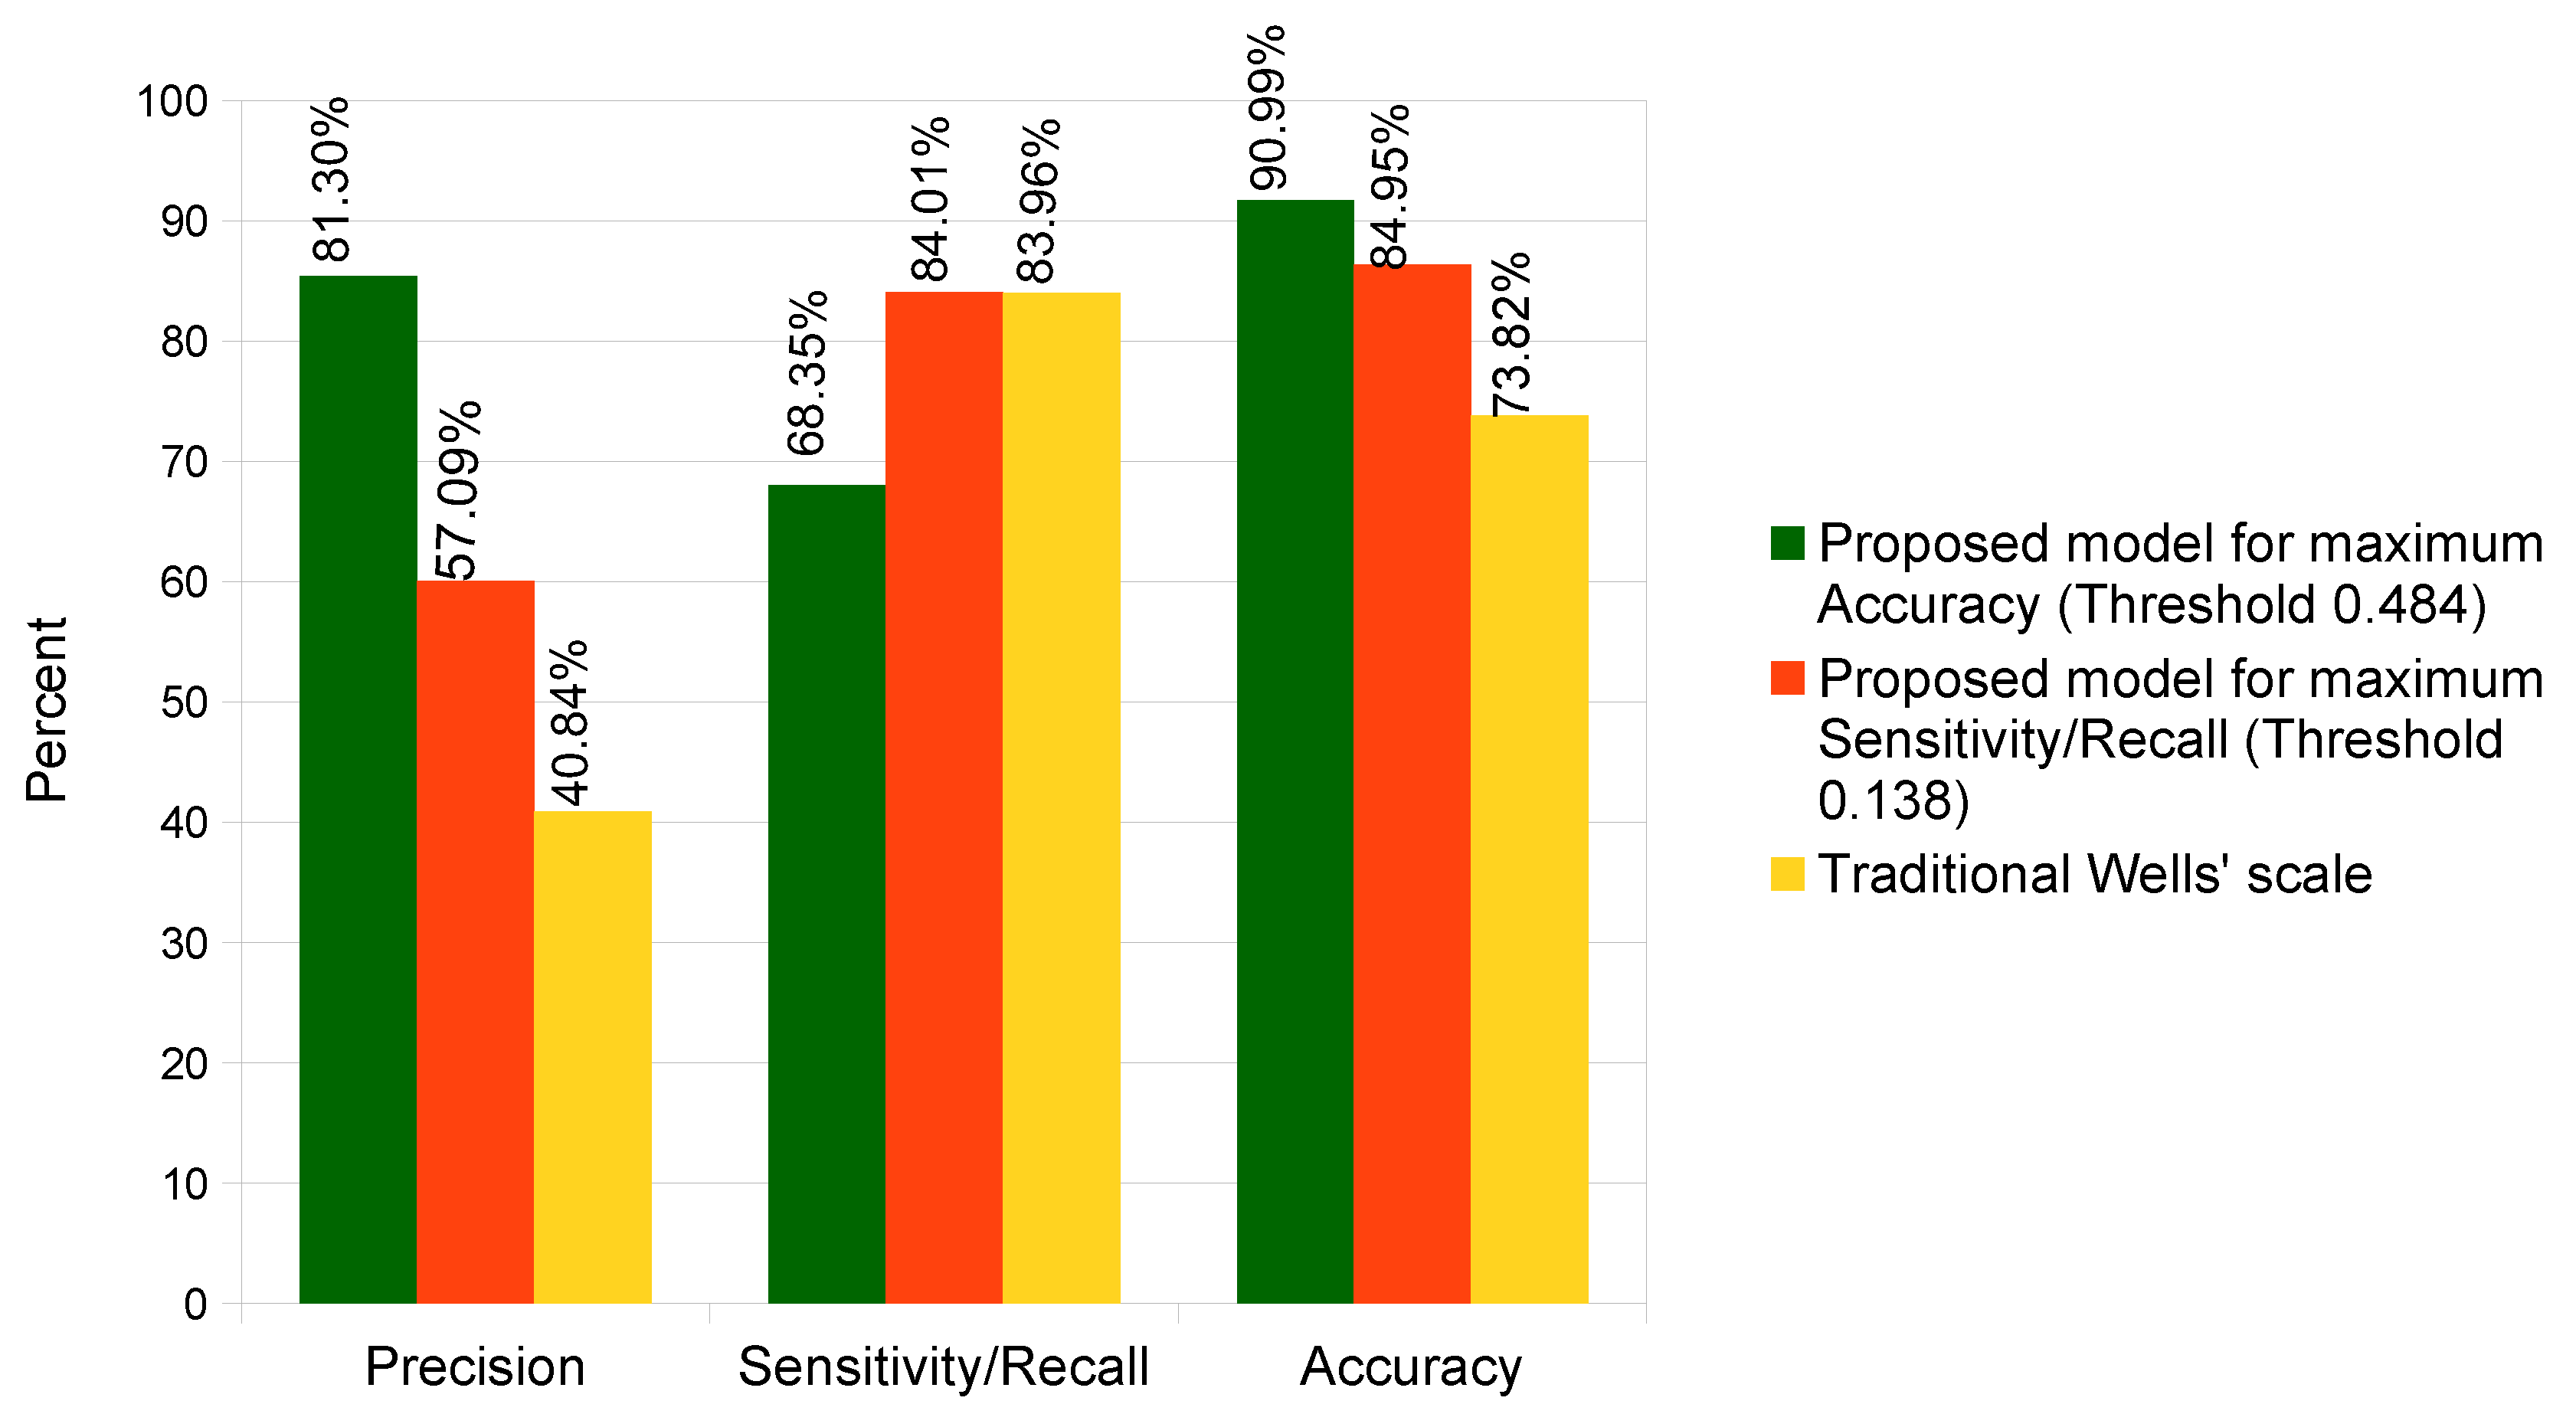
4.3. Results Comparison

To clarify the contribution of this paper, this section shows a comparison among: (i) the results of using the proposed ANN model, (ii) the evaluation of the cases of the dataset by the traditional Wells’ criteria and, as shown in Table 9, and (iii) performing another M-L approach [35,36,88,89,90] by using the same dataset, as shown in Table 10.
Table 9 shows, when seeking to maximize Accuracy, the proposed scheme has an average Accuracy of 90.99% and a Specificity 96.31%, it can be observed that Accuracy is 17.17% greater than the traditional method reported by Wells [60] without considering gender and age. However, when seeking to maximize the Sensitivity/Recall, the proposed scheme obtained is 84.01%, the Accuracy is 84.95%, and a Specificity of 85.17%.
Table 10 shows a comparison of results versus other machine-learning approaches. It can be observed that the proposed ANN model presents: Specificity 96.31%, Sensitivity/Recall 68.35%, Precision 81.30%, and an Accuracy of 90.99%; it can be seen that, in most cases, it is higher than the other M-L methods, except that the linear SVM method [35,36,88] has a Specificity of 100%, but a Sensitivity/Recall of 0%, which means that all predicted diagnosis are negative. This is because the proposed ANN model using a threshold to make the best decision in diagnosing DVT and ANN models works better with unbalanced datasets [85,91,92]. Therefore, this is the reason why the ANN model was used in this paper.

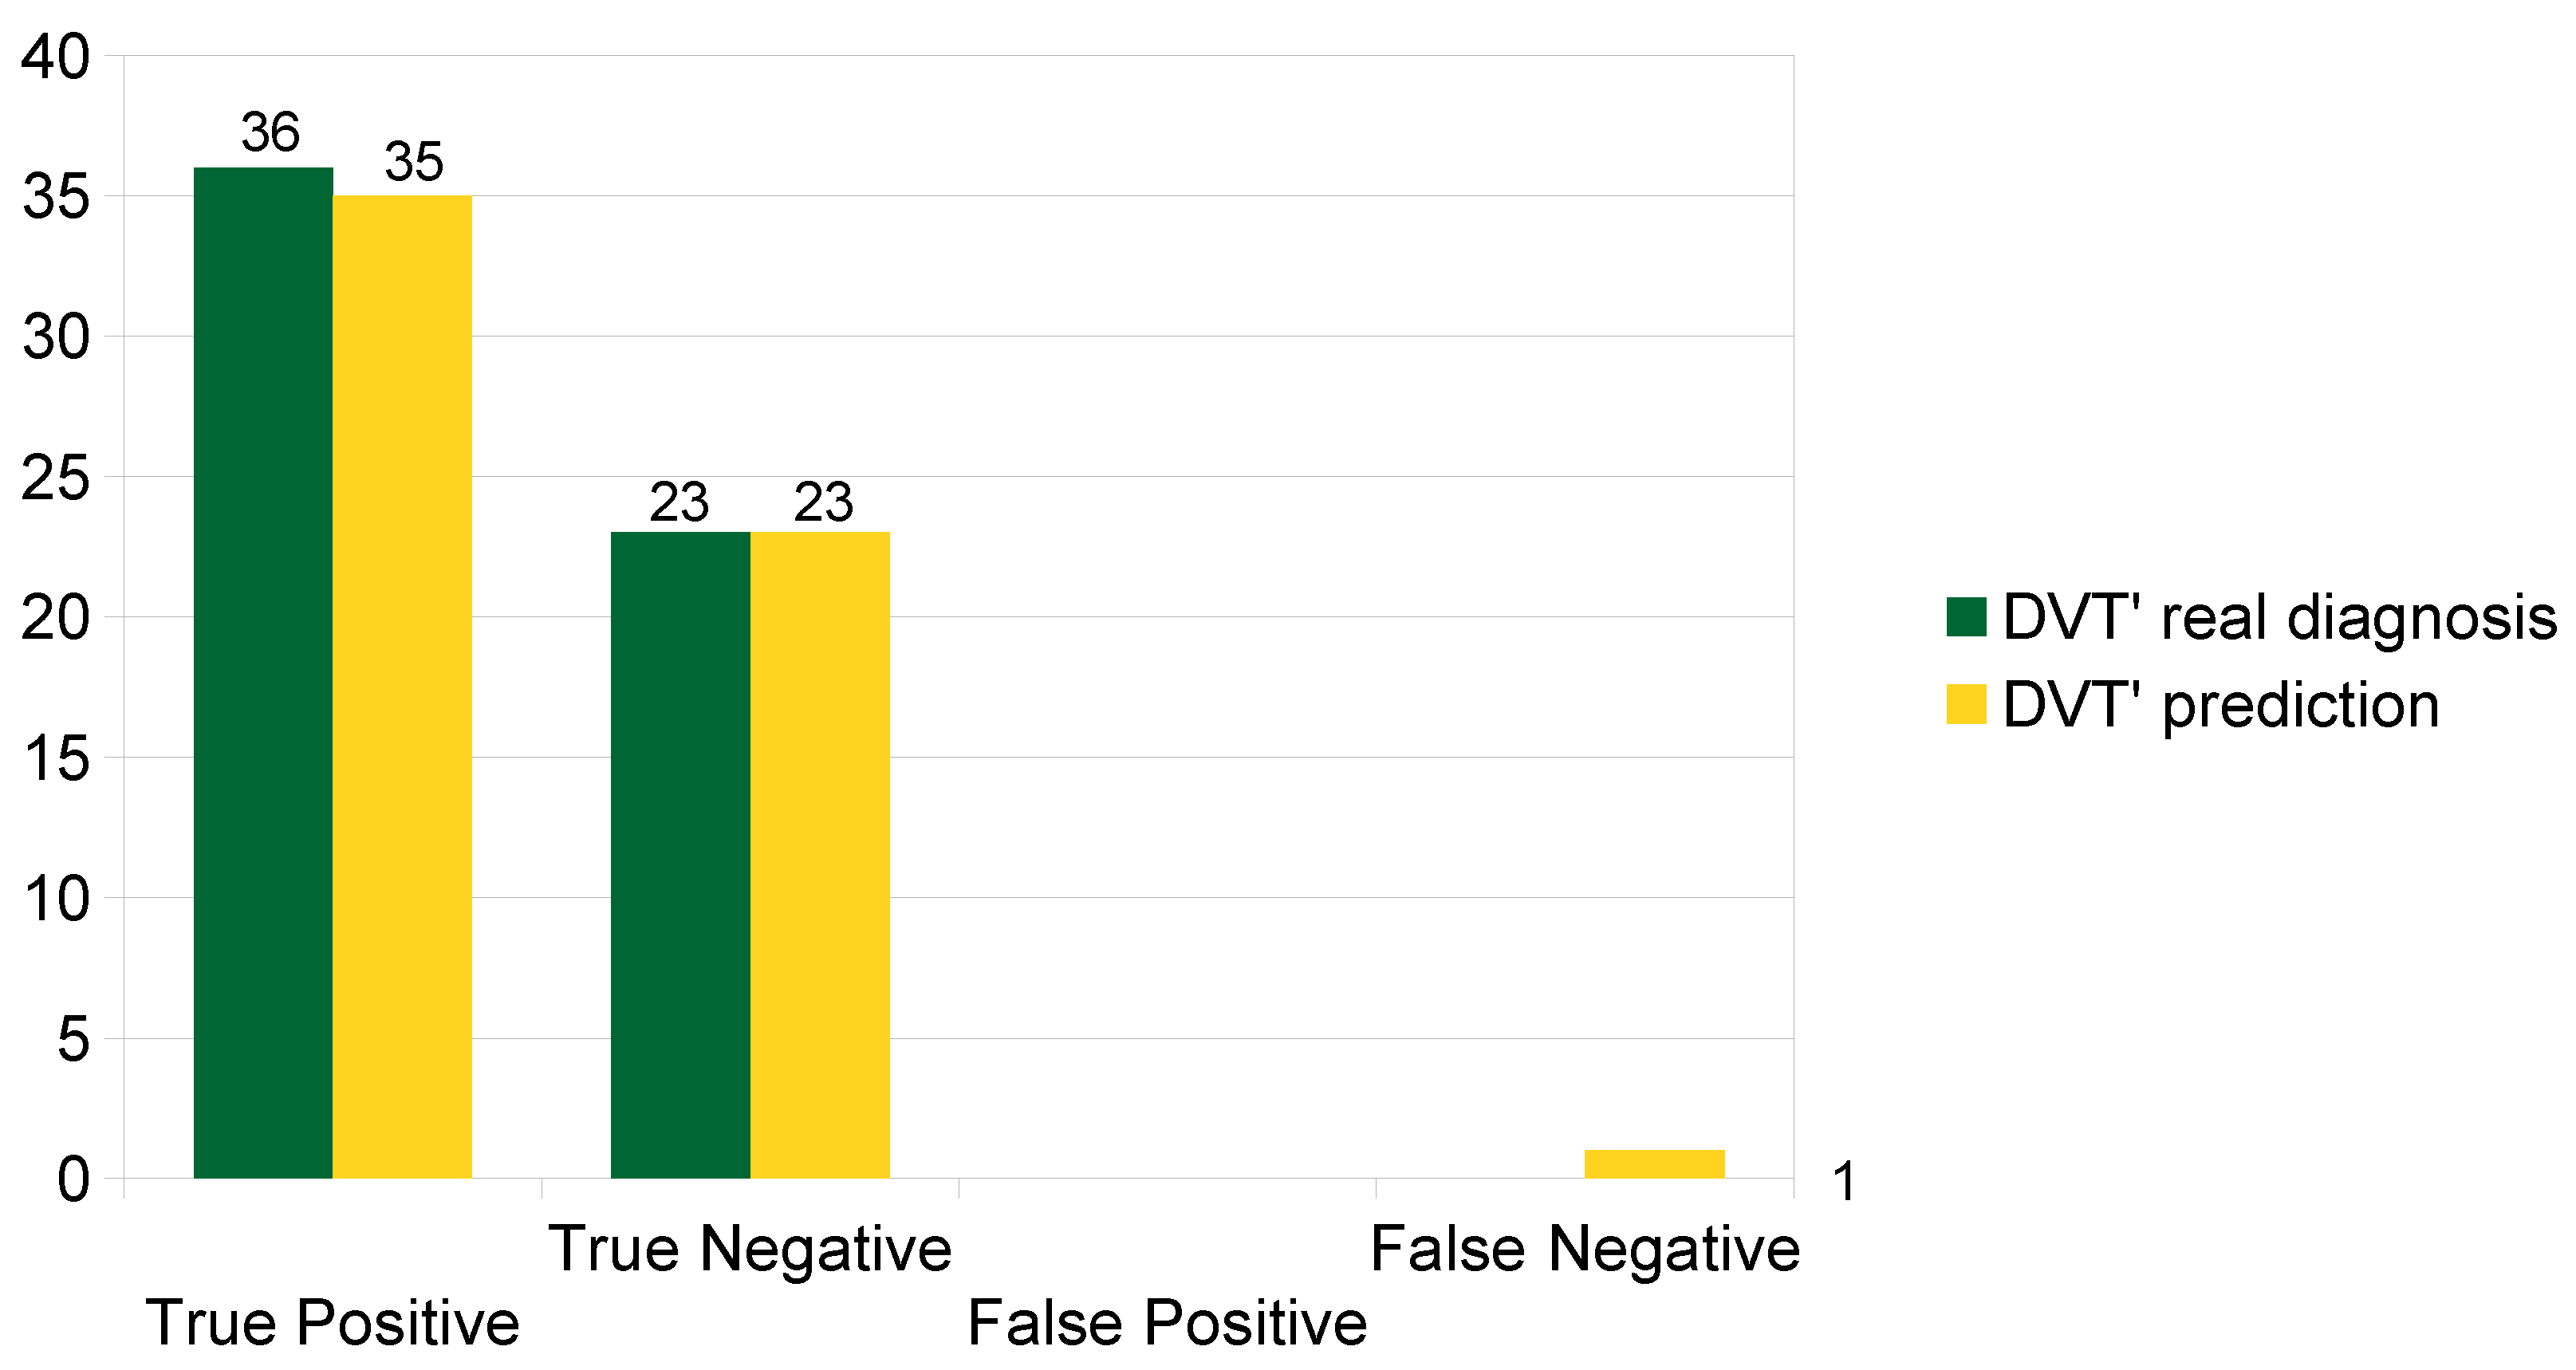
4.4. External Validation
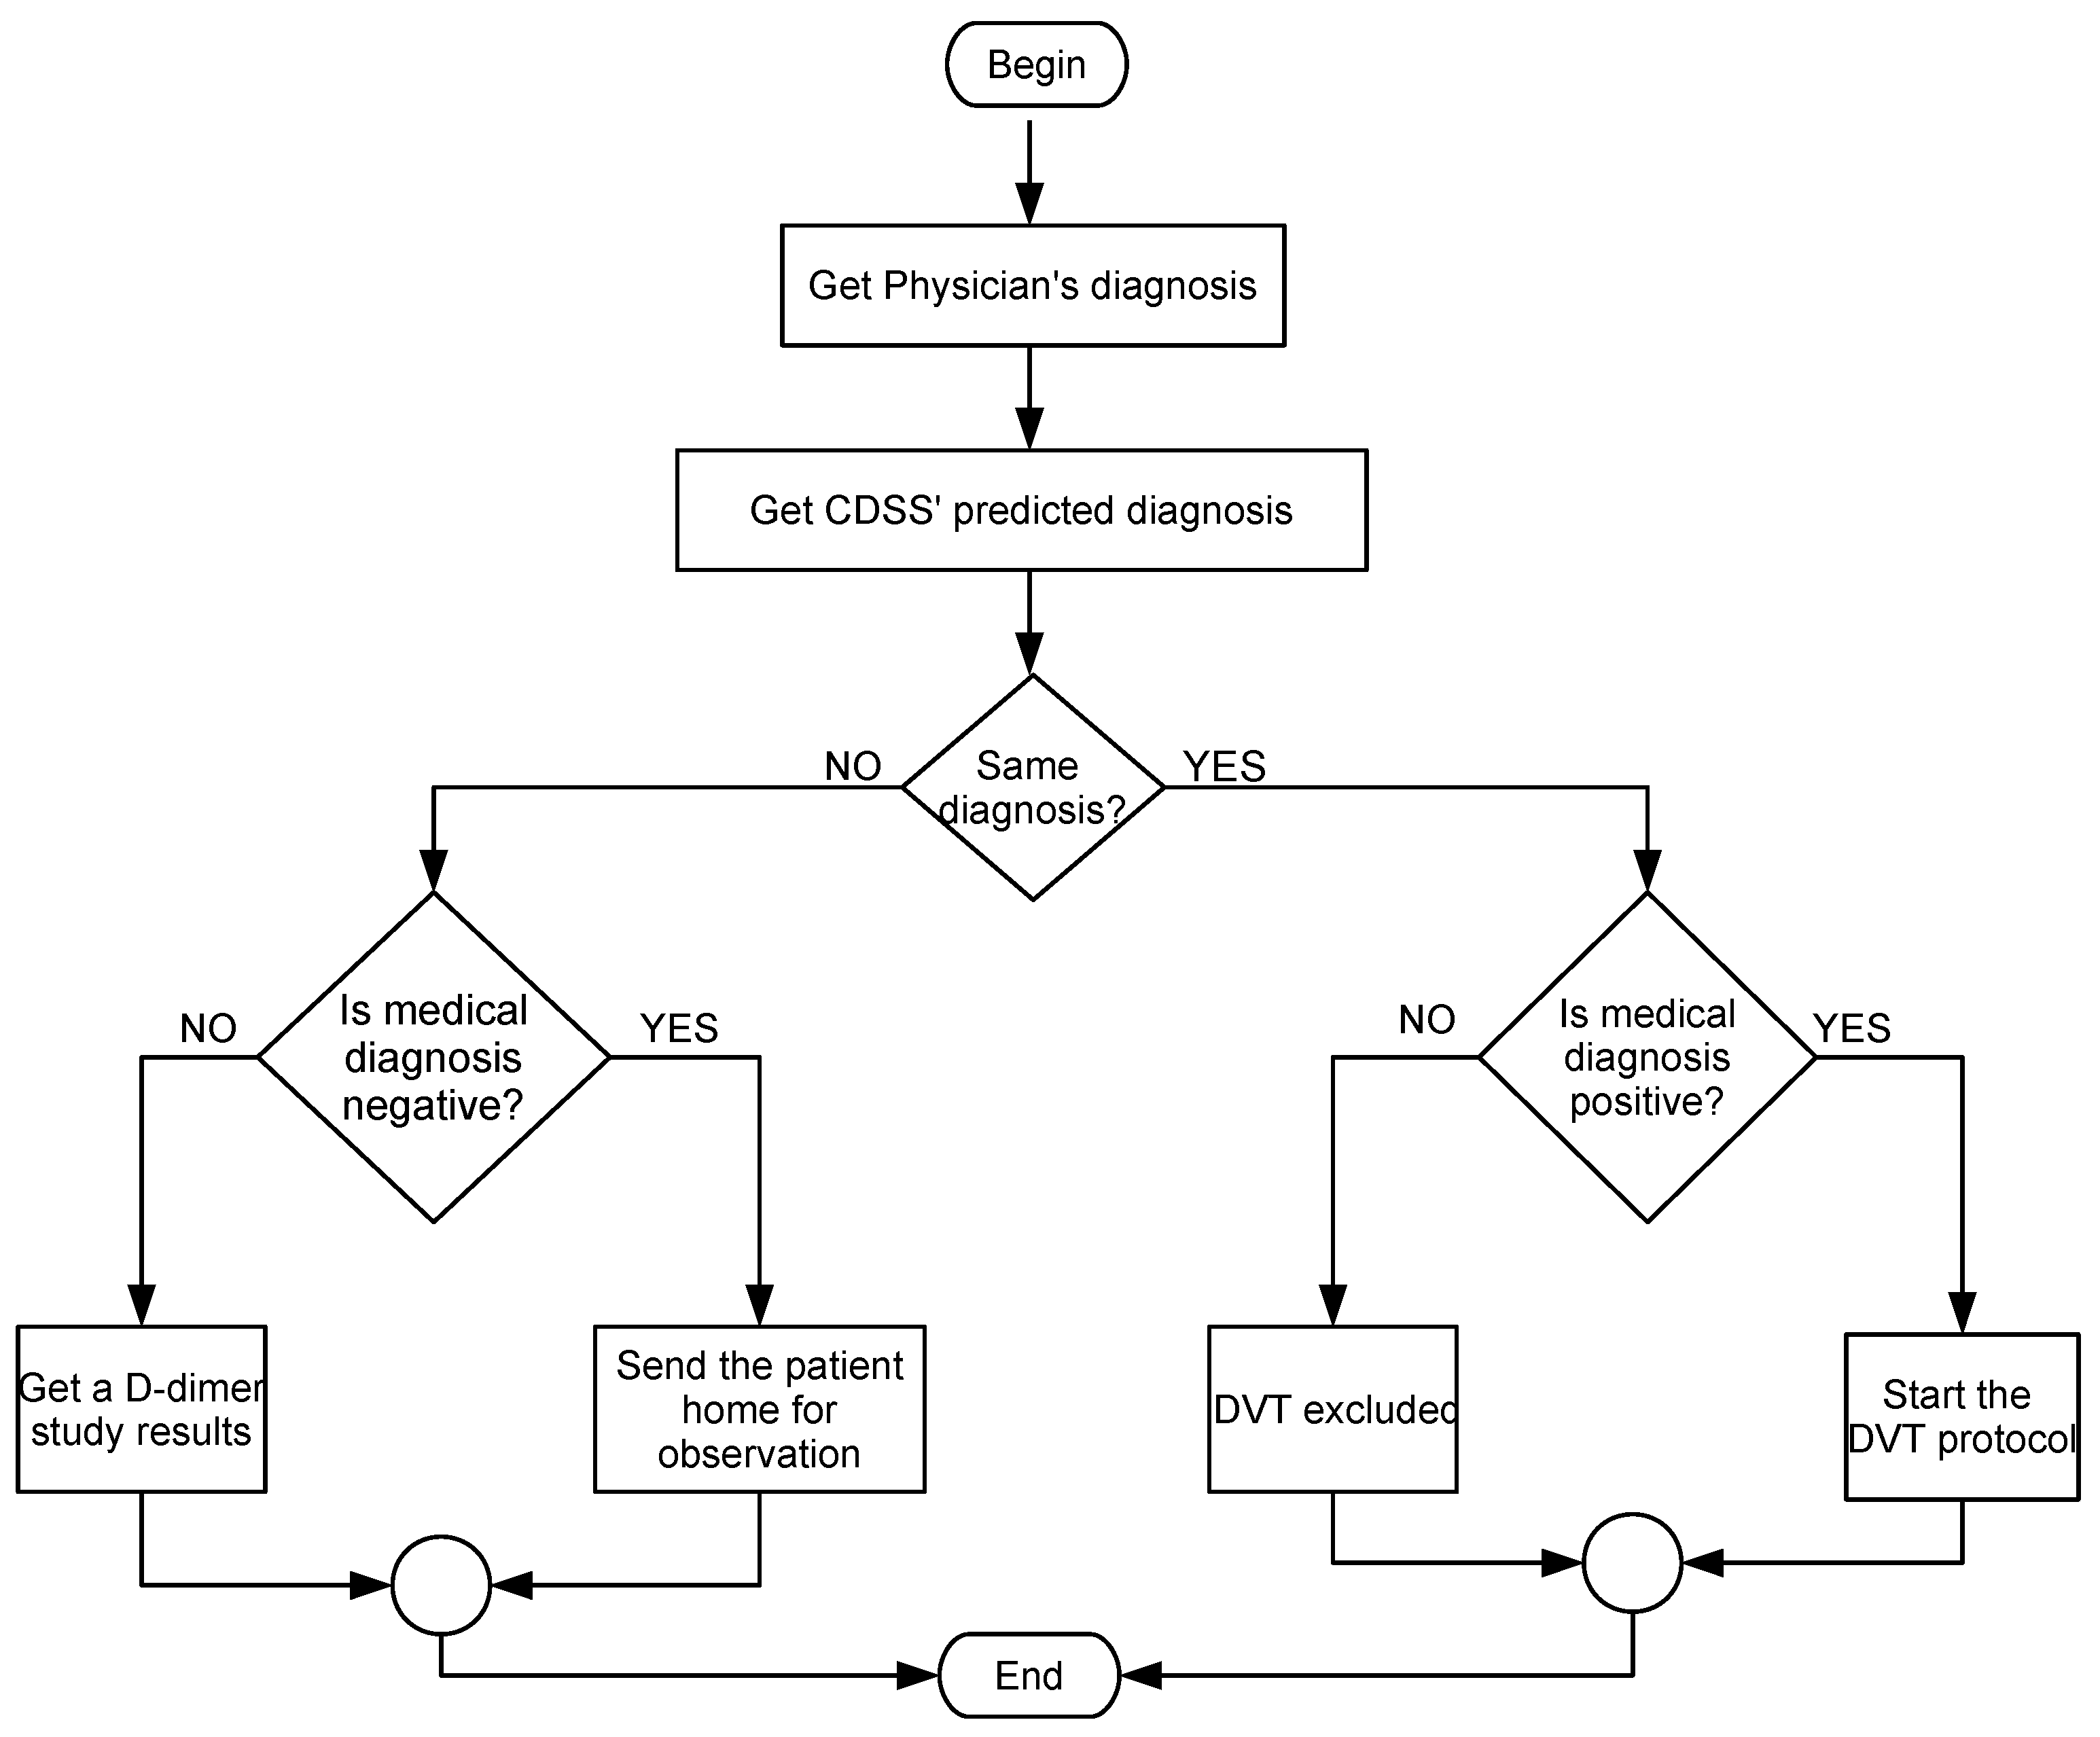
Once the proposed ANN model was trained and validated with the k-fold cross-validation technique, an external validation was performed using the information from 59 real clinical cases provided by a public hospital during the years of 2017 and 2018. Figure 10 shows the results of evaluating the real clinical cases by using the proposed prediction model. It is observed that only 1 out of 36 cases of DVT were diagnosed as negative, when, in fact, they were positive; that is, an Accuracy of 98.30% was achieved (58 of 59 hits); therefore, there is a diagnostic error of 1.70%.

4.5. Usage Scenario

The use of the proposed CDSS uses ANN modelo based on the Wells criteria for the diagnosis of DVT; it is recommended that this intelligent system is complementary to the protocol that is currently used, therefore, as illustrated in Figure 11. It is proposed that the physician performs the physical examination and interviews the patient, and then enters the data obtained into the proposed intelligent system. If the physician and the system show that the user does not have a DVT condition, the patient will not receive treatment. If the system yields a diagnosis of positive DVT, but the doctor determines that it is not, then the patient should go home and watch for the appearance of new symptoms or those already existing becoming more acute. In the case that the physician determines that the physical examination suggests a DVT, but the system diagnoses otherwise, the physician will make the decision leaving as a suggestion that the patient should be under observation. Finally, if both the system and the physician determine that the patient is suffering from DVT, treatment of DVT should be initiated.

4.6. Limitations of the Proposed Approach

The dataset used in the training and validation of the proposed classification model is generated according to the proposed Algorithm 1, and, although it is based on actual occurrences according to statistical data reported by Wells [60], it does not faithfully represent the behavior of the population at risk of suffering from DVT. However, the results with real data suggest an accuracy of 98.30% due to the impact that decisions based on the proposed classification model can have on the health of patients; it is suggested to take these results as evidence of the effectiveness of ANNs in the diagnosis of DVT, and look for a dataset with more real cases to train the ANN model before putting it into practice in real-life.

5. Conclusions

This paper presented a diagnostic model for suspected DVT cases based on back-propagation ANN. In this study, an ANN model was used to improve the learning Accuracy when dealing with a highly unbalanced dataset. The training was performed according to Wells’ criteria and considering age and gender. Because of the small amount of historical data in Mexican hospitals with cases of DVT symptoms, a technique of data augmentation to train the ANN model is proposed, which helps to improve Accuracy in the DVT diagnosis. The k-fold cross validation results show a diagnostic Accuracy of 90.99% of the cases of a synthetic dataset and an Accuracy of 98.30% from 59 real-cases of a Mexican hospital. The above could be achieved because the ANN model makes the diagnosis by using a threshold 0.484 found to maximize Accuracy. On the other hand, with a threshold of 0.138, the proposed ANN model improves the classification of positive cases without significantly affecting the classification of negative cases. It is evident that the development and implementation of a CDSS using the ANN model for the diagnosis of DVT in primary care improves the Accuracy of early diagnosis, thus decreasing the flow of patients arriving at the emergency department. As a direct consequence, morbidity and mortality rates in patients in primary care would be reduced; in addition, less economic resources in medical units would be consumed. The proposed approach improves Accuracy by 17.17% versus diagnosis in a traditional way using Wells’ criteria without considering gender and age. The proposed ANN model was compared with other well known machine-learning approaches, and it was observed that the Accuracy obtained is better than the related approaches because they do not use an optimized threshold to make the decision. Therefore, it is concluded that the presented approach contributes significantly to the early diagnosis of DVT through probabilistic models such as the Wells criteria, gender, age, and the use of back-propagation ANN to help physicians make a more reliable or accurate decision when making a DVT diagnosis.
As future work, the proposed method and algorithms can be implemented on embedded systems and FPGAs, the above with the purpose of developing intelligent instrumentation that is portable and reliable.

Author Contributions

Conceptualization, E.I.-G., E.E.G.-G. and O.R.L.-B.; Data curation, M.B.F.-M. and D.A.M.-M.; Formal analysis, M.B.F.-M., F.Z.-A. and D.L.-M.; Funding acquisition, E.I.-G., D.A.M.-M. and M.B.F.-M.; Investigation, M.B.F.-M., E.I.-G., E.E.G.-G., O.R.L.-B., D.A.M.-M. and L.J.V.-G.; Methodology, M.B.F.-M., E.I.-G. and D.A.M.-M.; Software, M.B.F.-M., E.I.-G. and D.A.M.M.; Validation, E.E.G.G., O.R.L.-B. and D.L.-M.; Supervision, E.I.-G. and E.E.G.-G.; Writing—original draft, M.B.F.-M. and D.A.M.-M.; Writing—review and editing, E.I.-G. and E.E.G.-G. All authors have read and agreed to the published version of the manuscript.

Funding

This work was supported by the Secretary of Public Education (SEP) with code 11776 P/PROFEXCE-2020-02MSU0020A-12 and P/PFCE-2018-02MSU0020A-12 11478. The authors appreciate the doctoral scholarship granted to Francisco Zamora-Arellano from the Mexican National Council for Science and Technology (CONACYT). The authors would like to thank PRODEP (Professional Development Program for Professors) for supporting the new generations and for innovating the application of knowledge.

Acknowledgments

The authors are thankful to the reviewers for their comments and suggestions to improve the quality of the manuscript.

Conflicts of Interest

The authors declare no conflict of interest. The founding sponsors had no role in the design of the study; in the collection, analyses, or interpretation of data; in the writing of the manuscript, or in the decision to publish the results.

References

  1. Myers, D.J.; Lester, P.; Adili, R.; Hawley, A.; Durham, L.; Dunivant, V.; Reynolds, G.; Crego, K.; Zimmerman, Z.; Sood, S.; et al. A new way to treat proximal deep venous thrombosis using E-selectin inhibition. J. Vasc. Surg. Venous Lymphat Disord. 2020, 8, 268–278. [Google Scholar] [CrossRef]
  2. Taha, M.A.; Busuttil, A.; Bootun, R.; Davies, A.H. A systematic review on the use of deep venous stenting for acute venous thrombosis of the lower limb. Phlebology 2019, 34, 115–127. [Google Scholar] [CrossRef]
  3. Lopes Goularte, F.F.C.; Caroliny Torres, G.; Carvalho, R.D.P. Evaluation of deep vein thrombosis prophylaxis in a general hospital. J. Vasc. Bras. 2018, 17. [Google Scholar] [CrossRef] [Green Version]
  4. White, R.H. The epidemiology of venous thromboembolism. Circulation 2003, 107, I-4–I-8. [Google Scholar] [CrossRef] [PubMed] [Green Version]
  5. Clarke, M.J.; Broderick, C.; Hopewell, S.; Juszczak, E.; Eisinga, A. Compression stockings for preventing deep vein thrombosis in airline passengers. Cochrane Database Syst. Rev. 2016, 9. [Google Scholar] [CrossRef] [PubMed] [Green Version]
  6. Kean, J.; Pearton, A.; Fell, J.; Adams, M.; Kitic, C.; Wu, S.; Stone, S.; Zadow, E. Deep vein thrombosis in a well-trained masters cyclist, is popliteal vein entrapment syndrome to blame? J. Thromb. Thrombolysis 2019, 47, 301–304. [Google Scholar] [CrossRef] [PubMed]
  7. Abood, K.K.; Paul, M.R.; Kuo, D.J. Deep Vein Thrombosis in a Young, Healthy Baseball Catcher: A Case Report and Review of the Literature. J. Pediatr. Hematol. Oncol. 2019, 41, 321–323. [Google Scholar] [CrossRef] [PubMed]
  8. Lippi, G.; Mattiuzzi, C.; Franchini, M. Sleep apnea and venous thromboembolism, A systematic review. Thromb. Haemost. 2015, 114, 958–963. [Google Scholar] [CrossRef] [PubMed]
  9. Middeldorp, S.; Levi, M. Thrombophilia: An Update. Semin. Thromb. Hemost. 2007, 33, 563–572. [Google Scholar] [CrossRef]
  10. Chaudhuri, R.; Salari, R. Baker’s cyst simulating deep vein thrombosis. Clin. Radiol. 1990, 41, 400–404. [Google Scholar] [CrossRef]
  11. Gunderson, C.G.; Chang, J.J. Overuse of compression ultrasound for patients with lower extremity cellulitis. Thromb. Res. 2014, 134, 846–850. [Google Scholar] [CrossRef]
  12. Harder, E.M.; Desai, O.; Marshall, P.S. Clinical Probability Tools for Deep Venous Thrombosis, Pulmonary Embolism, and Bleeding. Clin. Chest Med. 2018, 39, 473–482. [Google Scholar] [CrossRef] [PubMed]
  13. Do, D.D.; Husmann, M. Diagnostik venöser Erkrankungen, (Diagnosis of Venous Disease). Herz Kardiovaskuläre Erkrank. 2007, 32, 10–17. [Google Scholar] [CrossRef] [Green Version]
  14. Kraaijpoel, N.; Carrier, M.; Le Gal, G.; McInnes, M.; Salameh, J.P.; McGrath, T.; Van Es, N.; Moher, D.; Büller, H.R.; Bossuyt, P.; et al. Diagnostic accuracy of three ultrasonography strategies for deep vein thrombosis of the lower extremity: A systematic review and meta-analysis. PLoS ONE 2020, 15, e0228788. [Google Scholar] [CrossRef] [PubMed]
  15. Lewiss, R.E.; Kaban, N.L.; Saul, T. Point-of-care ultrasound for a deep venous thrombosis. Glob. Heart 2013, 8, 329–333. [Google Scholar] [CrossRef] [PubMed] [Green Version]
  16. Fuentes Camps, E.; Luis Del Val García, J.; Bellmunt Montoya, S.; Hmimina Hmimina, S.; Gómez Jabalera, E.; Muñoz Pérez, M.Á. Cost-effectiveness of the deep vein thrombosis diagnosis process in primary care. Aten Primaria 2016, 48, 251–257. [Google Scholar] [CrossRef] [PubMed]
  17. Wilson, E.; Phair, J.; Carnevale, M.; Koleilat, I. Common Reasons for Malpractice Lawsuits Involving Pulmonary Embolism and Deep Vein Thrombosis. J. Surg. Res. 2020, 245, 212–216. [Google Scholar] [CrossRef] [Green Version]
  18. Modi, S.; Deisler, R.; Gozel, K.; Reicks, P.; Irwin, E.; Brunsvold, M.; Banton, K.; Beilman, G.J. Wells criteria for DVT is a reliable clinical tool to assess the risk of deep venous thrombosis in trauma patients. World J. Emerg. Surg. 2016, 11. [Google Scholar] [CrossRef] [Green Version]
  19. Oudega, R.; Moons, K.G.M.; Hoes, A.W. Ruling out deep venous thrombosis in primary care. A simple diagnostic algorithm including D-dimer testing. Thromb. Haemost. 2005, 94, 200–205. [Google Scholar] [CrossRef]
  20. Van der Hulle, T.; Dronkers, C.E.; Huisman, M.V.; Klok, F.A. Current standings in diagnostic management of acute venous thromboembolism: Still rough around the edges. Blood Rev. 2016, 30, 21–26. [Google Scholar] [CrossRef]
  21. Tan, J.H.; Fujita, H.; Sivaprasad, S.; Bhandary, S.V.; Rao, A.K.; Chua, K.C.; Acharya, U.R. Automated segmentation of exudates, haemorrhages, microaneurysms using single convolutional neural network. Inf. Sci. 2017, 420, 66–76. [Google Scholar] [CrossRef]
  22. Kadhim, M.A. ScienceDirect FNDSB: A fuzzy-neuro decision support system for back pain diagnosis. Cogn. Syst. Res. 2018, 52, 691–700. [Google Scholar] [CrossRef]
  23. Jabez Christopher, J.; Khanna Nehemiah, H.; Kannan, A. A clinical decision support system for diagnosis of Allergic Rhinitis based on intradermal skin tests. Comput. Biol. Med. 2015, 65, 76–84. [Google Scholar] [CrossRef]
  24. Simões, A.S.; Maia, M.R.; Gregório, J.; Couto, I.; Asfeldt, A.M.; Simonsen, G.S.; Póvoa, P.; Viveiros, M.; Lapão, L.V. Participatory implementation of an antibiotic stewardship programme supported by an innovative surveillance and clinical decision-support system. J. Hosp. Infect. 2018, 100, 257–264. [Google Scholar] [CrossRef]
  25. Hsu, W.Y. A decision-making mechanism for assessing risk factor significance in cardiovascular diseases. Decis. Support Syst. 2018, 115, 64–77. [Google Scholar] [CrossRef]
  26. However, B.; Bastani, K.; Raharjo, H.; Lifvergren, S.; Marsh, W.; Bergman, B. Decision support system for Warfarin therapy management using Bayesian networks. Decis. Support Syst. 2013, 55, 488–498. [Google Scholar] [CrossRef]
  27. Xiao, Y.; Wu, J.; Lin, Z.; Zhao, X. A deep learning-based multi-model ensemble method for cancer prediction. Comput. Methods Programs Biomed. 2018, 153, 1–9. [Google Scholar] [CrossRef]
  28. Cao, C.; Liu, F.; Tan, H.; Song, D.; Shu, W.; Li, W.; Zhou, Y.; Bo, X.; Xie, Z. Deep Learning and Its Applications in Biomedicine. Genom. Proteom. Bioinform. 2018, 16, 17–32. [Google Scholar] [CrossRef]
  29. Cruz-Vega, I.; Hernandez-Contreras, D.; Peregrina-Barreto, H.; Rangel-Magdaleno, J.; Ramirez-Cortes, J. Deep Learning Classification for Diabetic Foot Thermograms. Sensors 2020, 20, 1762. [Google Scholar] [CrossRef] [Green Version]
  30. Manogaran, G.; Mohamed Shakeel, P.; Hassanein, A.S.; Malarvizhi Kumar, P.; Chandra Babu, G. Machine Learning Approach-Based Gamma Distribution for Brain Tumor Detection and Data Sample Imbalance Analysis. IEEE Access 2019, 7, 12–19. [Google Scholar] [CrossRef]
  31. Stefan Jianu, S.R.; Ichim, L.; Popescu, D. Automatic Diagnosis of Skin Cancer Using Neural Networks. In Proceedings of the 2019 11th International Symposium on Advanced Topics in Electrical Engineering (ATEE), Bucharest, Romania, 28–30 March 2019; pp. 1–4. [Google Scholar] [CrossRef]
  32. Syed-Abdul, S.; Firdani, R.P.; Chung, H.J.; Uddin, M.; Hur, M.; Park, J.H.; Kim, H.W.; Gradišek, A.; Dovgan, E. Artificial Intelligence based Models for Screening of Hematologic Malignancies using Cell Population Data. Sci. Rep. 2020, 10, 4583. [Google Scholar] [CrossRef] [PubMed]
  33. Shen, J.; Chen, J.; Zheng, Z.; Zheng, J.; Liu, Z.; Song, J.; Wong, S.Y.; Wang, X.; Huang, M.; Fang, P.H.; et al. An Innovative Artificial Intelligence–Based App for the Diagnosis of Gestational Diabetes Mellitus (GDM-AI): Development Study. J. Med. Internet Res. 2020, 22, e21573. [Google Scholar] [CrossRef]
  34. Kumar Srivastava, A.; Kumar, Y.; Kumar Singh, P. Computer aided diagnostic system based on SVM and K harmonic mean based attribute weighting method. Obes. Med. 2020, 19, 100270. [Google Scholar] [CrossRef]
  35. Doma, V.; Pirouz, M.A. A comparative analysis of machine learning methods for emotion recognition using EEG and peripheral physiological signals. J. Big. Data 2020, 7. [Google Scholar] [CrossRef] [Green Version]
  36. Janghel, R.; Verma, A.; Rathore, Y. Performance Comparison of Machine Learning Techniques for Epilepsy Classification and Detection in EEG Signal. In Data Management, Analytics and Innovation. Advances in Intelligent Systems and Computing; Sharma, N., Chakrabarti, A., Eds.; Springer: Berlin/Heidelberg, Germany, 2020; Volume 1042. [Google Scholar] [CrossRef]
  37. Liu, Z.; Cao, Y.; Li, Y.; Xiao, X.; Qiu, Q.; Yang, M.; Zhao, Y.; Cui, L. Automatic diagnosis of fungal keratitis using data augmentation and image fusion with deep convolutional neural network. Comput. Methods Programs Biomed. 2020, 187, 105019. [Google Scholar] [CrossRef]
  38. Sun, H.; Zeng, X.; Xu, T.; Peng, G.; Ma, Y. Computer-Aided Diagnosis in Histopathological Images of the Endometrium Using a Convolutional Neural Network and Attention Mechanisms. IEEE J. Biomed. Health Inf. 2019. [Google Scholar] [CrossRef] [PubMed] [Green Version]
  39. Nafee, T.; Gibson, C.M.; Travis, R.; Yee, M.K.; Kerneis, M.; Chi, G.; AlKhalfan, F.; Hernandez, A.F.; Hull, R.D.; Cohen, A.T.; et al. Machine learning to predict venous thrombosis in acutely ill medical patients. Res. Pr. Thromb. Haemost. 2020, 4, 230–237. [Google Scholar] [CrossRef] [Green Version]
  40. Martins, T.; Annichino-Bizzacchi, J.; Romano, A.; Maciel Filho, R. Artificial neural networks for prediction of recurrent venous thromboembolism. Int. J. Med. Inf. 2020, 141, 104221. [Google Scholar] [CrossRef]
  41. Mishra, A.; Ashraf, M. Using Artificial Intelligence to Manage Thrombosis Research, Diagnosis, and Clinical Management. Semin. Thromb. Hemost. 2020, 46, 410–418. [Google Scholar] [CrossRef]
  42. Wang, X.; Yang, Y.Q.; Liu, S.H.; Hong, X.Y.; Sun, X.F.; Shi, J.H. Comparing different venous thromboembolism risk assessment machine learning models in Chinese patients. J. Eval. Clin. Pract. 2019, 21, 26–34. [Google Scholar] [CrossRef]
  43. Liu, S.; Zhang, F.; Xie, L.; Wang, Y.; Xiang, Q.; Yue, Z.; Feng, Y.; Yang, Y.; Li, J.; Luo, L.; et al. Machine learning approaches for risk assessment of peripherally inserted Central catheter-related vein thrombosis in hospitalized patients with cancer. Int. J. Med. Inf. 2019, 129, 175–183. [Google Scholar] [CrossRef] [PubMed]
  44. Mclnnes, G.; Daneshjou, R.; Katsonis, P.; Lichtarge, O.; Srinivasan, R.; Rana, S.; Radivojac, P.; Mooney, S.D.; Pagel, K.A.; Stamboulian, M.; et al. Predicting venous thromboembolism risk from exomes in the Critical Assessment of Genome Interpretation (CAGI) challenges. Hum. Mutat. Var. Inf. Dis. 2019, 40, 1314–1320. [Google Scholar] [CrossRef] [PubMed] [Green Version]
  45. Willan, J.; Katz, H.; Keeling, D. The use of artificial neural network analysis can improve the risk-stratification of patients presenting with suspected deep vein thrombosis. Br. J. Haematol. 2019, 185, 289–296. [Google Scholar] [CrossRef] [PubMed]
  46. Wells, P. Predictive analytics by deep machine learning: A call for next-gen tools to improve health care. Res. Pract. Thromb. Haemost. 2020, 4, 181–182. [Google Scholar] [CrossRef]
  47. Zhao, H.; Hua, Q.; Chen, H.B.; Ye, Y.; Wang, H.; Tan, S.X.D.; Tlelo-Cuautle, E. Thermal-Sensor-Based Occupancy Detection for Smart Buildings Using Machine-Learning Methods. ACM Trans. Des. Autom. Electron. Syst. 2018, 23. [Google Scholar] [CrossRef]
  48. Horng, M.F.; Kung, H.Y.; Chen, C.H.; Hwang, F.J. Deep Learning Applications with Practical Measured Results in Electronics Industries. Electronics 2020, 9, 501. [Google Scholar] [CrossRef] [Green Version]
  49. Tlelo-Cuautle, E.; De la Fraga, L.; Rangel-Magdaleno, J. Engineering Applications of FPGAs; Springer: Berlin/Heidelberg, Germany, 2016. [Google Scholar] [CrossRef]
  50. Al-Shayea, Q.K. Artificial Neural Networks in Medical Diagnosis. Int. J. Comput. Sci. Issues 2011, 8, 150–154. [Google Scholar]
  51. Shahid, N.; Rappon, T.; Berta, W. Applications of artificial neural networks in health care organizational decision-making. PLoS ONE 2019, 14, e0212356. [Google Scholar] [CrossRef]
  52. Choquenaira Florez, A.Y.; Scabora, L.; Amer-Yahia, S.; Rodrigues Júnior, J.F. Augmentation Techniques for Sequential Clinical Data to Improve Deep Learning Prediction Techniques. In Proceedings of the 2020 IEEE 33rd International Symposium on Computer-Based Medical Systems (CBMS), Rochester, MN, USA, 28–30 July 2020; pp. 597–602. [Google Scholar] [CrossRef]
  53. Qatawneh, Z.; Alshraideh, M.; Almasri, N.; Tahat, L.; Awidi, A. Clinical decision support system for venous thromboembolism risk classification. Appl. Comput. Inf. 2019, 15, 12–18. [Google Scholar] [CrossRef]
  54. Tu, J.V. Advantages and disadvantages of using artificial neural networks versus logistic regression for predicting medical outcomes. J. Clin. Epidemiol. 1996, 49, 1225–1231. [Google Scholar] [CrossRef]
  55. Zuluaga-Gomez, J.; Al Masry, Z.; Benaggoune, K.; Meraghni, S.; Zerhouni, N. A CNN-based methodology for breast cancer diagnosis using thermal images. Comput. Methods Biomech. Biomed. Eng. Imaging Vis. 2020. [Google Scholar] [CrossRef]
  56. De Souza, L.A.; Passos, L.A.; Mendel, R.; Ebigbo, A.; Probst, A.; Messmann, H.; Palm, C.; Papa, J.P. Assisting Barrett’s esophagus identification using endoscopic data augmentation based on Generative Adversarial Networks. Comput. Biol. Med. 2020, 126, 104029. [Google Scholar] [CrossRef] [PubMed]
  57. Gao, Z.; Li, J.; Guo, J.; Chen, Y.; Yi, Z.; Zhong, J. Diagnosis of Diabetic Retinopathy Using Deep Neural Networks. IEEE Access 2019, 7, 3360–3370. [Google Scholar] [CrossRef]
  58. Yoon, J.; Drumright, L.N.; Van der Schaar, M. Anonymization Through Data Synthesis Using Generative Adversarial Networks (ADS-GAN). IEEE J. Biomed. Health Inf. 2020, 24, 2378–2388. [Google Scholar] [CrossRef]
  59. Goncalves, A.; Ray, P.; Soper, B.; Stevens, J.; Coyle, L.; Sales, A.P. Generation and evaluation of synthetic patient data. BMC Med. Res. Methodol. 2020, 20, 108. [Google Scholar] [CrossRef]
  60. Wells, P.S.; Owen, C.; Doucette, S.; Fergusson, D.; Tran, H. Does this patient have deep vein thrombosis? JAMA 2006, 295, 199–207. [Google Scholar] [CrossRef]
  61. Yang, L.; Tao, L.; Chen, X.; Gu, X. Multi-scale semantic feature fusion and data augmentation for acoustic scene classification. Appl. Acoust. 2020, 163. [Google Scholar] [CrossRef]
  62. Hu, T.; Tang, T.; Lin, R.; Chen, M.; Han, S.; Wu, J. A simple data augmentation algorithm and a self-adaptive convolutional architecture for few-shot fault diagnosis under different working conditions. Measurement 2020, 156, 107539. [Google Scholar] [CrossRef]
  63. Gómez-Ríos, A.; Tabik, S.; Luengo, J.; Shihavuddin, A.S.; Krawczyk, B.; Herrera, F. Towards highly accurate coral texture images classification using deep convolutional neural networks and data augmentation. Expert Syst. Appl. 2019. [Google Scholar] [CrossRef] [Green Version]
  64. Cao, B.; Wang, N.; Li, J.; Gao, X. Data Augmentation-Based Joint Learning for Heterogeneous Face Recognition. IEEE Trans. Neural Netw. Learn. Syst. 2019, 30, 1731–1743. [Google Scholar] [CrossRef]
  65. Wells, P.S.; Anderson, D.R.; Bormanis, J.; Guy, F.; Mitchell, M.; Gray, L.; Clement, C.; Robinson, K.S.; Lewandowski, B. Value of assessment of pretest probability of deep-vein thrombosis in clinical management. Lancet 1997, 350, 1795–1798. [Google Scholar] [CrossRef]
  66. Hardy, T.J.; Bevis, P.M. Deep vein thrombosis. Vasc. Surg. 2019, 37, 67–72. [Google Scholar] [CrossRef]
  67. Bernardi, E.; Camporese, G. Diagnosis of deep-vein thrombosis. Thromb. Res. 2018, 163, 201–206. [Google Scholar] [CrossRef]
  68. Fox, J.C.; Bertoglio, K.C. Emergency Physician Performed Ultrasound for DVT Evaluation. Thrombosis 2011, 2011, 4. [Google Scholar] [CrossRef] [PubMed] [Green Version]
  69. Zubiate, P.; Urrutia, A.; Zamarreño, C.R.; Egea-Urra, J.; Fernández-Irigoyen, J.; Giannetti, A.; Baldini, F.; Díaz, S.; Matias, I.R.; Arregui, F.J.; et al. Fiber-based early diagnosis of venous thromboembolic disease by label-free D-dimer detection. Biosens. Bioelectron. X 2019, 2, 100026. [Google Scholar] [CrossRef]
  70. Sun, M.C.; Li, M.S. Intervention for Diagnosis of Deep Vein Thrombosis in Acute Stroke Patients: A Hospital-Based Study. PLoS ONE 2014, 9, e114094. [Google Scholar] [CrossRef]
  71. Pedraza García, J.; Valle Alonso, J.; Ceballos García, P.; Rico Rodríguez, F.; Aguayo López, M.Á.; Muñoz-Villanueva, M.D.C. Comparison of the Accuracy of Emergency Department-Performed Point-of- Care-Ultrasound (POCUS) in the Diagnosis of Lower-Extremity Deep Vein Thrombosis. J. Emerg. Med. 2018, 54, 656–664. [Google Scholar] [CrossRef]
  72. Garcia, R.; Labropoulos, N. Duplex Ultrasound for the Diagnosis of Acute and Chronic Venous Diseases. Surg. Clin. N. Am. 2018, 98, 201–218. [Google Scholar] [CrossRef]
  73. Jain, A.K.; Soult, M.C.; Resnick, S.A.; Desai, K.; Astleford, P.; Eskandari, M.K.; Rodriguez, H.E. Detecting iliac vein thrombosis with current protocols of lower extremity venous duplex ultrasound. J. Vasc. Surg. Venous Lymphat. Disord. 2018, 6, 724–729. [Google Scholar] [CrossRef]
  74. Segal, J.B.; Eng, J.; Tamariz, L.J.; Bass, E.B. Review of the evidence on diagnosis of deep venous thrombosis and pulmonary embolism. Ann. Fam. Med. 2007, 5, 63–73. [Google Scholar] [CrossRef] [Green Version]
  75. Landefeld, C. Noninvasive diagnosis of deep vein thrombosis. JAMA 2008, 300, 1696–1697. [Google Scholar] [CrossRef]
  76. Stevenson, J.G. The Development of Color Doppler Echocardiography: Innovation and Collaboration. J. Am. Soc. Echocardiogr. 2018, 31, 1344–1352. [Google Scholar] [CrossRef] [PubMed]
  77. Jain, A.K.; Mao, J.; Mohiuddin, K.M. Artificial neural networks: A tutorial. Computer 1996, 29, 31–44. [Google Scholar] [CrossRef] [Green Version]
  78. Pano-Azucena, A.; Tlelo-Cuautle, E.; Tan, S.D.; Ovilla-Martinez, B.; De la Fraga, L. FPGA-Based Implementation of a Multilayer Perceptron Suitable for Chaotic Time Series Prediction. Technologies 2018, 6, 90. [Google Scholar] [CrossRef] [Green Version]
  79. Masters, T. Practical Neural Networks Recipes in C++; Morgan Kaufmann: Bossdun, MA, USA, 1993; p. 493. [Google Scholar] [CrossRef]
  80. Aylward, S.; Anderson, R.A.Y. An algorithm for neural network architecture generation. In Proceedings of the 8th Computing in Aerospace Conference, Baltimore, MD, USA, 21–24 October 1991. [Google Scholar] [CrossRef]
  81. Yao, X. Evolving artificial neural networks. Proc. IEEE 1999, 87, 1423–1447. [Google Scholar] [CrossRef] [Green Version]
  82. Brush, J.; Sherbino, J.; Norman, G.R. How Expert Clinicians Intuitively Recognize a Medical Diagnosis. Am. J. Med. 2017, 130, 629–634. [Google Scholar] [CrossRef]
  83. Jung, Y. Multiple predicting K-fold cross-validation for model selection. J. Nonparametric Stat. 2018, 30, 197–215. [Google Scholar] [CrossRef]
  84. Rodríguez, J.D.; Pérez, A.; Lozano, J.A. Sensitivity Analysis of k-Fold Cross Validation in Prediction Error Estimation. IEEE Trans. Pattern Anal. Mach. Intell. 2010, 32, 569–575. [Google Scholar] [CrossRef] [PubMed]
  85. Sadrawi, M.; Sun, W.Z.; Ma, M.M.; Yeh, Y.T.; Abbod, M.; Shieh, J.S. Ensemble Genetic Fuzzy Neuro Model Applied for the Emergency Medical Service via Unbalanced Data Evaluation. Symmetry 2018, 10, 71. [Google Scholar] [CrossRef] [Green Version]
  86. Fu, G.H.; Xu, F.; Zhang, B.Y.; Yi, L.Z. Stable variable selection of class-imbalanced data with precision-recall criterion. Chemom. Intell. Lab. Syst. 2017, 171, 241–250. [Google Scholar] [CrossRef]
  87. Schrynemackers, M.; Küffner, R.; Geurts, P. On protocols and measures for the validation of supervised methods for the inference of biological networks. Front. Genet. 2013, 4, 262. [Google Scholar] [CrossRef] [PubMed] [Green Version]
  88. Liu, M.; Wang, M.; Wang, J.; Li, D. Comparison of random forest, support vector machine and back propagation neural network for electronic tongue data classification: Application to the recognition of orange beverage and Chinese vinegar. Sens. Actuators B Chem. 2013, 177. [Google Scholar] [CrossRef]
  89. Luo, J.; Yan, X.; Tian, Y. Unsupervised quadratic surface support vector machine with application to credit risk assessment. Eur. J. Oper. Res. 2020, 280, 1008–1017. [Google Scholar] [CrossRef]
  90. Barbon, A.P.A.C.; Barbon, S.J.; Mantovani Gomes, R.; Mayumi Fuzyi, E.; Manha Peres, L.; Bridi, A.M. Storage time prediction of pork by Computational Intelligence. Comput. Electron. Agric. 2016, 127, 368–375. [Google Scholar] [CrossRef]
  91. Cascarano, G.; Debitonto, F.; Lemma, R.; Brunetti, A.; Buongiorno, D.; De Feudis, I.; Guerriero, A.; Rossini, M.; Pesce, F.; Gesualdo, L.; et al. An Innovative Neural Network Framework for Glomerulus Classification Based on Morphological and Texture Features Evaluated in Histological Images of Kidney Biopsy; Lecture Notes in Computer Science (including subseries Lecture Notes in Artificial Intelligence and Lecture Notes in Bioinformatics); Springer: Cham, Switzerland, 2019; pp. 727–738. [Google Scholar] [CrossRef]
  92. Areiza-Laverde, H.; Castro-Ospina, A.; Peluffo-Ordóñez, D. Voice pathology detection using artificial neural networks and support vector machines powered by a multicriteria optimization algorithm. Commun. Comput. Inf. Sci. 2018, 915, 148–159. [Google Scholar] [CrossRef]
Figure 1. Protocol for the diagnosis of DVT, taken from [68].
Electronics 09 01810 g001
Figure 2. Structure of an artificial neuron, taken from [78].
Electronics 09 01810 g002
Figure 3. Architecture of the proposed back-propagation ANN model.
Electronics 09 01810 g003
Figure 4. Representation of the training dataset.
Electronics 09 01810 g004
Figure 5. Training performance of the proposed ANN model.
Electronics 09 01810 g005
Figure 6. 10-Fold Cross Validation scheme with 10,000 cases.
Electronics 09 01810 g006
Figure 7. Precision–Recall (PR) curve of the proposed ANN model.
Electronics 09 01810 g007
Figure 8. Comparison of the confusion matrices of the proposed ANN model.
Electronics 09 01810 g008
Figure 9. Comparison of the percentages of Precision, Sensitivity/Recall, and Accuracy obtained with the proposed ANN model.
Electronics 09 01810 g009
Figure 10. External validation of the proposed ANN model by using historical data from a Mexican hospital.
Electronics 09 01810 g010
Figure 11. Suggested use of the proposed CDSS in primary care modules.
Electronics 09 01810 g011
Table 1. Wells criteria for the prediction of deep vein thrombosis (DVT) [18,60,65].
Clinical FeatureScore
Active cancer (patient either receiving treatment for cancer within the1
previous 6 months or currently receiving palliative treatment)
Paralysis, paresis, or recent cast immobilization of the lower extremities1
Recently bedridden for ≥3 days, or major surgery within the previous1
12 weeks requiring general or regional anesthesia
Localised tenderness along the distribution of the deep venous system1
Entire leg swollen1
Calf swollen at least 3 cm larger than that on the asymptomatic side1
(measured 10 cm below tibial tuberosity)
Pitting edema confined to the symptomatic leg1
Collateral superficial veins (non-varicose)1
Previously documented deep vein thrombosis1
Alternative diagnosis at least as likely as deep vein thrombosis−2
In patients with symptoms in both legs, the more symptomatic leg is used
Table 2. Distribution of risk cases in a dataset of 10,000 synthetic cases.
Low RiskModerated RiskHigh Risk
DVT Diagnosis3052241373
Other578510961217
Table 3. Pre-processing of age factor.
Age [Years Old]Life StageNumerical Value
0–5Childhood1
6–12Middle childhood2
13–20Youth3
21–39Young adults4
40–49Average adults5
50–59Mature adults6
60–69Initial old age7
70–84Intermediate old8
85–120Advanced old age9
Table 4. Assignment by risk factor.
Clinical FeaturePresentAbsentCollected Data
Active cancer10Interview the patient
Paralysis, paresis, or recent cast immobilization of10Interview the patient
the lower extremities
Recently bedridden for ≥3 days, or major surgery10Interview the patient
within the previous 12 weeks requiring general or
regional anesthesia
Localised tenderness along the distribution of the10Interview the patient
deep venous system
Entire leg swollen10Interview the patient/Physical examination
Calf swollen at least 3 cm larger than that on the10Physical examination
asymptomatic side
Pitting edema confined to the symptomatic leg10Physical examination
Collateral superficial veins10Interview the paciente/Physical examination
Previously documented deep vein thrombosis10Interview the al paciente
Table 5. Proposed prediction model for DVT Diagnosis.
Input Layer with 11 PredictorsHidden LayerOutput Layer
Age, gender, cancer, immobilization, surgery,150-100-50DVT Diagnosis
tenderness, leg swollen, calf swollen, edema,
superficial veins, previous DVT
Table 6. Confusion matrix of two-class classification [85].
Predicted Diagnostic
True diagnosticPositive DVTNegative DVT
Positive DVTTrue
Positive
False
Negative
Negative DVTFalse
Positive
True
Negative
Table 7. 10-Fold Cross-validation of the proposed ANN model by using the proposed dataset.
TrueTrueFalseFalse Specificity Sensitivity Precision Accuracy
K-FoldPositive (TP)Negative (TN)Positive (FP)Negative (FN)[%](Recall) [%][%][%]
1136778266096.7769.3983.9591.40
2116801245997.0966.2982.8691.70
3150769374495.4177.3280.2191.90
4152761325595.9673.4382.6191.30
5122791157298.1462.8989.0591.30
6116790237197.1762.0383.4590.60
7112805196497.6963.6485.5091.70
8150763424594.7876.9278.1391.30
9116793256696.9463.7482.2790.90
10697614312794.6535.2061.6183.00
Avg.123.90781.2028.6066.3096.4665.0880.9690.51
Std. Dev.25.0416.929.5423.371.2011.977.402.67
Percentage [%]12.3978.122.866.63----
Table 8. Evaluation of the proposed ANN model without any input.
MissingTrueTrueFalseFalseMSEAccuracySensitivitySpecificityPrecision
Input FactorPositiveNegativePositiveNegativeMSE[%][%][%][%]
Age233861219525890.1184.5979.8886.5471.06
Gender111677793197860.9588.9558.6896.0677.77
Cancer123376993996690.0889.3264.8395.0775.55
Immobilization115976764227430.0988.3560.9494.7973.31
Surgery116076774217420.0988.3760.9994.8073.37
Pain116376694297390.0988.3261.1594.7073.05
Leg swelling64182301559740.0988.7139.6998.1580.53
Calf Swelling105377933058490.0888.4655.3696.2377.54
Edema118176294697210.0888.1062.0994.2171.58
Vericose veins119975635357030.0987.6263.0493.3969.15
Previous DVT125376524466490.0889.0565.8894.4973.75
Table 9. Comparison versus Wells’ criteria in a traditional way.
ApproachAccuracySensitivity/RecallSpecificity
Proposed approach for maximum Accuracy90.9968.3596.31
Proposed approach for maximizing the Recall84.9584.0185.17
Wells’ score in a traditional way [60]73.8283.9671.43
Table 10. Comparison of the proposed ANN model versus other M-L approaches.
TrueTrueFalseFalse Specificity Sensitivity Precision Accuracy
Machine-Learning ApproachPositive (TP)NegativePositiveNegative[%](Recall) [%][%][%]
Proposed ANN1300779929960296.3168.3581.3090.99
Related work
Linear SVM [35,36,88]08098019021000080.98
Quadratic SVM [35,36,88,89]6517553545125193.2734.2354.4382.04
Fine Gaussian SVM [36,88]5697526572133392.9429.9249.8780.95
Simple Tree [35,36]6857384724121791.0731.0148.6280.69
Complex Tree [35,36]7407361737116290.9038.9150.1081.01
Weigthed KNN [35,36,90]7107365733119290.9537.3349.2080.75
Fine KNN [35,36,90]80168741224110184.8942.1139.5676.75
Random Forest (RF) [32]1265765831676196.0462.4480.0189.23
Stochastic Gradient Descent (SGD) [32]11577453295109596.1951.3879.6886.10
eXtreme Gradient Boosting (XGBoost) [33]1250762531281396.0760.5980.0388.75
Gradient Boosting Decision Tree (GBDT) [33]1358758329476596.2763.9782.2089.41
Publisher’s Note: MDPI stays neutral with regard to jurisdictional claims in published maps and institutional affiliations.

