1. Introduction
1.1. General Context
Research and implementation of the DC networks have been increased considerably Track changes is off Everyone Track changes for everyone You Track changes for You Guests Track changes for guests Current file Overview 3 due to the advantages of DC networks when compared to AC networks in terms of reliability, efficiency, and simplicity of control [
1,
2,
3]. The distributed generators in DC networks are usually interconnected within the electrical system through electronics interfaces, which are intended to control the operation and condition of the generator. Those power electronics interfaces could use batteries to guarantee a given power flow from non-predictable renewable generators (e.g., photovoltaic and wind based) [
4,
5], or they could be controlled so that they dispatch the required power from predictable sources, such as fuel cells (by using a DC/DC converter) [
6] and diesel generators (by using a rectifier) [
7].
Moreover, DC networks exhibit a simpler process of analysis and operation, compared to AC networks, as the frequency and the reactive power are not present in the mathematical analysis [
8,
9]. In this sense, the problem of power flow on DC networks has been studied by using different numerical methods, such as Gauss–Jacobi, Gauss–Seidel and Newton–Raphson [
10], linear approximations [
11], semi-definite and second order cone programming formulations [
12,
13] as well as convex quadratic models [
14,
15].
1.2. Motivation
The optimal power flow analysis is one of the main tools used to determine the steady-state conditions of the electrical networks in the process of the analysis of electrical networks operated under the DC paradigm. In this context, the authors of [
16] proposed a hybrid methodology based on a Genetic Algorithm (GA) and the Gauss–Seidel method. Similarly, the authors of [
17] used a Particle Swarm Optimization (PSO) as the solution method, which considered the integration of Distributed Generators (DGs) and batteries. The solution proposed in that work is analyzed under different test cases; nevertheless, the processing times required in each case are not analyzed. With respect to the optimal integration of DGs in DC grids in [
18], the authors have proposed a methodology for integrating those DGs into DC grids, which used a heuristic approach to locate the generators and a mathematical method for determining the size of the photovoltaic generators. Such a solution considers the reduction of the installation and operation costs as its objective function, and this is optimized by using the linear programming tool linprog available for MATLAB [
19]. However, no comparison with other methods is provided, and the processing times are not analyzed. Similarly, in Reference [
20], the PSO has been used to calculate the optimal sizing and operation of DGs and batteries in DC grids. In this work, the objective function was the reduction of the investment cost and the operation cost of the energy resources by considering a unique nodal representation of the grid that does not consider the multiple buses and branches. In addition, the impact of the distributed energy resources (DERs) on the DC grid was analyzed without the use of the power flow methods or tools and the comparison with other methods reported in the literature.
Therefore, it is necessary to propose mathematical formulations that represent the problem associated with the integration of DGs in DC networks, while considering multiple buses, loads and DGs. Such a model can be used to develop optimization techniques that are able to identify the configuration of the generators with the best impact on the technical aspects of the network with short processing times, which enable them to guarantee the time restrictions of energy projects with short horizon time. In this sense, a correct selection of the method to be used for solving the power flow problem is critical. In particular, the processing time required by such a method is very important, since the power flow must be solved for each configuration evaluated by the optimization algorithm. Based on the state-of-the-art review in this paper, it is observed that the optimal integration of DGs in DC grids by using parallel processing tools have not been addressed; therefore, such a topic must be studied to ensure faster implementation.
1.3. Literature Review
The problems associated with the optimal location and sizing of DGs in DC networks have been few explored in the literature, as this topic has become increasingly relevant in the last decade due to the important developments in power electronic interfaces, energy storage systems and renewable generation [
10]. Some of the recent work related to this are summarized below: the authors of [
21] have proposed a mixed-integer quadratic programming (MIQP) model to address the problem of the optimal location and sizing of dispatchable DGs in DC grids where the proposed model is solved by using optimization solvers available in the general algebraic modeling system (GAMS) and the numerical results demonstrate the effectiveness and robustness of the exact mixed-integer non-linear programming (MINLP) model; however, the global optimal finding is not possible due to the non-convexity of the solution space. Exact mixed integer non-linear programming methods have been proposed in [
22,
23] to represent the problem of the integration of DGs in DC grids while taking into consideration the reduction of the power loss as the objective function. To solve that problem, a convex relaxation of the mathematical formulation is performed by using a Taylor’s series expansion to implement a transformation of variables. The main problem of that approach is the high possibility of converging into a local optima. This issue has been few explored even in DC networks the studied problem, but this is not the case of the conventional AC grids where this topic has been largely investigated, as seen in [
24,
25,
26,
27]. This implies that it is possible to evaluate some of the solutions applied in AC networks in the context of their application in DC networks. For example, in Reference [
28], the authors proposed a hybrid method for optimal integration of DGs in electrical systems based on a GA and the PSO has been proposed. In that study, the reduction of the active power loss was used as the objective function, thereby validating the proposed method in the test systems of 33 and 69 buses. In this paper, the authors do not compare the performance of the proposed method with other solutions reported in the literature, and the processing times associated with the optimization methods are not discussed. Similarly, in Reference [
29], a hybrid methodology that uses the sine cosine algorithm and chaos map theory has been proposed for solving the problem that is analyzed here. This methodology was validated by using the 33 and 69 bus test systems and by comparing the results obtained with other optimization techniques reported in the literature; however, the processing times were not discussed. Another approach has been reported in [
30] where a master-slave strategy has been implemented by using a modified version of the PSO to locate the DGs and the capacitors, and the Monte-Carlo algorithm has been used for defining the size of the generators. In that study, the main objectives used were to reduce the power loss and improve the voltage profiles, but the authors have not provided a comparison with other techniques or an analysis of the processing time.
Another approach for AC networks has been presented in [
31] where the main objective was the maximization of the energy cost associated with the generation of the distributed energy resources. In Reference [
32], a metaheuristic approach based on the population based incremental algorithm and the PSO has been proposed with the aim of locating DGs by using a parallel processing system to improve the calculation speed. In that study, the objective function is based on the active power loss, and the authors provide comparisons with other techniques only for the step of location by using the same sizing method for all the tests, which does not allow them to evaluate the effectiveness of the location methods in comparison with other sizing methods proposed in the literature. Finally, an example of a parallel processing system that can be applied to the problem of the integration of DGs in AC grids has been addressed in [
33]. That particular study uses a parallel version of the Monte-Carlo algorithm (PMC) by using the processing time as the performance indicator. However, a comparison with other methods is not provided in it. In conclusion, the previous references provide evidence on the effectiveness of the integration (location and sizing) of DGs in AC networks based on the reduction of power loss while also using the processing times as an efficiency indicator.
1.4. Contributions and Scope
This paper proposes a methodology for the optimal location and sizing of DGs in DC grids, which is performed under peak load conditions in order to determine the optimal process of the integration of the DGs, thereby enabling the reduction of the power loss associated with the transport of energy on the grid in the worst operation scenario. The aforementioned scenario was selected in this paper, as it is widely used in the literature for evaluating the proposed methodologies that attempt to solve the problem associated with the optimal integration of DGs in electrical systems [
28,
34,
35]. The solution proposed in this paper is based on a hybrid methodology between the PPBIL and the PSO algorithms that enables the improvement of the quality of the solution and the reduction of the processing time. The selection of the PBIL method for a parallel implementation is motivated by the low memory consumption and low computational complexity of that algorithm [
36]. Furthermore, the computational characteristics of the PBIL simplifies the process of performing the parallel implementation aimed at reducing the processing time. The PSO has been widely adopted in the literature to calculate the size of DGs in both AC and DC grids [
17,
28,
30], providing satisfactory results in terms of the solution quality and processing time. Therefore, based on the aforementioned results, the PSO was selected in this paper for calculating the size of the DGs. The main contributions of this work are summarized as follows:
The implementation of a mathematical formulation that considers the characteristics of DC grids, including the set of constraints associated with the representation of DC electrical networks with distributed generation, which is needed to perform an optimal integration of the distributed generators for the minimization of power loss.
A methodology for the optimal integration of DGs in DC grids that uses a parallel master-slave strategy to obtain the satisfactory results in terms of the quality of the solution and the processing time.
The adoption of parallel processing tools for the planning of DC grids in order to improve the performance of the methodologies for sizing and location.
The adoption of sequential programming in order to enable the use of free programming languages for the optimal sizing and location of DGs in DC grids and avoid the use of specialized and costly software.
It is worth mentioning that this hybrid solution has been previously proposed in [
32] in the context of AC distribution networks, but it has not been applied to DC systems. Furthermore, the work reported in [
32] has only evaluated the performance of the locating technique. Therefore, the PSO algorithm has not yet been demonstrated as the most suitable solution for the development of the hybrid methodology for DC networks. Instead, this study considers two additional location techniques and two additional sizing techniques, which were used for demonstrating the improvement created by the PPBIL–PSO in DC grids. The two additional location techniques are the GA [
28] and the PMC [
33] algorithms. The selection of those solution methods was based on the satisfactory results reported in the literature for the same problem [
34,
37,
38,
39]. The two additional sizing techniques are based on a continuous GA proposed in [
16], and the black-hole (BH) optimization method has been proposed in [
40]. As in the previous case, those methods were selected based on the satisfactory results reported in the literature.
The study described in this paper considers the combination of the three location techniques with the three sizing techniques, thereby obtaining nine hybrid solutions, one of them being the proposed PPBIL-PSO method. The evaluation of these solutions is performed in three test systems composed of 10, 21 and 69 nodes, respectively, while considering that a maximum of three DGs are to be located. The simulations were carried out in MATLAB by using the successive approximation method for evaluating the power flows inside the sizing methods [
14]. The results obtained demonstrated that the proposed mathematical formulation and the methodology of the solution were able to solve the problems concerning the optimal location and sizing of DGs in DC grids, as described in the previous paragraphs.
1.5. Organization of the Document
The remainder of this document is organized as presented below:
Section 2 shows the mathematical formulation used for the optimal integration of DGs in DC grids. Then,
Section 3 presents the master-slave strategy based on both the PPBIL and the PSO algorithms proposed in this paper. The test scenarios and considerations used are explained in
Section 4. Then
Section 5 presents the results of the simulations and its analysis. Finally, the conclusions and the possibilities of future research are described in
Section 6.
2. Mathematical Formulation
The problem of the optimal location and sizing of DGs in DC networks was formulated by means of an optimization problem mono objective where the objective function takes into consideration the reduction of the power loss in the whole system, and this is subject to a set of technical constraints associated with the DC networks in a distributed generation environment [
11]. The power loss is selected as the objective function, as this technical aspect is widely used in AC and DC networks and are associated with the same problem [
16,
17,
41,
42,
43].
The mathematical model that describes the problem of the integration of DGs in DC grids is formed by:
In such an objective function, represents the power loss related to the transport of energy by the branches where denotes the set of buses that form the system, is associated with the th component of the conductance matrix and corresponds to the conductance associated with the resistive load connected at bus i. Finally, and represent the voltages in the buses i and j, respectively.
The mathematical formulation defined from (1) to (8) considers the minimization of the objective function defined in (1), and therefore, the minimization of the total power loss of the DC grid. Equation (2) imposes the power balance at each bus where and denote the power generated and demanded at bus i, respectively. Equation (3) imposes the voltage bounds where and correspond to the maximum and the minimum limits for the bus voltages. Expression (4) shows the current bound of each branch installed on the DC system where is the current of the line within the set of branches that form the electrical network (), and is the maximum current allowed in that branch. The power limits to be injected by the DG connected at bus i are defined in (5) where denotes the set of buses selected for the installation of DGs. In this equation, represents a binary variable that takes a value of 1 when a distributed generator is installed at bus i, and it takes a value of 0 otherwise; the nature of is described in Equation (8). Finally, Equation (6) presents the maximum number of DGs that can be located on a DC grid (), while Equation (7) represents the maximum level of penetration () allowed into the electrical network.
Finally, this optimization problem is non-linear and non-convex, and therefore, this paper adopts a master-slave structure to decouple the problem of the location of DGs (discrete optimization) from the problem of the sizing of DGs (continuous optimization).
3. Proposed Hybrid Method
The integration of DGs in electrical grids is traditionally divided into two sub-problems [
28,
41,
42,
44]: the location of DGs on the electrical network and the calculation of the size of those generators. This paper adopts a master-slave structure to connect the proposed PPBIL and PSO techniques. The PPBIL is entrusted with solving the discrete optimization problem of locating the DGs, and the PSO algorithm is responsible for solving the continuous optimization problem of sizing the DGs.
3.1. Codification of the Solution
The codification scheme for the location and sizing problems is depicted in
Figure 1. The integration of the DGs is performed by using two vectors of
columns where each element of the vector corresponds to a particular bus of the electrical system while excluding the voltage controlled node, i.e., the slack bus.
represents the number of nodes present in the DC grid.
Figure 1a shows the binary codification for the location of the DGs in which it is assigned a value of 1 when a bus is a candidate for the locating of a generator and 0 is assigned in the opposite case. For example, the vector in
Figure 1a reports that buses 1, 3 and
were selected for locating DGs.
Figure 1b presents the continuous codification for the sizing of DGs, where each candidate bus has an assigned value of active power to be injected between
and
. The example given in
Figure 1b reports that buses 1, 3 and
will supply
,
and
p.u, respectively.
Finally, both vectors are used in the master and slave processes, which are described in the next subsections.
3.2. Master Stage: Optimal Location of DGs by Using PPBIL
In the master stage, the location of the generators is performed by using the PPBIL algorithm; this metaheuristic optimization algorithm is selected due to the satisfactory results provided by this in the case of AC networks [
32]. The PPBIL includes a modification of the iterative processing of the traditional PBIL [
45] in order to enable parallel processing, which reduces the computation time required by the algorithm.
The PBIL algorithm is an estimation of the distribution algorithm [
46], and it uses probabilistic methods to find a solution with a given value on the objective function. This algorithm has been widely used to solve combinatorial optimization problems [
47,
48], as is the case of the location of DGs. The main advantages of using the PBIL algorithm are the low memory consumption, low computational complexity and mainly, the capability of modifying the learning rate, which enables it to increase or decrease the exploration in the solution space in agreement with the application [
49]. The PPBIL is implemented by parallelly evaluating the objective function of all the individuals of the population [
32]. Similar approaches have been used in the literature in order to reduce the computation times of the optimization and simulation processes by taking advantage of the graphics processing units (GPU) or processors with parallel cores [
33,
50,
51].
Algorithm 1 describes the PPBIL algorithm. In the following section, each step of the algorithm is explained in detail.
| Algorithm 1: Pseudo-code proposed for the PPBIL algorithm |
 |
Step 1. Assign initial conditions:
In this step, four main parameters are selected to start the iterative process of the PBIL. First, the population size (
) is assigned to it. In order to ensure that the evaluation of the complete population is done in one cycle of the parallel units, the
selected is kept equal to the number of cores of the processor. The second parameter is the initial probability of each option in the probability matrix. For an adequate exploration of the solution space, the PBIL starts the iterative process with the same probability for all the possible options. The initial probability for this application is equal to
due to which each bus has two options: the option of locating (50%) or not locating (50%) a DG on the bus. The third parameter includes the type of learning rate (LR), for example, linear, exponential, sigmoidal or bell shaped. The LR bounds are within the range of 0 to 1 [
49]. In regard to the location of DGs, it was found in a heuristic form that the best type of LR is sigmoidal and the best values for the LR bounds are 0.25 and 0.50, respectively. The fourth parameter is the stopping criterion, which corresponds to the entropy tolerance, and it is selected as 0.1 in accordance with the work reported in [
32].
Step 2. Initialization of the probability matrix (PM):
The PM is formed by (
n) columns, which represent the elements to be considered while formulating the solution of the problem, and (
m) rows, which represent the possible solutions for each element. For the location of DGs,
n is equal to (
), thereby excluding the slack bus, and
since only two options are available for each node.
Figure 2 shows an example of the probability matrix.
At the start of the iterative process, all the components of the PM start with the same probability of
. Moreover, the PM must satisfy the constraint given in (9) where
represents the probability of the option
j to be selected on element
h. Such a restriction ensures that the accumulative probability of the options for a single element is 100%.
Step 3. Generate the population:
The population is generated by using the PM data. The objective is to create individuals by using the information of each option with each element of the PM to avoid identical individuals and guarantee an adequate exploration of the solution space. Therefore, when an individual is repeated, it is replaced by a randomly generated one.
Step 4. Evaluate the Fitness Function ():
The evaluation of the
of each individual is the step that takes up more time in the PBIL process. Therefore, the solution proposed in this work uses the parallel processing structure reported in [
32], which enables the evaluation of the
of all the individuals at the same time. If the population size is not equal to the number of cores in the processor (
W), the time required by the paralleling process (
) is equal to
where
is the maximum time required to evaluate the
of an individual and
returns the integer that is higher than or equal to a real number. In this paper, the evaluation of the
is performed in the slave stage, which optimizes the size of the distributed generators for each individual of the PPBIL population.
Step 5. Select the best individual:
The individual with the best
value is selected. In this case, the individual with the minimum power loss fulfills the set of constraints discussed in
Section 2.
Steps 6 and 7. Update the probability matrix and the learning rate:
The values of the probability matrix are updated by using Equation (10) where
is the non-updated probability of positions
and
is the updated probability.
Then, the index
k is assigned to the option with the highest fitness value of the element
j, and the update of the probability matrix is performed by using Equation (11); the probability of the option with the highest fitness value is increased while the probability of the other options (different to
k) are reduced. In such an equation,
denotes the actualized value of the probability at positions
. Finally, all the elements must satisfy the restriction (9) after updating the probability matrix.
Algorithm 1 reports that the learning rate must also be updated. The value of LR is updated by using Equation (12) where
and
are the bounds assigned in Step 1. Moreover,
is the entropy of the
in the first iteration of the algorithm
; therefore, the probability matrix exhibits a high dispersion of the data, as all the options have the same probability in each element [
45,
49].
Steps 8 and 9. Calculate the entropy and evaluate the stopping criteria:
The entropy
enables the quantification of the distribution of the probabilities of the solution. In that way, the probabilities in
are completely dispersed when
, and they converge into a single solution when
. However, a particular tolerance
is used as an approximation to
in order to allow converging into a solution in a finite time. Equation (13) describes the mathematical formulation of the entropy, which is calculated by adding all the probabilities in
and using the total number of elements
n to normalize the entropy into
. The stopping criterion for the PPBIL algorithm is
with
. The selection of the
value has been discussed in [
32].
Steps 10 and 11. Extract the best individual from the probability matrix and evaluate the :
When the PPBIL algorithm reaches the stopping criterion, the best solution is extracted from by selecting the options on each element with the highest probability. Finally, the of the best configuration is calculated, which enables the evaluation of the impact associated with the best solution on the DC network.
3.3. Slave Problem: Optimal Sizing of DGs by Using PSO
In the slave stage, the PSO is used to determine the size of the generators present in each individual generated by the master stage, and it is a bio-inspired algorithm that uses the flocking behavior of birds and fish swarms for solving continuous problems [
52]. This optimization algorithm was selected for solving the problem of the sizing of DGs in AC networks due to the satisfactory results reported in the literature [
28,
30,
44,
53]. In such a context, a detailed description of the PSO algorithm is given in [
52].
The processing procedure of the PSO is summarized in Algorithm 2: the initial conditions of the PSO correspond to the number of particles, the velocity limits, the inertia factor, the cognitive and social components and the stopping criterion. The stopping criteria used for this paper are associated with the maximum number of iterations and a number of iterations in which the
is not improved. In the first iteration, the particle swarm is generated by assigning the active power to be supplied by DGs as the coordinates of position. Therefore, the number of coordinates for each particle is equal to the number of generators to be installed. Subsequently, the power flow is solved and the
for each particle is evaluated. Then, such information is used to select the best solution for each particle and the best swarm solution, which corresponds to the solution for the sizing problem. In the subsequent iterations of the algorithm, the velocity vector is calculated in each iteration, which is used to update the position of the particles while also considering the last position, the inertia factor, the cognitive and social components as well as the previous best positions for each particle and the swarm. In the next step of the PSO, the
is evaluated for all the particles, thereby updating the position and the value of the best solution for each particle and for the swarm. Then, the stopping criteria are evaluated. Finally, the best solution reached by the PSO algorithm is sent back to the master stage.
| Algorithm 2: Pseudo-code for the PSO algorithm |
 |
Finally, the flowchart reported in
Figure 3 summarizes the master-slave method based on both the PPBIL and the PSO algorithms. The figure proves that parallel processing is used to evaluate the objective function of all the PPBIL individuals at the same time. This is performed by the PSO algorithm to obtain the optimal size of each generator in each configuration.
4. Test Scenarios and Considerations
4.1. Test Systems
In this manuscript, three different test systems are used for validating the hybrid method proposed for the optimal integration of DGs into DC grids.
The first two test systems are adapted from the 10 and 21 bus systems that are widely used in the literature to study DC networks [
2,
10,
11,
12]. The modifications made to those test systems include the replacement of the distributed generators and batteries by loads with the same power magnitude. Therefore, the resulting test systems are only formed by a main generator and electrical loads;
Figure 4 and
Figure 5 present the system architectures. The objective of the previous modifications is to increase the technical problems on the grids (increase power loss, reduce voltage profiles, etc.) and to eliminate the presence of distributed elements to provide a base case.
The DC version used in the third bus test system is an adaptation of the classical 69 bus test system, which is widely used in AC networks to evaluate the planning and operation strategies [
32,
54,
55,
56]. The modifications consist of eliminating the reactance associated with the branches and the reactive power generated and demanded in the electrical system, thereby obtaining a DC version of the system. This test system enables the testing of the proposed solution in a large DC network. Furthermore, the 69 bus test system was modified to increase the power loss and to reduce the voltage profiles. The main characteristics of the three test systems are presented in the following subsections.
4.1.1. 10 Bus Test System
This test system corresponds to the DC electrical network proposed in [
8]. It is composed of 10 buses and 9 branches, and the electrical configuration is illustrated in
Figure 4. The information about the branches, power supply and demand are shown in
Table 1. The system considers two types of loads: constant power loads (P) and resistive loads (R), which produce an initial power loss of 0.1436 p.u. for a total demand of 3.6 p.u. Moreover, the slack generator (Gen) is set with a voltage of 1.0 p.u [
11]. The voltage and power bases used in this system are 1 kV and 100 kW, respectively.
4.1.2. The 21 Bus Test System
The 21 bus test system presented in
Figure 5 is consists of 21 nodes and 20 lines, and it considers the constant power loads [
14]. Moreover, the generator is operated at a voltage of 1.0 p.u, the total power demanded is 5.54 p.u and the power loss is of 0.2760 p.u. In addition, the same bases used for the 10 bus test feeder are considered for this test system [
2]. Finally,
Table 2 shows the load, branches and bus data used for the 21 test system [
2].
4.1.3. 69 Bus Test System
The modification made to the classical 69 bus test system to obtain a DC version consists of eliminating the reactive component in both the branches and the power consumption for all the nodes. On the other hand, the system preserves the number of nodes and branches, the resistance values of branches and the power load and voltage level reported in [
57].
Figure 6 presents the line diagram of the grid.
The test system considers 12.66 kV and 100 kW voltage and power bases, respectively. Finally, the power loss was found to be 1.5385 p.u for a total power consumption of 38.8925 p.u.
4.2. General Considerations
The following considerations and conditions are imposed to provide a fair comparison between the different optimization solutions [
43]:
All nodes except the slack node are candidates for locating DGs.
It is considered that
, and therefore, a maximum of three generators can be installed. Such a limit is in agreement with the test scenarios adopted in the literature for the same problem [
32,
41,
55].
The maximum power level that can be supplied by each generator is 1.2 p.u for the 10 bus system, 1.5 p.u for the 21 bus system and 12 p.u for the 69 bus system. The minimum power level of each generator is 0 p.u. for all the cases [
15].
The current ratings of the DC lines for all the test systems were calculated by using a power flow analysis without taking the integration of DGs into consideration. The calibers and maximum current levels were defined based on those values of the branch currents and by using Table 310.16 of the National Electrical Code (NEC) for operation at ambient temperatures of 75 and 30 °C, respectively. For the 10 and 21 bus test systems, the caliber assigned was 900 kcmil with a current limit of 520 A (5.2 p.u. considering the base values of both voltage and power), while the caliber assigned for the 69 bus test system was 400 kcmil with a current limit of 335 A (42.11 p.u.). The high p.u. value for the current rating of the 69 bus is caused by the base value of the current (7.89 p.u.), which is obtained from the base values of both the voltage and the power. Finally, the test systems consider the installation of the same caliber for all the branches forming the electrical network.
In accordance with the recommendation given in [
58], all test systems were assigned a maximum distributed power penetration level equal to 40% of the total power supplied by the slack bus without considering the integration of DGs (base case). Such a constraint was considered in order to account for the restriction of the distributed generation present in some national electrical regulations; hence, the proposed mathematical formulation provides a general solution because such a limit could be set to zero when it is not needed. Moreover, this consideration enables the analysis of the impact of the penetration level of the DG on the electrical system.
4.3. Fitness Function
The metaheuristic techniques that are used to solve the constrained optimization problems can adopt a Fitness Function (
) in order to satisfy the set of constraints that represent the problem and explore outside of the feasible solution space [
16,
35] in search of good quality solutions. The
adopted in this paper is formed by the original value of the objective function and all the constraints introduced as penalties:
In the previous
, the constants
to
correspond to the penalization factors. In this study, all the penalization factors were set to 1000 by using trial and error in an attempt to force the optimization methods to satisfy all the constraints that compose the mathematical formulation defined in
Section 2. When all the constraints are fulfilled, the penalization factors must be nullified by the
and
functions. Therefore, the fitness function becomes
.
4.4. Comparison Methods and Parameters
Two additional binary optimization methods were used to locate the DGs in the master stage, which enabled the evaluation of the performance of the PPBIL solution. Those binary methods were the GA and the PMC. The GA is widely used in the literature to locate DGs in electrical grids [
28,
44,
59]. This technique uses the selection, recombination and mutation methods to find a combination of generators with lower power loss. The second binary method (PMC) implements a Monte-Carlo algorithm, which performs several random samples of the different possible locations for the DGs, simultaneously evaluating the
of all the configurations in order to detect the locations with lower power loss [
33]. The adoption of the PMC for evaluation purposes enabled the comparison of the proposed solution with another parallel processing method. The parameters of the PPBIL, GA and PMC methods used for the master stage are given in
Table 3. The size of the population for both the PPBIL and the PMC were equal to the number of workers available in the PC processor. Otherwise, the processing time was significantly increased since the entire population can not be evaluated at the same time. Instead, the size of the genetic algorithm population was defined by using trial and error and selecting the number of individuals that can provide the best balance between the power losses and the processing time. Finally, the other parameters of the binary methods were obtained by using a heuristic method in accordance with the methodology reported in Reference [
32].
For the evaluation of the slave stage as well, two additional optimization methods were considered. The first method is a continuous adaptation of the GA [
16], which uses the selection, recombination and mutation methods to obtain a continuous population that represents the sizes of the distributed generators located in the master stage. The second method is the BH, which is a nature-inspired optimization technique. The BH algorithm is based on the dynamical interaction between stars and black holes in the universe [
60]. This technique was used in [
61] to solve the problem of the sizing of DGs in DC grids by implementing a particle swarm and some application-based criteria for the elimination and generation of stars through a heuristic approach.
The parameters for each continuous method used in the tests are reported in
Table 4. For the proposed PSO, the parameters were found in a heuristic form in order to provide a satisfactory balance between the number of iterations, the size of the population and the total processing time required. This is important because the relation between the exploration vs. exploitation (i.e., exploration/exploitation) could be decreased dramatically and the real improvements in the objective function related to the minimization of power loss could be negligible [
32]. The stop criterion based on the 50 iterations without improvements corresponds to 25% of the total iterations, which was considered as an adequate criterion for finishing the exploitation process, as it allows the determination of whether the solution is a local or a global optimum. The selection of this percentage was made by using trial and error, which can take different values depending on the problem under analysis [
62,
63]. The parameters used for the CGA and the BH were taken from the values reported by the authors in the literature [
43] in order to solve the problem addressed here. These algorithms were implemented in MATLAB by using the power flow method for DC grids reported in [
14], which enabled the identification of the best size of the DGs.
In order to validate the proposed PPBIL–PSO method, the four additional algorithms were combined with both PPBIL and PSO algorithms to form eight additional techniques, which can be used to evaluate the performance of the proposed solution. The validation of the effectiveness and robustness of the hybrid methodologies was carried out by evaluating the same test cases with all optimization methods. The simulation results obtained are shown in
Table 5,
Table 6 and
Table 7, which report from left to right: the hybrid methodology, the location and size of the DGs, the mean power loss, the relative mean reduction of the power loss in relation with the base case, the mean square error of the voltage profile and its relative reduction in relation with the base case, the worst voltage profile and its location in the system, the maximum current on the branches and the averaged processing time. The average values were obtained from 1000 continuous executions for each solution method on each test scenario.
5. Simulation Results
To carry out the simulation, a Dell Precision T7600 Workstation with an Intel(R) Xeon(R) CPU ES-2670 at 2.50 GHz, 32 GB of RAM memory and 12 processing cores was used. The simulation results obtained from each test system are presented below:
5.1. 10 Bus Test System Results
Table 5 and
Figure 7 present the impact on the power losses and processing times of the different optimization methods in the case of the 10 bus test system. From
Figure 7a, it is observed that the proposed method provides the best solution with a reduction of 66.21% of the power loss, thereby exhibiting an additional average reduction of 1.68% over the other techniques. In contrast, the PMC-BH solution produces the minimum reduction of active power loss (60.47%), thereby exhibiting the worst performance. Moreover, from column 6 of
Table 5, it is observed that all hybrid solutions satisfy the maximum allowable current in the branches of this test system. If we observe the results obtained by the solution methods with respect to the objective function, we can appreciate that the methods that employ the PPBIL in the master stage achieve the best results in general terms, while the methods that use the PMC and the GA present similar results. This demonstrates the effectiveness of the solution methods in solving the problem addressed here based on the estimation of distribution algorithms in small electrical networks. Furthermore, the standard deviation (STD) of the mean power loss obtained by each hybrid solution is presented in
Figure 8 where the PPBIL/PSO presents the minimum STD (0.26%), which proves the precision and repeatability of the solution provided by this method. The PPBIL/GA method also provides a low STD (0.29%), while the other hybrid methods exhibit high STD values.
Figure 7b shows the processing time required by all optimization techniques, and the proposed solution exhibits the second lowest processing time, which is 33.71% longer than the time required by the faster PMC-BH solution. However, though the PMC-BH technique is faster, it produces the worst solution in terms of power loss. Finally, after excluding the PMC-BH method, the proposed PBIL-PSO method exhibits a processing time that 53.61% lower on average in comparison with the other optimization techniques. The processing times required by the different methods in the 10 bus test system show that the methods that work with the GA and CGA in the master and slave stages require long calculation times, which can be attributed to the evolution procedures used by the genetic algorithms when they explore the solution space.
Furthermore, in order to analyze the impact of each optimization technique on the voltage profile, the square voltage error (SVE) is calculated with respect to the voltage base (
) by using expression (15) [
28].
Figure 7c shows the reduction of the square error voltage profiles in percentage where the maximum reduction is obtained by the PPBIL-PSO (67.85%) and the minimum reduction is provided by the GA-BH (63.82%). Therefore, the proposed method provides a better voltage profile in comparison with both the base case and the other techniques. In this way,
Figure 7d depicts the worst voltage nodes given by each solution, which exhibit a deviation from the nominal voltage (1 p.u.) that is lower than 2%. Such a deviation according to the load and type of network is acceptable; hence, it guarantees a secure and reliable operation of the grid [
9,
32,
64,
65]. In any case, the best operation condition in terms of the voltage profiles is provided by the PPBIL-PSO, as the worst voltage node is closer to 1 p.u., in comparison with the other solutions. In contrast, the worst operation condition is provided by the PMC-BH technique.
5.2. 21 Bus Test System Results
The results obtained with the 21 bus system are presented in
Table 6 and illustrated in
Figure 9.
Figure 9a shows that the higher reduction in power loss is achieved once again by the PPBIL-PSO (78.37%), while and the lower impact is created by the PMC-BH (52.36%). In comparison with the other techniques, the proposed method provides an averaged reduction of 11.76% in the power loss. In this test system, the results obtained show that these methods help the PPBIL improve the impact on the objective function, while the other methods (PMC and GA) present a negative impact in general terms with respect to the results obtained in the 10 bus test system. This demonstrates that these methods can be stuck in local optimal solutions when the dimension of the solution space increases. In addition, we can observe a tendency to find solutions with bad quality when the BH is used in the master slave.
Figure 10 presents the STD of the power loss obtained in the case of the 21 bus test system. As in the previous case, the PPBIL/PSO method provides the lower STD value (1.42%), followed by the PPBIL/GA (2.38%), and the other methods exhibit higher STD values.
With respect to the processing time, the proposed method takes second place, requiring 39.58% more time than the PMC-BH method. In any case, the proposed PPBIL-PSO is 50.35% faster on average than the other seven solutions. When all the processing times presented in
Figure 9b are analyzed, we can appreciate that they increase with respect to the 10 bus test system, as these methods work with the GA and the CGA solution methodologies to exhibit the highest increment.
Figure 9c,d analyze the square error voltage profile where the PPBIL-PSO method provides the best performance with a reduction of 87.61% with respect to the base case, and with an average reduction of 13.80% in comparison with the other techniques. As in the previous case, the solution with the worst reduction in the square voltage error is the PMC-BH (51.22%). Then,
Figure 9d reports that the method with the best nodal voltage is the PPBIL-PSO (0.9760 p.u at bus 9), while the worst voltage is obtained by the PMC-BH (0.9383 p.u at bus 17). In addition, the figure also shows that all the methods provide an operation of around
of the nominal voltage, which ensures a safe grid operation [
9,
64]. Finally, column 6 of
Table 6 reports the maximum branch currents obtained by each solution method, which fulfill the maximum allowable current in the 21 bus test system.
5.3. 69 Bus Test System Results
The results obtained with the 69 bus system are reported in
Table 7 and
Figure 11.
Figure 11a shows the impact of the nine methods on the 69 bus system where the proposed PPBIL-PSO again provides a higher reduction in power loss with respect to the base case (90.99%) by providing an additional average reduction of 24.83% in power loss with respect to the other approaches. By analyzing the results obtained regarding the reduction of the total power loss, it can be stated that the methodologies based on the PPBIL and GA achieve good results, while the solution methods that use the PMC remain trapped in local optimal solutions; this situation can occur because this method is based in a random search and a stochastic procedure [
33]. In addition, we can appreciate that the effectiveness of the sizing methods are limited to the performance of the location method while addressing the problem of the optimal integration of DGs, which implies that it is vital to use an adequate relation between the master and slave stages. The aforementioned results prove that in the case of both small and large systems, the proposed method provides the best location and size for the DGs. The high difference between the worst and the best solution presented in
Figure 11a is due to the hybrid method based on the PMC/CGA, which becomes trapped in a local optimum; the same problem occurs when the PMC/CGA, GA/PSO, GA/CGA and GA/BH solution methods are used in the 69 bus test system. Therefore, those results show that the aforementioned methods are not adequate for solving the problem of optimal location and sizing of the distributed generation in large DC grids. This is also explained by
Figure 12, which demonstrates that the methods that use in the master stage that use the GA and the PMC converge to regular and bad solutions, respectively. However, the PMC/CGA method exhibits a high standard deviation of the power loss. All of these indicate that many of the 1000 executions of the aforementioned algorithms are trapped in different local optimums. To illustrate the repeatability and precision of the solution methods in the 69 bus test system,
Figure 12 presents the STD values of the power loss exhibited by these. This picture shows that the PBIL/PSO once again achieved the lowest STD value (5.25%), followed by the PPBIL/GA (5.37%) and PPBIL/BH (5.98%) methods, while the other ones exhibited higher STD values. Finally, based on the previous STD results, it can be concluded that the PBIL/PSO method provides the highest precision and repeatability of the solution independent of the size of the electrical network under study.
The effectiveness of the proposed method in terms of speed is shown in
Figure 11b, which reports that the PPBIL-PSO is in third position, while the method PPBIL-BH (39.79% faster) is faster and the PMC-BH (39.23% faster) is in the second position. Finally, PPBIL-PSO is 52.46% faster than the other six methods. In addition, this picture demonstrates that all methods increase the processing times in an exponential form, as they use the GA and CGA methods to present the highest increment when the size of the electrical network increases.
The impact of the nine methods on the voltage profiles is illustrated in both
Figure 11c,d. As in the previous cases, the proposed PPBIL-PSO provides the higher reduction in the square error voltages with a reduction of 91.91%. Moreover, the worst voltage profile provided by this method is 0.984 p.u at bus 64. Instead, the worst solution in terms of voltage profiles was obtained by the PMC-CGA with a reduction of 28.68% in the square error voltage, followed closely by the PMC-BH with a reduction of 34.27%. Both of these methods also provide the worst node voltages: 0.9333 p.u for PMC-CGA and 0.9339 p.u for PMC-BH. Finally, all the solution methods fulfill the maximum allowable current in the branches of the 69 bus test system, which is reported in column 6 of
Table 7.
Figure 13 shows the impact of the different hybrid methods used to find the optimal location and size of the DGs. Such a figure enables us to observe the trade-offs presented by all the hybrid methods in terms of power loss and processing time for any network size. The vertical axis presents the average value of power loss [%] with respect to the base cases for all test systems, while the horizontal axis shows the average processing time used by each method with respect to the GA/CGA in the form of percentage. This is the hybrid method that requires the longest processing time in all the test systems. This figure shows that the PMC/BH is the faster method with an average processing time of 9.08% but with the worst average power loss (55.64% of power loss in the systems without any DG). Similarly, the worst solution in terms of processing time is provided by the GA/CGA method, which has an average processing time of 791.73 s. The PPBIL/PSO is the second fastest method with an average value of 14.46%, but it obtained the best results in terms of power loss with an average value 21.50%. In this figure, the trade-off between power loss and processing time corresponds to the distance from the origin (0,0), which represents the ideal solution for the problem addressed in this study: the power loss and the processing time is equal to zero. The figure reports that the proposed PPBIL/PSO solution provides the best trade-off between power loss and speed, as it exhibits a shorter distance from the origin. The previous result demonstrated that the proposed solution provides the lowest power loss with an acceptable processing time.
6. Conclusions
In this paper, a hybrid method, formed with the PPBIL and the PSO algorithms was proposed for the optimal integration of DGs in DC grids. The method uses a mathematical formulation to analyze the impact of the distributed generation on the grid. In particular, the objective function is based on the reduction of the power loss while accounting for the set of restrictions required in this type of system. Finally, the performance of the proposed solution was contrasted with the eight other options, based on the optimization algorithms widely adopted in the literature.
The proposed PPBIL-PSO hybrid method provides the location and size of the DGs that produce the highest reduction in the power loss for small, medium and large DC grids. In terms of location, the GA provides similar results, but it requires a higher processing time. With respect to the sizing problem, the fastest method is the BH, but it provides solutions that are much less efficient, i.e., it leads to higher power loss than the PSO. Moreover, the processing time and power loss of all the methods were normalized for the three test cases, which demonstrated that the proposed PPBIL-PSO solution obtains the best trade-off between speed and power loss for any grid size. In addition, the PBIL/PSO exhibits the lower standard deviation for power loss in all the test scenarios; hence, the proposed PBIL/PSO provides the highest precision and repeatability for the solution when it is compared with the other hybrid approaches.
Future improvements to this study could consider the inclusion of renewable generation curves and hourly power demand into the mathematical model, which could provide a more accurate solution for a particular geographical region. Moreover, the solution can be further developed to integrate energy storage devices into the electrical network, which could be used for improving the electrical behavior and profitability of the grid. In addition, it is possible to propose an optimal tuning strategy for the parametrization of the continuous optimization techniques with the aim of balancing the exploration and exploitation of the solution space, which will enable the identification of the best compromise between the number of iterations and the population sizes.
Author Contributions
Conceptualisation, L.F.G.-N., O.D.M., C.A.R.-P., Q.H.-E., and A.-J.P.-M.; methodology, L.F.G.-N., O.D.M., C.A.R.-P., Q.H.-E., and A.-J.P.-M.; investigation, L.F.G.-N., O.D.M., C.A.R.-P., Q.H.-E., and A.-J.P.-M.; writing—review and editing, L.F.G.-N., O.D.M., C.A.R.-P., Q.H.-E., and A.-J.P.-M. All authors have read and agreed to the published version of the manuscript.
Funding
The development of this work was supported by the Instituto Tecnológico Metropolitano, Universidad Tecnologica de Bolívar, Universidad Nacional de Colombia and Minciencias (Fondo nacional de financiamiento para ciencia, la tecnología y la innovación Francisco José de Caldas) under the National Scholarship Program (call for applications 727-2015) and the projects P17211, PS2020002 and “Estrategia de transformación del sector energético Colombiano en el horizonte de 2030-Energética 2030”-“Generación distribuida de energía eléctrica en Colombia a partir de energía solar y eólica” (Code: 58838, Hermes: 38945).
Acknowledgments
The authors thank the Tecnológico Metropolitano, Universidad Tecnologica de Bolívar, Universidad Nacional de Colombia, Escuela Nacional de Estudios Superiores Juriquilla and University of Cordoba.
Conflicts of Interest
The authors declare no conflict of interest.
References
- Schonbergerschonberger, J.; Duke, R.; Round, S.D. DC-Bus Signaling: A Distributed Control Strategy for a Hybrid Renewable Nanogrid. IEEE Trans. Ind. Electron. 2006, 53, 1453–1460. [Google Scholar] [CrossRef]
- Montoya, O.D.; Gil-González, W.; Garces, A. Optimal power flow on DC microgrids: A quadratic convex Approximation. IEEE Trans. Circuits Syst. II Express Briefs 2018, 66, 1018–1022. [Google Scholar] [CrossRef]
- Gavriluta, C.; Candela, I.; Citro, C.; Luna, A.; Rodriguez, P. Design considerations for primary control in multi-terminal VSC-HVDC grids. Electr. Power Syst. Res. 2015, 122, 33–41. [Google Scholar] [CrossRef]
- Nordin, N.D.; Rahman, H.A. Comparison of optimum design, sizing, and economic analysis of standalone photovoltaic/battery without and with hydrogen production systems. Renew. Energy 2019, 141, 107–123. [Google Scholar] [CrossRef]
- Matayoshi, H.; Kinjo, M.; Rangarajan, S.S.; Ramanathan, G.G.; Hemeida, A.M.; Senjyu, T. Islanding operation scheme for DC microgrid utilizing pseudo Droop control of photovoltaic system. Energy Sustain. Dev. 2020, 55, 95–104. [Google Scholar] [CrossRef]
- Wu, Y.; Huangfu, Y.; Ma, R.; Ravey, A.; Chrenko, D. A strong robust DC-DC converter of all-digital high-order sliding mode control for fuel cell power applications. J. Power Sources 2019, 413, 222–232. [Google Scholar] [CrossRef]
- Haseltalab, A.; Botto, M.A.; Negenborn, R.R. Model Predictive DC Voltage Control for all-electric ships. Control Eng. Pract. 2019, 90, 133–147. [Google Scholar] [CrossRef]
- Garces, A. Uniqueness of the power flow solutions in low voltage direct current grids. Electr. Power Syst. Res. 2017, 151, 149–153. [Google Scholar] [CrossRef]
- Montoya, O.D. On Linear Analysis of the Power Flow Equations for DC and AC Grids with CPLs. IEEE Trans. Circuits Syst. II 2019, 66, 2032–2036. [Google Scholar] [CrossRef]
- Garcés, A. On the Convergence of Newton’s Method in Power Flow Studies for DC Microgrids. IEEE Trans. Power Syst. 2018, 33, 5770–5777. [Google Scholar] [CrossRef]
- Montoya, O.D.; Grisales-Noreña, L.F.; González-Montoya, D.; Ramos-Paja, C.; Garces, A. Linear power flow formulation for low-voltage DC power grids. Electr. Power Syst. Res. 2018, 163, 375–381. [Google Scholar] [CrossRef]
- Gil-González, W.; Montoya, O.D.; Holguín, E.; Garces, A.; Grisales-Noreña, L.F. Economic dispatch of energy storage systems in dc microgrids employing a semidefinite programming model. J. Energy Storage 2019, 21, 1–8. [Google Scholar] [CrossRef]
- Li, J.; Liu, F.; Wang, Z.; Low, S.H.; Mei, S. Optimal Power Flow in Stand-Alone DC Microgrids. IEEE Trans. Power Syst. 2018, 33, 5496–5506. [Google Scholar] [CrossRef]
- Montoya, O.D.; Garrido, V.M.; Gil-González, W.; Grisales-Noreña, L. Power Flow Analysis in DC Grids: Two Alternative Numerical Methods. IEEE Trans. Circuits Syst. II 2019, 66, 1865–1869. [Google Scholar] [CrossRef]
- Montoya, O.D.; Gil-González, W.; Garces, A. Sequential quadratic programming models for solving the OPF problem in DC grids. Electr. Power Syst. Res. 2019, 169, 18–23. [Google Scholar] [CrossRef]
- Montoya, O.D.; Grisales-nore, L.F. Optimal power dispatch of DGs in DC power grids: A hybrid Gauss-Seidel-Genetic-Algorithm methodology for solving the OPF problem. WSEAS Trans. Power Syst. 2018, 13, 335–346. [Google Scholar]
- Wang, P.; Zhang, L.; Xu, D. Optimal Sizing of Distributed Generations in DC Microgrids with Lifespan Estimated Model of Batteries. In Proceedings of the 2018 21st International Conference on Electrical Machines and Systems (ICEMS), Jeju, Korea, 7–10 October 2018; pp. 2045–2049. [Google Scholar] [CrossRef]
- Nasir, M.; Iqbal, S.; Khan, H.A. Optimal Planning and Design of Low-Voltage Low-Power Solar DC Microgrids. IEEE Trans. Power Syst. 2018, 33, 2919–2928. [Google Scholar] [CrossRef]
- Kirkegaard, P.; Grohnheit, P. LINPROG—A Linear Programming Solver. Mathematical Description and Model Applications; Forskningscenter Riso: Roskilde, Denmark, 1995. [Google Scholar]
- Wang, P.; Wang, W.; Xu, D. Optimal Sizing of Distributed Generations in DC Microgrids with Comprehensive Consideration of System Operation Modes and Operation Targets. IEEE Access 2018, 6, 31129–31140. [Google Scholar] [CrossRef]
- Montoya, O.D.; Gil-González, W. A MIQP Model for Optimal Location and Sizing of Dispatchable DGs in DC Networks. 2020. Available online: https://link.springer.com/article/10.1007%2Fs12667-020-00403-x (accessed on 30 August 2020).
- Montoya, O.D.; Gil-González, W.; Grisales-Noreña, L. Relaxed convex model for optimal location and sizing of DGs in DC grids using sequential quadratic programming and random hyperplane approaches. Int. J. Electr. Power Energy Syst. 2020, 115, 105442. [Google Scholar] [CrossRef]
- Montoya, O.D. A convex OPF approximation for selecting the best candidate nodes for optimal location of power sources on DC resistive networks. Eng. Sci. Technol. Int. J. 2020, 23, 527–533. [Google Scholar] [CrossRef]
- Sultana, S.; Roy, P.K. Krill herd algorithm for optimal location of distributed generator in radial distribution system. Appl. Soft Comput. 2016, 40, 391–404. [Google Scholar] [CrossRef]
- Kumar, B.V.; Srikanth, N. A hybrid approach for optimal location and capacity of UPFC to improve the dynamic stability of the power system. Appl. Soft Comput. 2017, 52, 974–986. [Google Scholar] [CrossRef]
- Teimourzadeh, H.; Mohammadi-Ivatloo, B. A three-dimensional group search optimization approach for simultaneous planning of distributed generation units and distribution network reconfiguration. Appl. Soft Comput. 2020, 88, 106012. [Google Scholar] [CrossRef]
- Awad, N.H.; Ali, M.Z.; Mallipeddi, R.; Suganthan, P.N. An efficient Differential Evolution algorithm for stochastic OPF based active–reactive power dispatch problem considering renewable generators. Appl. Soft Comput. 2019, 76, 445–458. [Google Scholar] [CrossRef]
- Moradi, M.; Abedini, M. A combination of genetic algorithm and particle swarm optimization for optimal DG location and sizing in distribution systems. Int. J. Electr. Power Energy Syst. 2012, 34, 66–74. [Google Scholar] [CrossRef]
- Selim, A.; Kamel, S.; Jurado, F. Efficient optimization technique for multiple DG allocation in distribution networks. Appl. Soft Comput. 2020, 86, 105938. [Google Scholar] [CrossRef]
- Jain, N.; Singh, S.; Srivastava, S. PSO based placement of multiple wind DGs and capacitors utilizing probabilistic load flow model. Swarm Evol. Comput. 2014, 19, 15–24. [Google Scholar] [CrossRef]
- Leonori, S.; Paschero, M.; Mascioli, F.M.F.; Rizzi, A. Optimization strategies for Microgrid energy management systems by Genetic Algorithms. Appl. Soft Comput. 2020, 86, 105903. [Google Scholar] [CrossRef]
- Grisales-Noreña, L.F.; Gonzalez Montoya, D.; Ramos-Paja, C.A. Optimal Sizing and Location of Distributed Generators Based on PBIL and PSO Techniques. Energies 2018, 11, 1018. [Google Scholar] [CrossRef]
- Martinez, J.A.; Guerra, G. A Parallel Monte Carlo Method for Optimum Allocation of Distributed Generation. IEEE Trans. Power Syst. 2014, 29, 2926–2933. [Google Scholar] [CrossRef]
- Abdelaziz, M.; Moradzadeh, M. Monte-Carlo simulation based multi-objective optimum allocation of renewable distributed generation using OpenCL. Electr. Power Syst. Res. 2019, 170, 81–91. [Google Scholar] [CrossRef]
- Doğanşahin, K.; Kekezoğlu, B.; Yumurtacı, R.; Erdinç, O.; Catalão, J.A.P.S. Maximum Permissible Integration Capacity of Renewable DG Units Based on System Loads. Energies 2018, 11, 255. [Google Scholar] [CrossRef]
- Rastegar, R. On the Optimal Convergence Probability of Univariate Estimation of Distribution Algorithms. Evol. Comput. 2011, 19, 225–248. [Google Scholar] [CrossRef] [PubMed]
- Rousis, A.O.; Konstantelos, I.; Strbac, G. A Planning Model for a Hybrid AC–DC Microgrid Using a Novel GA/AC OPF Algorithm. IEEE Trans. Power Syst. 2020, 35, 227–237. [Google Scholar] [CrossRef]
- Ganguly, S.; Samajpati, D. Distributed Generation Allocation on Radial Distribution Networks Under Uncertainties of Load and Generation Using Genetic Algorithm. IEEE Trans. Sustain. Energy 2015, 6, 688–697. [Google Scholar] [CrossRef]
- Zaroni, H.; Maciel, L.B.; Carvalho, D.B.; de O. Pamplona, E. Monte Carlo Simulation approach for economic risk analysis of an emergency energy generation system. Energy 2019, 172, 498–508. [Google Scholar] [CrossRef]
- Hasan, Z.; El-Hawary, M.E. Optimal Power Flow by Black Hole Optimization Algorithm. In Proceedings of the 2014 IEEE Electrical Power and Energy Conference, Calgary, AB, Canada, 12–14 November 2014; pp. 134–141. [Google Scholar] [CrossRef]
- Kowsalya, M. Optimal size and siting of multiple distributed generators in distribution system using bacterial foraging optimization. Swarm Evol. Comput. 2014, 15, 58–65. [Google Scholar]
- HA, M.P.; Huy, P.D.; Ramachandaramurthy, V.K. A review of the optimal allocation of distributed generation: Objectives, constraints, methods, and algorithms. Renew. Sustain. Energy Rev. 2017, 75, 293–312. [Google Scholar]
- Grisales-Noreña, L.F.; Garzon-Rivera, O.D.; Montoya, O.D.; Ramos-Paja, C.A. Hybrid Metaheuristic Optimization Methods for Optimal Location and Sizing DGs in DC Networks. In Workshop on Engineering Applications; Springer: Berlin/Heidelberg, Germany, 2019; pp. 214–225. [Google Scholar]
- Grisales, L.F.; Grajales, A.; Montoya, O.D.; Hincapié, R.A.; Granada, M. Optimal location and sizing of Distributed Generators using a hybrid methodology and considering different technologies. In Proceedings of the 2015 IEEE 6th Latin American Symposium on Circuits Systems (LASCAS), Montevideo, Uruguay, 24–27 February 2015; pp. 1–4. [Google Scholar] [CrossRef]
- Baluja, S. Population-Based Incremental Learning: A Method for Integrating Genetic Search Based Function Optimization and Competitive Learning; School of Computer Science, Carnegie Mellon University: Pittsburgh, PA, USA, 1994; pp. 1–41. [Google Scholar]
- Xu, Z.; Wang, Y.; Li, S.; Liu, Y.; Todo, Y.; Gao, S. Immune algorithm combined with estimation of distribution for traveling salesman problem. IEEJ Trans. Electr. Electron. Eng. 2016, 11, S142–S154. [Google Scholar] [CrossRef]
- Ceberio, J.; Irurozki, E.; Mendiburu, A.; Lozano, J.A. A review on estimation of distribution algorithms in permutation-based combinatorial optimization problems. Prog. Artif. Intell. 2012, 1, 103–117. [Google Scholar] [CrossRef]
- Larrañaga, P.; Karshenas, H.; Bielza, C.; Santana, R. A review on probabilistic graphical models in evolutionary computation. J. Heuristics 2012, 18, 795–819. [Google Scholar] [CrossRef]
- Bolanos, F.; Aedo, J.E.; Rivera, F. Comparison of Learning Rules for Adaptive Population-Based Incremental Learning Algorithms. Available online: http://worldcomp-proceedings.com/proc/p2012/ICA3716.pdf (accessed on 29 October 2020).
- Rinaldi, P.; Dari, E.; Vénere, M.; Clausse, A. A Lattice-Boltzmann solver for 3D fluid simulation on GPU. Simul. Model. Pract. Theory 2012, 25, 163–171. [Google Scholar] [CrossRef]
- Lukač, N.; Žalik, B. GPU-based roofs’ solar potential estimation using LiDAR data. Comput. Geosci. 2013, 52, 34–41. [Google Scholar] [CrossRef]
- Kennedy, J.; Eberhart, R. Particle swarm optimization. In Proceedings of the ICNN’95-International Conference on Neural Networks, Perth, WA, Australia, 27 November–1 December 1995; pp. 1942–1948. [Google Scholar] [CrossRef]
- Daud, S.; Kadir, A.; Gan, C.; Mohamed, A.; Khatib, T. A comparison of heuristic optimization techniques for optimal placement and sizing of photovoltaic based distributed generation in a distribution system. Sol. Energy 2016, 140, 219–226. [Google Scholar] [CrossRef]
- Acharya, N.; Mahat, P.; Mithulananthan, N. An analytical approach for DG allocation in primary distribution network. Int. J. Electr. Power Energy Syst. 2006, 28, 669–678. [Google Scholar] [CrossRef]
- Ali, E.; Elazim, S.A.; Abdelaziz, A. Ant Lion Optimization Algorithm for optimal location and sizing of renewable distributed generations. Renew. Energy 2017, 101, 1311–1324. [Google Scholar] [CrossRef]
- Saha, S.; Mukherjee, V. Optimal placement and sizing of DGs in RDS using chaos embedded SOS algorithm. IET Gener. Transm. Distrib. 2016, 10, 3671–3680. [Google Scholar] [CrossRef]
- Kumawat, M.; Gupta, N.; Jain, N.; Bansal, R. Optimal planning of distributed energy resources in harmonics polluted distribution system. Swarm Evol. Comput. 2018, 39, 99–113. [Google Scholar] [CrossRef]
- Grisales, L.F.; Montoya, O.D.; Grajales, A.; Hincapie, R.A.; Granada, M. Optimal Planning and Operation of Distribution Systems Considering Distributed Energy Resources and Automatic Reclosers. IEEE Lat. Am. Trans. 2018, 16, 126–134. [Google Scholar] [CrossRef]
- Georgilakis, P.S.; Hatziargyriou, N.D. Optimal Distributed Generation Placement in Power Distribution Networks: Models, Methods, and Future Research. IEEE Trans. Power Syst. 2013, 28, 3420–3428. [Google Scholar] [CrossRef]
- Bouchekara, H. Optimal power flow using black-hole-based optimization approach. Appl. Soft Comput. 2014, 24, 879–888. [Google Scholar] [CrossRef]
- Velasquez, O.; Giraldo, O.M.; Arevalo, V.G.; Norena, L.G. Optimal Power Flow in Direct-Current Power Grids via Black Hole Optimization. Adv. Electr. Electron. Eng. 2019, 17, 24–32. [Google Scholar] [CrossRef]
- Dogan, B.; Olmez, T. Vortex search algorithm for the analog active filter component selection problem. AEU-Int. J. Electron. Commun. 2015, 69, 1243–1253. [Google Scholar] [CrossRef]
- Li, Z.; Cao, Y.; Dai, L.V.; Yang, X.; Nguyen, T.T. Optimal Power Flow for Transmission Power Networks Using a Novel Metaheuristic Algorithm. Energies 2019, 12, 4310. [Google Scholar] [CrossRef]
- Nordman, B.; Christensen, K. DC Local Power Distribution: Technology, Deployment, and Pathways to Success. IEEE Electrif. Mag. 2016, 4, 29–36. [Google Scholar] [CrossRef]
- Naik, S.G.; Khatod, D.; Sharma, M. Optimal allocation of combined DG and capacitor for real power loss minimization in distribution networks. Int. J. Electr. Power Energy Syst. 2013, 53, 967–973. [Google Scholar] [CrossRef]
Figure 1.
Codification strategy for the location and sizing of distributed generators (DGs) in direct current (DC) networks.
Figure 1.
Codification strategy for the location and sizing of distributed generators (DGs) in direct current (DC) networks.
Figure 2.
Structure of the probability matrix (PM).
Figure 2.
Structure of the probability matrix (PM).
Figure 3.
Proposed method based on the Population-Based Incremental Learning (PPBIL) and the Particle Swarm Optimization (PSO) algorithms.
Figure 3.
Proposed method based on the Population-Based Incremental Learning (PPBIL) and the Particle Swarm Optimization (PSO) algorithms.
Figure 4.
Electrical configuration for the 10-bus test feeder [
11].
Figure 4.
Electrical configuration for the 10-bus test feeder [
11].
Figure 5.
Line diagram of the 21 bus test system.
Figure 5.
Line diagram of the 21 bus test system.
Figure 6.
Line diagram the 69 bus test system.
Figure 6.
Line diagram the 69 bus test system.
Figure 7.
Results obtained with the 10 bus test system. (a) Reduction of power losses (%); (b) Processing Time (s); (c) Reduction of square error voltage (%); (d) Worst Voltage profile (p.u).
Figure 7.
Results obtained with the 10 bus test system. (a) Reduction of power losses (%); (b) Processing Time (s); (c) Reduction of square error voltage (%); (d) Worst Voltage profile (p.u).
Figure 8.
Mean standard deviation of the power loss for the 10 bus test system.
Figure 8.
Mean standard deviation of the power loss for the 10 bus test system.
Figure 9.
Results obtained with the 21 bus test system. (a) Reduction of power losses (%); (b) Processing Time (s); (c) Reduction of square error voltage (%); (d) Worst Voltage profile (p.u).
Figure 9.
Results obtained with the 21 bus test system. (a) Reduction of power losses (%); (b) Processing Time (s); (c) Reduction of square error voltage (%); (d) Worst Voltage profile (p.u).
Figure 10.
Mean standard deviation of the power loss for the 21 bus test system.
Figure 10.
Mean standard deviation of the power loss for the 21 bus test system.
Figure 11.
Results obtained with the 69 bus test system. (a) Reduction of power losses (%); (b) Processing Time (s); (c) Reduction of square error voltage (%); (d) Worst Voltage profile (p.u).
Figure 11.
Results obtained with the 69 bus test system. (a) Reduction of power losses (%); (b) Processing Time (s); (c) Reduction of square error voltage (%); (d) Worst Voltage profile (p.u).
Figure 12.
Mean standard deviation of the power loss for the 69 bus test system.
Figure 12.
Mean standard deviation of the power loss for the 69 bus test system.
Figure 13.
Impact of the hybrid methods in all test systems.
Figure 13.
Impact of the hybrid methods in all test systems.
Table 1.
Electrical parameters of the 10 bus test system.
Table 1.
Electrical parameters of the 10 bus test system.
| From | To | R (pu) | Type of Node | P (pu) − R (pu) |
|---|
| 1 (slack) | 2 | 0.0050 | Step-node | - |
| 2 | 3 | 0.0015 | P | −0.8 |
| 2 | 4 | 0.0020 | P | −1.3 |
| 4 | 5 | 0.0018 | P | −0.5 |
| 2 | 6 | 0.0023 | R | 2.0 |
| 6 | 7 | 0.0017 | Step-node | 0 |
| 7 | 8 | 0.0021 | P | −0.3 |
| 7 | 9 | 0.0013 | P | −0.7 |
| 3 | 10 | 0.0015 | R | 1.25 |
Table 2.
Electrical parameters of the 21 bus test system.
Table 2.
Electrical parameters of the 21 bus test system.
| From | To | R (pu) | P (pu) | From | To | R (pu) | P (pu) |
|---|
| 1(slack) | 2 | 0.0053 | −0.70 | 11 | 12 | 0.0079 | −0.68 |
| 1 | 3 | 0.0054 | 0.00 | 11 | 13 | 0.0078 | −0.10 |
| 3 | 4 | 0.0054 | −0.36 | 10 | 14 | 0.0083 | 0.00 |
| 4 | 5 | 0.0063 | −0.04 | 14 | 15 | 0.0065 | −0.22 |
| 4 | 6 | 0.0051 | −0.36 | 15 | 16 | 0.0064 | −0.23 |
| 3 | 7 | 0.0037 | 0.00 | 16 | 17 | 0.0074 | −0.43 |
| 7 | 8 | 0.0079 | −0.32 | 16 | 18 | 0.0081 | −0.34 |
| 7 | 9 | 0.0072 | −0.80 | 14 | 19 | 0.0078 | −0.09 |
| 3 | 10 | 0.0053 | 0.00 | 19 | 20 | 0.0084 | −0.21 |
| 10 | 11 | 0.0038 | −0.45 | 19 | 21 | 0.0082 | −0.21 |
Table 3.
Parameters of the location techniques [
32].
Table 3.
Parameters of the location techniques [
32].
| Method | GA | PMC | PPBIL |
|---|
| Population size | 12 | 12 | 12 |
| Selection method | Tournament | Repeated
random
sampling | Initial
probability:
0.5 |
| Learning rate | Cross over:
simple | - - - | Sigmoidal
LRmin: 0.25
LRmax: 0.50 |
| Mutation | Binary
simple | - - - | Random
population |
| Stopping criterion | Maximum
generational
cycles: 40 | Maximum
iterations: 10 | Entropy: 0.1 |
Table 4.
Parameters of the sizing techniques.
Table 4.
Parameters of the sizing techniques.
| Method | CGA | BH | PSO |
|---|
| Number of particles | 30 | 30 | 30 |
| Selection method | Tournament | Event
horizon radius | Cognitive and
social component: 1.4 |
| Update population method | Cross over:
promedium | Cognitive and
social component | Speed
(max–min): (0.1–0.1)
Inertia
(max–min): (0.7–0.001) |
| Mutation | Random
population | Random
population | R1 = R2:
Random |
| Stopping criterion | Maximum
iterations: 200
Iteration without
improving: 50 | Maximum
iterations: 200
Iteration without
improving: 50 | Maximum
iterations: 200
Iteration without
improving: 50 |
Table 5.
Results of the 10 bus test system.
Table 5.
Results of the 10 bus test system.
Method:
Location/
Sizing | DG
Location/
Size (kW) | (kW)/
%
Reduction | (p.u)/
%
Reduction | Worst Voltage
Profile
(p.u)/ Bus | Maximum
Current
(p.u) | Time
(s) |
|---|
Without
DGs | - - - | 14.3628 | 0.0075 | 0.9690/
9 | 5.2 | - - - |
PPBIL/
PSO | 5/67.12
9/82.51
10/49.10 | 4.8526/
66.21 | 0.0024/
67.85 | 0.9829/
8 | 2.91 | 38.30 |
PPBIL/
CGA | 5/88.90
9/74.85
10/34.95 | 4.8777/
66.03 | 0.0024/
67.59 | 0.9826/
8 | 2.91 | 91.07 |
PPBIL/
BH | 4/85.84
5/59.24
9/48.38 | 5.2283/
63.59 | 0.0026/
64.54 | 0.9812/
8 | 2.97 | 85.35 |
PMC/
PSO | 3/66.56
5/63.53
7/68.73 | 5.0169/
65.06 | 0.0025/
66.25 | 0.9820/
9 | 2.91 | 45.79 |
PMC/
CGA | 4/79.85
9/79.18
10/39.75 | 4.8899/
65.95 | 0.0024/
67.11 | 0.9824/
5 | 2.91 | 111.37 |
PMC/
BH | 2/63.56
4/29.79
8/99.17 | 5.6770/
60.47 | 0.0025/
65.61 | 0.9810/
5 | 2.98 | 25.38 |
GA/
PSO | 4/75.42
9/71.95
10/51.45 | 4.8869/
65.97 | 0.0024/
66.75 | 0.9823/
5 | 2.91 | 108.93 |
GA/
CGA | 4/67.68
9/84.71
10/46.18 | 4.9024/
65.86 | 0.0024/
67.35 | 0.9821/
5 | 4.97 | 228.25 |
GA/
BH | 5/86.42
6/65.21
9/33.90 | 5.5162/
61.59 | 0.0027/
63.82 | 0.9811/
10 | 1.59 | 56.47 |
Table 6.
Results of the 21 bus test system.
Table 6.
Results of the 21 bus test system.
Method:
Location/
Sizing | DG
Location/
Size (kW) | (kW)/
%
Reduction | (p.u)/
%
Reduction | Worst Voltage
Profile
(p.u)/ Bus | Maximum
Current
(p.u) | Time
(s) |
|---|
Without
DGs | - - - | 27.6034 | 0.0567 | 0.9211/
17 | 5.2 | - - - |
PPBIL/
PSO | 12/73.79
16/118.34
20/40.50 | 5.9697/
78.37 | 0.0070/
87.61 | 0.9759/
9 | 2.57 | 68.74 |
PPBIL/
CGA | 12/81.11
16/110.27
21/40.46 | 6.0040/
78.24 | 0.0073/
86.95 | 0.9759/
9 | 2.57 | 176.93 |
PPBIL/
BH | 12/86.84
16/91.90
19/50.46 | 6.1891/
77.57 | 0.0082/
85.49 | 0.9738/
17 | 2.6 | 85.66 |
PMC/
PSO | 8/32.38
14/111.37
17/88.88 | 7.2063/
73.89 | 0.0081/
85.65 | 0.9704/
12 | 2.58 | 74.99 |
PMC/
CGA | 7/52.63
11/147.70
13/32.09 | 11.5531/
58.14 | 0.0209/
63.13 | 0.9456/
17 | 2.62 | 210.30 |
PMC/
BH | 4/19.28
9/118.47
12/76.08 | 13.1477/
52.39 | 0.0276/
51.22 | 0.9386/
17 | 2.83 | 41.53 |
GA/
PSO | 3/31.61
8/55.46
17/145.56 | 8.6873/
68.52 | 0.0103/
81.82 | 0.9673/
12 | 2.59 | 238.74 |
GA/
CGA | 9/59.30
11/134.55
13/38.77 | 11.1495/
59.60 | 0.0209/
62.97 | 0.9452/
17 | 2.62 | 535.23 |
GA/
BH | 12/25.62
14/78.41
18/64.83 | 9.7973/
64.50 | 0.0151/
73.21 | 0.9633/
17 | 3.24 | 110.06 |
Table 7.
Results of the 69 bus test system.
Table 7.
Results of the 69 bus test system.
Method:
Location/
Sizing | DG
Location/
Size (kW) | (kW)/
%
Reduction | (p.u)/
%
Reduction | Worst Voltage
Profile
(p.u)/ Bus | Maximum
Current
(p.u) | Time
(s) |
|---|
Without
DGs | - - - | 153.8476 | 0.0769 | 0.9274/
69 | 42.11 | - - - |
PPBIL/
PSO | 23/169.58
61/1200
67/247.65 | 13.8469/
90.99 | 0.0062/
91.91 | 0.9848/
64 | 22.85 | 222.17 |
PPBIL/
CGA | 27/148.99
62/1167.96
65/294.86 | 14.8686/
90.33 | 0.0062/
91.84 | 0.9843/
21 | 22.92 | 542.57 |
PPBIL/
BH | 60/448.52
62/395.63
65/296.11 | 36.1161/
76.52 | 0.0185/
75.88 | 0.9719/
64 | 27.85 | 133.77 |
PMC/
PSO | 10/417.23
32/
63/1200 | 23.9597/
84.42 | 0.0117/
84.74 | 0.9764/
69 | 22.95 | 225.80 |
PMC/
CGA | 14/942.14
37/222.53
46/157.29 | 126.45/
17.80 | 0.0505/
34.27 | 0.9333/
69 | 27.07 | 675.88 |
PMC/
BH | 2/189.23
10/1042.66
33/51.06 | 122.71/
20.23 | 0.0548/
28.68 | 0.9339/
69 | 29.18 | 135.00 |
GA/
PSO | 14/179.33
58/237.90
62/1200 | 17.4946/
88.62 | 0.0084/
89.04 | 0.9804/
69 | 22.89 | 839.67 |
GA/
CGA | 59/446.07
63/1170.76 | 19.0251/
87.63 | 0.0090/
88.25 | 0.9779/
27 | 22.91 | 1611.72 |
GA/
BH | 8/60.85
14/406.04
67/673.68 | 55.8518/
63.69 | 0.0210/
72.65 | 0.9596/
61 | 28.04 | 305.31 |
| Publisher’s Note: MDPI stays neutral with regard to jurisdictional claims in published maps and institutional affiliations. |
© 2020 by the authors. Licensee MDPI, Basel, Switzerland. This article is an open access article distributed under the terms and conditions of the Creative Commons Attribution (CC BY) license (http://creativecommons.org/licenses/by/4.0/).

 ,
, 


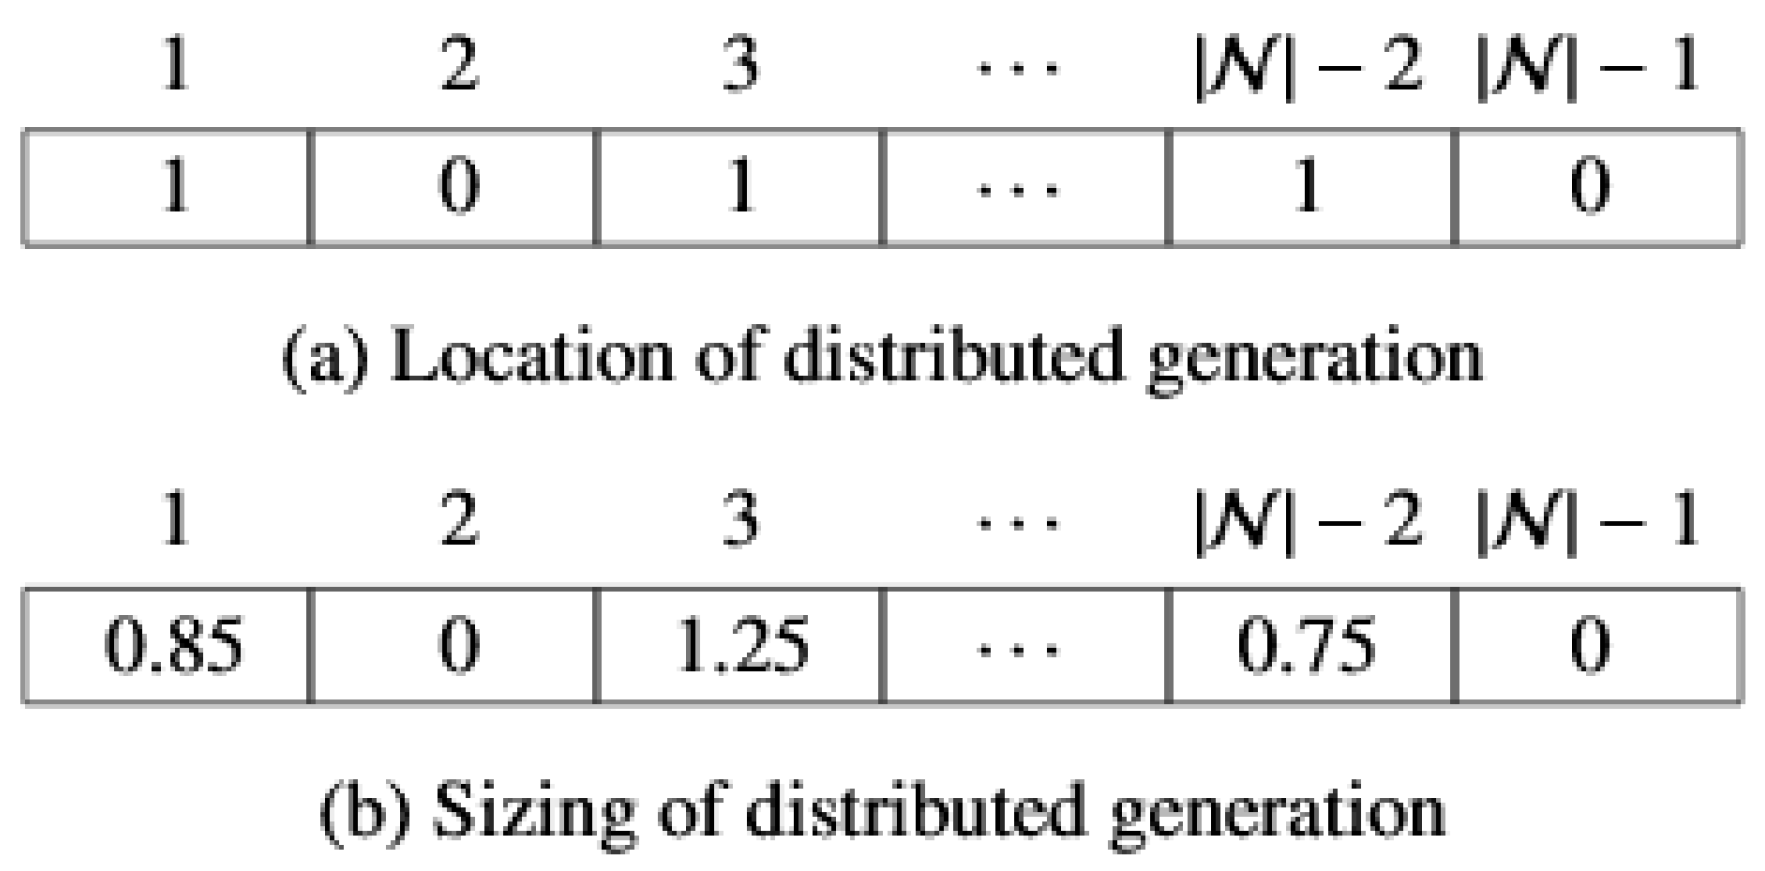
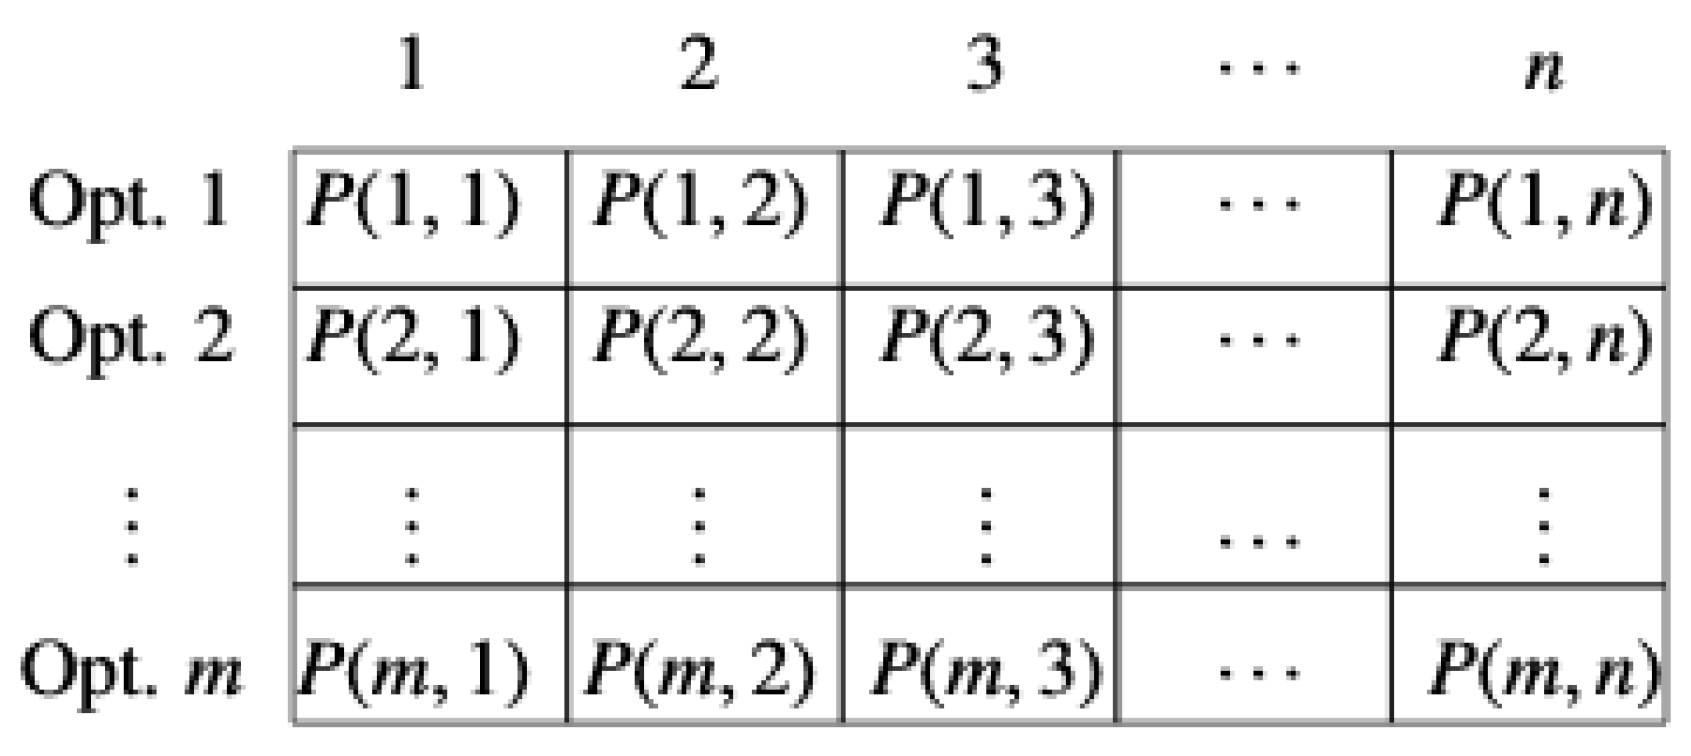
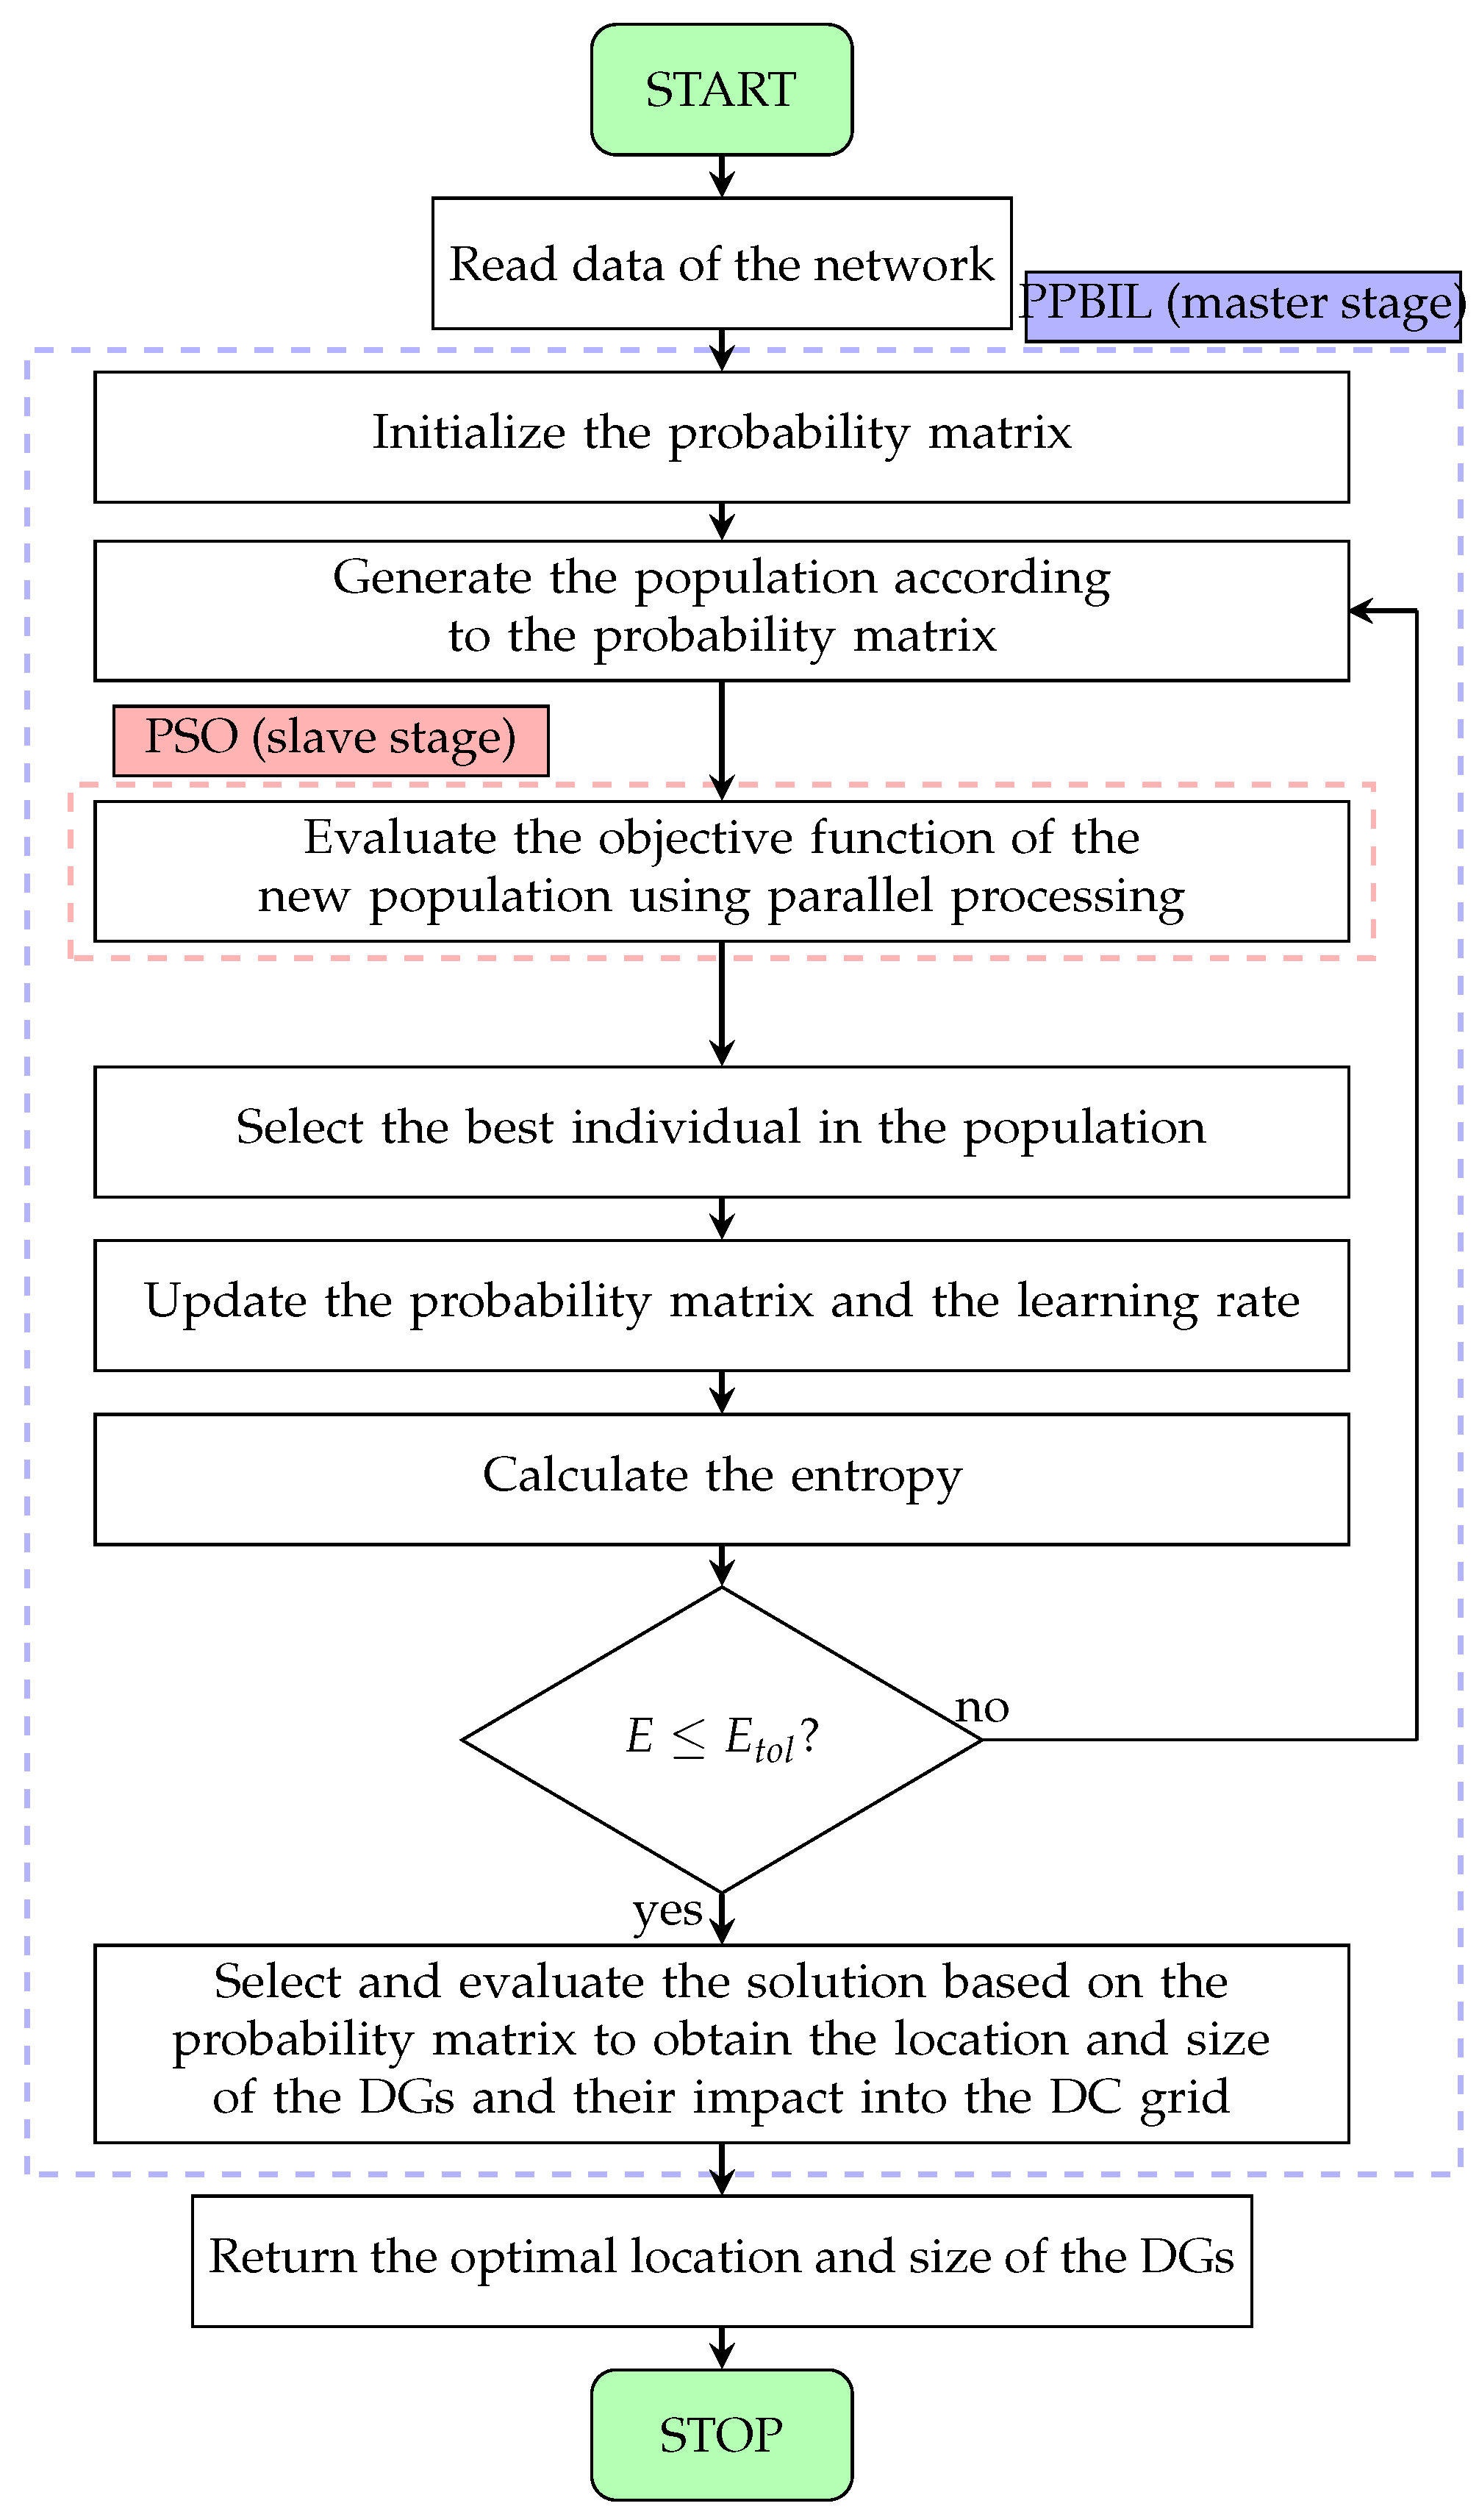
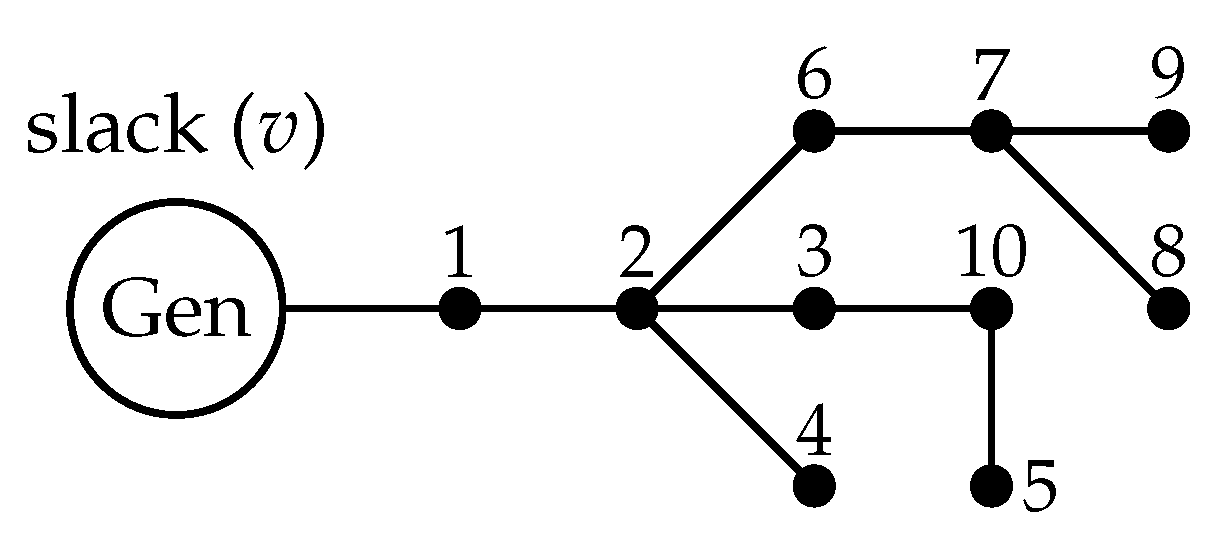
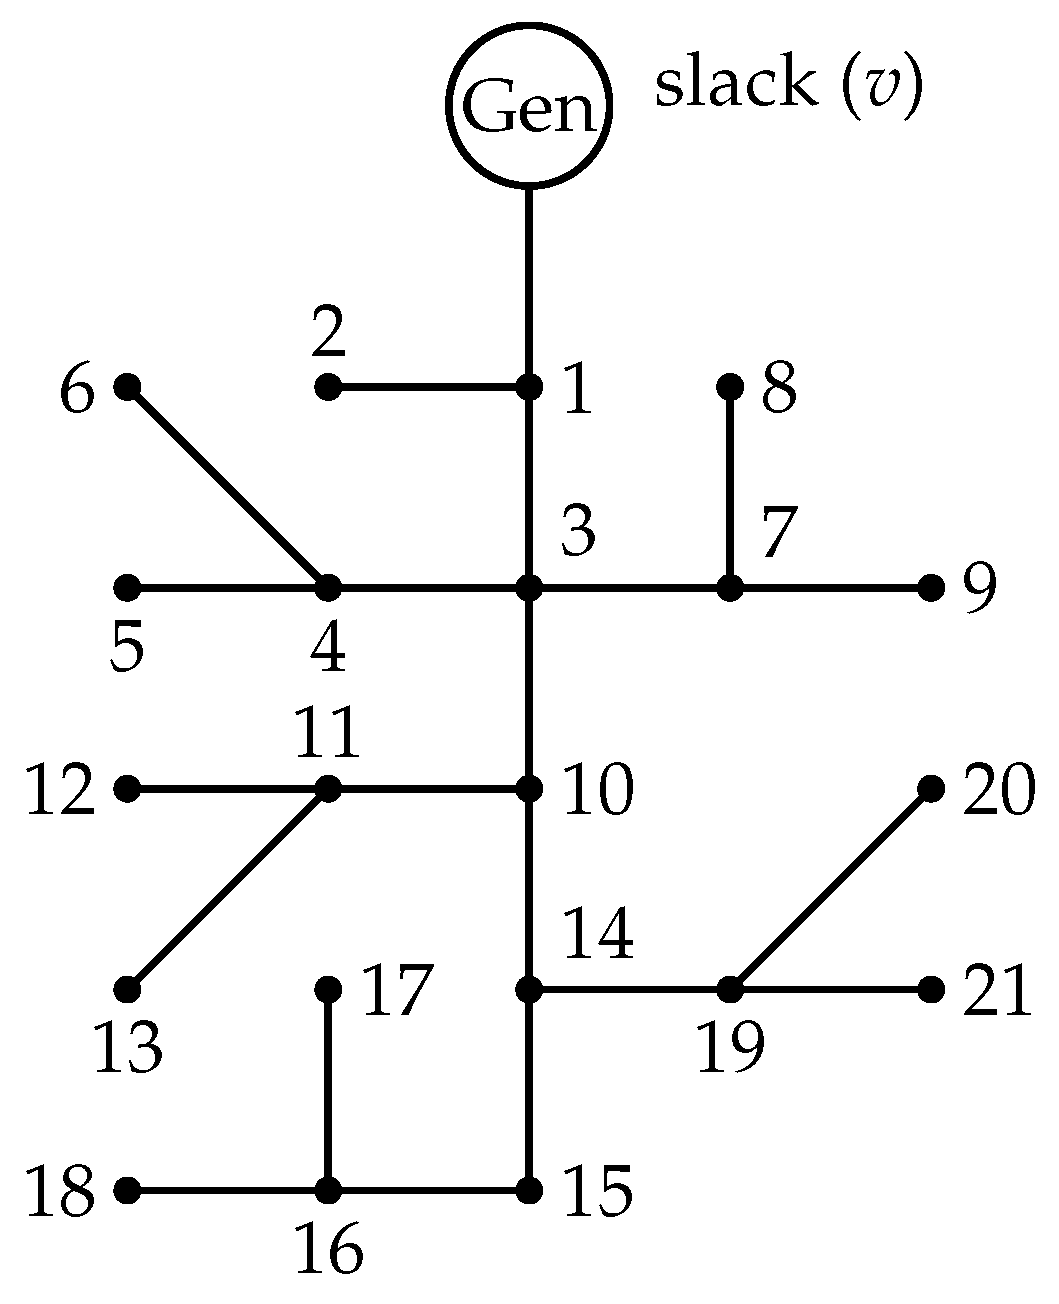
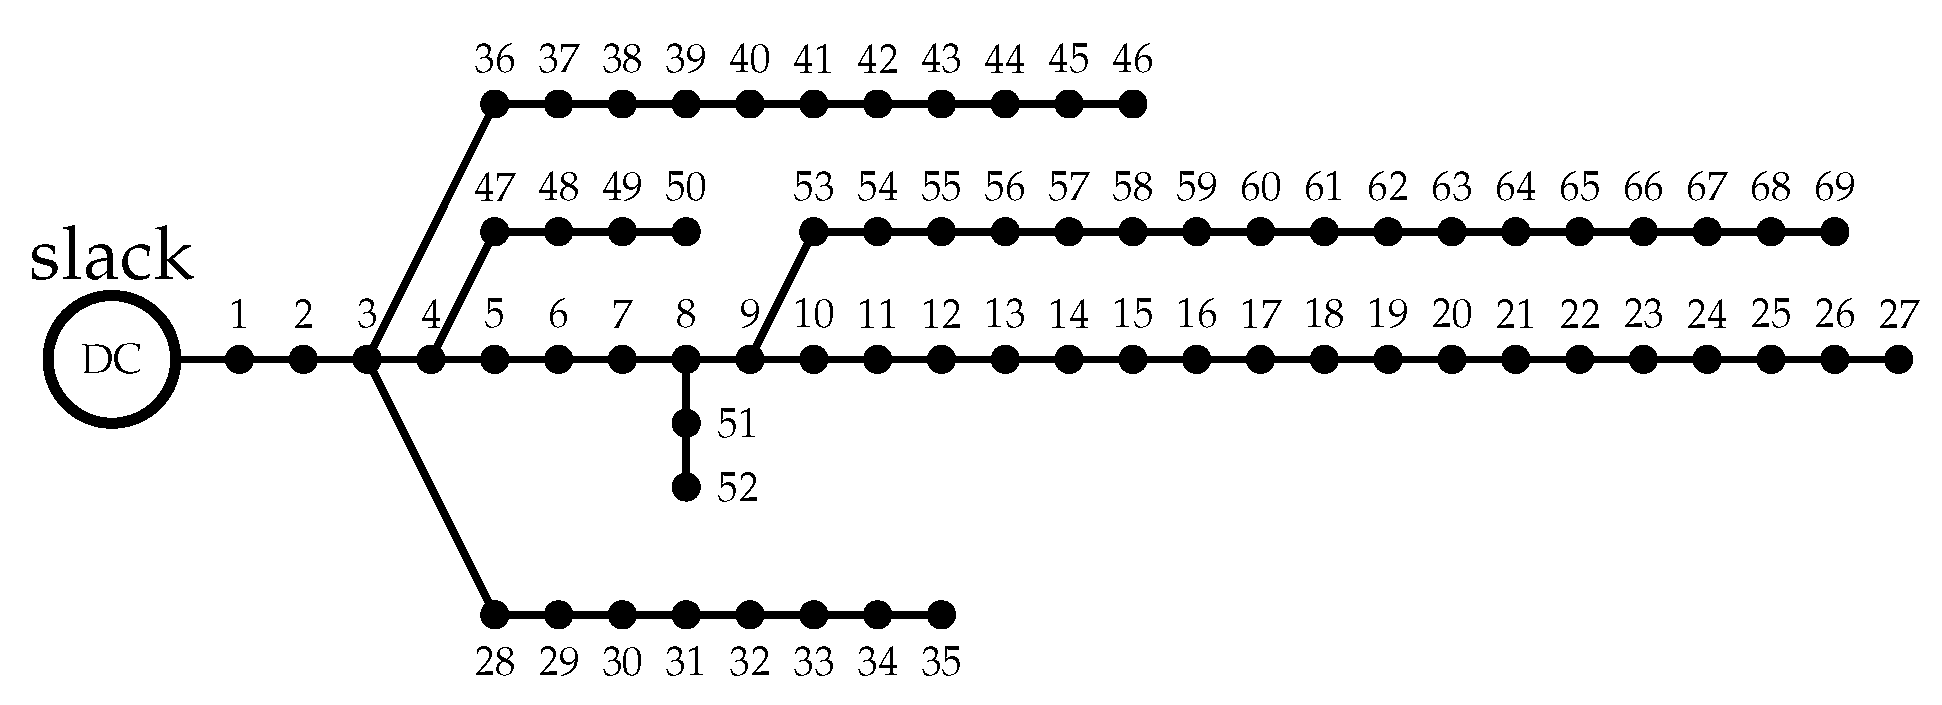
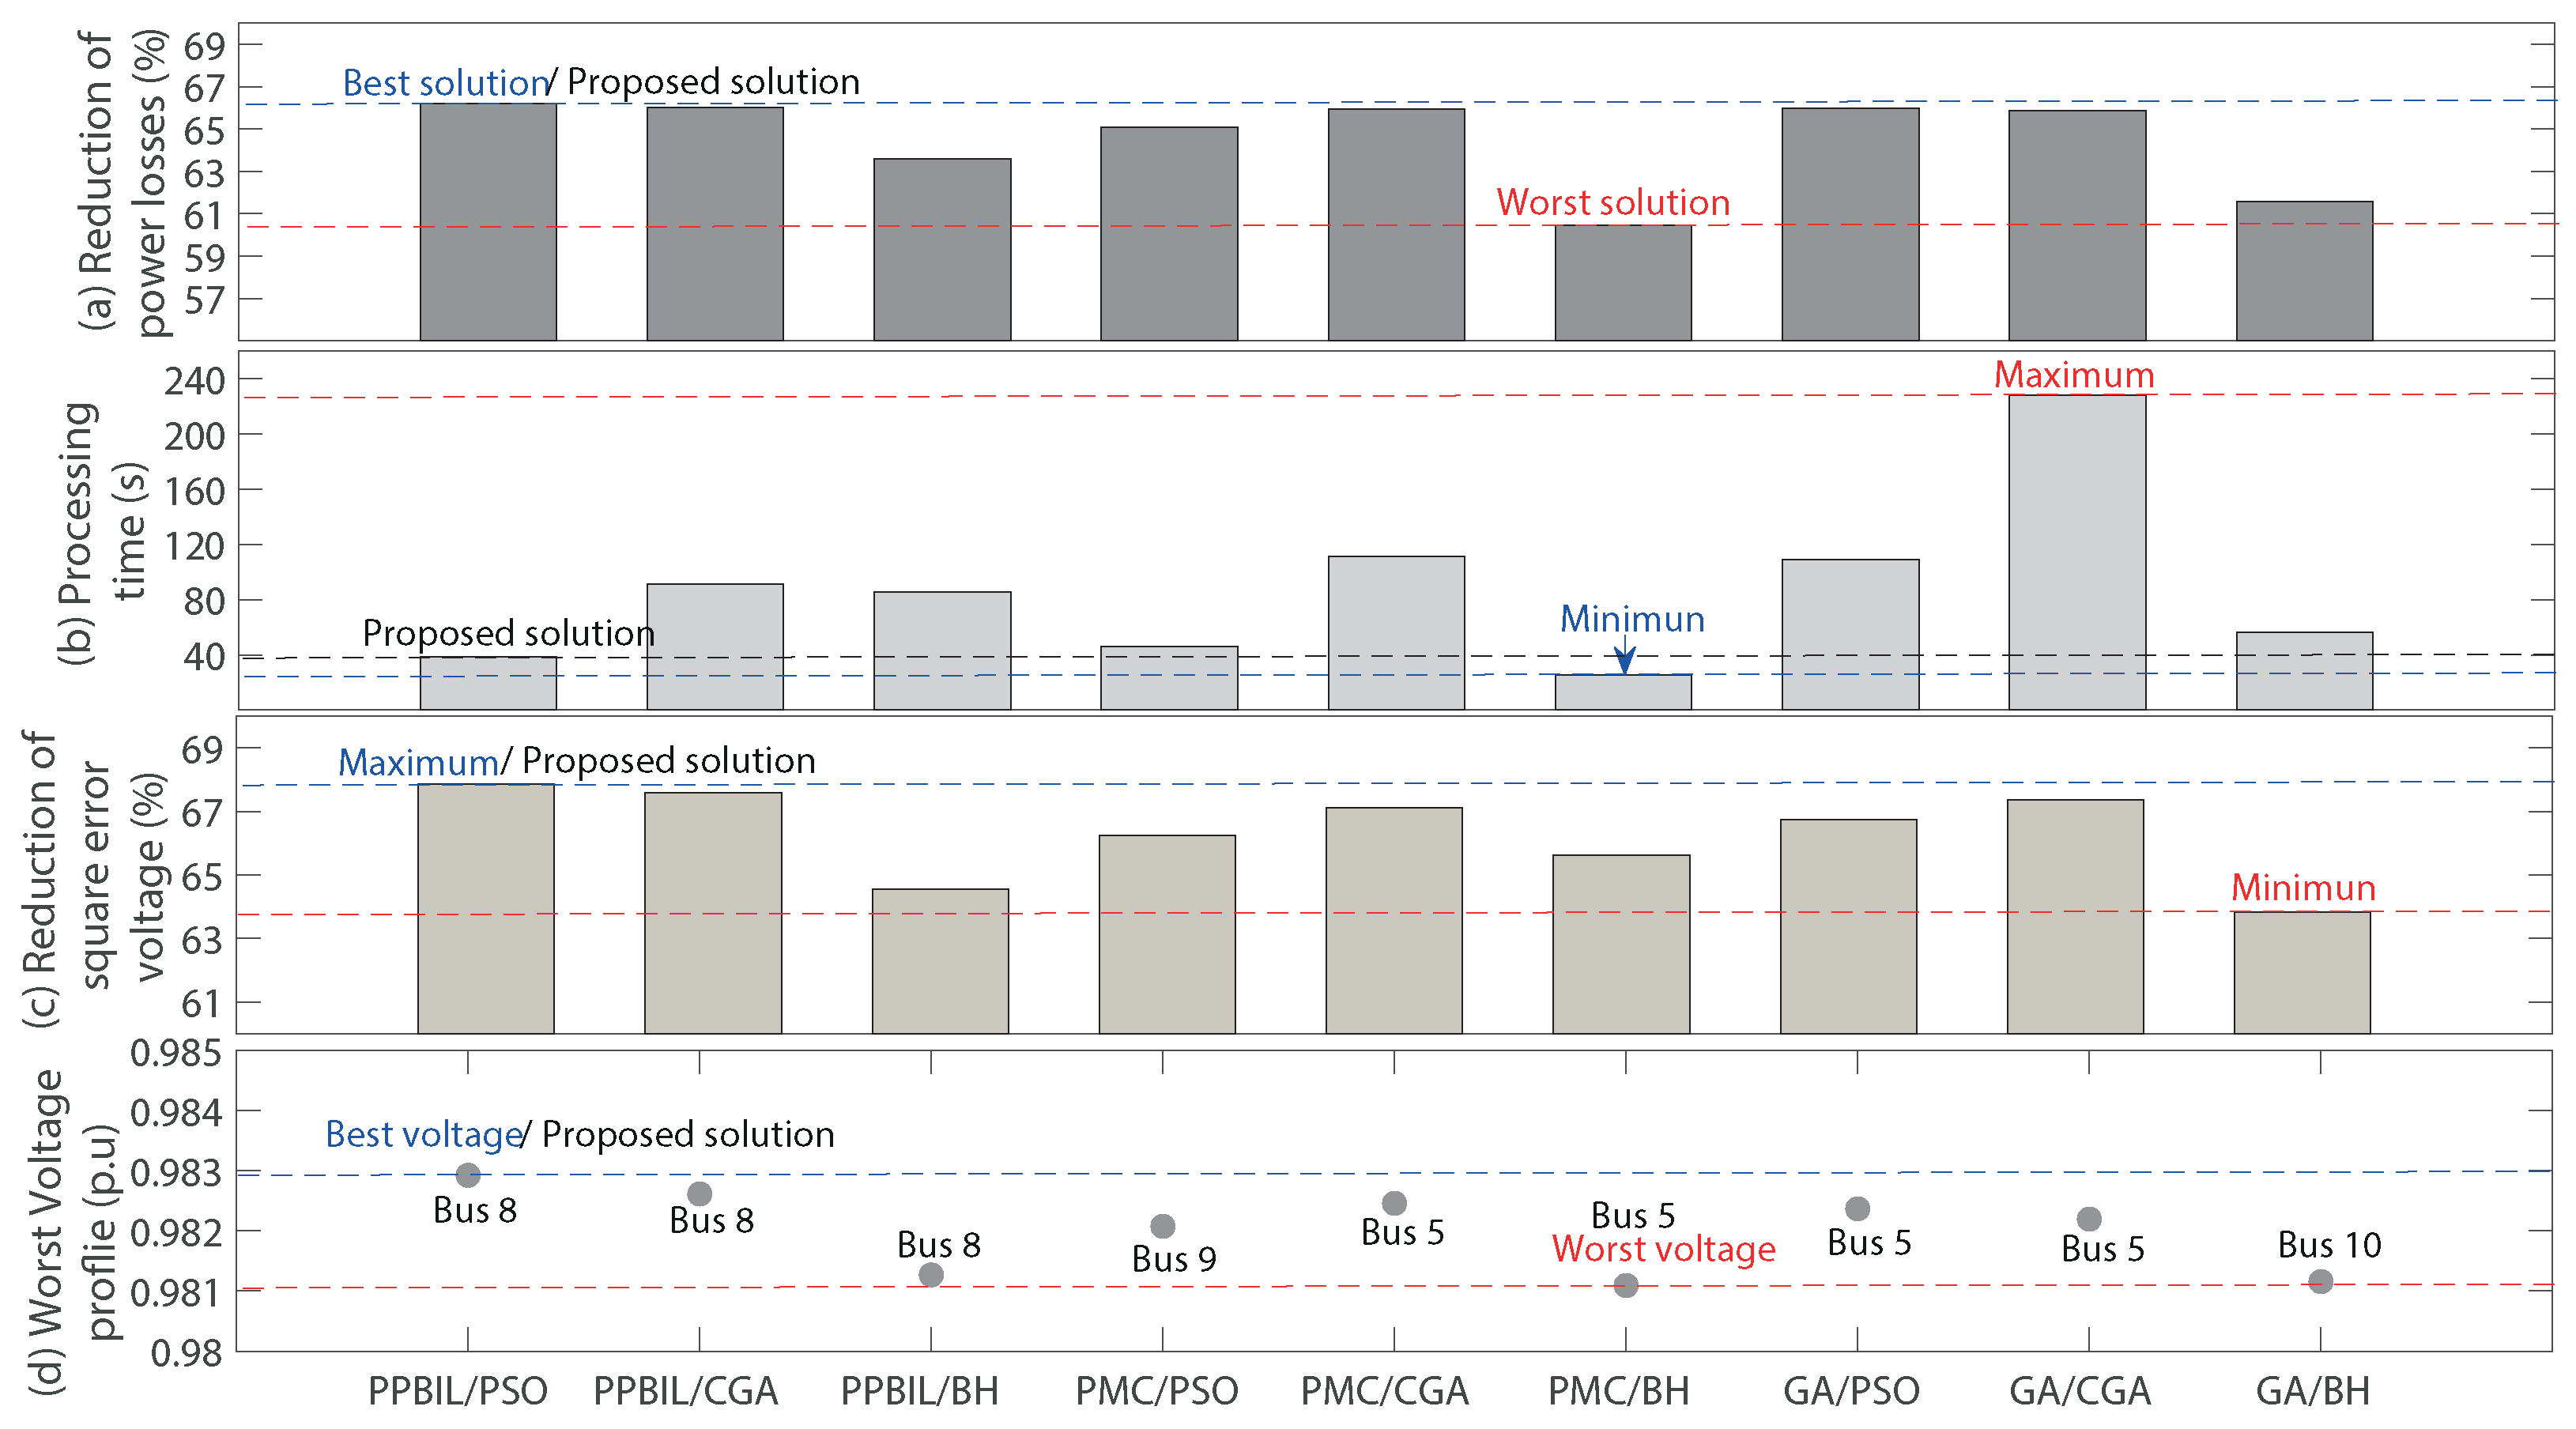
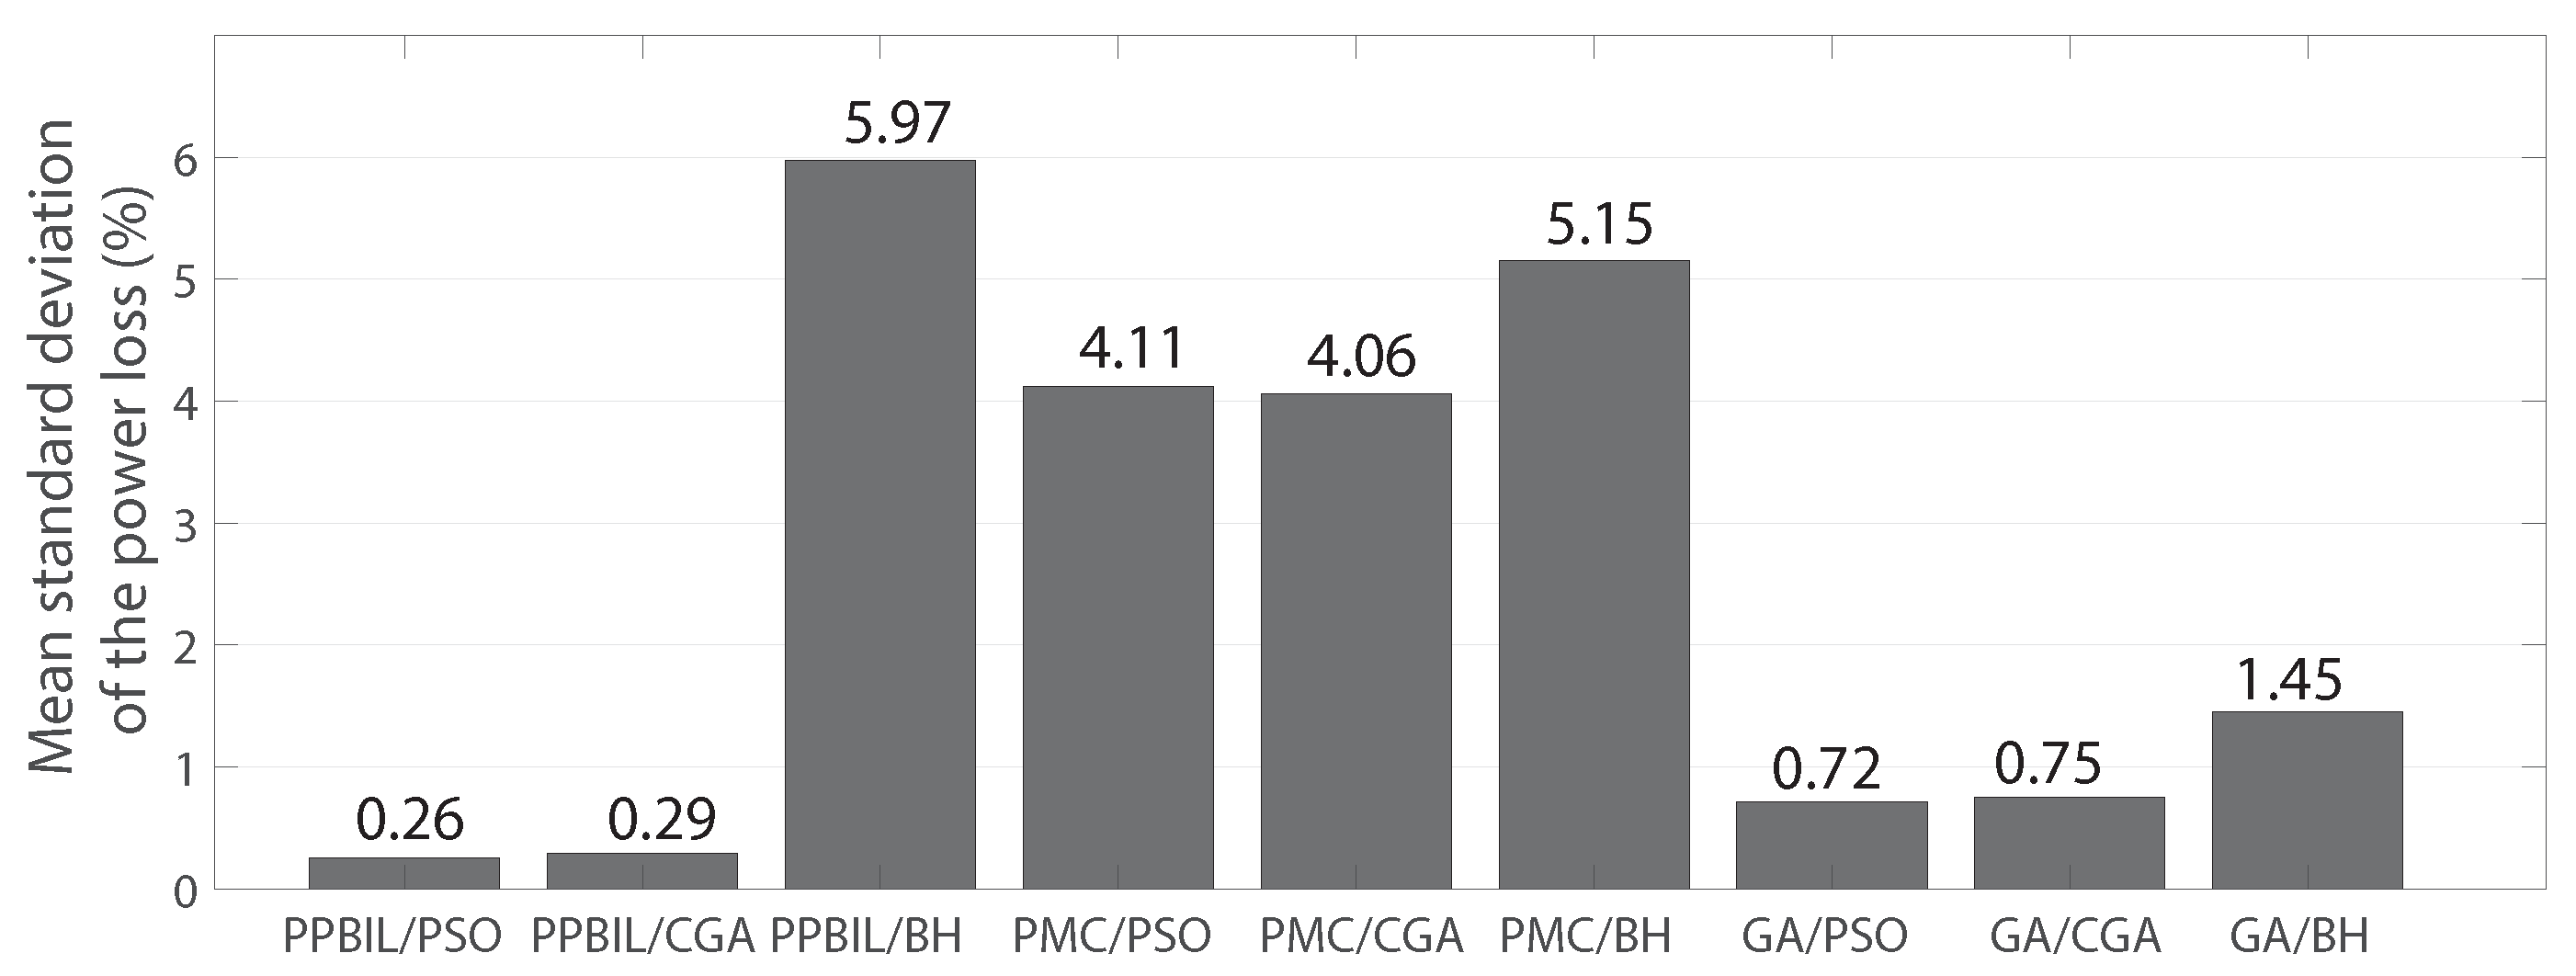
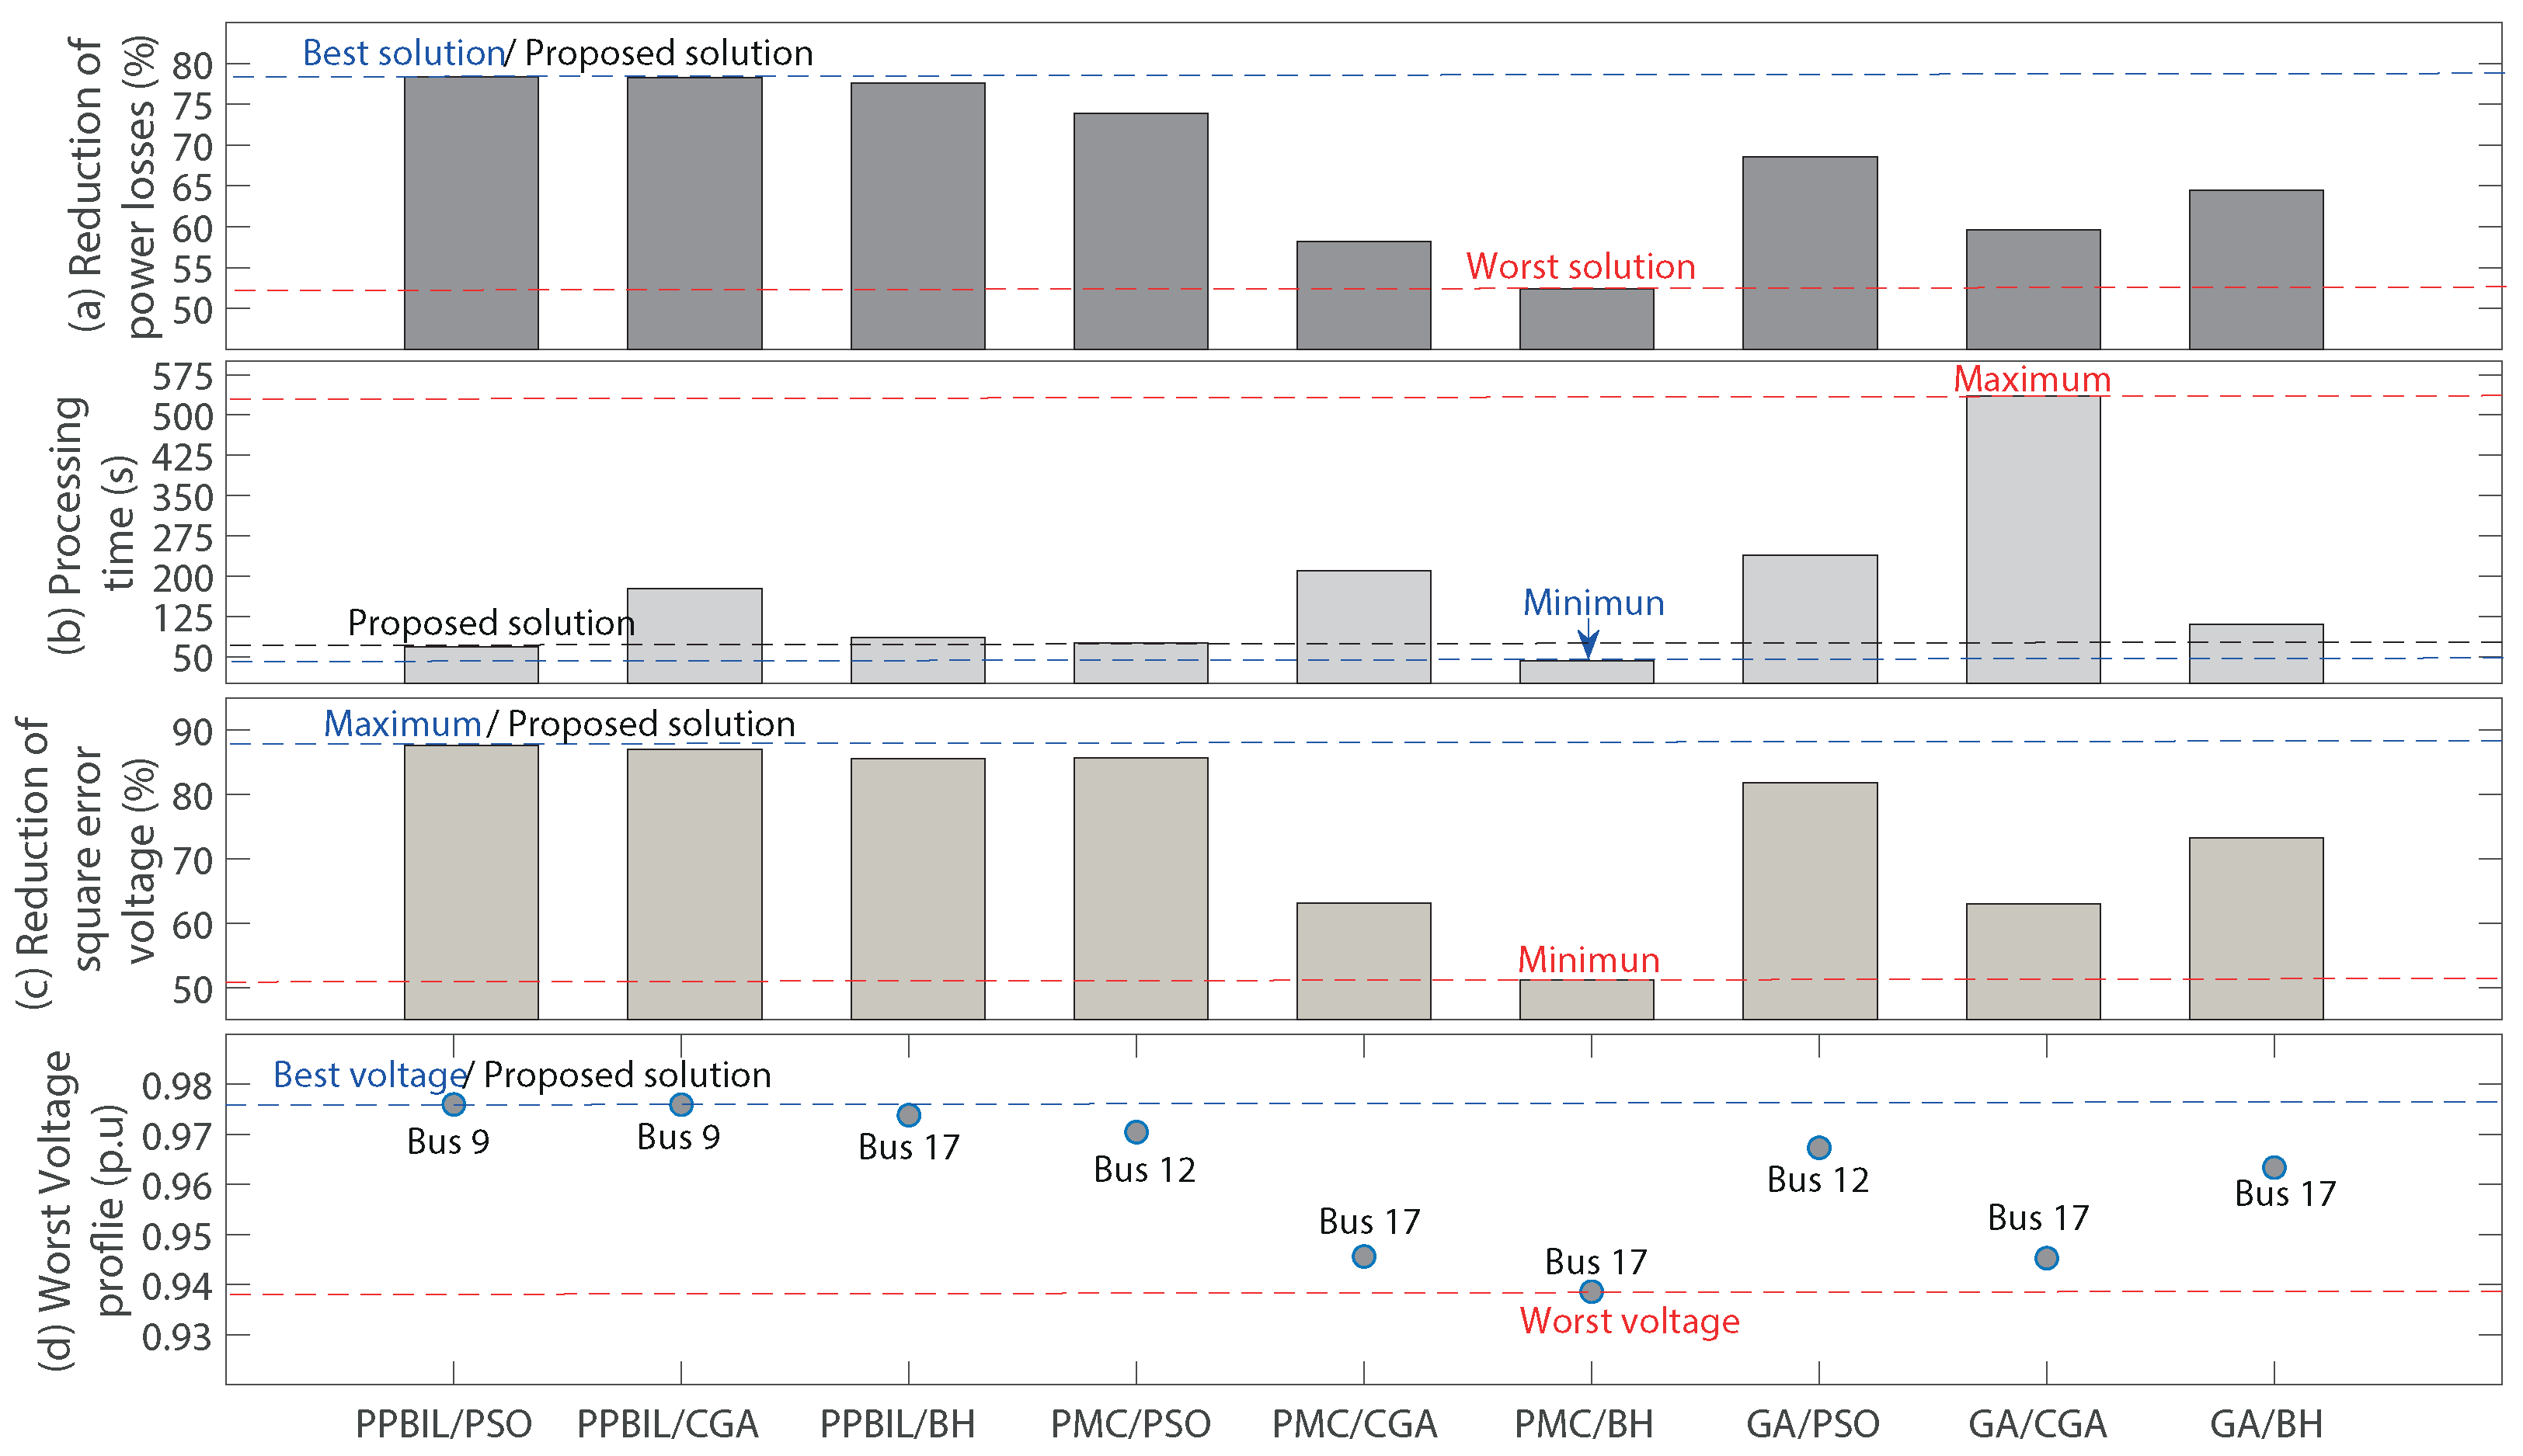
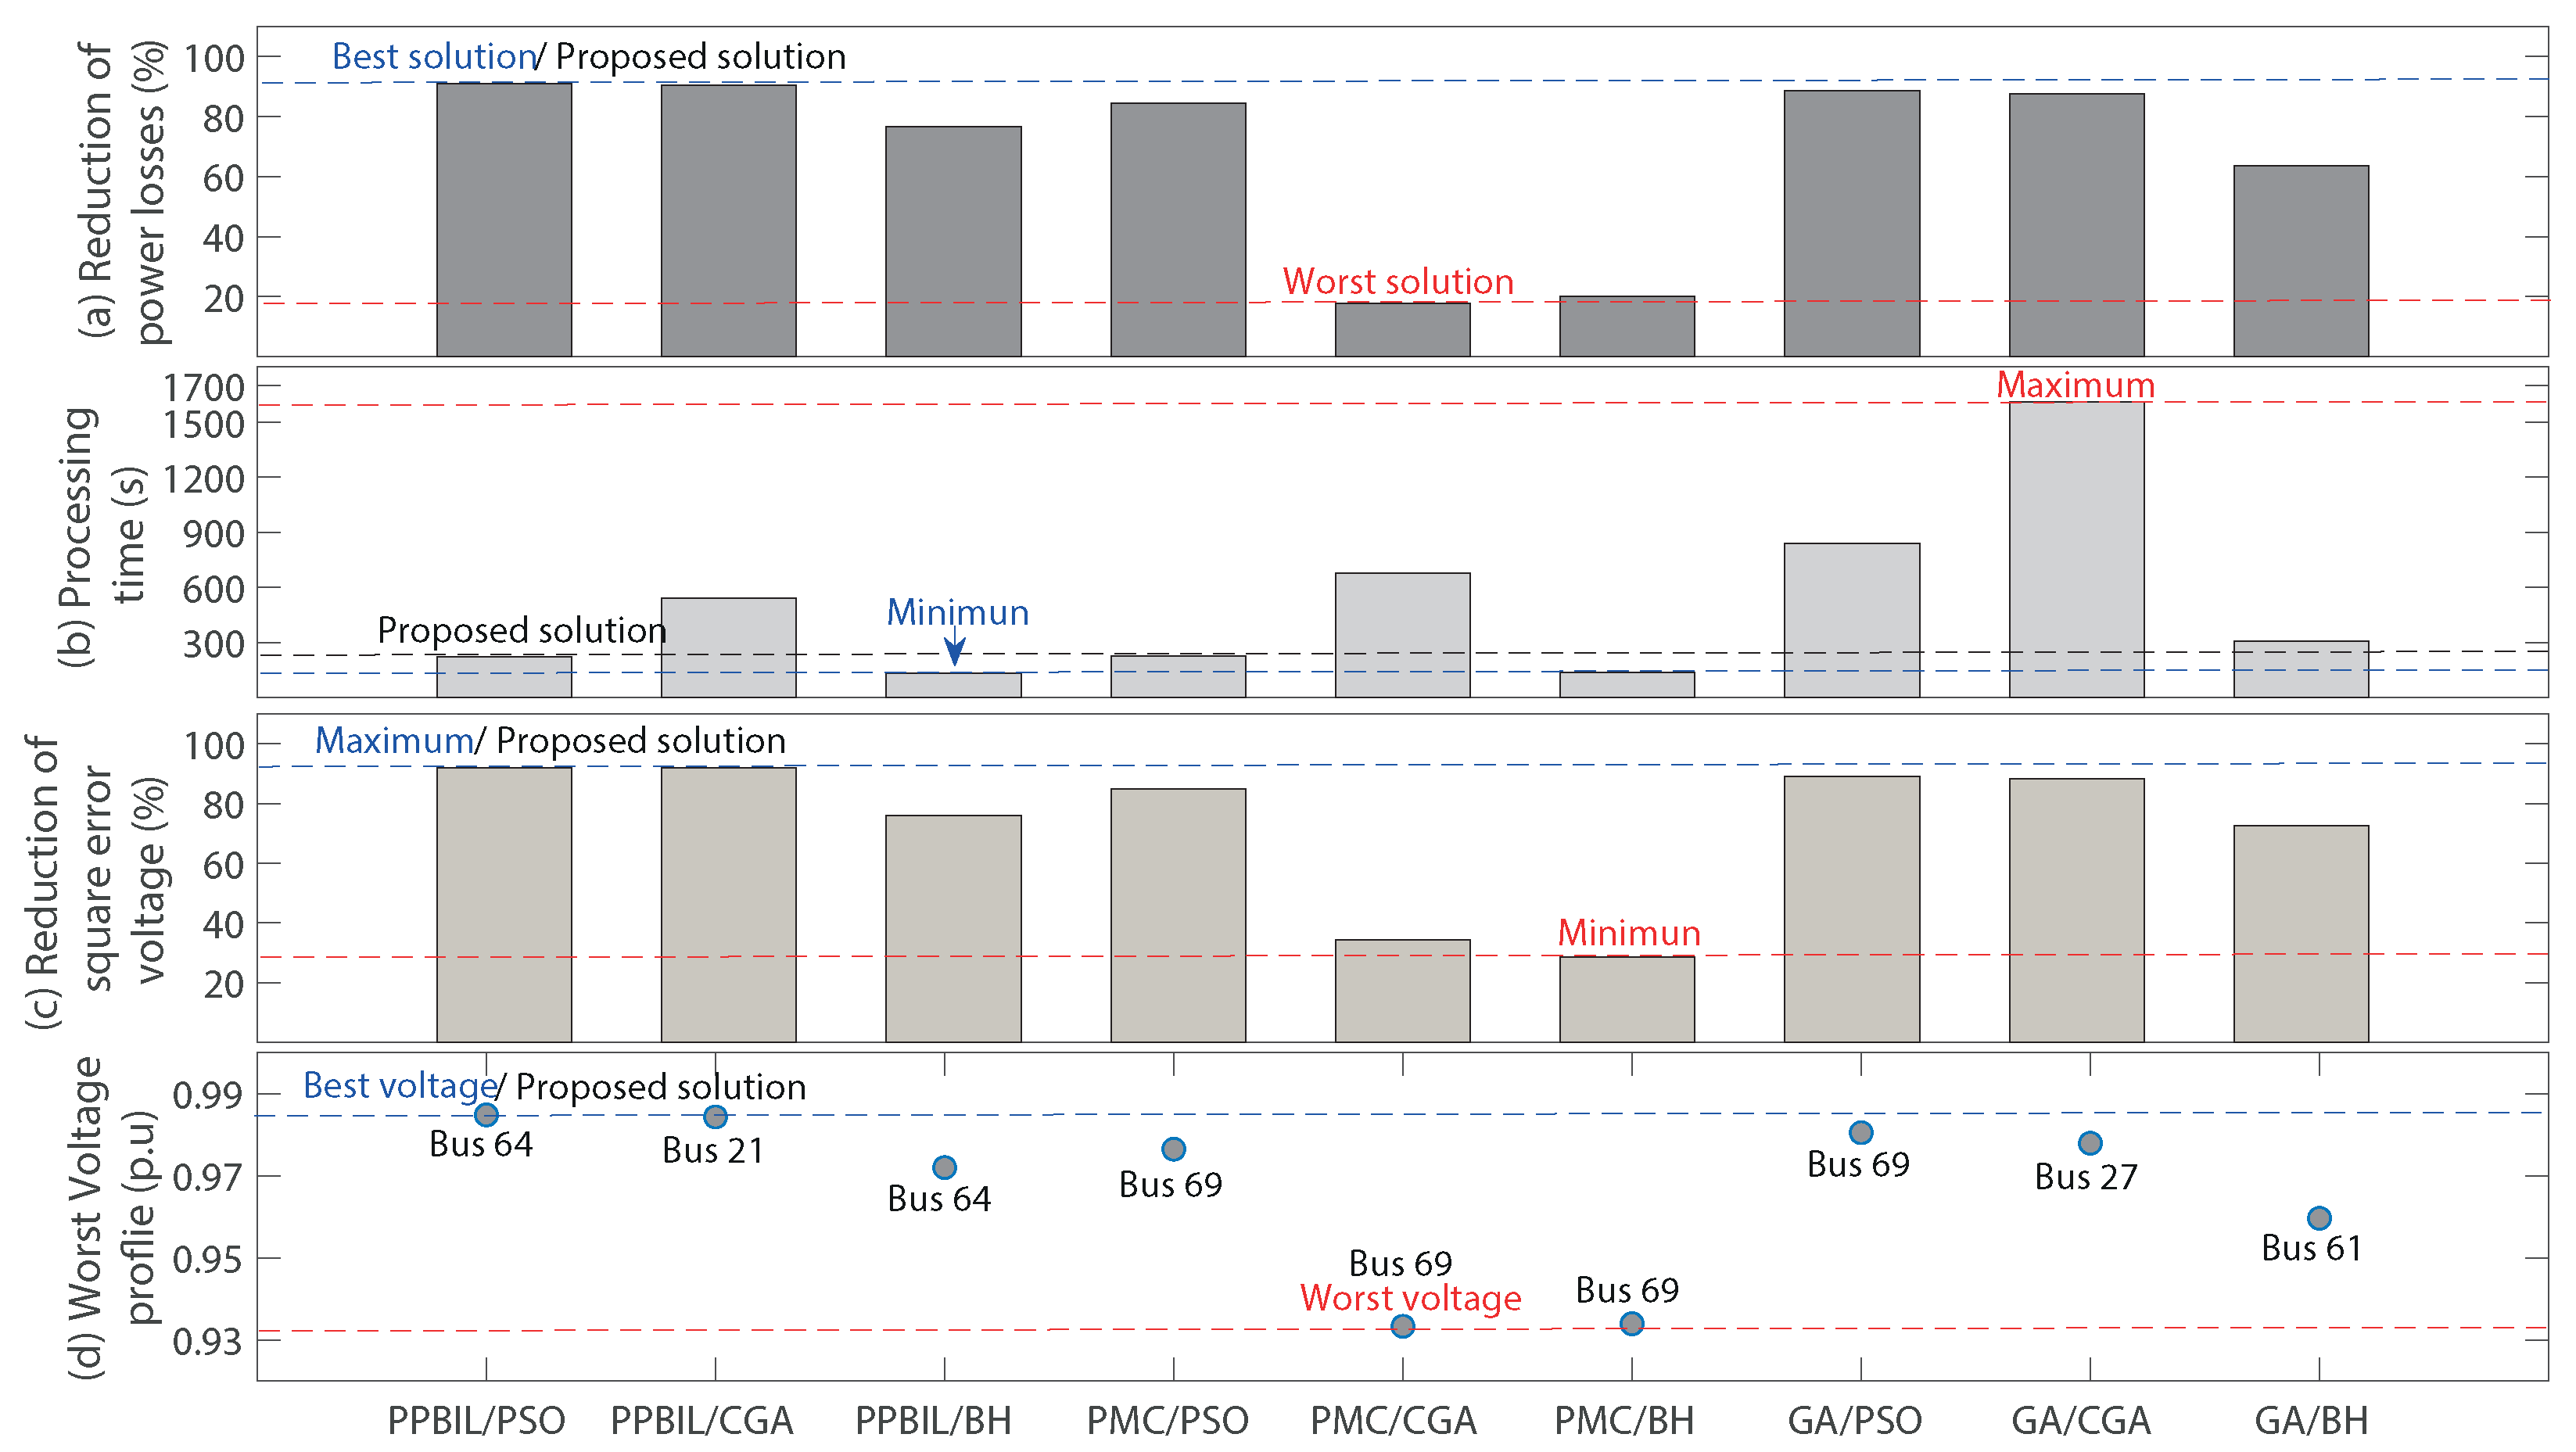
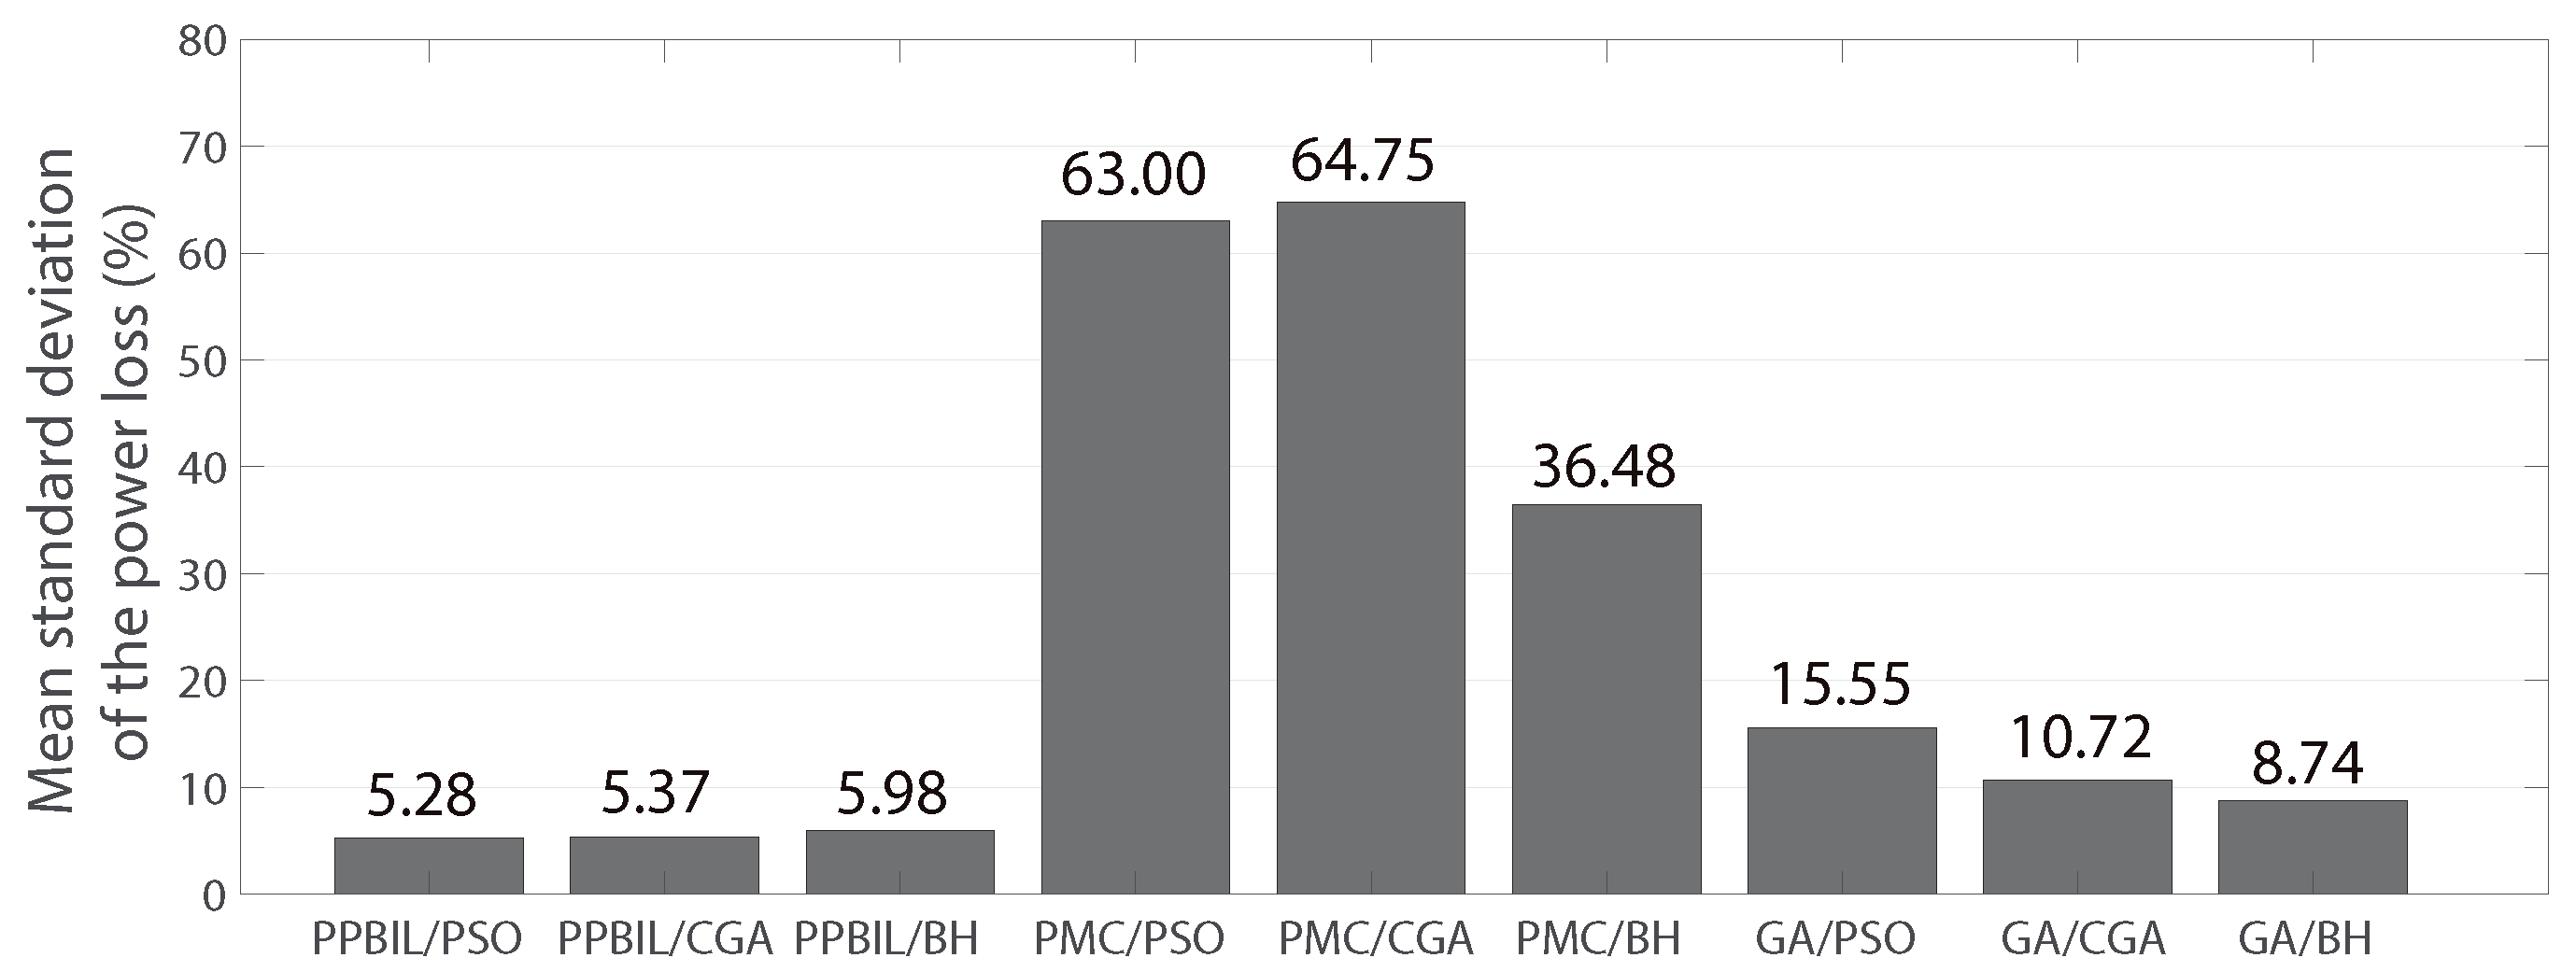
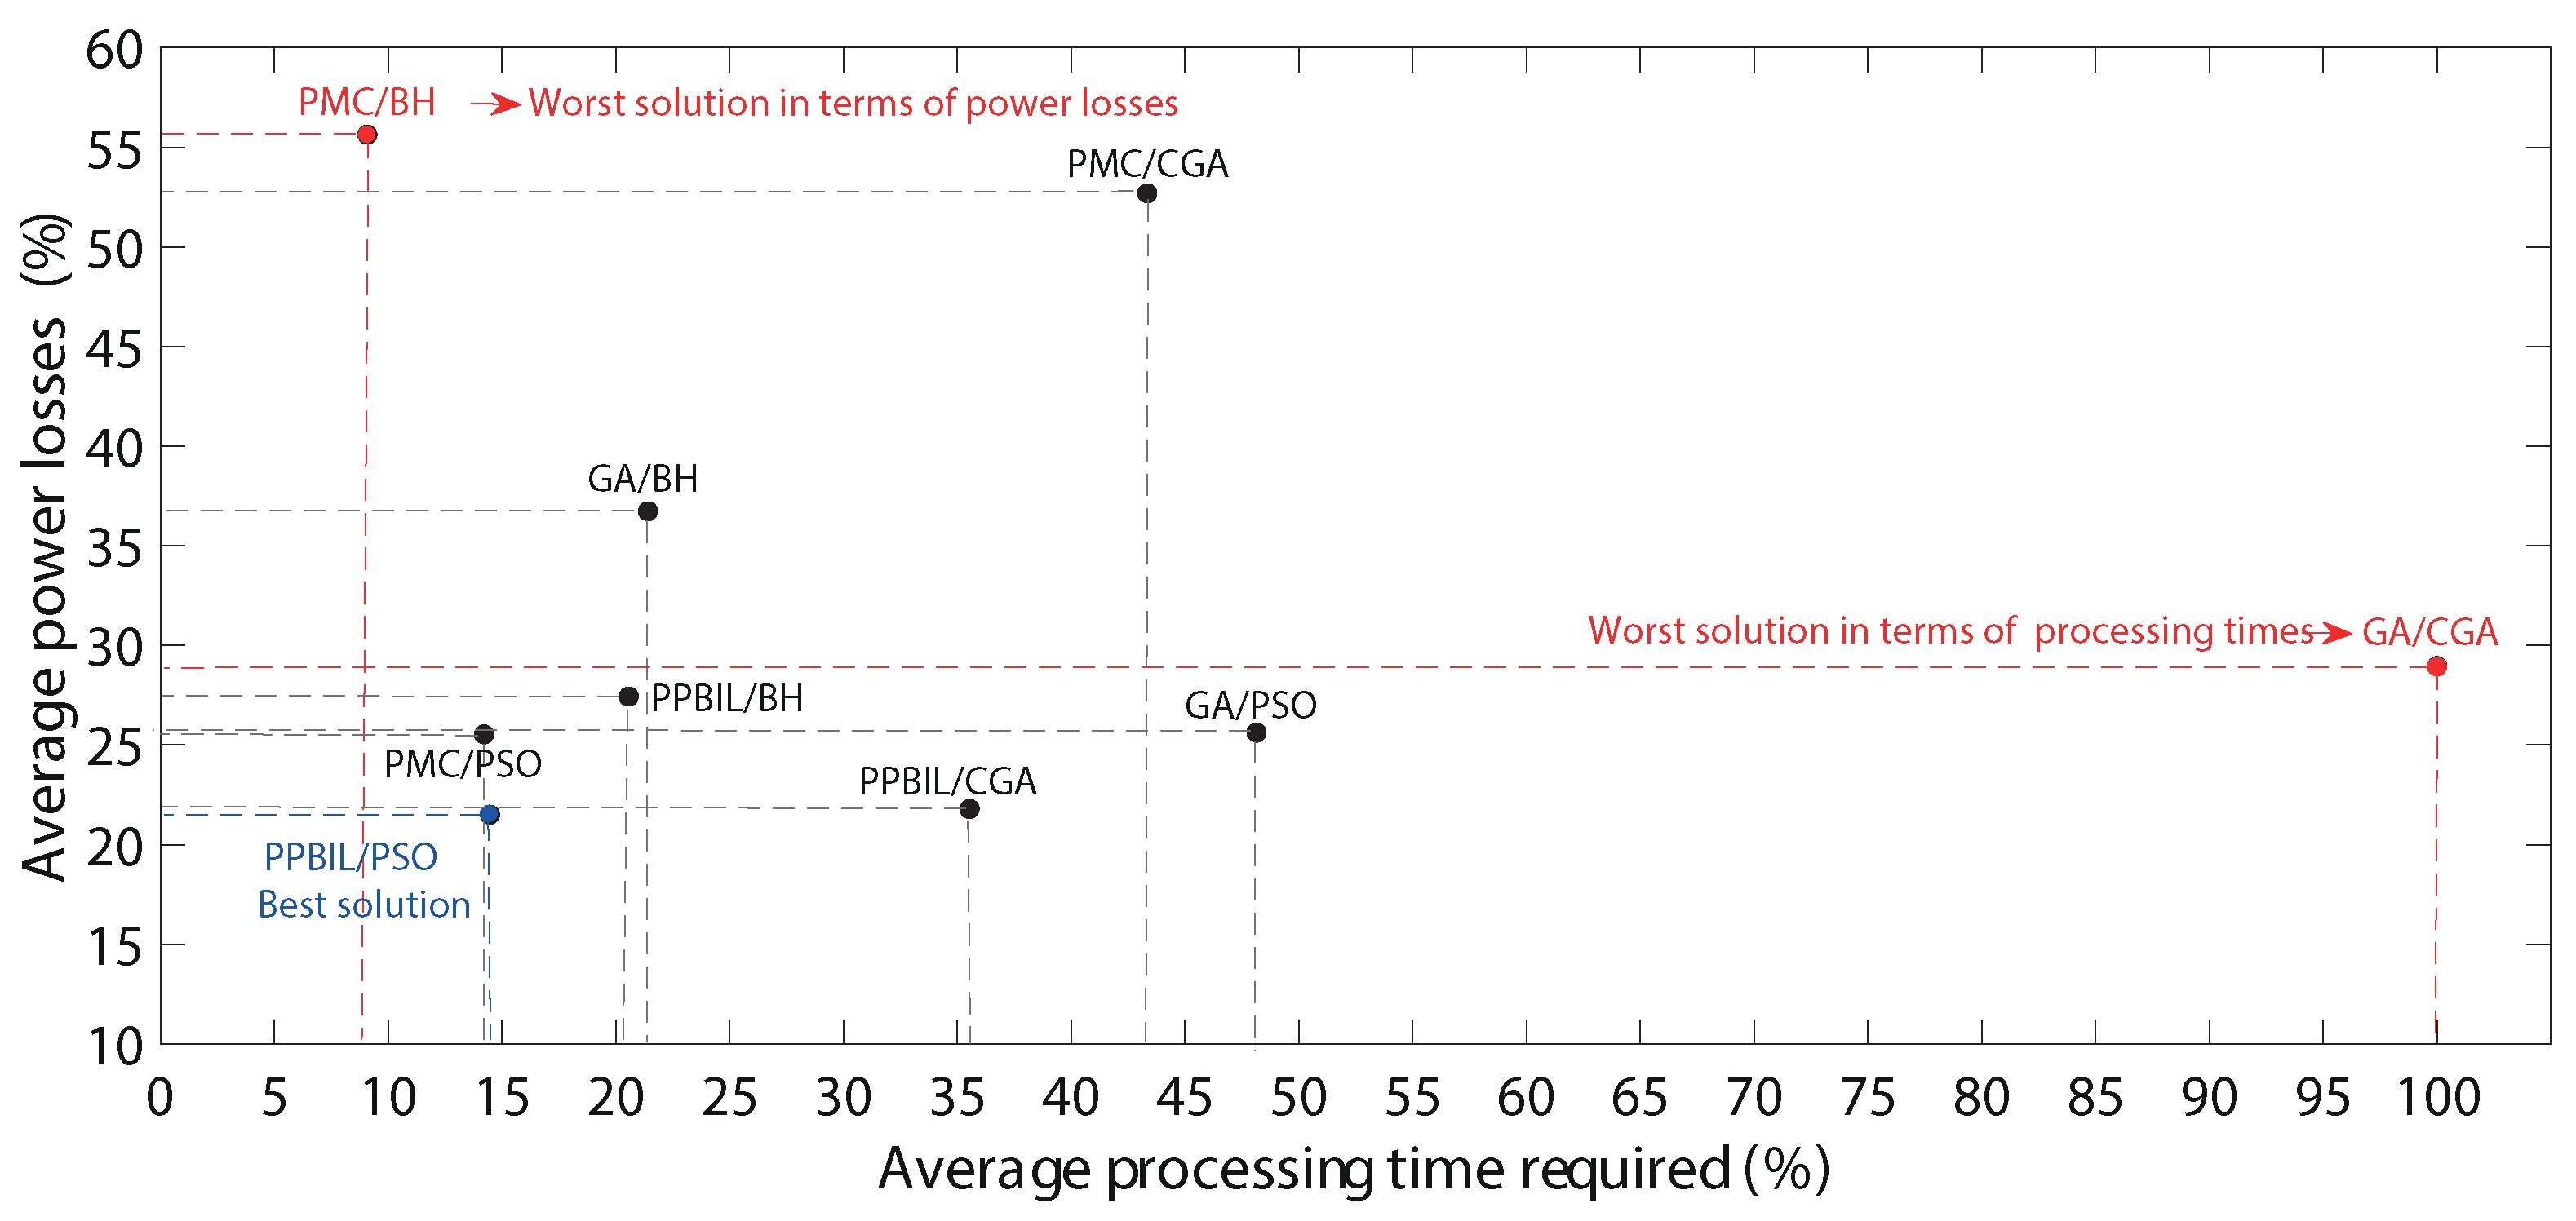