Multilevel Simulation Methodology for FMECA Study Applied to a Complex Cyber-Physical System

 ,
,  ,
,  ,
, 
Abstract
1. Introduction
- We propose a method to perform FMECA, based on commercial electronic design automation (EDA) tools originally introduced for design (not for FMECA), allowing the analysis of a complex cyber-physical system composed of analog, power, digital, and mechanical subsystems. The control software executed by the microcontroller is considered, too.
- The method allows evaluating, in detail, the effects on the whole system of each single fault affecting a single subsystem: for this purpose, the subsystem is simulated at a low level of abstraction, while the stimuli to be applied to the subsystems and the effects of the fault at the system level are computed resorting to a high level of abstraction simulation; the new EDA tools allow one to easily combine low- and high-level models and to effectively perform their combined simulation.
- As a result, the FMECA process can be effectively automated and speeded up, supporting a critical step in today’s design flow of many systems.
- Experimental results gathered on a case of study show that by using the proposed approach, not only the safety engineer can more easily identify the critical faults affecting the system, but their number is significantly reduced, mainly due to the masking effects of the dynamic control system often implemented by the software.
2. Background
2.1. Behavioral and Structural Models of Power Electronic
2.2. Multilevel Simulation
2.3. Analog Fault Models
2.4. FMECA
- (1)
- The time required for simulating the whole system at low level (e.g., with SPICE) is completely unacceptable; simulating different parts of the system at different abstraction levels is a feasible solution, but implies the availability of an environment where models of the different modules can be easily integrated, where the simulation at different levels is supported and where signals flow from one module to the other even when they are described at different levels;
- (2)
- The circuit diagram of the COTS components at the different levels (including the most detailed ones) is not always available, so multilevel simulation is not always possible;
- (3)
- The failure patterns of digital electronics are different from those of analog ones; hence, the choice of the most representative and suitable fault model is not given;
- (4)
- The effect of embedded software must be considered, too.
3. Proposed Approach
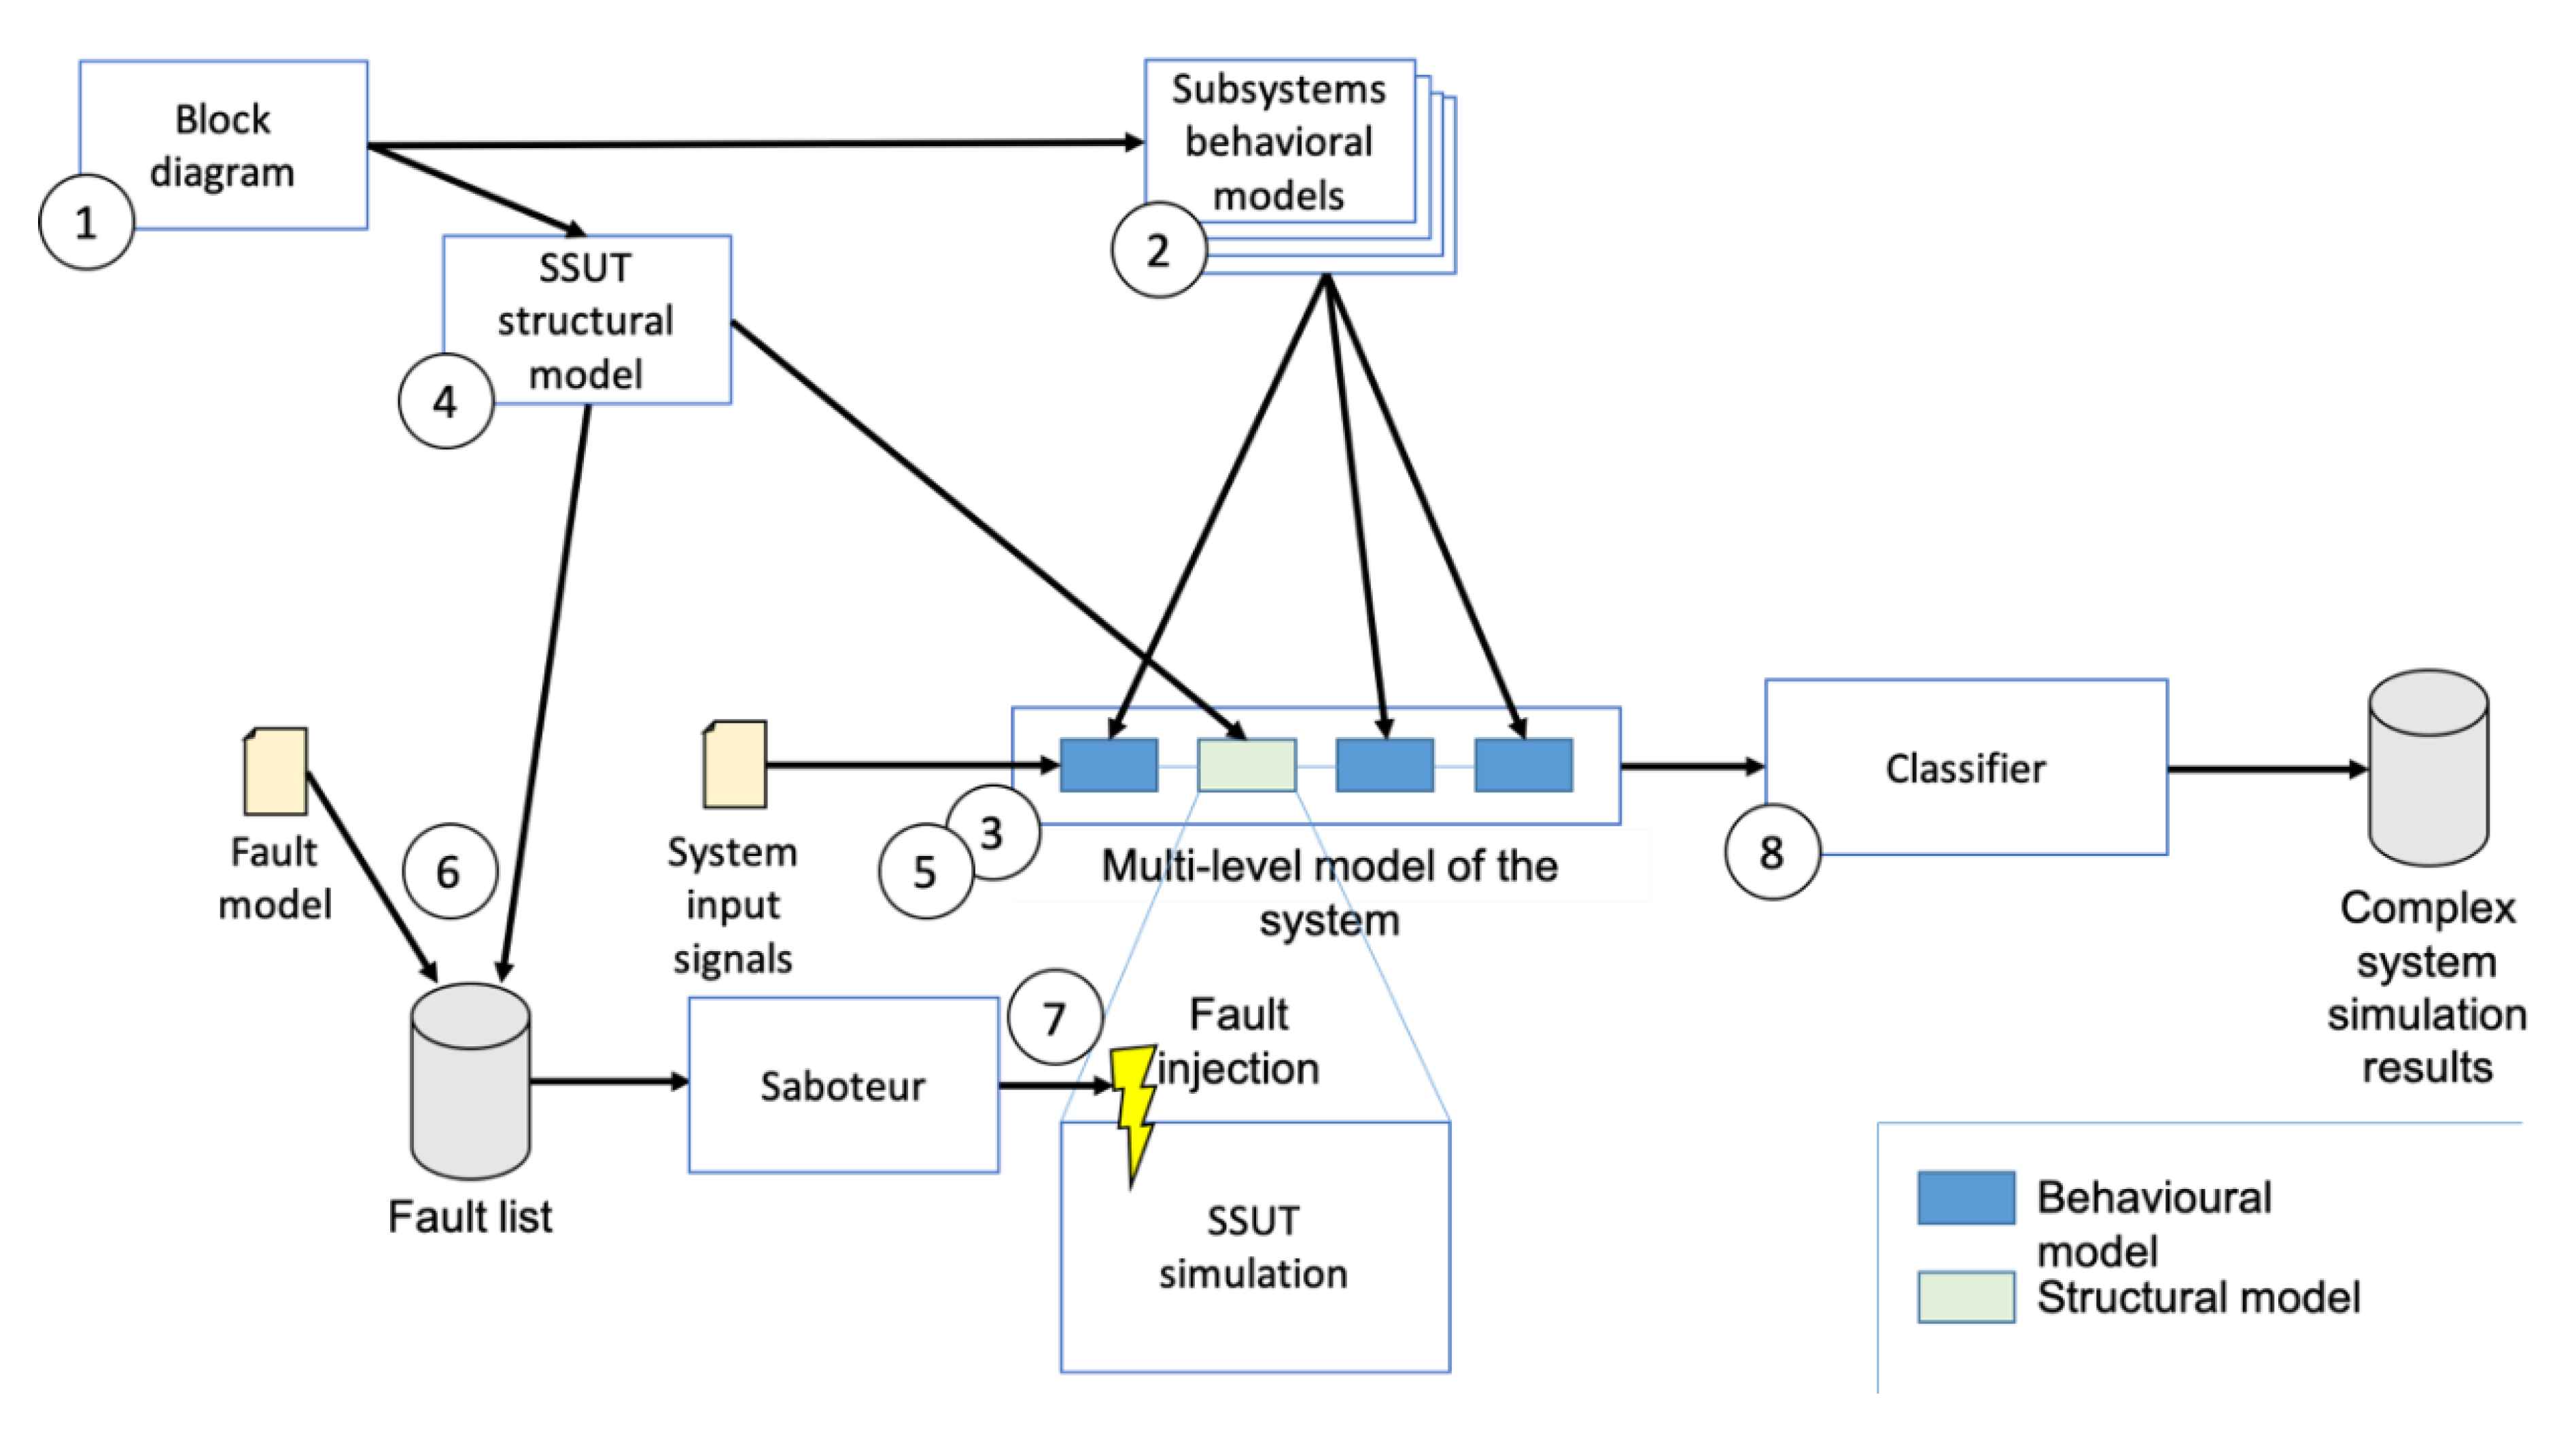
- Block diagram generation. The block diagram of the overall complex system is obtained. Usually, this block diagram is defined during the first phase of the system design. The block diagram shows the name of each subsystem and the connections between the different subsystems, as discussed in Section 2.1.
- Preparation of the behavioral models for the subsystems. In this step, the behavioral model of each subsystem present in the whole complex system is prepared. It can be obtained from the design phase of the complex system, or by identifying the transfer function between the inputs and the outputs of the considered subsystem. Therefore, the relationships between the inputs and outputs of each subsystem are explained as discussed in Section 2.1. The behavioral model of each subsystem is inserted in the block diagram of the whole system identified in the previous step.
- High-level system simulation. With the high-level models of each system now built, it is possible to perform a first functional simulation of the overall complex system at high level. In other words, it is possible to apply some external stimuli and to verify the stimulus response of the complex system. The stimuli applied must comply with the system design specifications, and the stimulus response provided by the complex systems must comply with the complex system design specifications. Generally in a cyber-physical system, the stimuli applied to the system are electrical, while the response to the stimulus is obtained on the mechanical actuator.
- Subsystem under test. The subsystem in which the faults are injected is now chosen. The SSUT is replaced in the block diagram with its low-level implementation, i.e., with its low-level structural model.
- Model check. Now, it is possible to perform a new functional simulation of the overall system. The purpose of this new simulation is to check again the system response to the stimuli applied to the complex system. The response to the stimuli must comply with the system design specifications. The stimulus response trend obtained is called the gold response, and it is obtained in a fault-free scenario. The gold response complies with the complex system design specification, too.
- Faults list generation. In this step, the list of the considered faults is generated. The fault list is obtained in accordance with the SSUT fault model chosen. In the literature for each fault model, there is an algorithm able to generate the list of the possible faults.
- Fault effect simulation. For each fault considered, a functional simulation is performed by applying a stimulus to the complex system. A functional stimulus is an input signal that complies with the system design specifications. The saboteur injects a single catastrophic fault [37] into the SSUT structural model at the start of a simulation, as discussed in [3].
- Fault effect evaluation. A classifier [13,35] compares the stimulus response obtained from the complex systems with the gold response previously obtained in the fault-free scenario. The injected fault is considered critical if the stimulus response is not compliant with the design specification, in other words, coherently with the definition of fault contained in the FMECA manuals [33,34], if the fault effect produces a difference in respect to the item design requirements. In particular, during the system design phase, different maximum tolerance values are established for each electrical quantity present in the complex system. The fault is classified as critical if the value obtained in the simulation exceeds the maximum accepted tolerance.
- A switch in series to each device present in the circuit diagram;
- A switch in parallel to each device present in the circuit diagram;
- Different short circuits switches between different nodes of the circuit diagram, in particular, between nodes that are normally unconnected in the SSUT circuit diagram.
4. Case Study
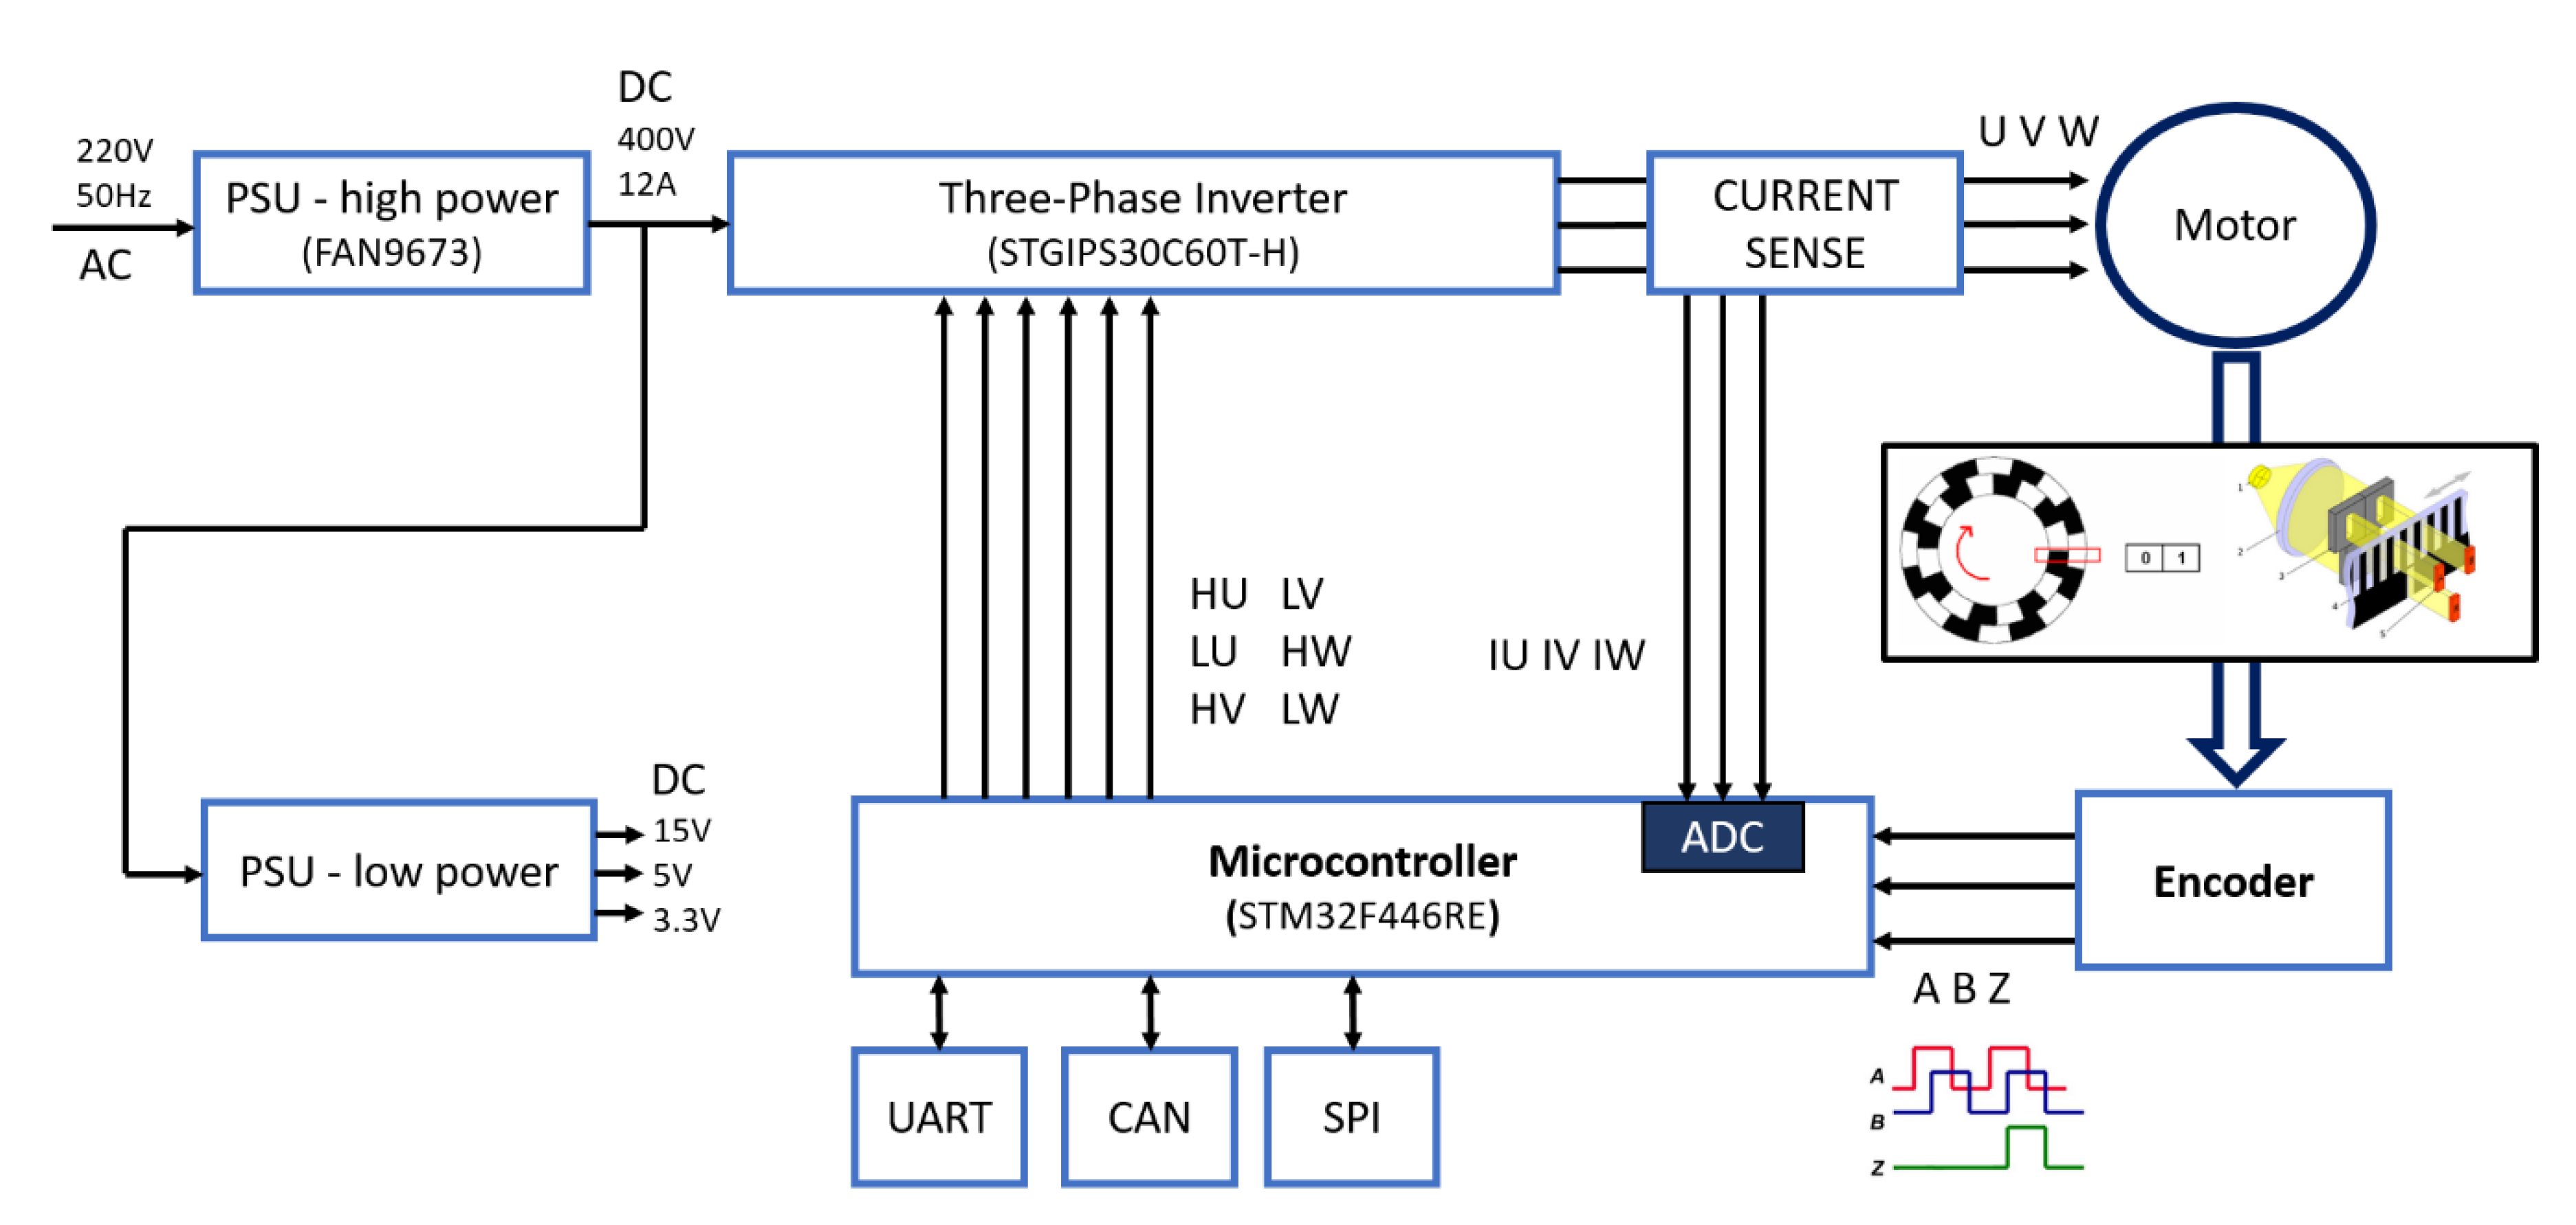
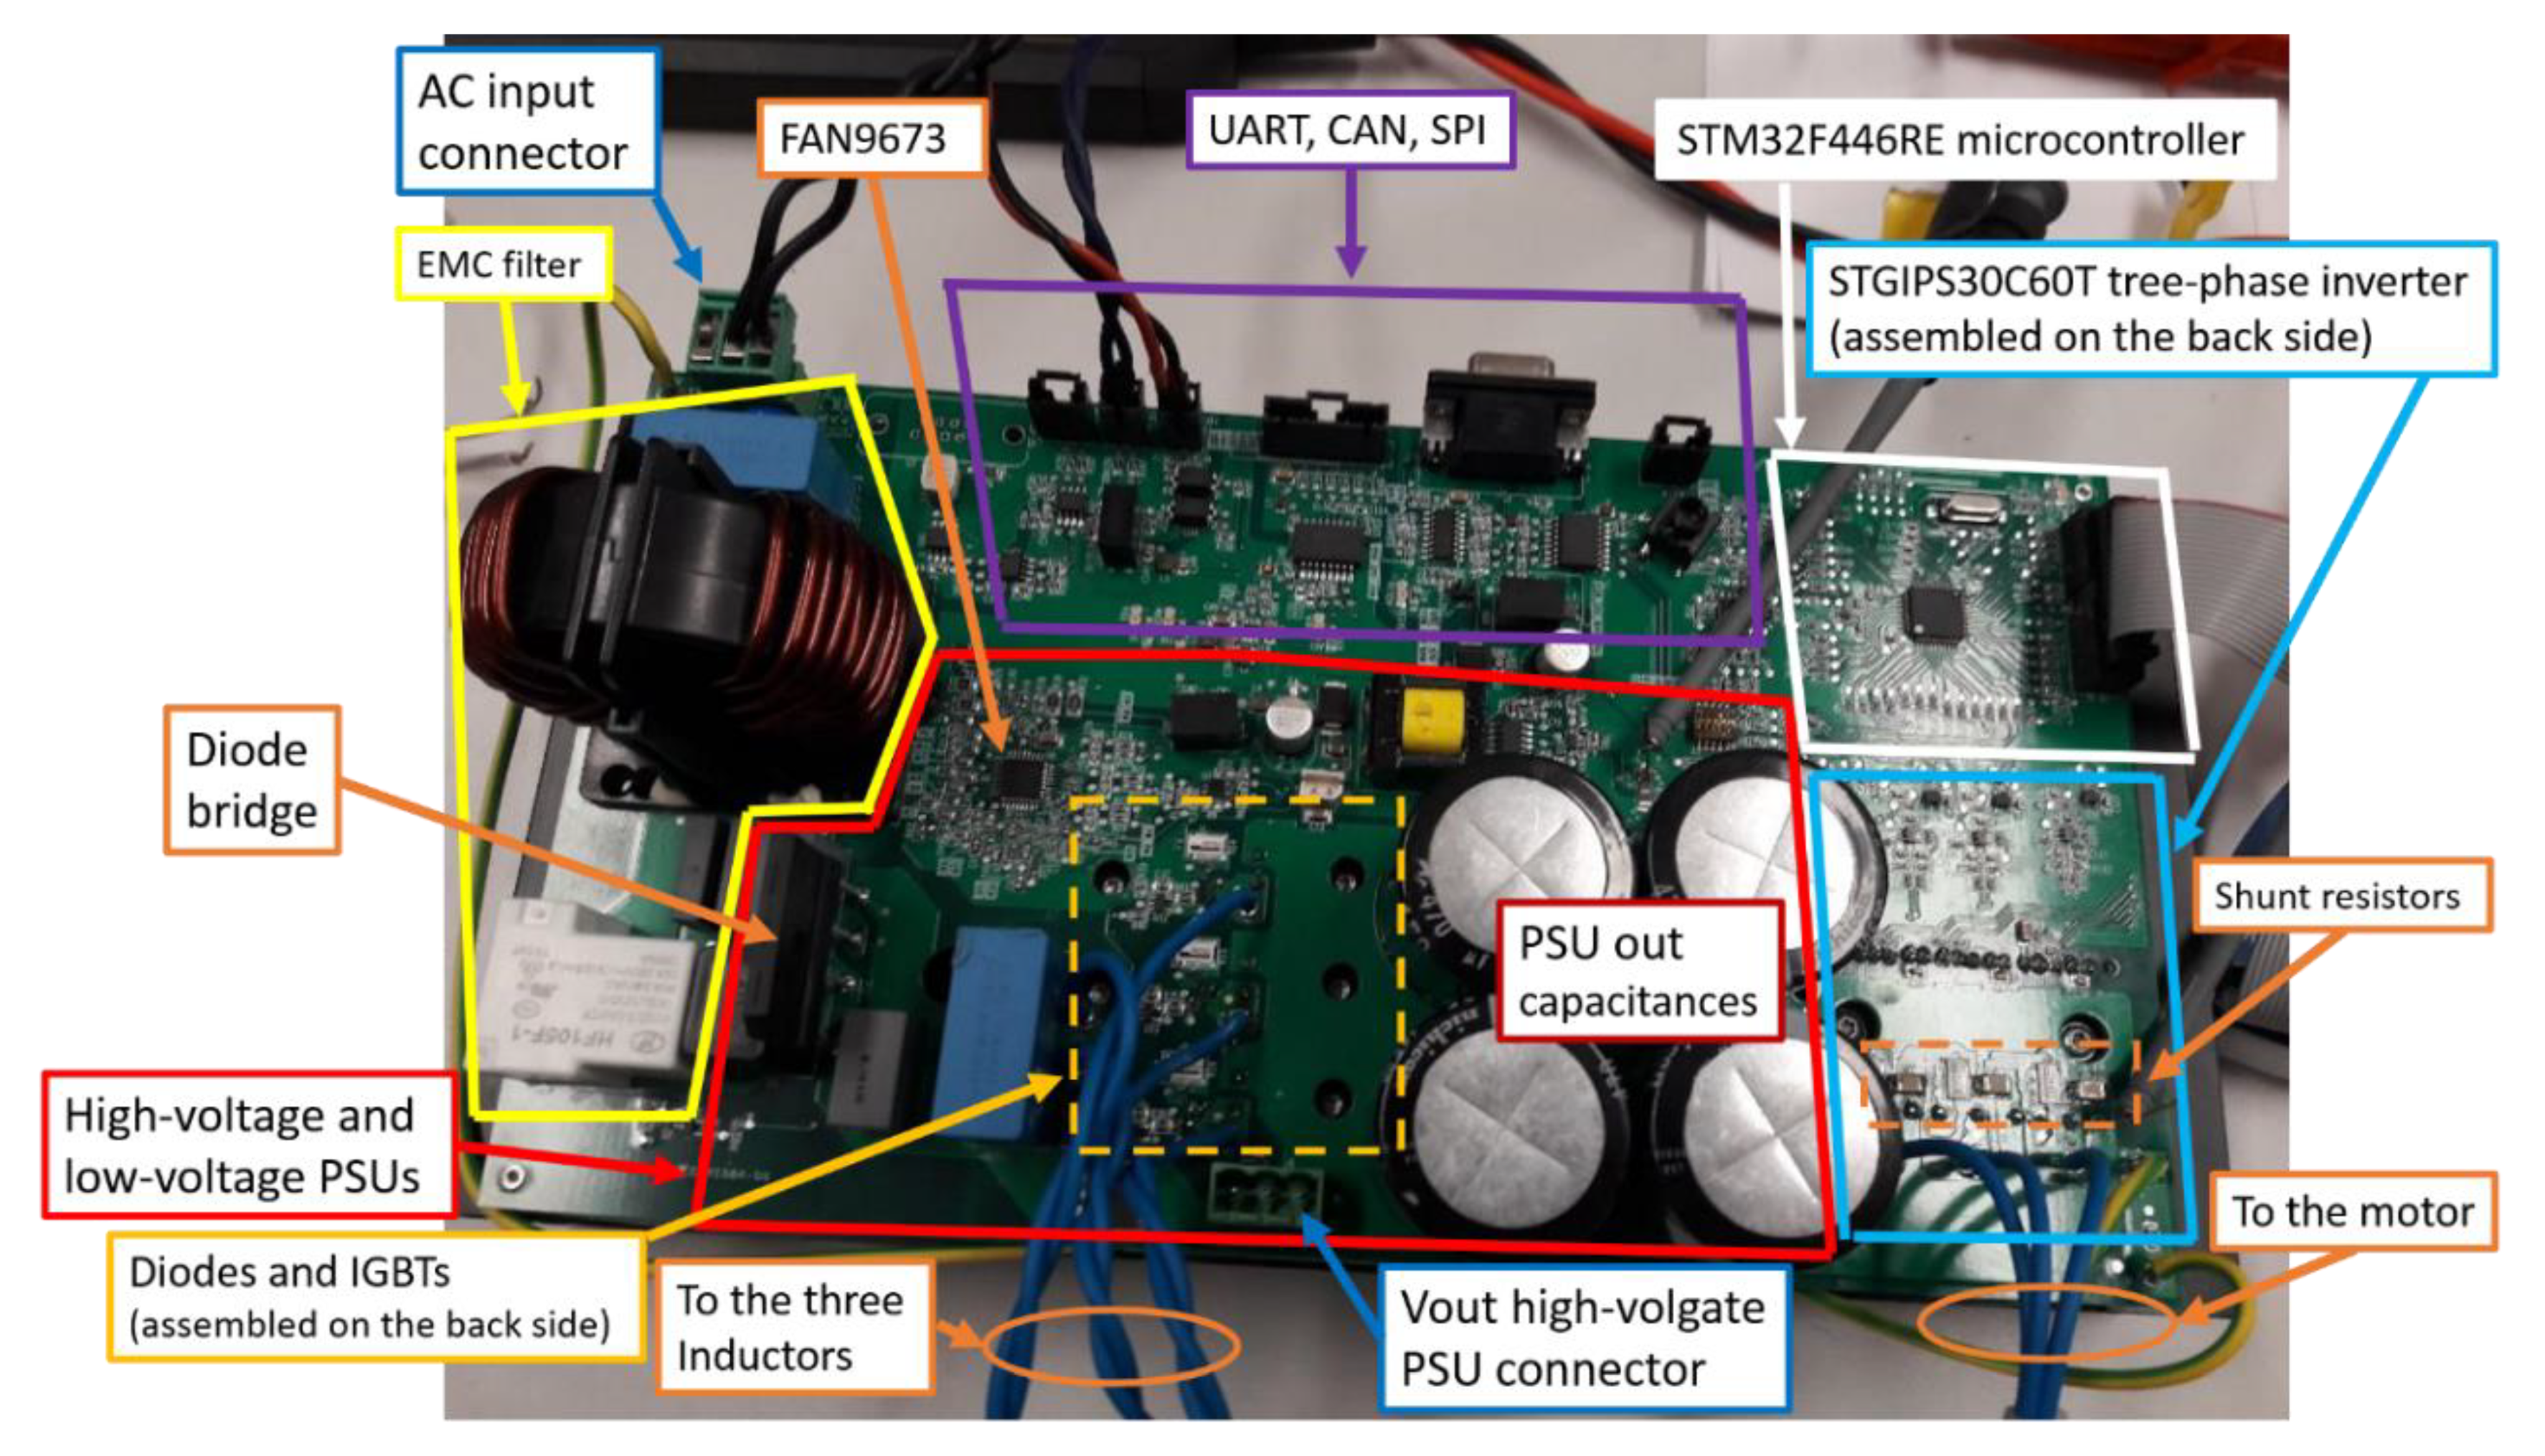
4.1. The Motor Control System Overview
4.1.1. The Three-Phase Inverter Subsystem
4.1.2. The Current Sense Subsystem
4.1.3. The Encoder Subsystem
4.1.4. The Microcontroller Subsystem
4.1.5. The Communication Subsystems
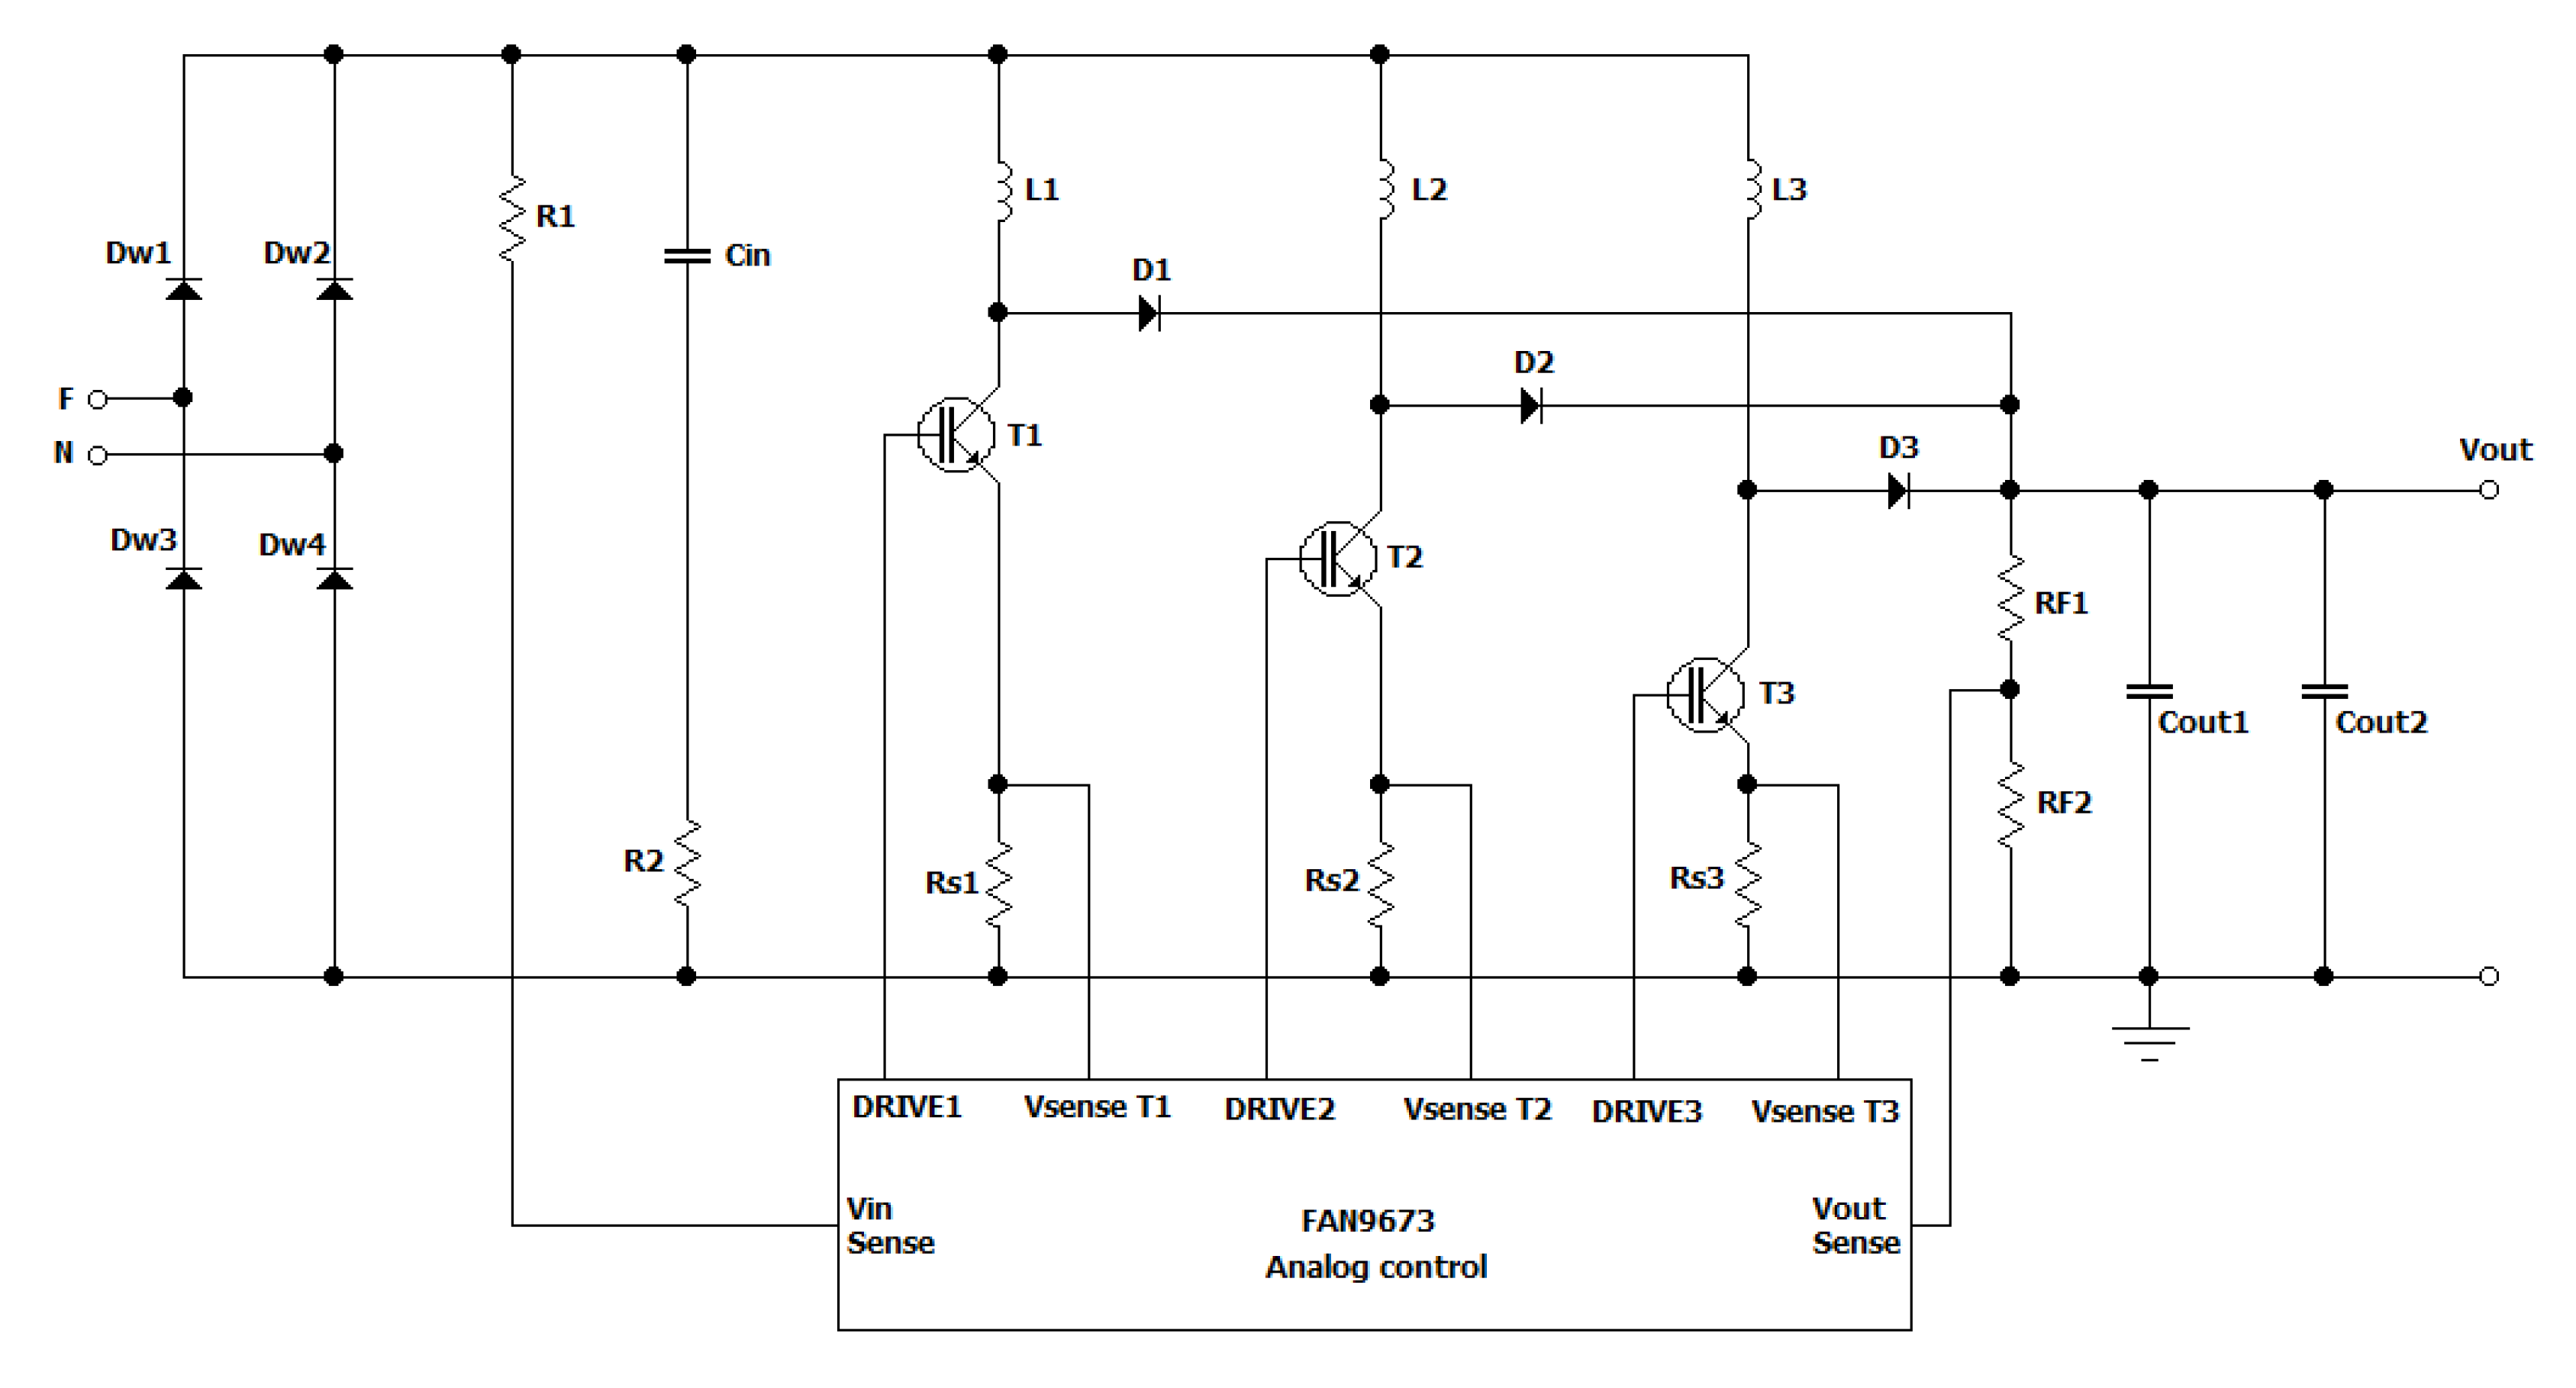
4.1.6. The Power Supply Unit Subsystems
5. Experimental Results
5.1. The PSU Fault Considered
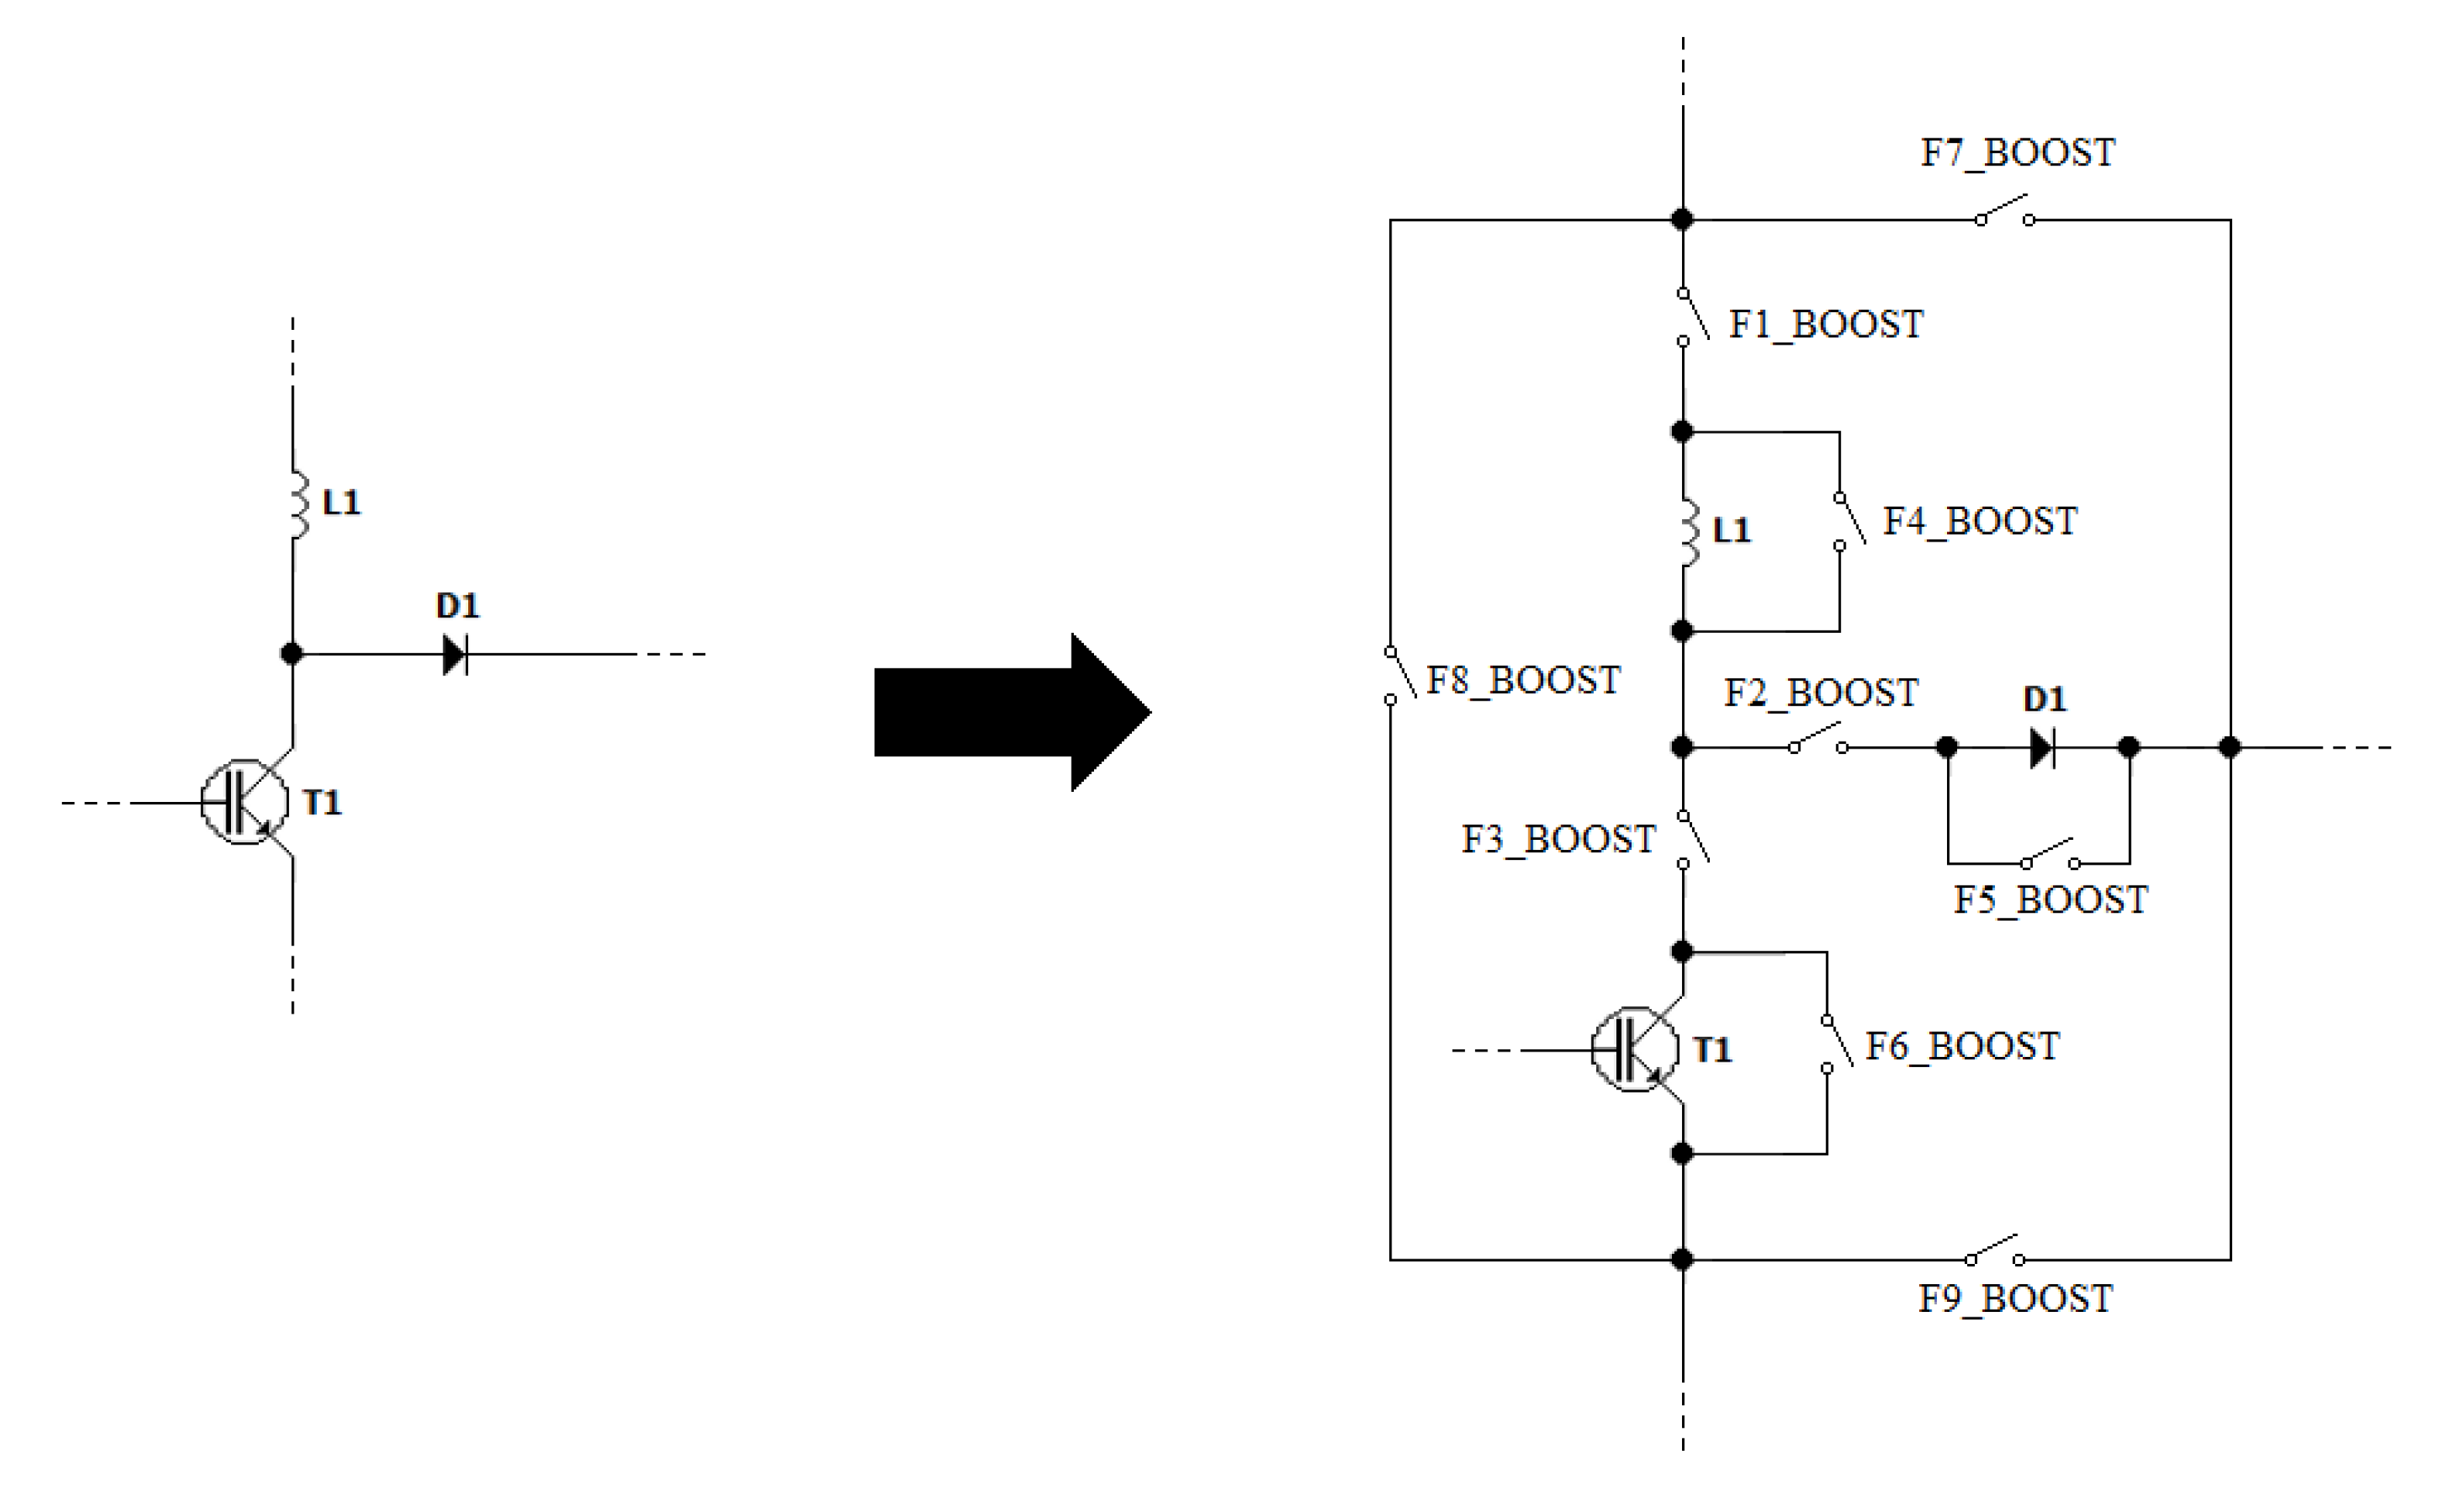
5.1.1. Boost Cell Faults
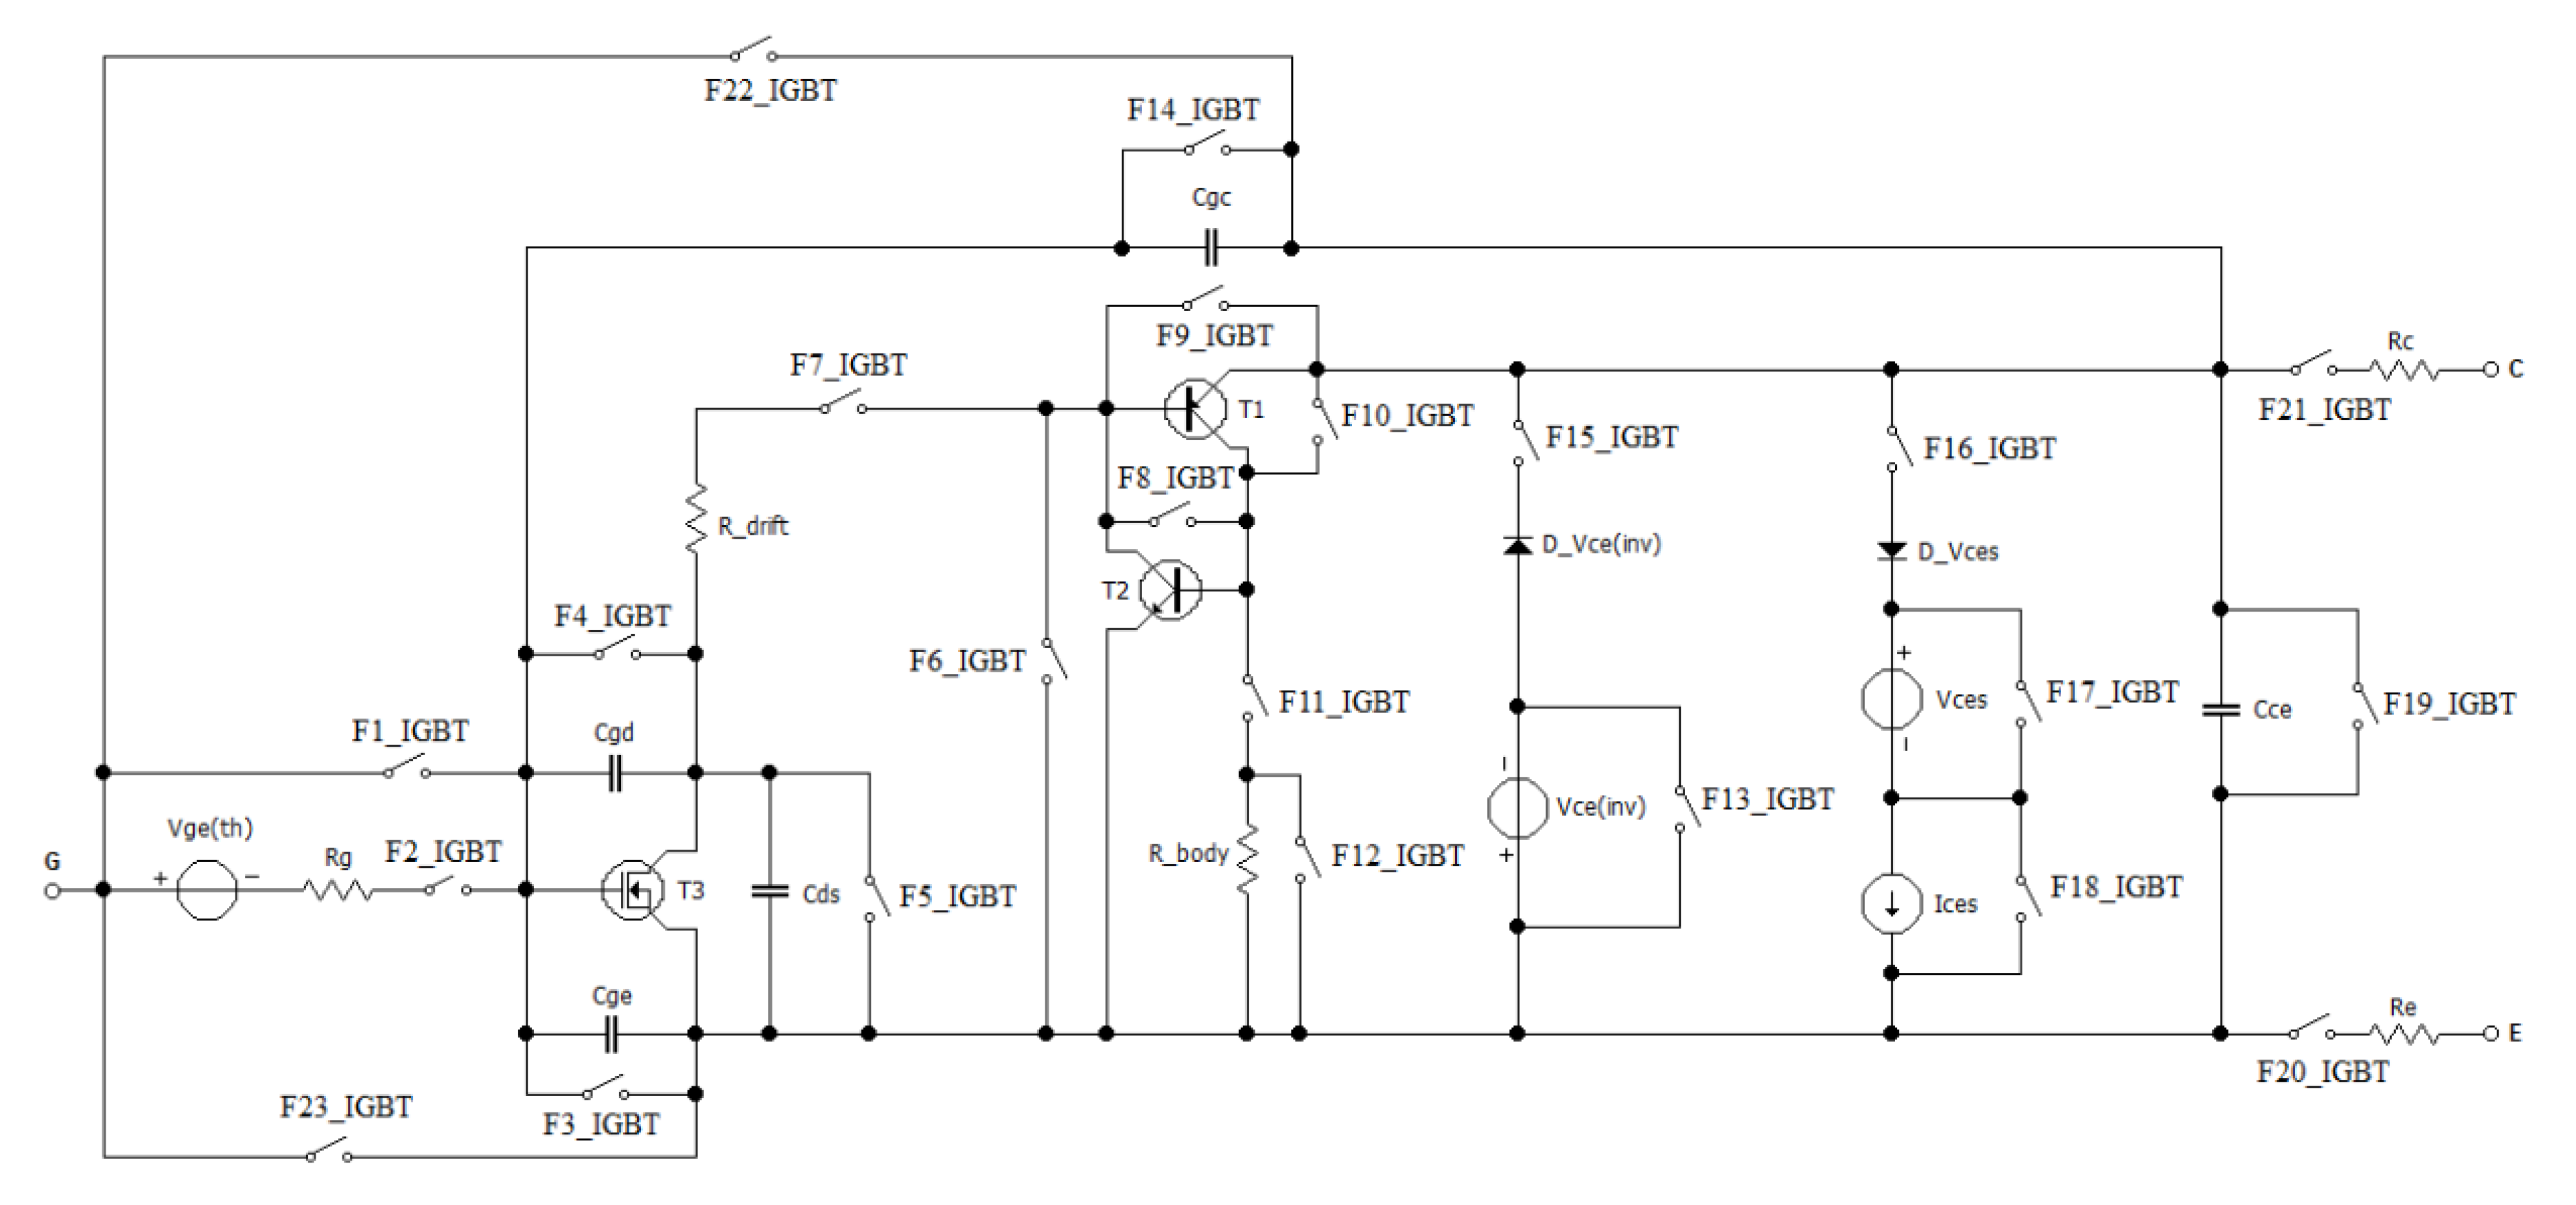
5.1.2. IGBT Power Device Faults
5.2. The FMECA Results
5.3. Environment Setup
6. Conclusions
Author Contributions
Funding
Acknowledgments
Conflicts of Interest
References
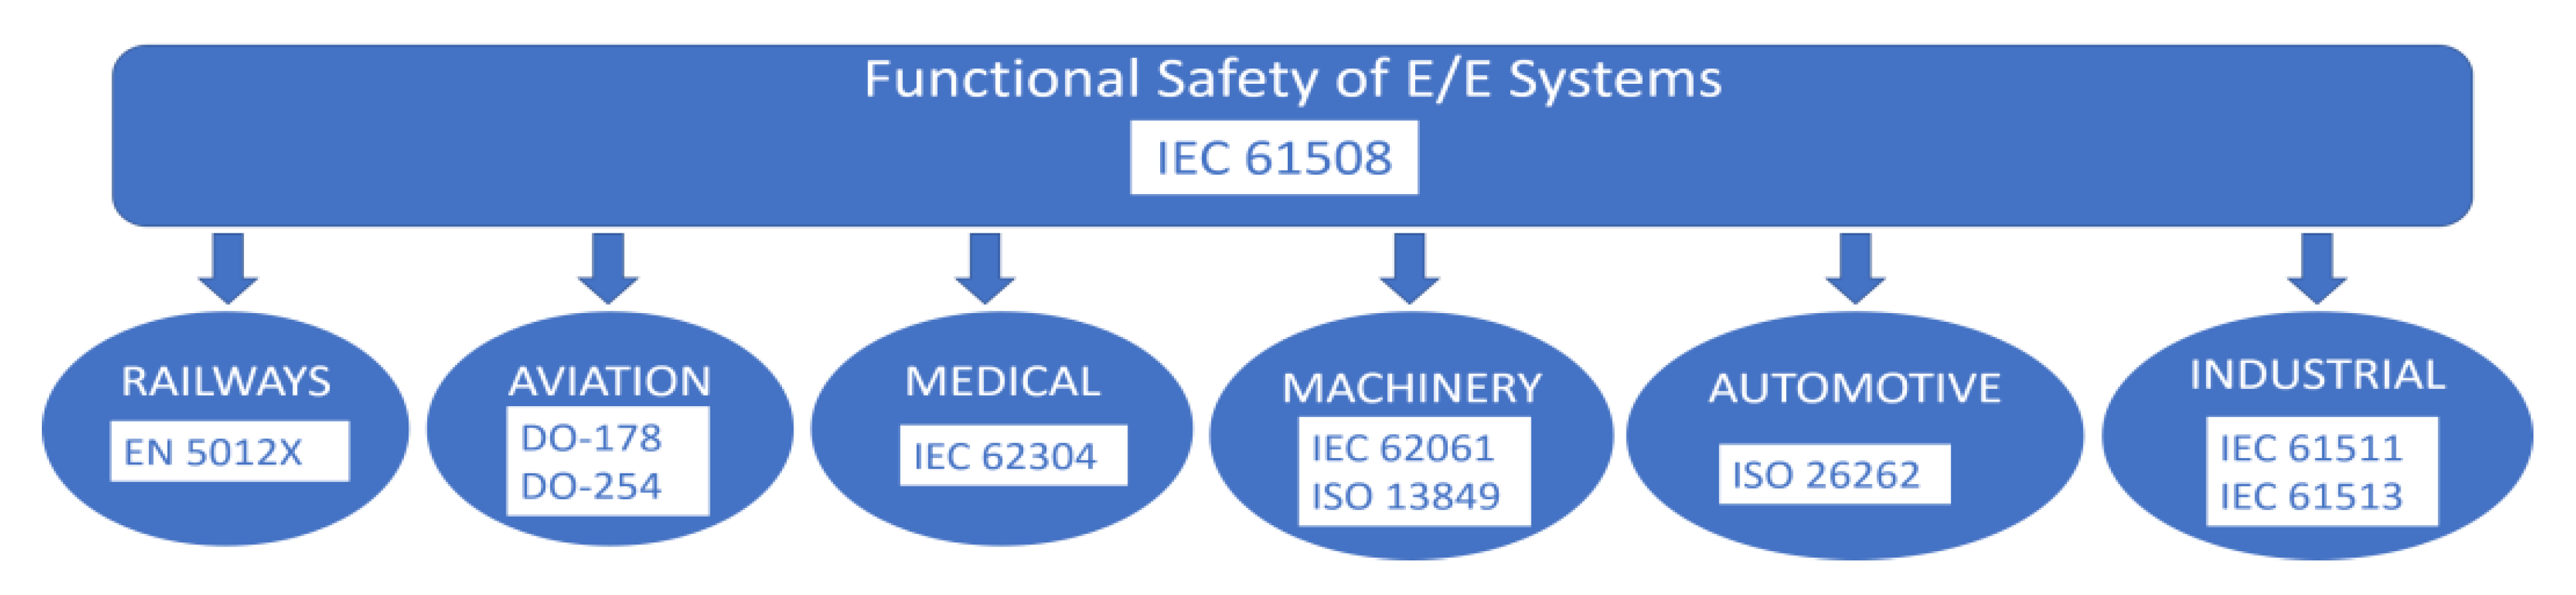
- Gall, H. Functional Safety IEC 61508/IEC 61511 the Impact to Certification and the User. In Proceedings of the IEEE/ACS International Conference on Computer Systems and Applications, Doha, Qatar, 31 March–4 April 2008. [Google Scholar]
- Rivett, R.; Habli, I.; Kelly, T. Automotive Functional Safety and Robustness Never the Twain or Hand in Glove? In Proceedings of the CARS Critical Automotive Applications: Robustness & Safety, Paris, France, 4 September 2015. [Google Scholar]
- Bagalini, E.; Sini, J.; Reorda, M.S.; Violante, M.; Klimesch, H.; Sarson, P. An automatic approach to perform the verification of hardware designs according to the ISO26262 functional safety standard. In Proceedings of the 18th IEEE Latin American Test Symposium (LATS), Bogota, Colombia, 13–15 March 2017. [Google Scholar]
- Çetin, E.N. FMECA applications and lessons learnt. In Proceedings of the Annual Reliability and Maintainability Symposium (RAMS), Palm Harbor, FL, USA, 26–29 January 2015. [Google Scholar]
- ISO26262. Road Vehicles—Functional Safety. 2011. Available online: https://www.iso.org/obp/ui/#iso:std:iso:26262:-1:ed-1:v1:en (accessed on 17 December 2018).
- Peyghami, S.; Davari, P.; F-Firuzabad, M.; Blaabjerg, F. Failure Mode, Effects and Criticality Analysis (FMECA) in Power Electronic based Power Systems. In Proceedings of the 21st European Conference on Power Electronics and Applications (EPE ’19 ECCE Europe), Genova, Italy, 3–5 September 2019. [Google Scholar]
- Cickaric, L.S.; Katic, V.A.; Milic, S. Failure Modes and Effects Analysis of Urban Rooftop PV Systems—Case Study. In Proceedings of the International Symposium on Industrial Electronics (INDEL), Banja Luka, Bosnia and Herzegovina, 1–3 November 2018. [Google Scholar]
- Zhang, Z.; Hao, M. Failure Mode and Effects Analysis of UAV Power System Based on Generalized Dempster-Shafer Structures. In Proceedings of the 2019 IEEE International Conference on Unmanned Systems (ICUS), Beijing, China, 17–19 October 2019. [Google Scholar]
- Banerjee, P.; Pandey, K. Implementation of Failure Modes and Effect Analysis on the electro-hydraulic servo valve for steam turbine. In Proceedings of the IEEE 1st International Conference on Power Electronics, Intelligent Control and Energy Systems (ICPEICES), Delhi, India, 4–6 July 2016. [Google Scholar]
- Sastry, A.; Kulasekaran, S.; Flicker, J.; Ayyanar, R.; Tamizhmani, G.; Roy, J.; Srinivasan, D.; Tilford, I. Failure modes and effect analysis of module level power electronics. In Proceedings of the 42nd Photovoltaic Specialist Conference (PVSC), New Orleans, LA, USA, 14–19 June 2015. [Google Scholar]
- Rastayesh, S.; Bahrebar, S.; Bahman, A.S.; Sørensen, J.D.; Blaabjerg, F. Lifetime Estimation and Failure Risk Analysis in a Power Stage Used in Wind-Fuel Cell Hybrid Energy Systems. Electronics 2019, 8, 1412. [Google Scholar] [CrossRef]
- Singh, V.; Pahuja, G. Failure Modes and Effects Analysis Using Fuzzy Logic for Electric Vehicle Inverter. In Proceedings of the 3rd IEEE International Conference on Recent Trends in Electronics, Information & Communication Technology (RTEICT), Bangalore, India, 18–19 May 2018. [Google Scholar]
- Sini, J.; D’Auria, M.; Violante, M. Towards Vehicle-Level Simulator Aided Failure Mode, Effect, and Diagnostic Analysis of Automotive Power Electronics Items. In Proceedings of the 2020 IEEE Latin-American Test Symposium (LATS), Maceio, Brazil, 30 March–2 April 2020. [Google Scholar]
- Floridia, A.; Sanchez, E.; Reorda, M.S. Fault Grading Techniques of Software Test Libraries for Safety-Critical Applications. IEEE Access 2019, 7, 63578–63587. [Google Scholar] [CrossRef]
- Parker, K.P. A New Process for Measuring and Displaying Board Test Coverage. In Proceedings of the Apex 2003, Anaheim, CA, USA, 4 September 2003; Available online: https://www.keysight.com/upload/cmc_upload/All/Apex_KParker_010903.pdf (accessed on 4 September 2003).
- Borutzky, W. Combining behavioral block diagram modeling with circuit simulation. In Computer Aided Systems Theory—EUROCAST ’89; Pichler, F., Moreno-Diaz, R., Eds.; EUROCAST 1989. Lecture Notes in Computer Science; Springer: Berlin/Heidelberg, Germany, 1990; Volume 410. [Google Scholar] [CrossRef]
- Hellerstein, J.L.; Diao, Y.; Parekh, S.; Tilbury, D.M. Feedback Control of Computing Systems; Wiley-IEEE Press: Hoboken, NJ, USA, 2004. [Google Scholar]
- Hick, H.; Bajzek, M.; Faustmann, C. Definition of a system model for model-based development. SN Appl. Sci. 2019, 1, 1074. [Google Scholar] [CrossRef]
- Rutenbar, R.A.; Gielen, G.G.E.; Antao, B.A. Multilevel and mixed-domain simulation of analog circuits and systems. IEEE Trans. Comput. Aided Des. Integr. Circuits Syst. 1996, 15, 68–82. [Google Scholar]
- Pletea, I.-V.; Alexa, D.; Goras, T. Multilevel modeling and simulation of a switched reluctance machine. In Proceedings of the 24th International Spring Seminar on Electronics Technology, Concurrent Engineering in Electronic Packaging, ISSE 2001, Conference Proceedings (Cat. No.01EX492), Calimanesti-Caciulata, Romania, 5–9 May 2001; pp. 248–252. [Google Scholar]
- Shen, M. Fast Simulation Model of Hybrid Modular Multilevel Converters for CPU. In Proceedings of the 2019 3rd International Conference on Electronic Information Technology and Computer Engineering (EITCE), Xiamen, China, 18–20 October 2019; pp. 32–36. [Google Scholar]
- Liu, H.; Tolbert, L.M.; Ozpineci, B.; Du, Z. Hybrid multilevel inverter with single DC source. In Proceedings of the 2008 51st Midwest Symposium on Circuits and Systems, Knoxville, TN, USA, 10–13 August 2008; pp. 538–541. [Google Scholar]
- Wu, M.; Wang, W. The multilevel simulation of analog circuits. In Proceedings of the IEEE APCCAS 2000, 2000 IEEE Asia-Pacific Conference on Circuits and Systems, Electronic Communication Systems. (Cat. No.00EX394), Tianjin, China, 4–6 December 2000; pp. 497–500. [Google Scholar]
- Van Duijsen, P.J. Multilevel modeling and simulation of power electronic systems. In Proceedings of the 1993 Fifth European Conference on Power Electronics and Applications, Brighton, UK, 13–16 September 1993; Volume 4, pp. 347–352. [Google Scholar]
- PSIM tool, PowerSim, User Manual. Available online: https://powersimtech.com/products/psim/ (accessed on 1 May 2020).
- MATLAB Tool, Mathworks, User Manual. Available online: https://it.mathworks.com (accessed on 1 May 2020).
- Mentor. Testing Analog/Mixed-Signal Circuits Tessent DefectSim. Available online: http://s3.mentor.com/public_documents/datasheet/products/silicon-yield/tessent-defectsim-ds.pdf (accessed on 12 June 2020).
- Synopsys. Synopsys TestMAX CustomFault. Available online: https://www.synopsys.com/content/dam/synopsys/implementation&signoff/datasheets/testmax-customfault-ds.pdf (accessed on 30 July 2020).
- Slamani, M.; Kaminska, B. Analog circuit fault diagnosis based on sensitivity computation and functional testing. IEEE Des. Test Comput. 1992, 9, 30–39. [Google Scholar] [CrossRef]
- Arabi, A.; Bourouba, N.; Belaout, A.; Ayad, M. Catastrophic faults detection of analog circuits. In Proceedings of the 7th International Conference on Modelling, Identification and Control (ICMIC), Sousse, Tunisia, 18–20 December 2015. [Google Scholar]
- Duhamel, P.; Rault, J. Automatic test generation techniques for analog circuits and systems: A review. IEEE Trans. Circuits Syst. 1979, 26, 411–440. [Google Scholar] [CrossRef]
- ISO26262 Standard. Available online: https://www.iso.org/standard/43464.html (accessed on 12 November 2011).
- AIAG & VDA. AIAG & VDA FMEA Handbook; FMEAAV-1; AIAG & VDA: Southfield, MI, USA, 2019. [Google Scholar]
- ECSS. ECSS-Q-ST-30-02C Handbook; ECSS: Cologne, Germany, 2009. [Google Scholar]
- Sini, J.; Violante, M. An Automatic Approach to Perform FMEDA Safety Assessment on Hardware Designs. In Proceedings of the 2018 IEEE 24th International Symposium on On-Line Testing and Robust System Design (IOLTS), Platja d’Aro, Spain, 2–4 July 2018. [Google Scholar]
- Milanovič, M.; Rodič, M.; Truntic, M. Functional safety in power electronics converters. In Proceedings of the 2017 19th International Conference on Electrical Drives and Power Electronics (EDPE), Dubrovnik, Croatia, 4–6 October 2017. [Google Scholar]
- Piumatti, D.; Borlo, S.; Reorda, M.S.; Bojoi, R. Assessing the effectiveness of different test approaches for power devices in a PCB. IEEE J. Emerg. Sel. Top. Power Electron. 2020, 1. [Google Scholar] [CrossRef]
- Piumatti, D.; Reorda, M.S. Assessing Test Procedure Effectiveness for Power Devices. In Proceedings of the 2018 Conference on Design of Circuits and Integrated Systems (DCIS), Lyon, France, 14–16 November 2018. [Google Scholar]
- Piumatti, D.; Borlo, S.; Mandrile, F.; Reorda, M.S.; Bojoi, R. Assessing the Effectiveness of the Test of Power Devices at the Board Level. In Proceedings of the XXXIV Conference on Design of Circuits and Integrated Systems (DCIS), Bilbao, Spain, 20–22 November 2019. [Google Scholar]
- STGIPS30C60T-H. Three-Phase Inverter, STMicroelectroncs, Datasheet. Available online: https://www.st.com/en/power-modules/stgips30c60t-h.html (accessed on 10 April 2015).
- STM32F446RE Microcontroller, STMicroelectroncs, Datasheet. Available online: https://www.st.com/en/microcontrollers-microprocessors/stm32f446re.html (accessed on 28 July 2020).
- STMicroelectroncs. System-Adaptive Real-Time Accelerator ART. Available online: https://www.st.com/content/ccc/resource/training/technical/product_training/group0/7d/83/8c/1f/3a/1c/43/1e/STM32H7-System-Adaptive_Real-Time_Accelerator_ART/files/STM32H7-System-Adaptive_Real-Time_Accelerator_ART.pdf/_jcr_content/translations/en.STM32H7-System-Adaptive_Real-Time_Accelerator_ART.pdf (accessed on 27 May 2020).
- STTH12S06 Power Diode, STMicroelectroncs, Datasheet. Available online: https://www.st.com/en/diodes-and-rectifiers/stth12s06.html (accessed on 2 February 2020).
- STGF19NC60 Power IGBT, STMicroelectroncs, Datasheet. Available online: https://www.st.com/content/st_com/en/products/power-transistors/igbts/stpower-igbts-600-650v/stgf19nc60hd.html (accessed on 19 October 2020).
- FAN9673 PFC/PSU Analog Controller, ON Semiconductor, Datasheet. Available online: https://www.onsemi.com/products/power-management/ac-dc-controllers-regulators/power-factor-controllers/fan9673 (accessed on 20 June 2019).
- Sunter, S. Analog Fault Simulation—A Hot Topic! In Proceedings of the 25th IEEE European Test Symposium (ETS), Tallinn, Estonia, 25–29 May 2020. [Google Scholar]
- PLECS Tool, Plexim, User Manual. Available online: https://www.plexim.com/plecs (accessed on 5 June 2020).
- Gautschi, M.; Schiavone, P.D.; Traber, A.; Loi, I.; Pullini, A.; Rossi, D.; Flamand, E.; Gurkaynak, F.K.; Benini, L. Near-threshold risc-v core with dsp extensions for scalable iot endpoint devices. IEEE Trans. Very Large Scale Integr. Syst. 2017, 25, 2700–2713. [Google Scholar] [CrossRef]


| Nominal Value | Tolerance * | Tolerance Range | |
|---|---|---|---|
| U, V, W voltage | 400 V | 1% | 396–404 V |
| U, V, W current | 6 A | 2% | 5.88–6.12 A |
| Angular speed | 3000 RPM | 5% | 2850–3150 RPM |
| Vout high-voltage PSU | 400 V | 1% | 396–404 V |
| Faults | U, V, W Voltage [V] | U, V, W Current [A] | Angular Speed [RPM] | Vout High-Voltage PSU [V] | Critical |
|---|---|---|---|---|---|
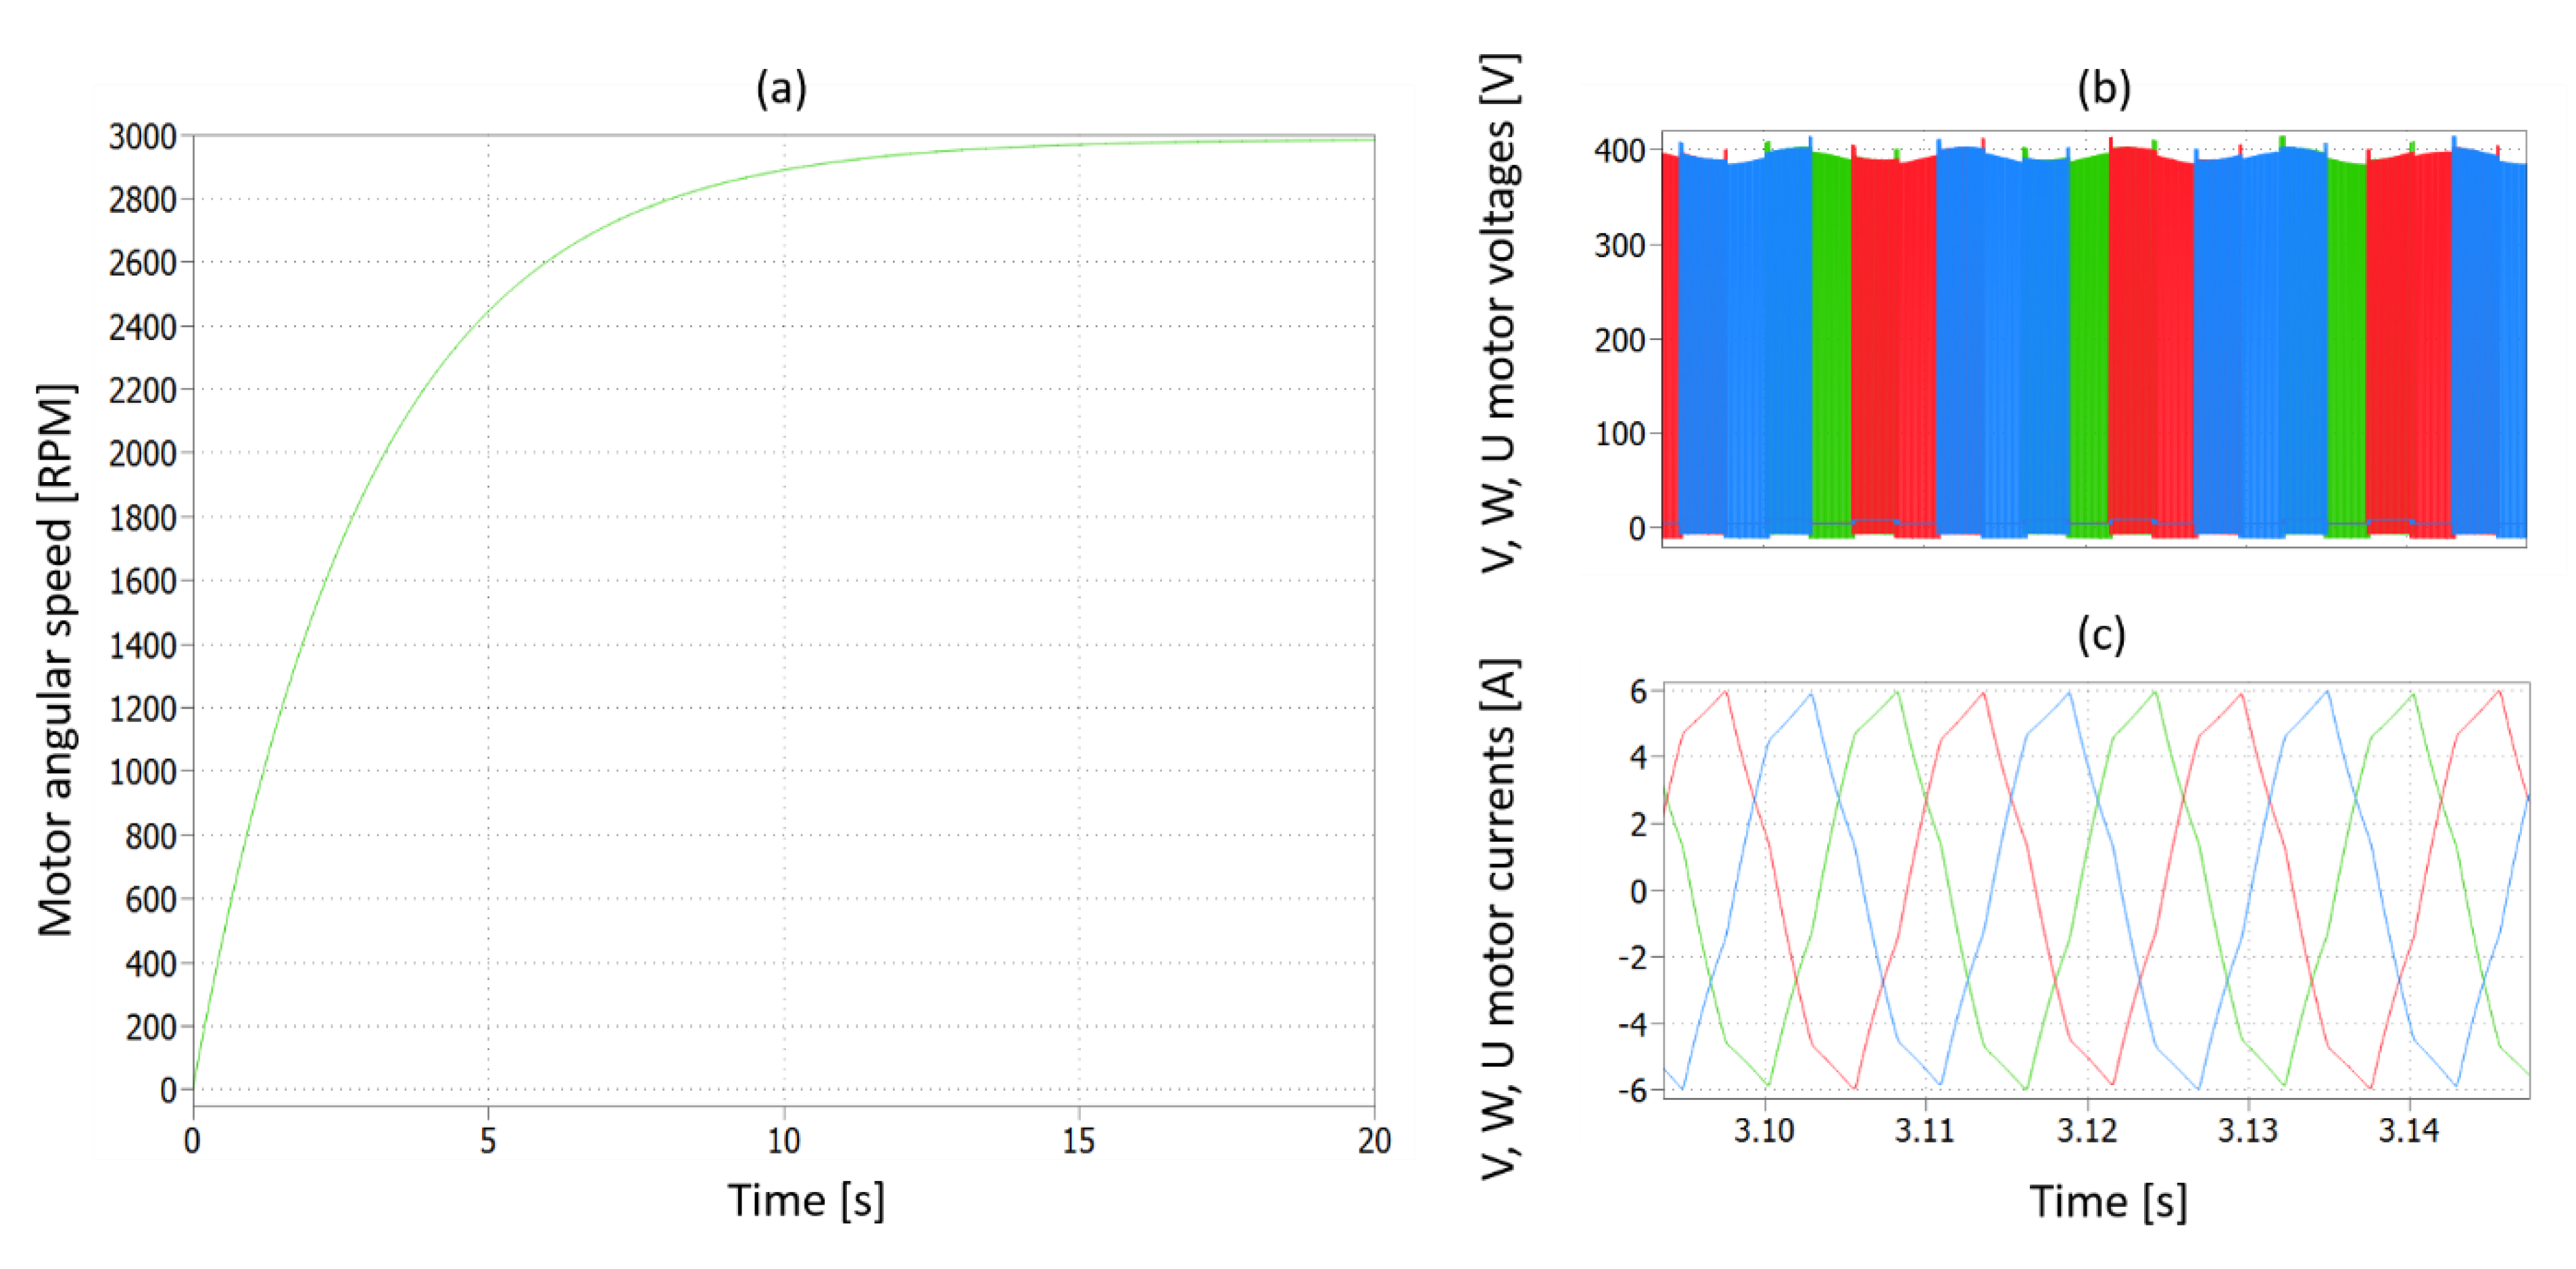
| Fault-free | 402 | 6.08 | 2979 | 400 V with ±7 V of ripple | - |
| F1_BOOST | 402 | 5.98 | 2979 | 400 V with ±7 V of ripple | NO |
| F2_BOOST | 263 | 4.26 | 1222 | 265 V with ±25 V of ripple | YES |
| F3_BOOST | 402 | 5.98 | 2979 | 400 V with ±7 V of ripple | NO |
| F4_BOOST | 402 | 5.98 | 2979 | 400 V with ±7 V of ripple | NO |
| F5_BOOST | 377 | 7.90 | 1718 | Vout instable | YES |
| F6_BOOST | 398 | 5.89 | 2866 | 397V with ±10 V of ripple | NO |
| F7_BOOST | 398 | 5.89 | 2866 | 397 V with ±10 V of ripple | NO |
| F8_BOOST | 0 | 0 | 0 | 0 V | YES |
| F9_BOOST | 0 | 0 | 0 | 0 V | YES |
| F1_IGBT | 402 | 5.98 | 2979 | 400 V with ±7 V of ripple | NO |
| F2_IGBT | 398 | 5.89 | 2866 | 397 V with ±10 V of ripple | NO |
| F3_IGBT | 398 | 5.89 | 2866 | 397 V with ±10 V of ripple | NO |
| F4_IGBT | 402 | 5.98 | 2979 | 400 V with ±7 V of ripple | NO |
| F5_IGBT | 398 | 5.89 | 2866 | 397 V with ±10 V of ripple | NO |
| F6_IGBT | 398 | 5.89 | 2866 | 397 V with ±10 V of ripple | NO |
| F7_IGBT | 402 | 5.98 | 2979 | 400 V with ±7 V of ripple | NO |
| F8_IGBT | 402 | 5.98 | 2979 | 400 V with ±7 V of ripple | NO |
| F9_IGBT | 402 | 5.98 | 2979 | 400 V with ±7 V of ripple | NO |
| F10_IGBT | 398 | 5.89 | 2866 | 397 V with ±10 V of ripple | NO |
| F11_IGBT | 402 | 5.98 | 2979 | 400 V with ±7 V of ripple | NO |
| F12_IGBT | 402 | 5.98 | 2979 | 400 V with ±7 V of ripple | NO |
| F13_IGBT | 402 | 5.98 | 2979 | 400 V with ±7 V of ripple | NO |
| F14_IGBT | 402 | 5.98 | 2979 | 400 V with ±7 V of ripple | NO |
| F15_IGBT | 402 | 5.98 | 2979 | 400 V with ±7 V of ripple | NO |
| F16_IGBT | 402 | 5.98 | 2979 | 400 V with ±7 V of ripple | NO |
| F17_IGBT | 402 | 5.98 | 2979 | 400 V with ±7 V of ripple | NO |
| F18_IGBT | 402 | 5.98 | 2979 | 400 V with ±7 V of ripple | NO |
| F19_IGBT | 398 | 5.89 | 2866 | 397 V with ±10 V of ripple | NO |
| F20_IGBT | 398 | 5.87 | 2866 | 397 V with ±10 V of ripple | NO |
| F21_IGBT | 398 | 5.93 | 2866 | 399 V with ±8 V of ripple | NO |
| F22_IGBT | 312 | 4.90 | 1585 | 300 V with ±20 V of ripple | YES |
| F23_IGBT | 312 | 4.90 | 1585 | 300 V with ±20 V of ripple | YES |
Publisher’s Note: MDPI stays neutral with regard to jurisdictional claims in published maps and institutional affiliations. |
© 2020 by the authors. Licensee MDPI, Basel, Switzerland. This article is an open access article distributed under the terms and conditions of the Creative Commons Attribution (CC BY) license (http://creativecommons.org/licenses/by/4.0/).
Share and Cite
Piumatti, D.; Sini, J.; Borlo, S.; Sonza Reorda, M.; Bojoi, R.; Violante, M. Multilevel Simulation Methodology for FMECA Study Applied to a Complex Cyber-Physical System. Electronics 2020, 9, 1736. https://doi.org/10.3390/electronics9101736
Piumatti D, Sini J, Borlo S, Sonza Reorda M, Bojoi R, Violante M. Multilevel Simulation Methodology for FMECA Study Applied to a Complex Cyber-Physical System. Electronics. 2020; 9(10):1736. https://doi.org/10.3390/electronics9101736
Chicago/Turabian StylePiumatti, Davide, Jacopo Sini, Stefano Borlo, Matteo Sonza Reorda, Radu Bojoi, and Massimo Violante. 2020. "Multilevel Simulation Methodology for FMECA Study Applied to a Complex Cyber-Physical System" Electronics 9, no. 10: 1736. https://doi.org/10.3390/electronics9101736
APA StylePiumatti, D., Sini, J., Borlo, S., Sonza Reorda, M., Bojoi, R., & Violante, M. (2020). Multilevel Simulation Methodology for FMECA Study Applied to a Complex Cyber-Physical System. Electronics, 9(10), 1736. https://doi.org/10.3390/electronics9101736