IoT Based Smart Parking System Using Deep Long Short Memory Network

 ,
,  , , ,
, , ,  , ,
, ,  ,
, 
Abstract
1. Introduction
2. Literature Review
3. Methodology
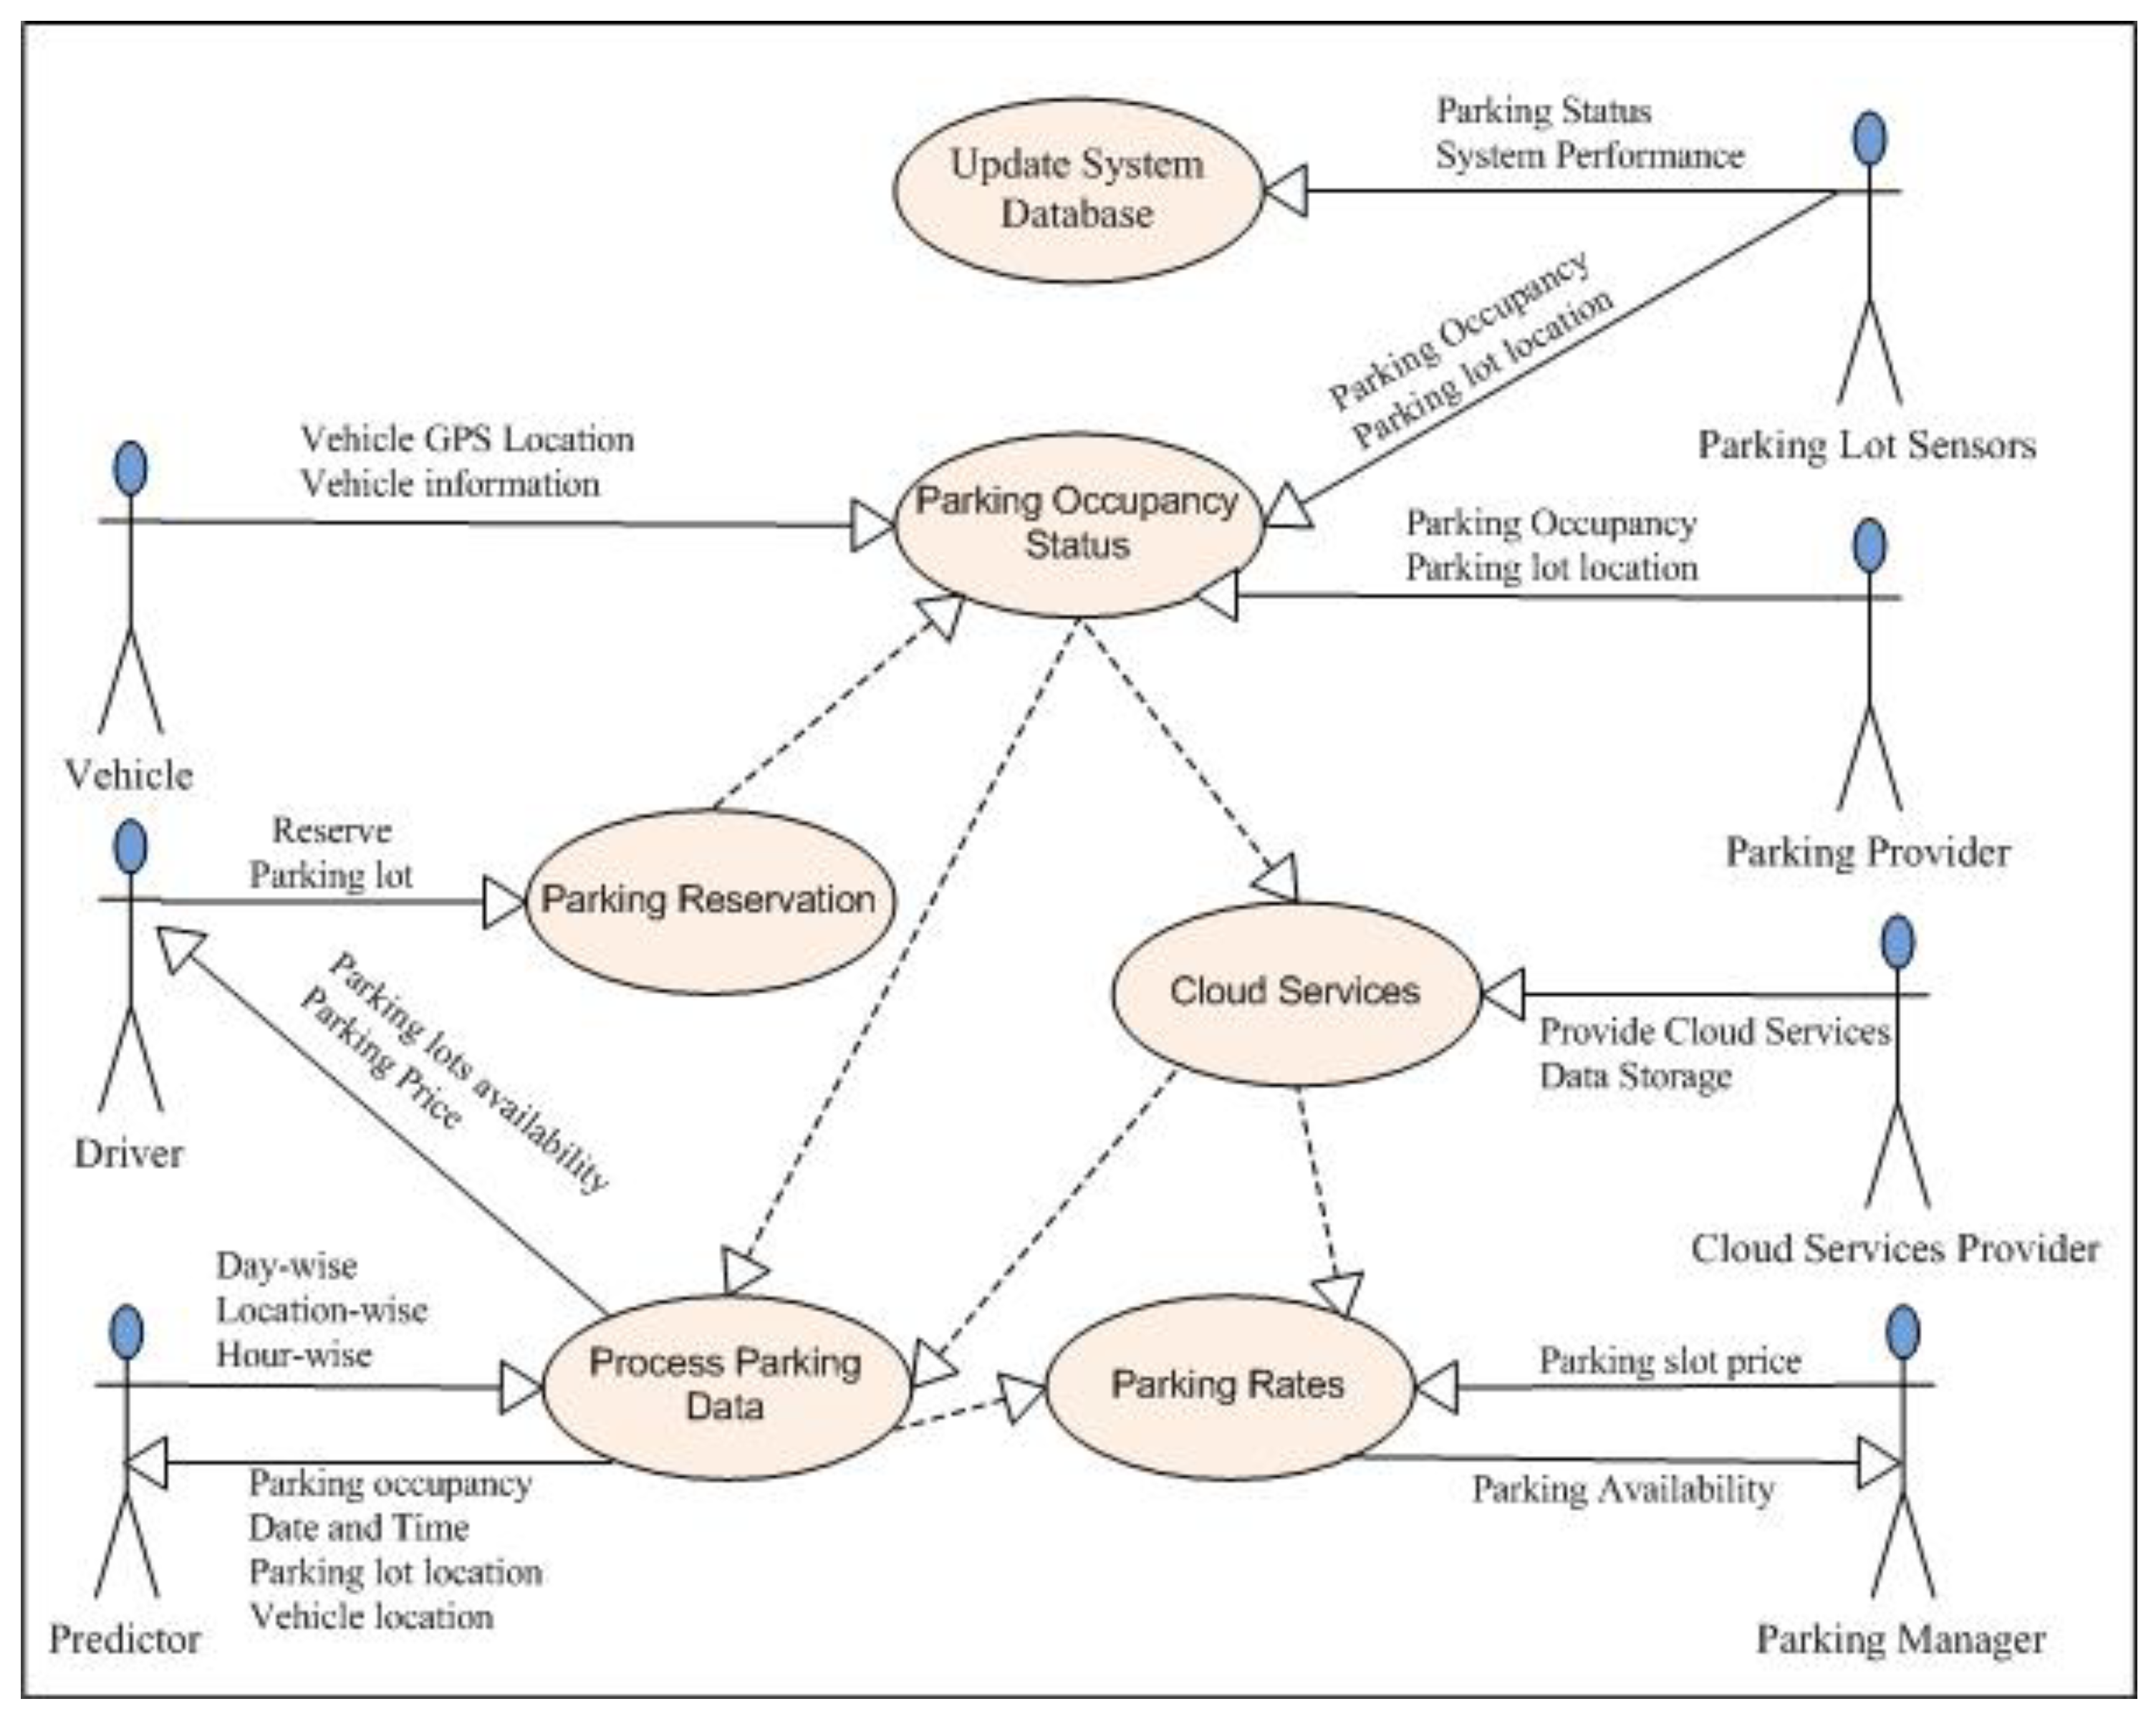
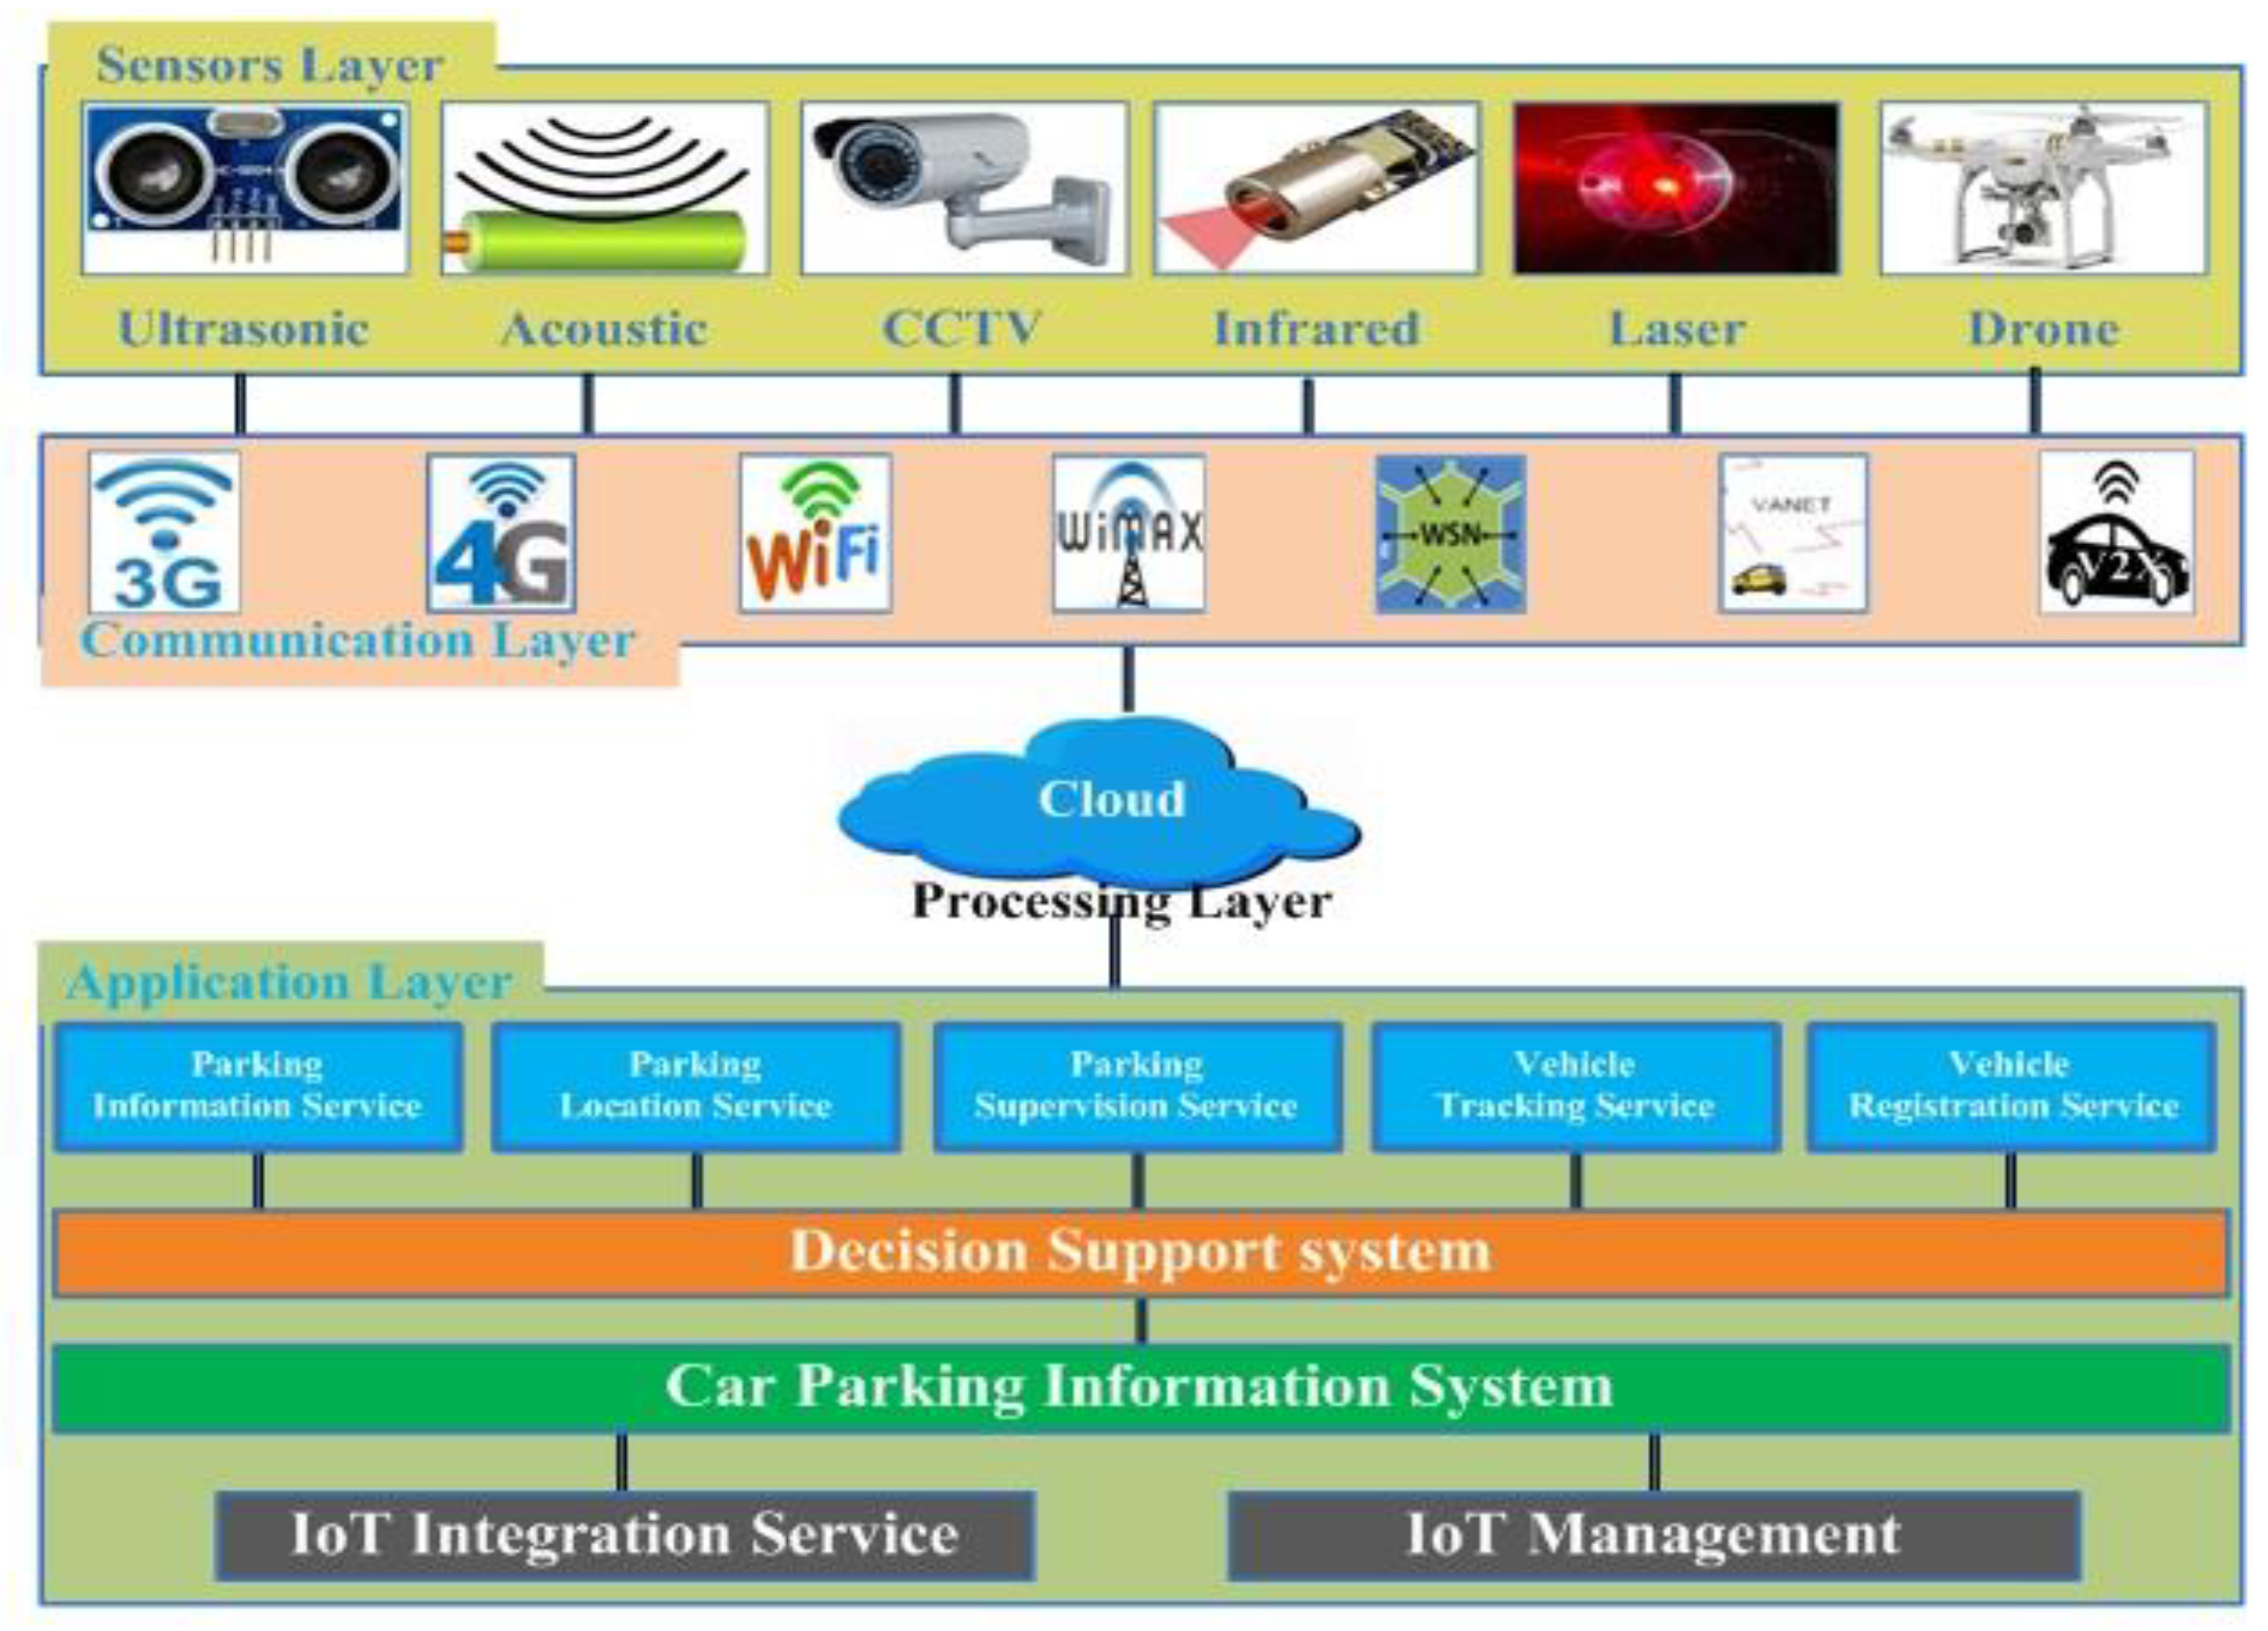
3.1. Car Parking Information System
3.2. Decision Support System
3.3. Performance Evaluation Techniuqes
3.4. Dataset
3.5. Data Processing
3.6. Ethics
4. Results
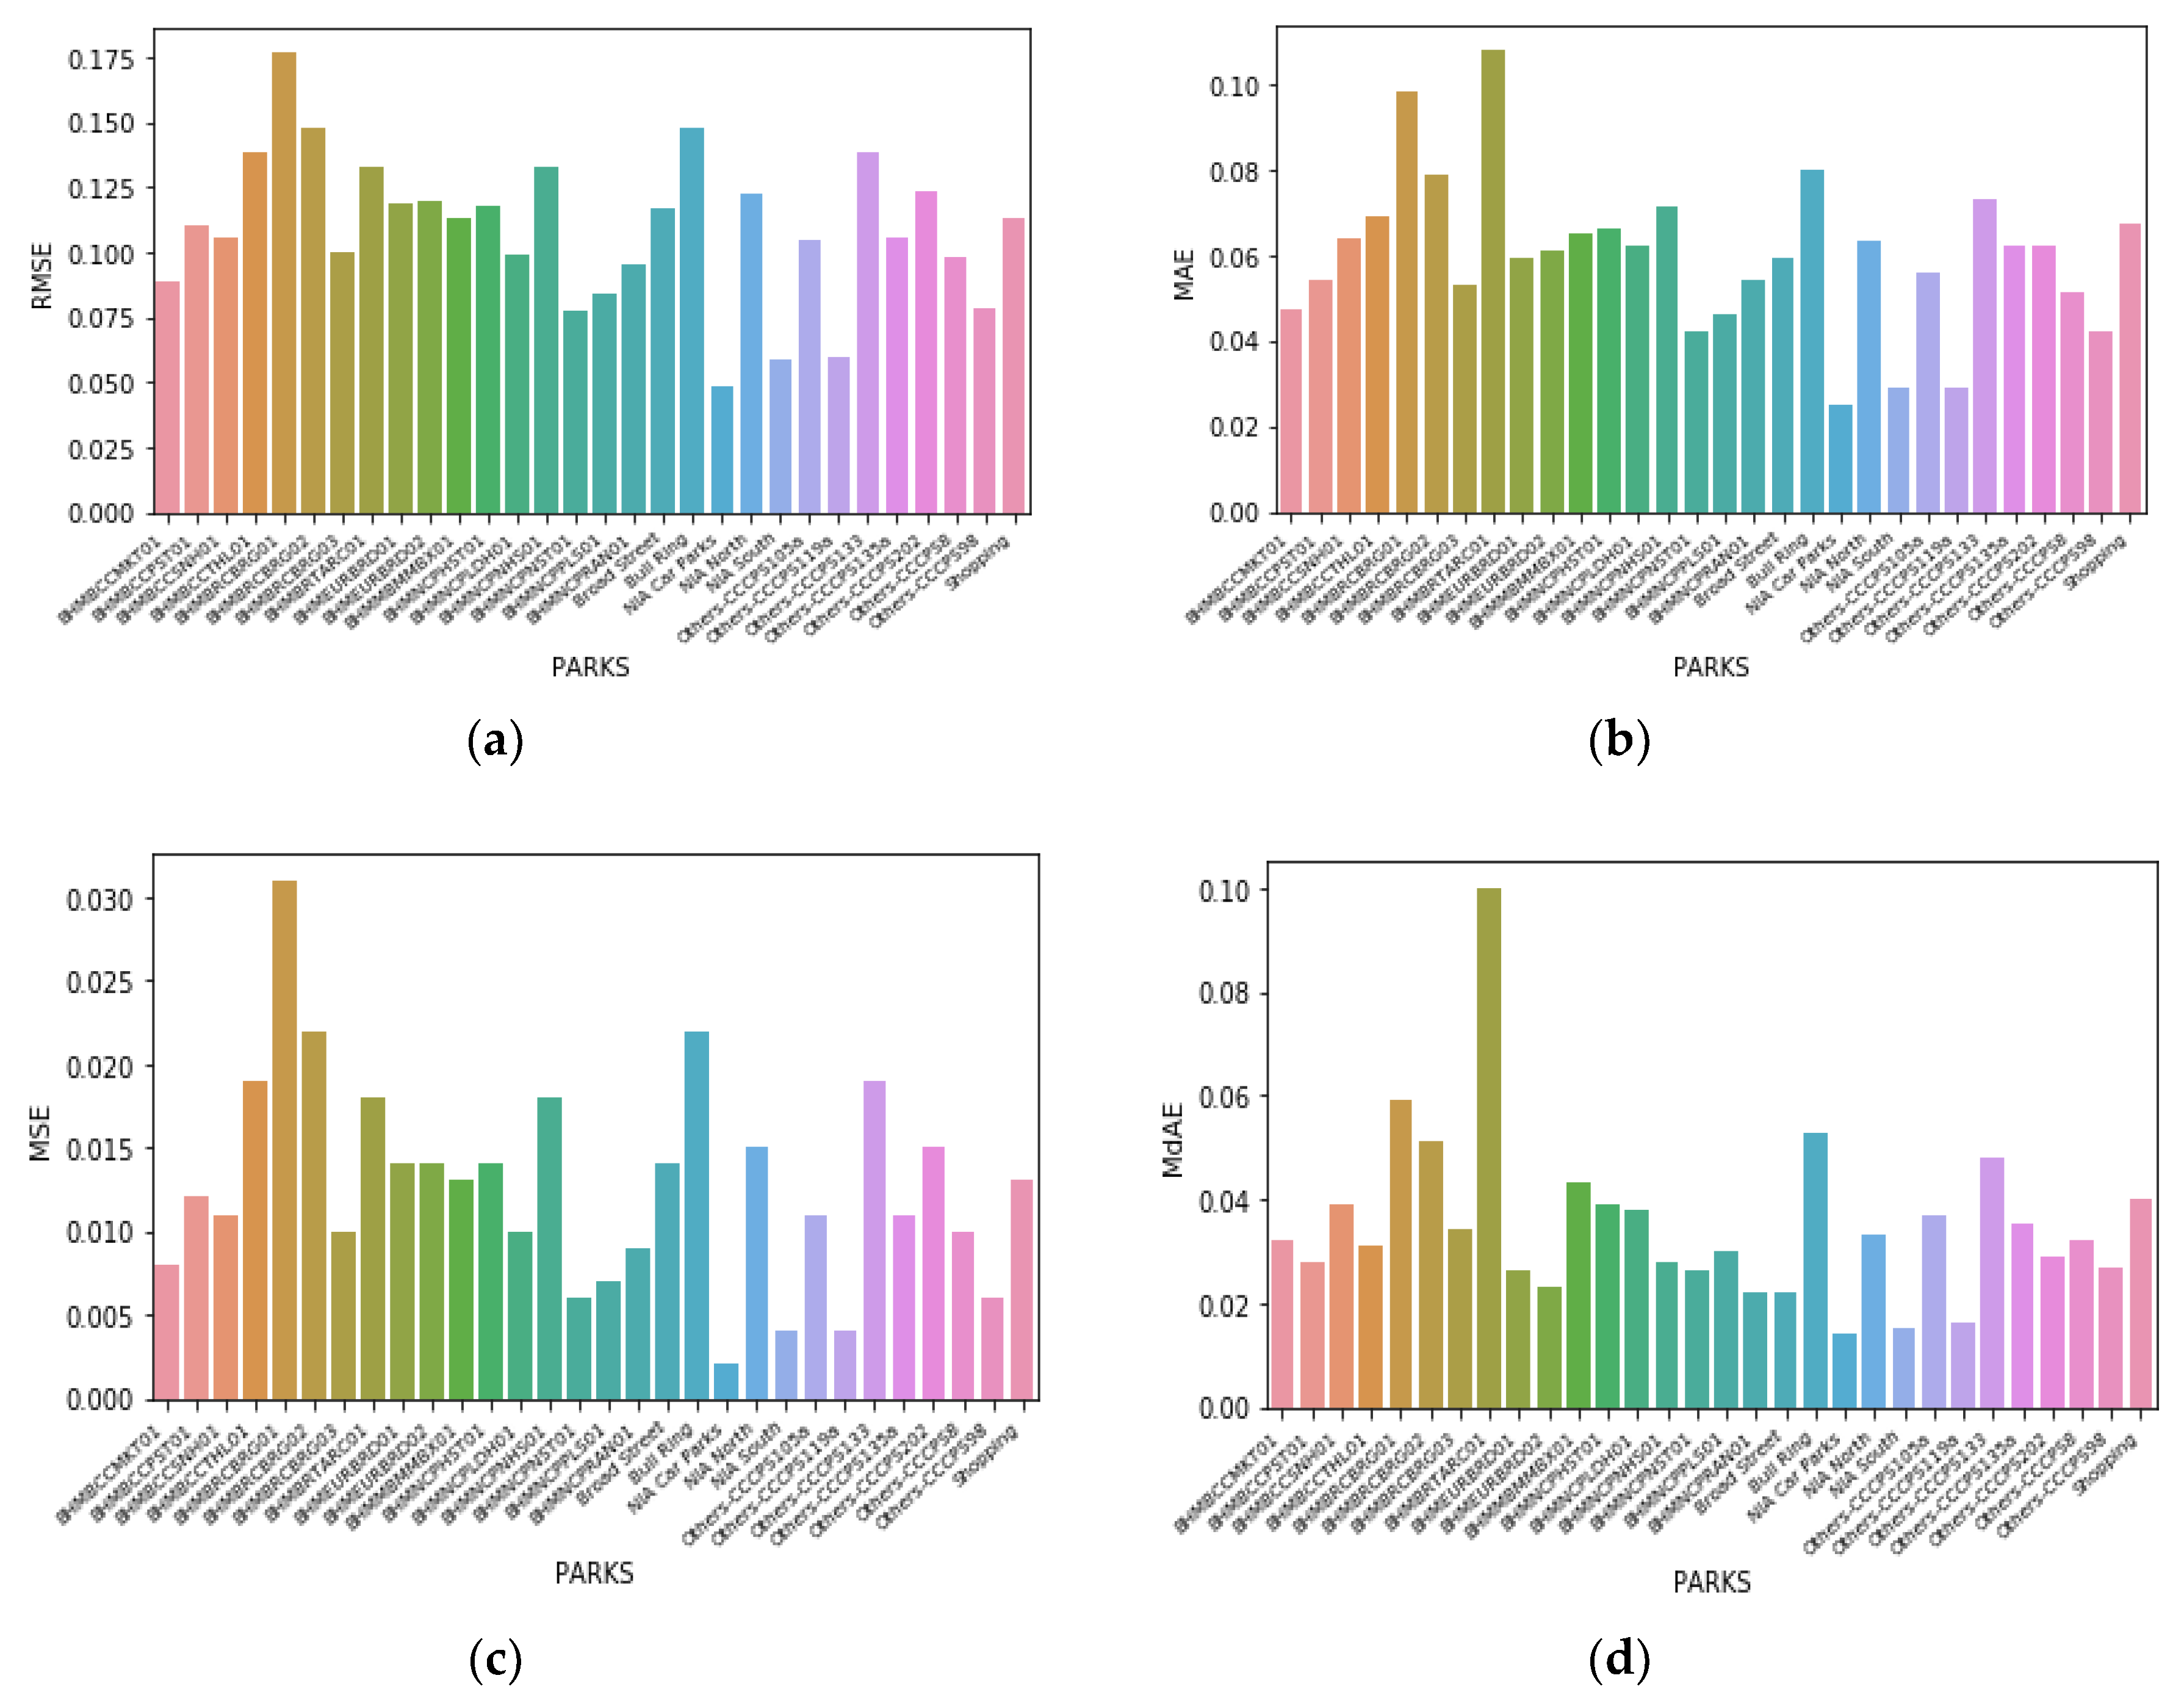
4.1. Parking Location Wise Parking Space Occupancy
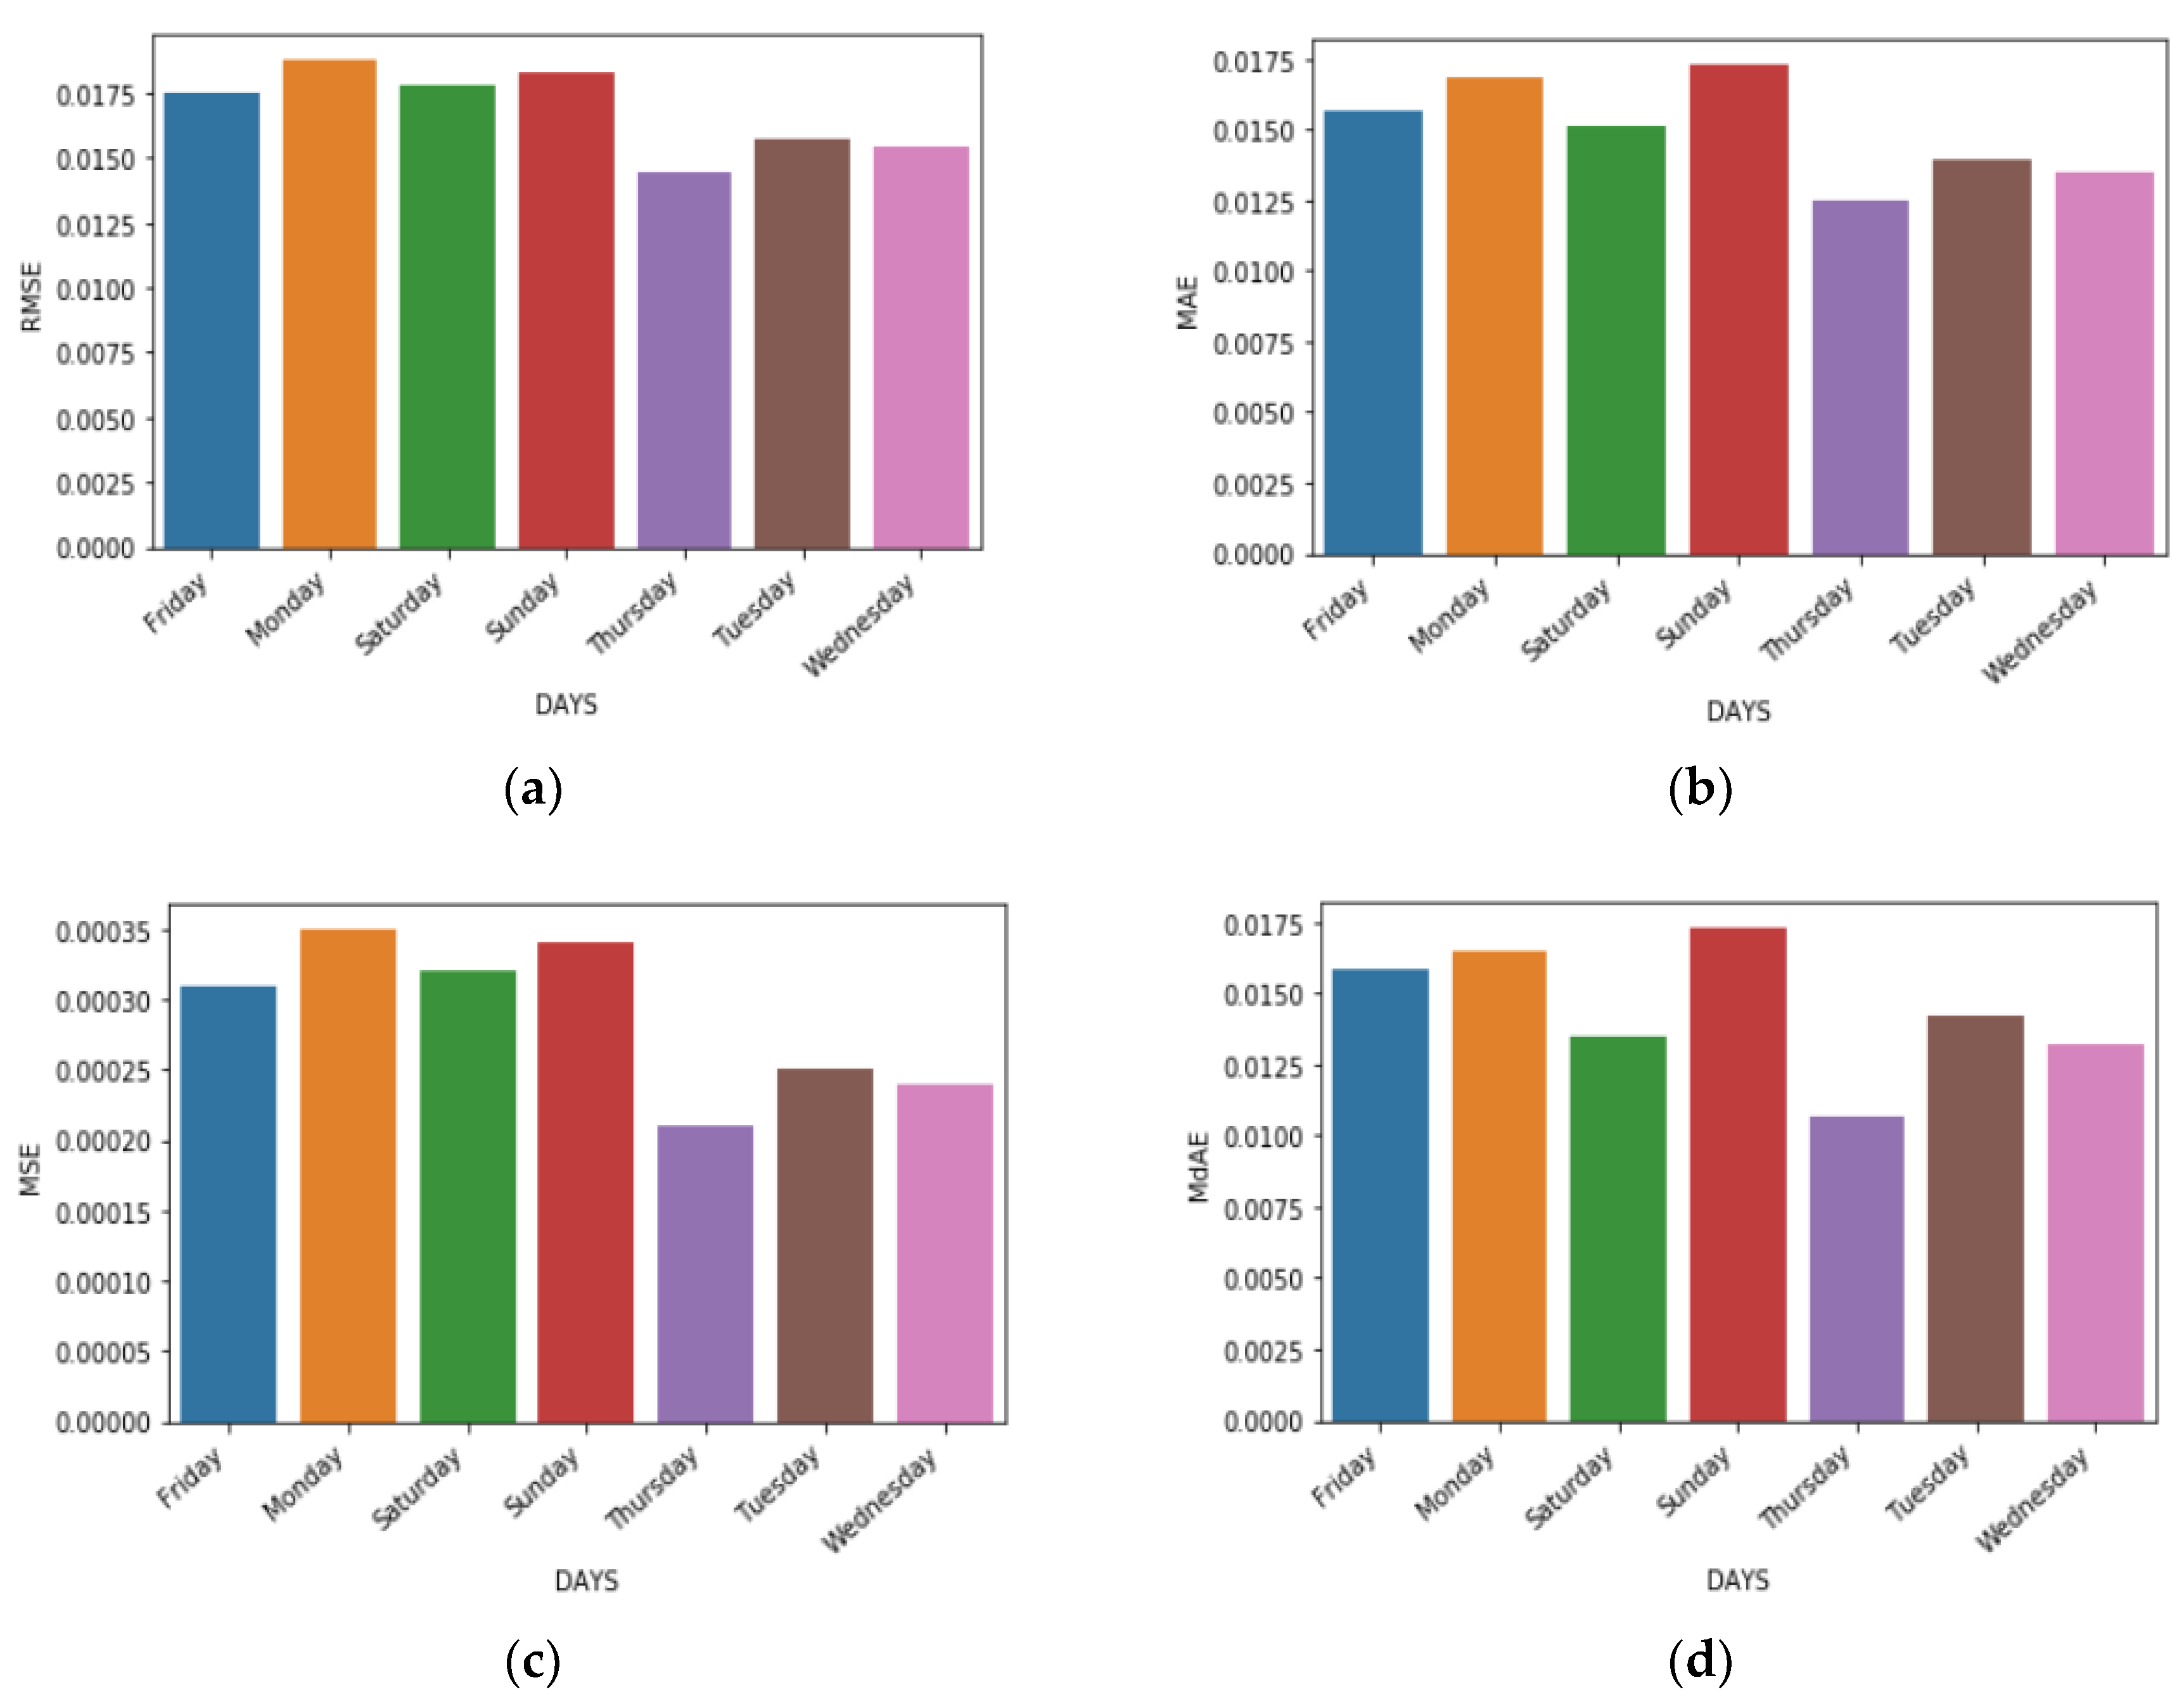
4.2. Day-Wise Parking Space Occupancy
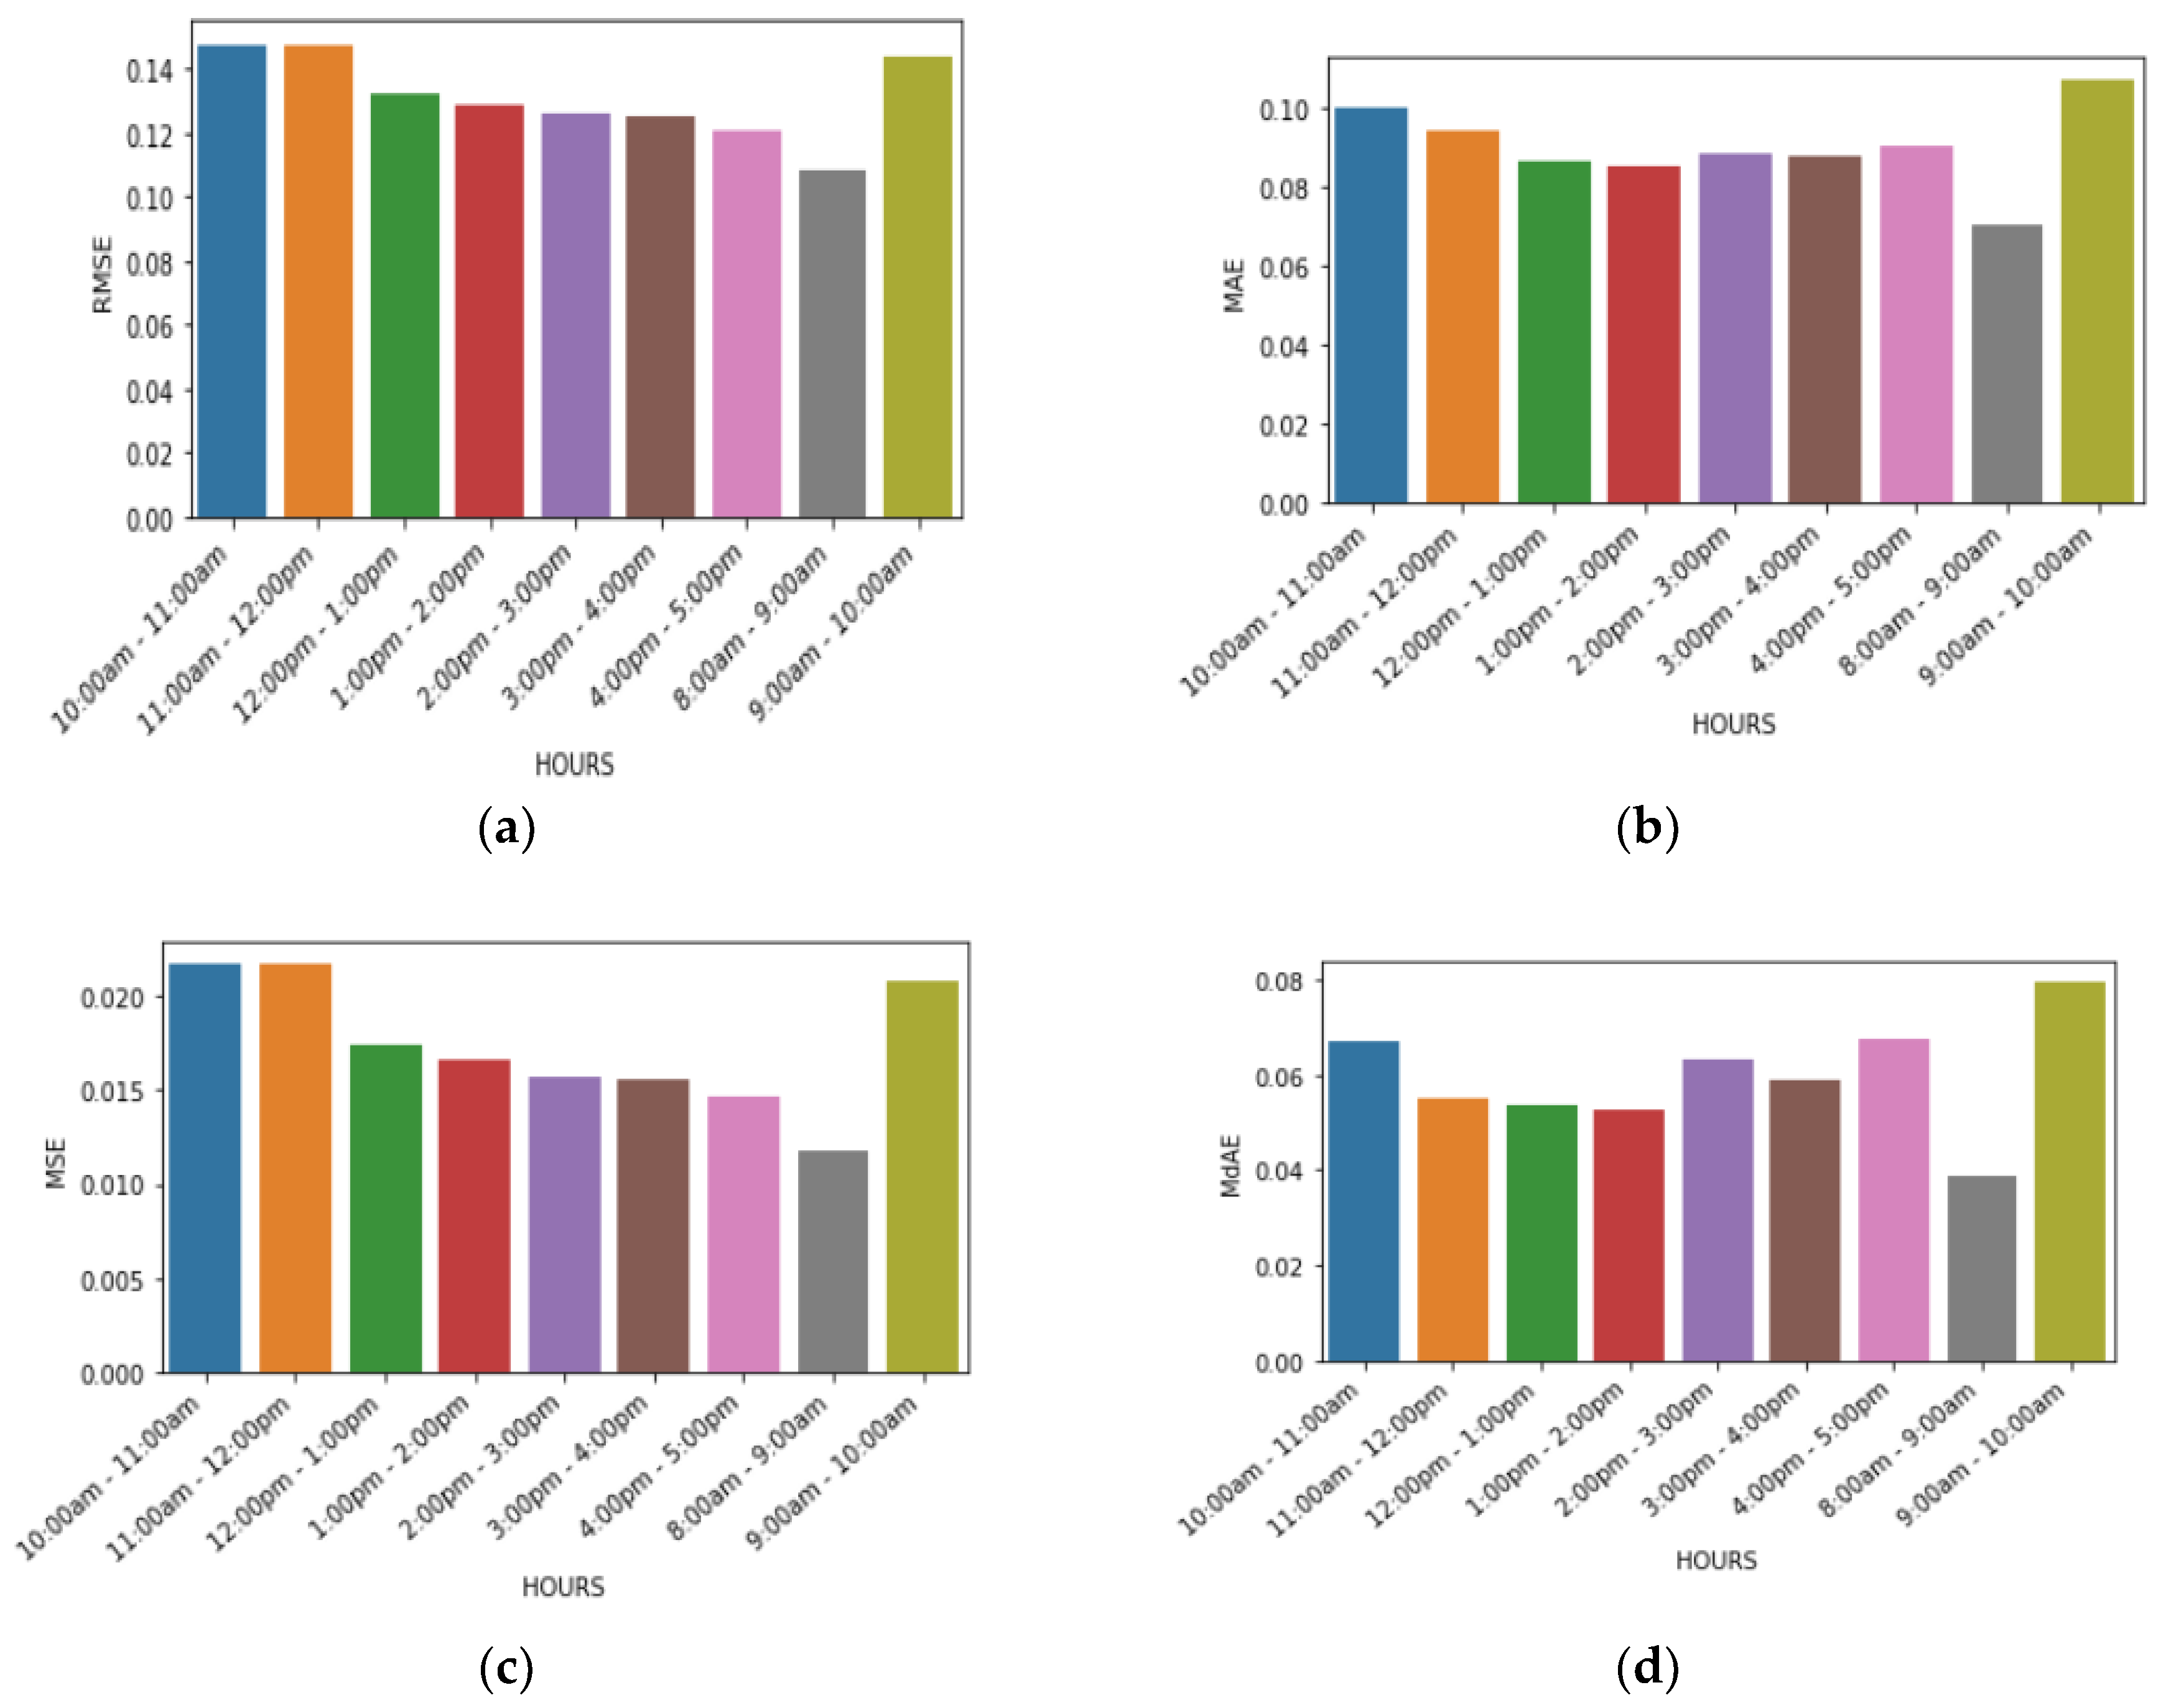
4.3. Hour-Wise Parking Space Occupancy
5. Discussion
6. Conclusions
Author Contributions
Funding
Acknowledgments
Conflicts of Interest
References
- Belissent, J. Getting clever about smart cities: New opportunities require new business models. Camb. Mass. 2010, 193, 244–277. [Google Scholar]
- Draz, U.; Ali, T.; Khan, J.A.; Majid, M.; Yasin, S. A real-time smart dumpsters monitoring and garbage collection system. In Proceedings of the 2017 Fifth International Conference on Aerospace Science & Engineering (ICASE), Islamabad, Pakistan, 14–16 November 2017; IEEE: Piscataway, NJ, USA, 2017. [Google Scholar]
- Hussain, A.; Draz, U.; Ali, T.; Tariq, S.; Irfan, M.; Glowacz, A.; Rahman, S. Waste Management and Prediction of Air Pollutants Using IoT and Machine Learning Approach. Energies 2020, 13, 3930. [Google Scholar] [CrossRef]
- Ali, T.; Irfan, M.; Alwadie, A.S.; Glowacz, A. IoT-Based Smart Waste Bin Monitoring and Municipal Solid Waste Management System for Smart Cities. Arab. J. Sci. Eng. 2020. [Google Scholar] [CrossRef]
- Vlahogianni, E.I.; Kepaptsoglou, K.; Tsetsos, V.; Karlaftis, M.G. A real-time parking prediction system for smart cities. J. Intell. Transp. Syst. 2016, 20, 192–204. [Google Scholar] [CrossRef]
- De Fabritiis, C.; Ragona, R.; Valenti, G. Traffic estimation and prediction based on real time floating car data. In Proceedings of the 11th International IEEE Conference on Intelligent Transportation Systems, Beijing, China, 12–15 October 2008; pp. 197–203. [Google Scholar]
- Zheng, Y.; Rajasegarar, S.; Leckie, C. Parking availability prediction for sensor-enabled car parks in smart cities. In Proceeding of the IEEE Tenth International Conference on Intelligent Sensors, Sensor Networks and Information Processing (ISSNIP), Singapore, 7–9 April 2015; pp. 1–6. [Google Scholar]
- Pengzi, C.; Jingshuai, Y.; Li, Z.; Chong, G.; Jian, S. Service data analyze for the available parking spaces in different car parks and their forecast problem. In Proceedings of the 2017 International Conference on Management Engineering, Software Engineering and Service Sciences, Wuhan, China, 14–16 January 2017; pp. 85–89. [Google Scholar]
- Rumelhart, D.E.; Hinton, G.E.; Williams, R.J. Learning representations by back-propagating errors. Nature 1986, 323, 533–536. [Google Scholar] [CrossRef]
- Shao, W.; Salim, F.D.; Gu, T.; Dinh, N.-T.; Chan, J. Traveling officer problem: Managing car parking violations efficiently using sensor data. IEEE Internet Things J. 2017, 5, 802–810. [Google Scholar] [CrossRef]
- Ali, T.; Noureen, J.; Draz, U.; Shaf, A.; Yasin, S.; Ayaz, M. Participants Ranking Algorithm for Crowdsensing in Mobile Communication. EAI Endorsed Trans. Scalable Inf. Syst. 2018, 5. [Google Scholar] [CrossRef]
- Ali, T.; Draz, U.; Yasin, S.; Noureen, J.; Shaf, A.; Ali, M. An Efficient Participant’s Selection Algorithm for Crowd sensing. Int. J. Adv. Comput. Sci. Appl. 2018, 9, 399–404. [Google Scholar]
- Hochreiter, S.; Schmidhuber, J. Long short-term memory. Neural Comput. 1997, 9, 1735–1780. [Google Scholar] [CrossRef]
- Teixeira, S.; Agrizzi, B.A.; Pereira Filho, J.G.; Rossetto, S.; Pereira, I.S.A.; Costa, P.D.; Branco, A.F.; Martinelli, R.R. LAURA architecture: Towards a simpler way of building situation-aware and business-aware IoT applications. J. Syst. Softw. 2020, 161, 110–124. [Google Scholar] [CrossRef]
- Ejaz, W.; Basharat, M.; Saadat, S.; Khattak, A.M.; Naeem, M.; Anpalagan, A. Learning paradigms for communication and computing technologies in IoT systems. Comput. Commun. 2020, 153, 11–25. [Google Scholar] [CrossRef]
- Nguyen, S.; Salcic, Z.; Zhang, X. Big Data Processing in Fog-Smart Parking Case Study. In Proceedings of the IEEE Intl Conf on Parallel & Distributed Processing with Applications, Ubiquitous Computing & Communications, Big Data & Cloud Computing, Social Computing & Networking, Sustainable Computing & Communications, Melbourne, Australia, 11–13 December 2018; pp. 127–134. [Google Scholar]
- Safi, Q.G.K.; Luo, S.; Pan, L.; Liu, W.; Hussain, R.; Bouk, S.H. SVPS: Cloud-based smart vehicle parking system over ubiquitous VANETs. Comput. Netw. 2018, 138, 18–30. [Google Scholar] [CrossRef]
- Al-Turjman, F.; Malekloo, A. Smart parking in IoT-enabled cities: A survey. Sustain. Cities Soc. 2019, 49, 101608. [Google Scholar] [CrossRef]
- Wu, P.; Chu, F.; Saidani, N.; Chen, H.; Zhou, W. IoT-based location and quality decision-making in emerging shared parking facilities with competition. Decis. Support Syst. 2020, 134, 113301. [Google Scholar] [CrossRef]
- Paidi, V.; Fleyeh, H.; Håkansson, J.; Nyberg, R.G. Smart parking sensors, technologies and applications for open parking lots: A review. IET Intell. Transp. Syst. 2018, 12, 735–741. [Google Scholar] [CrossRef]
- Cai, B.Y.; Alvarez, R.; Sit, M.; Duarte, F.; Ratti, C. Deep Learning-Based Video System for Accurate and Real-Time Parking Measurement. IEEE Internet Things J. 2019, 6, 7693–7701. [Google Scholar] [CrossRef]
- Vu, H.T.; Huang, C.-C. Parking space status inference upon a deep CNN and multi-task contrastive network with spatial transform. IEEE Trans. Circuits Syst. Video Technol. 2018, 29, 1194–1208. [Google Scholar] [CrossRef]
- Zhang, L.; Huang, J.; Li, X.; Xiong, L. Vision-based parking-slot detection: A DCNN-based approach and a large-scale benchmark dataset. IEEE Trans. Image Process. 2018, 27, 5350–5364. [Google Scholar] [CrossRef] [PubMed]
- Bock, F.; Di Martino, S.; Origlia, A. Smart parking: Using a crowd of taxis to sense on-street parking space availability. IEEE Trans. Intell. Transp. Syst. 2019, 21, 496–508. [Google Scholar] [CrossRef]
- Tekouabou, S.C.K.; Cherif, W.; Silkan, H. Improving parking availability prediction in smart cities with IoT and ensemble-based model. J. King Saud Univ. Comput. Inf. Sci. 2020. [Google Scholar] [CrossRef]
- Liu, J.; Wu, J.; Sun, L. Control method of urban intelligent parking guidance system based on Internet of Things. Comput. Commun. 2020, 153, 279–285. [Google Scholar] [CrossRef]
- Carli, R.; Cavone, G.; Othman, S.B.; Dotoli, M. IoT Based Architecture for Model Predictive Control of HVAC Systems in Smart Buildings. Sensors 2020, 20, 781. [Google Scholar] [CrossRef] [PubMed]
- Parking in Birmingham. Available online: https://archive.ics.uci.edu/ml/datasets/Parking+Birmingham (accessed on 13 January 2020).
- Camero, N.; Toutouh, J.; Stolfi, D.H.; Alba, E. Evolutionary Deep Learning for Car Park Occupancy Prediction in Smart Cities. In Proceedings of the International Conference on Learning and Intelligent Optimization, Kalamata, Greece, 10–15 June 2018; pp. 386–401. [Google Scholar]
- Stolfi, D.H.; Alba, E.; Yao, X. Predicting Car Park Occupancy Rates in Smart Cities. In Proceedings of the International Conference on Smart Cities 2017, 14–16 June 2017; pp. 107–117. [Google Scholar]
- Andebili, M.R.; Shen, H. Traffic and Grid-Based Parking Lot Allocation for PEVs Considering Driver Behavioral Model. In Proceedings of the International Conference on Computing, Networking and Communications (ICNC): Green Computing, Networking, and Communications, Santa Clara, CA, USA, 26–29 January 2017. [Google Scholar] [CrossRef]
- Carli, R.; Dotoli, M.; Epicoco, N.; Angelico, B.; Vinciullo, A. Automated Evaluation of Urban Traffic CongestionUsing Bus as a Probe. In Proceedings of the IEEE International Conference on Automation Science and Engineering (CASE), Gothenburg, Sweden, 24–28 August 2015. [Google Scholar] [CrossRef]
- Ali, G.; Ali, A.; Ali, F.; Draz, U.; Majeed, F.; Sana, Y.; Ali, T.; Haider, N. Artificial Neural Network Based Ensemble Approach for Multicultural Facial Expressions Analysis. IEEE Access 2020, 8, 134950–134963. [Google Scholar] [CrossRef]


| Reference | Method | Pros | Cons |
|---|---|---|---|
| [21] | Mask Region-based Convolutional Neural Network (Mask-RCNN) | This method achieved significant accuracy as compared to the benchmark system with low cost and scalability | It is found that a straight forward application of Mask-RCNN resulted in a noisy measurement of lot utilization |
| [22] | Contrastive Feature Extraction Network (CFEN) | CFEN overcomes the perspective distortion problem | In this model due to cluttered and distributed featuresthe learned network is over-fitted |
| [23] | Deep Convolutional Neural Networks (DeepPS) | DeepPS is very fast and can process one frame within 23ms because it is written in C++ | DeepPS is not work perfectly when the imaging conditions are poor |
| [24] | SFpark project | This system works as significant alternate to the expensive deployment of static parking sensors | This system suffered from the problem of mismatches in parking availability from crowd sensing with varying fleets sizes |
| [25] | Ensemble based model | This model improved the results as well as reducing system complexity | In this model the algorithm works like nearest neighbor that is a lazy technique, used non parametric method to solve regression problem |
| [27] | Wavelet Neural Network model | This model gives very high accuracy | In this model it is also found that it is easy to fall into the local excellent and slow training due to gradient descent method used for parameters optimization |
| Features | Descriptions |
|---|---|
| SystemCodeNumber | A variable that Identifies car park id |
| Capacity | Variable that contain the capabilities of park |
| Occupancy | The variable that contains occupancy of park |
| LastUpdated | Variable that have Date and Time of the measure |
| Parks ID | RMSE | MAE | MSE | MdAE | MSLE |
|---|---|---|---|---|---|
| Broad Street | 0.117 | 0.059 | 0.014 | 0.022 | 0.007 |
| Others-CCCPS98 | 0.078 | 0.042 | 0.006 | 0.027 | 0.003 |
| BHMBCCMKT01 | 0.089 | 0.047 | 0.008 | 0.032 | 0.005 |
| BHMEURBRD01 | 0.119 | 0.059 | 0.014 | 0.026 | 0.007 |
| Others-CCCPS135a | 0.106 | 0.062 | 0.011 | 0.035 | 0.005 |
| BHMMBMMBX01 | 0.113 | 0.065 | 0.013 | 0.043 | 0.006 |
| Others-CCCPS105a | 0.105 | 0.056 | 0.011 | 0.037 | 0.006 |
| Others-CCCPS202 | 0.123 | 0.062 | 0.015 | 0.029 | 0.007 |
| Shopping | 0.113 | 0.067 | 0.013 | 0.040 | 0.006 |
| BHMNCPNST01 | 0.077 | 0.042 | 0.006 | 0.026 | 0.003 |
| BHMNCPHST01 | 0.118 | 0.066 | 0.014 | 0.039 | 0.007 |
| Others-CCCPS8 | 0.098 | 0.051 | 0.010 | 0.032 | 0.005 |
| BHMBCCTHL01 | 0.138 | 0.069 | 0.019 | 0.031 | 0.007 |
| Others-CCCPS119a | 0.060 | 0.029 | 0.004 | 0.016 | 0.002 |
| BHMBCCSNH01 | 0.106 | 0.064 | 0.011 | 0.039 | 0.005 |
| BHMNCPLDH01 | 0.099 | 0.062 | 0.010 | 0.038 | 0.005 |
| BHMNCPPLS01 | 0.084 | 0.046 | 0.007 | 0.030 | 0.004 |
| BHMBCCPST01 | 0.110 | 0.054 | 0.012 | 0.028 | 0.006 |
| BHMEURBRD02 | 0.120 | 0.061 | 0.014 | 0.023 | 0.006 |
| NIA Car Parks | 0.048 | 0.025 | 0.002 | 0.014 | 0.002 |
| NIA South | 0.059 | 0.029 | 0.004 | 0.015 | 0.002 |
| Bull Ring | 0.148 | 0.080 | 0.022 | 0.053 | 0.012 |
| BHMBRCBRG03 | 0.100 | 0.053 | 0.010 | 0.034 | 0.006 |
| BHMBRCBRG01 | 0.177 | 0.098 | 0.031 | 0.059 | 0.016 |
| BHMNCPRAN01 | 0.095 | 0.054 | 0.009 | 0.022 | 0.004 |
| BHMBRCBRG02 | 0.148 | 0.079 | 0.022 | 0.051 | 0.012 |
| BHMNCPNHS01 | 0.133 | 0.071 | 0.018 | 0.028 | 0.009 |
| NIA North | 0.122 | 0.063 | 0.015 | 0.033 | 0.007 |
| BHMBRTARC01 | 0.133 | 0.108 | 0.018 | 0.100 | 0.012 |
| Overall | 0.068 | 0.0411 | 0.0046 | 0.0283 | 0.002 |
| Mean | 0.109 | 0.059 | 0.012 | 0.035 | 0.006 |
| Max | 0.177 | 0.108 | 0.031 | 0.1 | 0.016 |
| Min | 0.048 | 0.025 | 0.002 | 0.014 | 0.002 |
| Std | 0.028 | 0.018 | 0.006 | 0.016 | 0.003 |
| Days | RMSE | MAE | MSE | MdAE | MSLE |
|---|---|---|---|---|---|
| Monday | 0.0188 | 0.0168 | 0.00035 | 0.0165 | 0.00019 |
| Tuesday | 0.0157 | 0.0139 | 0.00025 | 0.0142 | 0.00010 |
| Wednesday | 0.0154 | 0.0135 | 0.00024 | 0.0132 | 0.00011 |
| Thursday | 0.0145 | 0.0125 | 0.00021 | 0.0107 | 0.00011 |
| Friday | 0.0175 | 0.0157 | 0.00031 | 0.0158 | 0.00016 |
| Saturday | 0.0178 | 0.0151 | 0.00032 | 0.0135 | 0.00019 |
| Sunday | 0.0183 | 0.0173 | 0.00034 | 0.0173 | 0.00020 |
| Hours | RMSE | MAE | MSE | MdAE | MSLE |
|---|---|---|---|---|---|
| 8:00 a.m.–9:00 a.m. | 0.1085 | 0.0698 | 0.0117 | 0.0389 | 0.00912 |
| 9:00 a.m.–10:00 a.m. | 0.1441 | 0.1071 | 0.0207 | 0.0796 | 0.0109 |
| 10:00 a.m.–11:00 a.m. | 0.1476 | 0.0999 | 0.0217 | 0.0669 | 0.0107 |
| 11:00 a.m.–12:00 p.m. | 0.1474 | 0.0937 | 0.0217 | 0.0549 | 0.0103 |
| 12:00 p.m.–1:00p.m. | 0.1318 | 0.0861 | 0.0173 | 0.0536 | 0.0078 |
| 1:00p.m.–2:00 p.m. | 0.1290 | 0.0848 | 0.0166 | 0.0528 | 0.0073 |
| 2:00 p.m.–3:00 p.m. | 0.1256 | 0.0881 | 0.0157 | 0.0630 | 0.0068 |
| 3:00 p.m.–4:00 p.m. | 0.1247 | 0.0875 | 0.0155 | 0.0589 | 0.0070 |
| 4:00 p.m.–5:00 p.m. | 0.1209 | 0.0902 | 0.0146 | 0.0673 | 0.0068 |
| Reference | Technique | MAE |
|---|---|---|
| [24] | Polynomials | 0.067 |
| Fourier Series | 0.079 | |
| k-means clustering | 0.102 | |
| Polynomials fitted to the k-mean centroid | 0.101 | |
| Shift and phase modifications to the KP polynomials | 0.073 | |
| Time series | 0.067 | |
| Recurrent Neural Network | 0.079 | |
| [25] | Polynomials | Monday = 5.368 |
| Tuesday = 12.173 | ||
| Wednesday = 8.2633 | ||
| Thursday = 5.6741 | ||
| Friday = 3.9284 | ||
| Saturday = 3.6687 | ||
| Sunday = 15.259 | ||
| k-means clustering | Monday = 1.3067 | |
| Tuesday =1.3178 | ||
| Wednesday = 1.3828 | ||
| Thursday = 1.3806 | ||
| Friday = 1.4357 | ||
| Saturday = 1.1299 | ||
| Sunday = 1.1916 | ||
| Proposed | Deep LSTM | Monday = 0.0168 |
| Tuesday = 0.0139 | ||
| Wednesday =0.0135 | ||
| Thursday =0.0125 | ||
| Friday =0.0157 | ||
| Saturday =0.0151 | ||
| Sunday =0.0173 |
Publisher’s Note: MDPI stays neutral with regard to jurisdictional claims in published maps and institutional affiliations. |
© 2020 by the authors. Licensee MDPI, Basel, Switzerland. This article is an open access article distributed under the terms and conditions of the Creative Commons Attribution (CC BY) license (http://creativecommons.org/licenses/by/4.0/).
Share and Cite
Ali, G.; Ali, T.; Irfan, M.; Draz, U.; Sohail, M.; Glowacz, A.; Sulowicz, M.; Mielnik, R.; Faheem, Z.B.; Martis, C. IoT Based Smart Parking System Using Deep Long Short Memory Network. Electronics 2020, 9, 1696. https://doi.org/10.3390/electronics9101696
Ali G, Ali T, Irfan M, Draz U, Sohail M, Glowacz A, Sulowicz M, Mielnik R, Faheem ZB, Martis C. IoT Based Smart Parking System Using Deep Long Short Memory Network. Electronics. 2020; 9(10):1696. https://doi.org/10.3390/electronics9101696
Chicago/Turabian StyleAli, Ghulam, Tariq Ali, Muhammad Irfan, Umar Draz, Muhammad Sohail, Adam Glowacz, Maciej Sulowicz, Ryszard Mielnik, Zaid Bin Faheem, and Claudia Martis. 2020. "IoT Based Smart Parking System Using Deep Long Short Memory Network" Electronics 9, no. 10: 1696. https://doi.org/10.3390/electronics9101696
APA StyleAli, G., Ali, T., Irfan, M., Draz, U., Sohail, M., Glowacz, A., Sulowicz, M., Mielnik, R., Faheem, Z. B., & Martis, C. (2020). IoT Based Smart Parking System Using Deep Long Short Memory Network. Electronics, 9(10), 1696. https://doi.org/10.3390/electronics9101696