Article

A Closed-Loop Optogenetic Stimulation Device

School of Engineering, Deakin University, Geelong, Victoria 3216, Australia
*
Author to whom correspondence should be addressed.
Electronics 2020, 9(1), 96; https://doi.org/10.3390/electronics9010096
Submission received: 20 November 2019 / Revised: 25 December 2019 / Accepted: 27 December 2019 / Published: 3 January 2020
(This article belongs to the Special Issue Smart Electrical Circuits and Systems for Neural Interface)

Abstract

:
Closed-loop optogenetic stimulation devices deliver optical stimulations based on real-time measurement and analysis of neural responses to stimulations. However, the use of large bench-top and tethered devices hinders the naturalistic test environment, which is crucial in pre-clinical neuroscience studies involving small rodent subjects. This paper presents a tetherless, lightweight and miniaturized head-mountable closed-loop optogenetic stimulation device. The device consists of three hardware modules: a hybrid electrode, an action potential detector, and an optogenetic stimulator. In addition, the device includes three software modules: a feature extractor, a control algorithm, and a pulse generator. The details of the design, implementation, and bench-testing of the device are presented. Furthermore, an in vitro test environment is formed using synthetic neural signals, wherein the device is validated for its closed-loop performance. During the in vitro validation, the device was able to identify abnormal neural signals, and trigger optical stimulation. On the other hand, it was able to also distinguish normal neural signals and inhibit optical stimulation. The overall power consumption of the device is 24 mW. The device measures 6 mm in radius and weighs 0.44 g excluding the power source.

Graphical Abstract

1. Introduction

Neuroscientists required a technology to selectively excite or inhibit neural structures of the brain. They used electrical deep brain stimulation to modulate target brain regions [1]. However, electrical stimulation lacks cell-specific access during neuromodulation [2]. Therefore, light-based stimulation called optogenetics has emerged for cell-specific modulation [3]. Optogenetics is a stimulation technique that uses light to control the neural activity of the brain [4]. In this method, the target neurons are transfected with microbial opsins that are sensitive to light. The unique combination of opsins and light wavelengths defines the type of neuromodulation (excitation or inhibition) of the neurons. In contrast to electrical stimulation, optogenetics provides enhanced spatial and temporal resolution during the neural stimulation. However, many of optogenetic stimulation implementations are driven by pre-defined stimulation patterns called open-loop stimulation which disregards the neural responses to neural stimulations [5]. Closed-loop optogenetic stimulation (CLOS), on the other hand, modulates the neurons based on real-time measurement and analysis of neural responses. This approach enhances the efficacy of neuromodulation [6] and is being explored as an option for investigating neuropsychiatric disorders [7], particularly for pre-clinical studies involving small animals.
Krook-Magnuson et al. [8] presented a CLOS device to selectively modulate specific-neuron cells upon detection of seizure activity in the brain. The device acquired electrophysiological readout through electroencephalogram (EEG). However, the latter stages of amplification, filtration, digitization and control-logic executions relied on a computer-based setup, which implemented customized seizure detection algorithm, followed by on-demand activation of optical output. Optical neuromodulation was delivered by a laser source, which was controlled by signals generated by a digitizer. Laxpati et al. [9] reported a CLOS device using an open-source platform and commercially available modules. The device employed the open-source software tool NeuroRighter [10] to implement cost-effective real-time closed-loop optogenetic neuromodulations. NeuroRighter acquired electrophysiological readouts from the target brain region, followed by real-time isolation of single cell activity and local-field potentials, online signal analysis, and visualization. Furthermore, NeuroRighter was also responsible for performing positive and negative threshold crossing, superparamagnetic clustering, signal classification, closed-loop control and modulation of stimulation parameters. Optical neuromodulations were also delivered using a commercially available Plexon LED (Plexon Inc., Dallas, TX, USA), and associated electronics. The overall device implementation was validated in vivo for both open and closed-loop stimulations. Nguyen et al. [11] implemented a CLOS device suitable for neuro-prosthetic and scientific research applications. The device performed a 32-channel low-noise neural recording, followed by online signal analysis using spike detection and classification through spike sorting. The stages of signal acquisition and online signal processing was carried out using a Neuralynx system (Neuralynx Inc., Bozeman, MT, USA) and a custom-built MATLAB (MathWorks, Natick, MA, USA) code deployed in LabVIEW (National Instruments, Austin, TX, USA). In this system, on-demand neuromodulations were delivered when a specific spike cluster were identified. Optical stimulation was delivered by an LED light-source controlled by pulses. The device was validated in vivo and achieved reduced delay with overall real-time processing time of 8 ms. Newman et al. [12] illustrated an optoclamp based control, to deliver real-time closed-loop optical stimulations. A 59-channel microelectrode array was employed to acquire electrical neural activity. The stages of online signal analysis were performed in a RZ2 bio-acquisition system (Tucker-Davis Technologies, USA), while the optical stimulations were delivered using a high-power LED and custom LED drive circuitry. Alternatively, for in vitro implementation, NeuroRighter was employed to acquire and analyze real-time neural data. The device demonstrated proportional-integral control and on-off control. Based on the online control signal, the stimulation parameters (e.g., light intensity, frequency, and pulse width) were modulated, which in turn altered the optical output of the light-source. Pashaie et al. [13] reported a distinct approach of delivering CLOS using micro-electrocorticography (micro-ECoG) fabricated on an optically transparent substrate. The device performed online signal processing using a computer-based setup. The closed-loop algorithm was realized using proportional control logic, for which a pre-defined spatial-temporal activity was determined to estimate the error signal. Based on the calculated deviation, the stimulation parameters were modulated until the desired neural response was achieved. Optical stimulations were controlled by a programmable digital micro-mirror device (DVD), which modulated the optical output of the laser and arc-lamp. The device demonstrated a single-site and multi-site CLOS suitable for mathematical modelling of neural activity.
It is evident that most of the existing approaches require tethered benchtop settings to achieve closed-loop neuromodulation. A suitable miniaturized device that addresses the issues of weight, size, and tethering in CLOS is required. This paper presents a lightweight, tetherless, and miniature head-mountable solution that hosts the necessary components to deliver CLOS to small laboratory animals. The design, construction, and evaluation of the CLOS device are presented. It can be carried by small laboratory animals without significant disruption of their natural behavior, which makes the device suitable for pre-clinical studies.

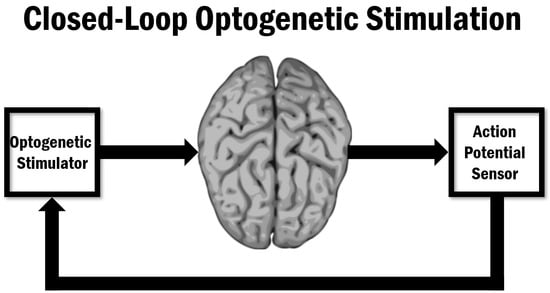
2. Closed-Loop Optogenetic Stimulation System

The proposed CLOS device (see Figure 1) consists of two components: hardware and software. The hardware component comprises three modules: a hybrid electrode (HE), an action potential detector (APD), and an optogenetic deep brain stimulator (ODBS). The software component consists of three modules also: a feature extractor (FE), a control algorithm (CA), and a pulse generator (PG).
The HE hosts two detection electrodes and a stimulation LED. The detection electrodes detect the neural signals from the target neurons, which are then fed as input to the APD. The APD selectively isolates the neural signals from the surrounding noise signals and amplifies them. The APD consists of a pre-amplifier, a band pass filter, and a post-amplifier. The pre-amplifier magnifies the signal by a fixed gain of 160 times. The band pass filer passes signals within the frequency range of 300 Hz and 6 kHz. The post-amplifier further amplifies the signal by a gain of 160 times. The signal from the APD output is then fed to the microcontroller in the ODBS. The microcontroller hosts the software component which analyses the neural signals and implements the closed-loop CA. Based on the output of the CA, the microcontroller controls the LED driver circuitry, which in turn modulates the LED (see Section 3 for the description of the design and function of the hardware component).
Within the software component, the FE characterizes the neural signals based on their amplitude variations. The CA implements a closed-loop on-off logic. The PG controls the stimulation parameters (e.g., pulse width, duty cycle and frequency), modulating the LED (see Section 4 for the description of the design and function of the software component). Figure 2 shows the head-mountable configuration of the CLOS device for use with small laboratory animals.

3. Hardware Component

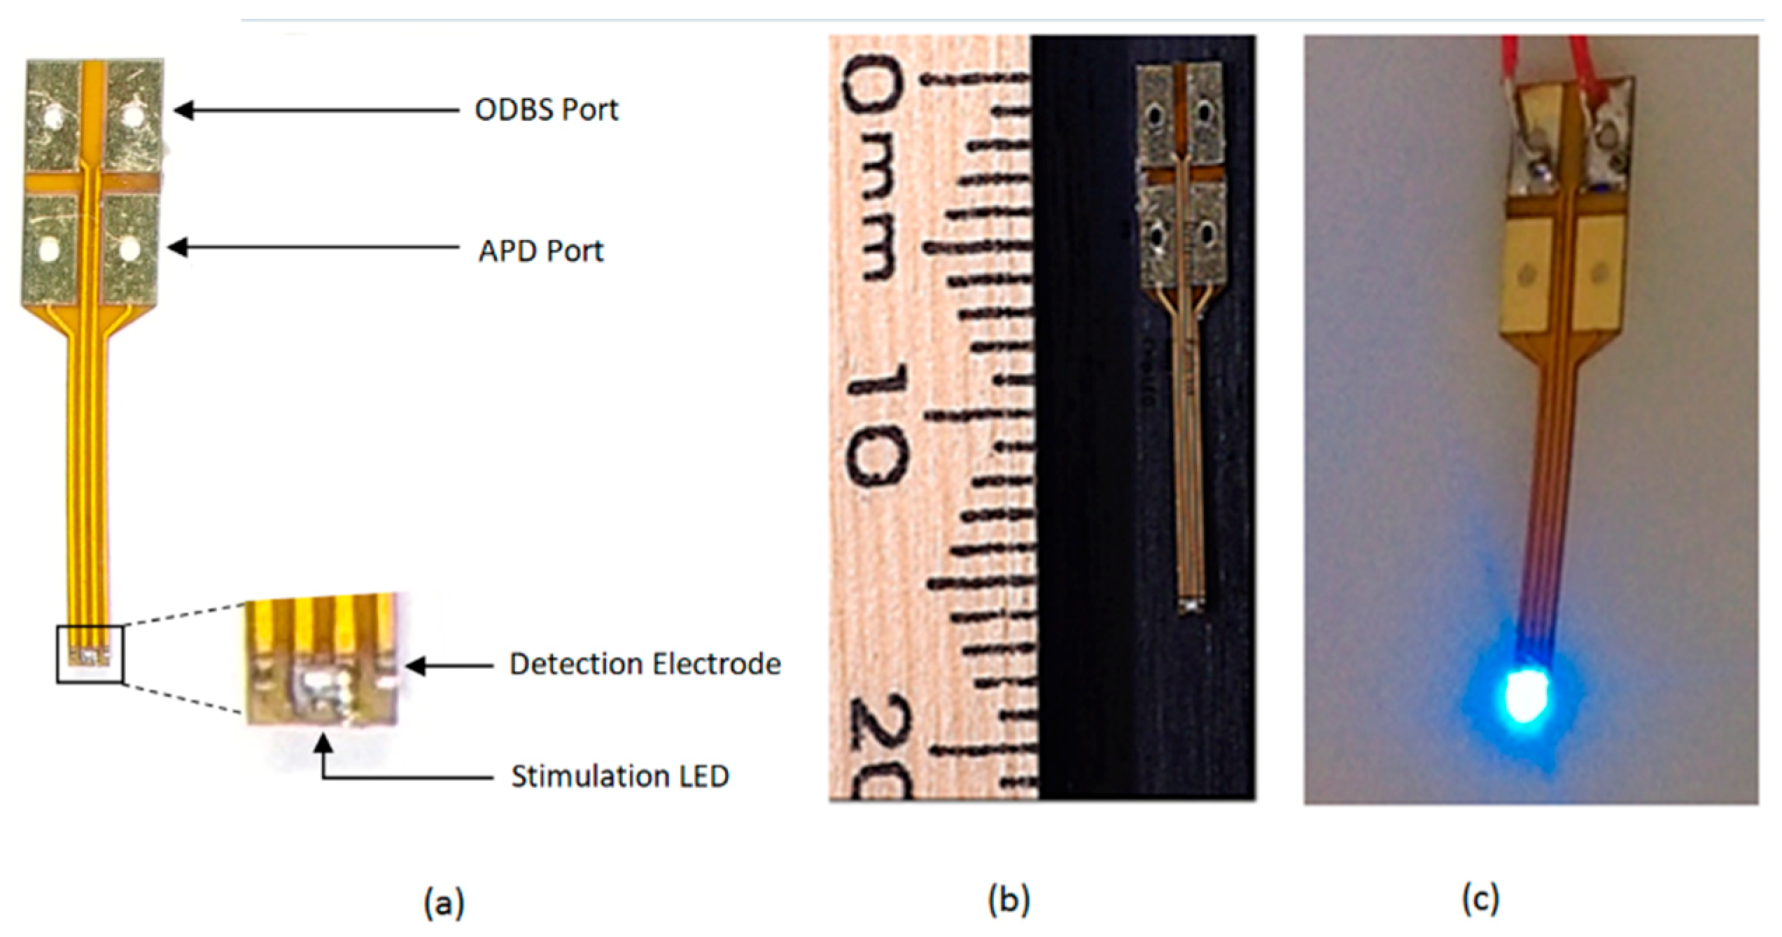
3.1. Hybrid Electrode

The hybrid electrode is designed to be easily implantable into the target brain region and is capable of simultaneous neural signal detection and optical stimulation (see Figure 3). In this work, the ODBS module is designed to deliver optical stimulation to activate light-sensitive protein Channelrhodopsin (ChR2). To activate ChR2 transfected neurons, 470 nm light of 1 mW/mm2 irradiance is required [14]. However, the power consumption of LED plays a crucial role in defining the operational duration. Lee et al. [15] reported the need for high driving current of about 1.0 A for 27 mW/mm2 irradiance, which was due to poor coupling efficiency of the fiber/LED coupler. After detailed review of optical and electrical features of various LEDs, Cree chip-LED (Cree Inc., Durham, NC, USA) [16] was employed in our work. Cree chip-LEDs can deliver peak optical power output of about 33 mW suitable for CLOS. Optical stimulations are delivered by the Cree chip-LED DA2432 of size 240 μm × 320 μm, hosted near the tip of the HE. The neural activity is sensed by two detection electrodes of size 150 μm × 150 μm each, located adjacent to the LED. One of the electrodes acts as a reference input, while the other as the channel input to the APD module. The illumination of the LED is controlled by the ODBS module. For easier integration of the implantable electrode to the headstage (including APD and ODBS), four connecting pads with through holes are included near the rear end of the HE in a stacked configuration. The use of onboard chip-LED in the HE enhances the device portability. The use of chip-LED in the HE also eliminates the optical power losses due to the fiber/LED coupling [17]. The entire electrode is fabricated on a flexible PCB of size 16 mm in length and 1.2 mm in width suitable for chronic neuromodulation. The LED is hand soldered with the help of a 120-times ASH Digital Microscope and Measurement System (Ash Technologies Ltd, Ireland), and then tested along with the APD and ODBS for CLOS.

3.2. Action Potential Detector

The Action Potential Detector (APD) comprises of three stage amplification and filtration circuit, where the neural signals detected by the HE are isolated from the surrounding noise signals and amplified to a suitable level for further processing in the ODBS.

3.2.1. Pre-Amplifier

In the pre-amplifier stage, the detected neural signals are amplified by the AD8293 amplifier [18], see Figure 4. It provides a fixed gain of 160-times. The output of the pre-amplifier stage is:
V O U T = V R E F + ( 2 R 2 R 1 ) ( V I N P V I N N )    
where VINP is the positive input terminal of the amplifier, VINN is the negative input terminal of the amplifier, VREF is the internal voltage shift set by a voltage divider circuit, and VOUT is the output of the pre-amplifier stage.

3.2.2. Band Pass Filter

In the band pass filter stage, a two-pole low pass filter and a passive high pass filter are implemented. Based on the AP signal characteristics, the high pass and low pass cut-off frequencies are estimated to be 300 Hz and 6 kHz, respectively. The AD8293 is configured to perform low pass filtration with two external capacitors (C2 and C3). This is followed by a passive high pass filter with a cut-off frequency of 300 Hz.

3.2.3. Post-Amplifier

In the post-amplification stage, the neural signals are further amplified by a factor of 10. The AD8237 micro power amplifier [19] is incorporated in this stage, see Figure 4. The gain is set using two external resistors according to:
G = 1 + R 5 R 4
Depending on the required frequency bandwidth and gain factor, the bandwidth mode is set via Pin 1 of AD8237. In this design, R4 and R5 values are configured to achieve 10-times gain within a 10 kHz frequency range, to fulfil the AP signal characteristics.
The printed circuit board (PCB) of the APD was designed using EAGLE (Autodesk, USA). The choice of electronic components and the compact PCB design significantly downsized the APD module and ensured robust coupling to the ODBS and the HE. The radius of the fabricated and assembled APD is about 6 mm.

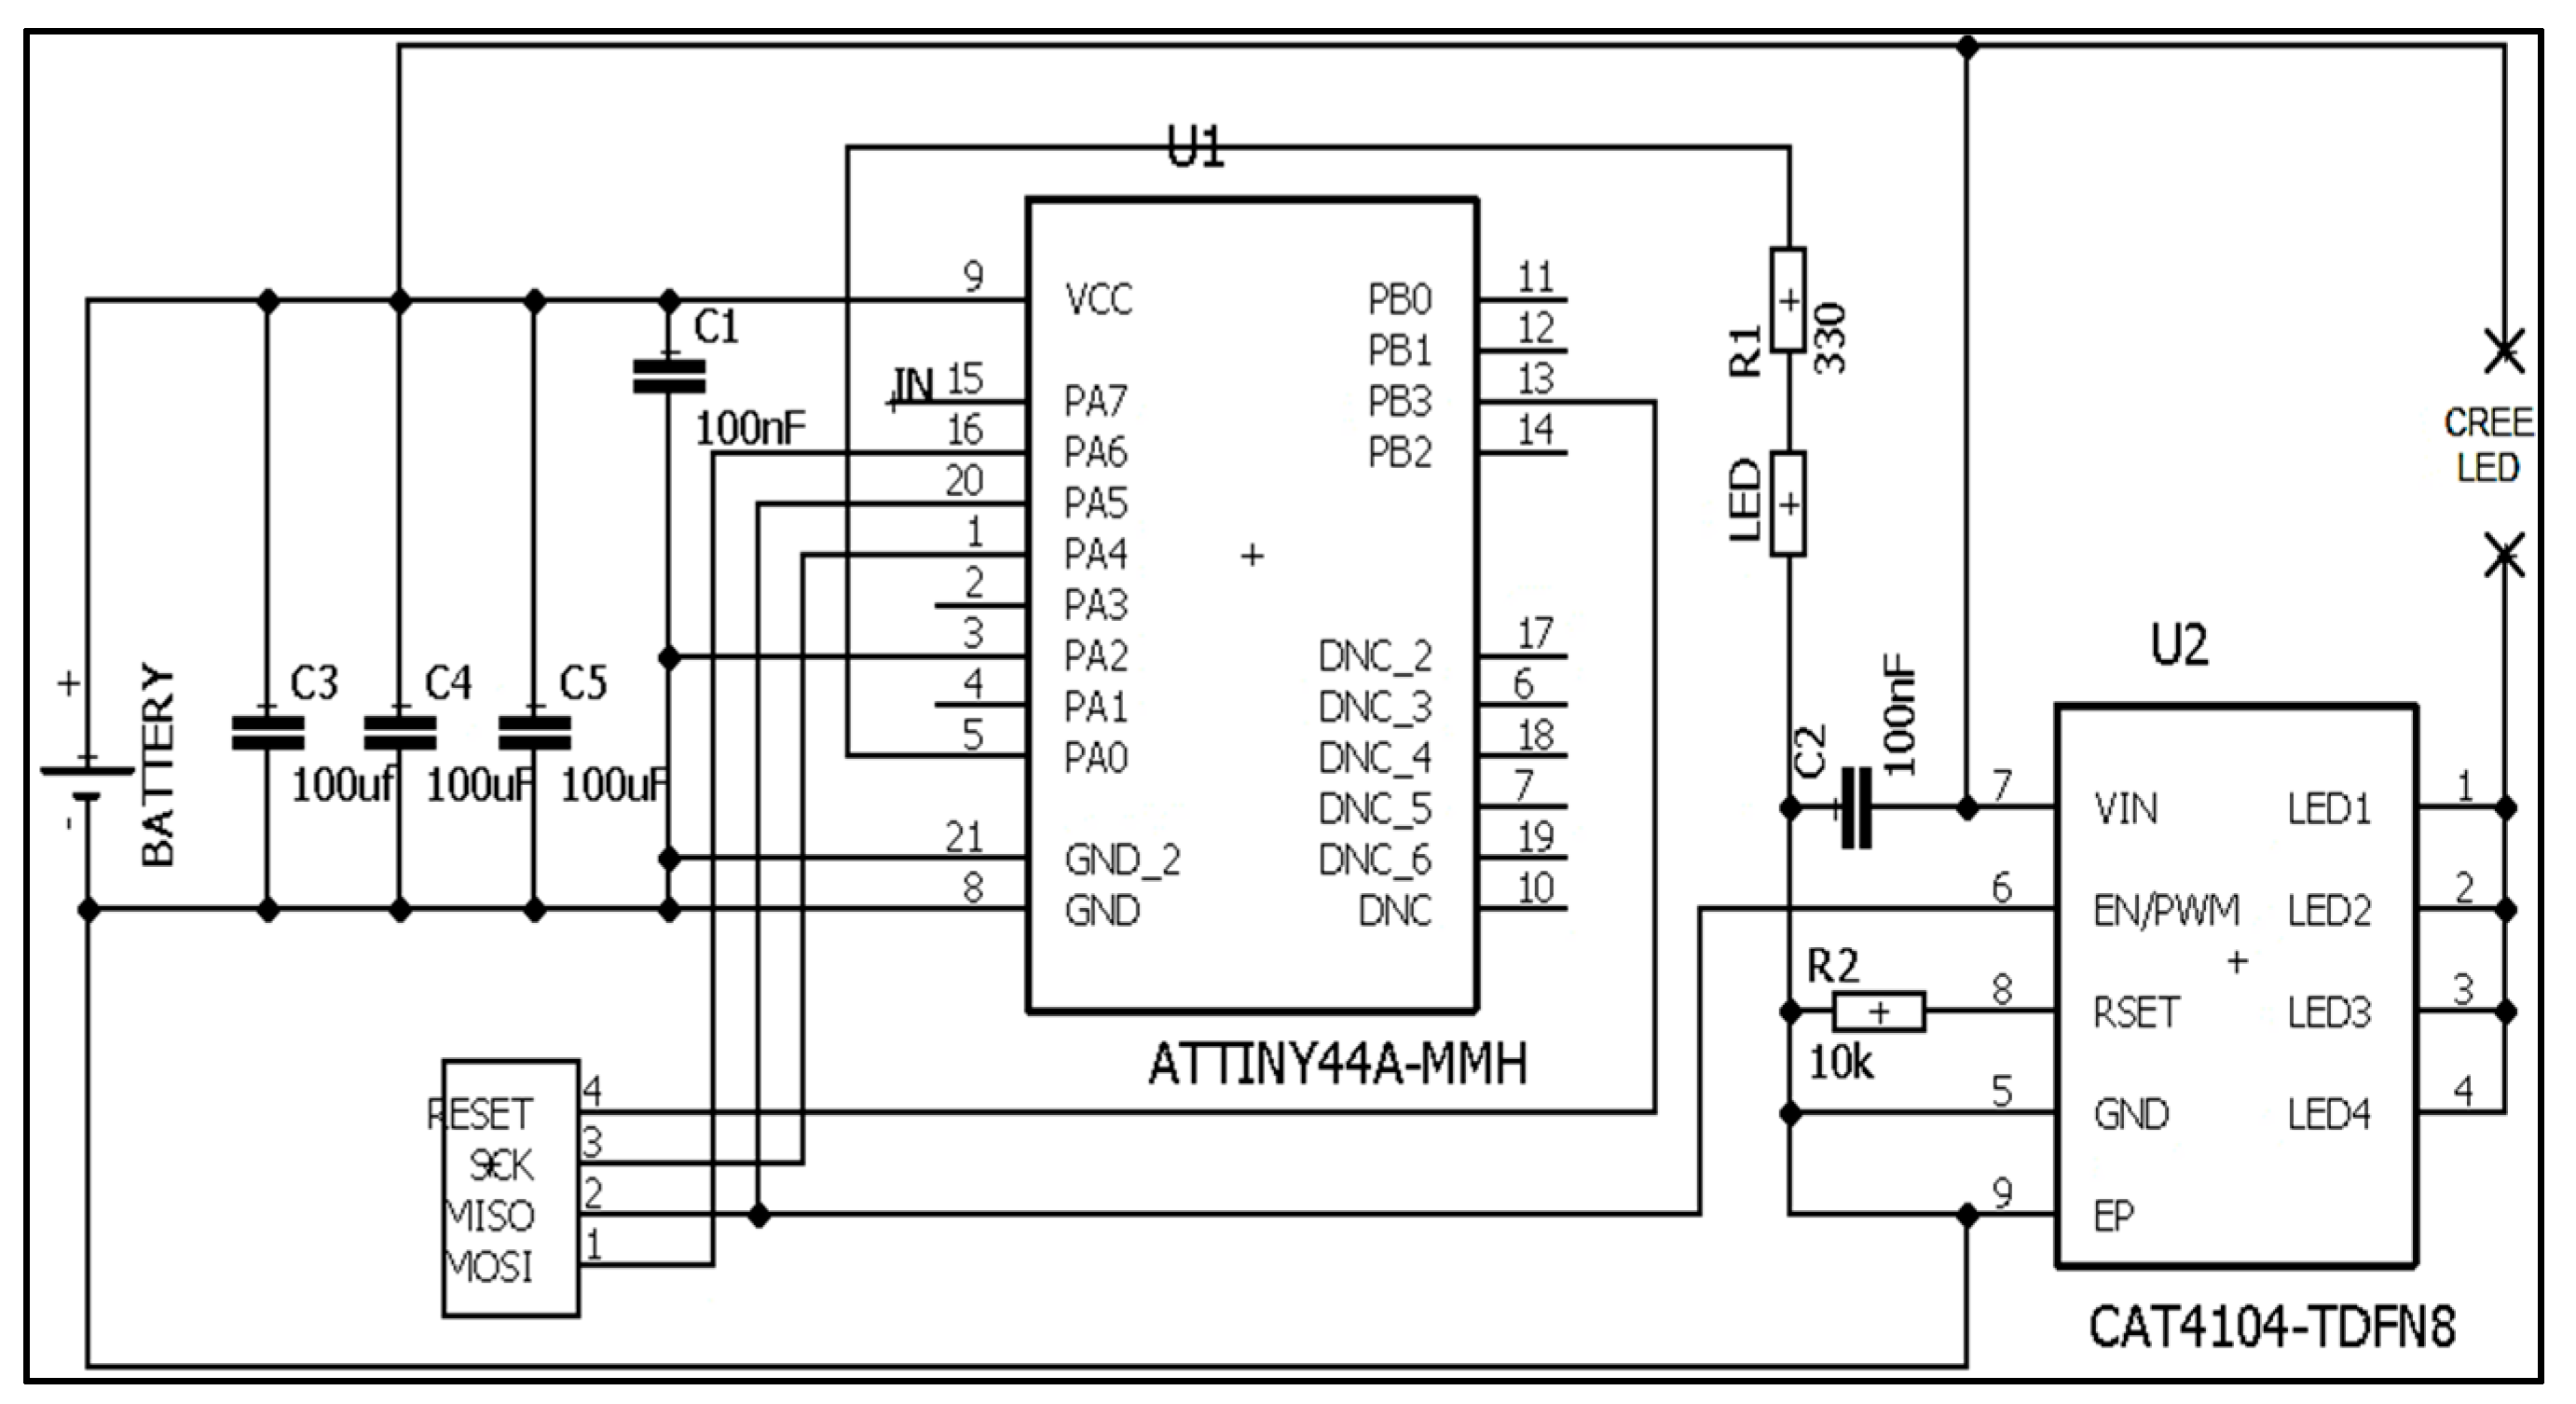
3.3. Optogenetic Deep Brain Stimulator (ODBS)

The ODBS samples and digitizes the amplified neural signal, runs the control algorithm, and operates the light source. The circuit diagram of the optogenetic stimulator is shown in Figure 5. The optogenetic stimulator comprises a pico-power microcontroller ATtiny 44A [20], a constant current LED driver CAT4104 [21], a port for connection to a 475 nm stimulation LED, and an on-board LED for interaction with the user.
The device benefits from an Atmel ATtiny 44A microcontroller. It is a high-performance pico-power 8-bit microcontroller featuring 4 KB flash program memory, 256B data SRAM, 256B EEPROM, 12 general purpose I/O lines, an 8-bit timer/counter, a 16-bit timer/counter, internal and external interrupts, an 8-channel 10-bit A/D converter, a programmable watchdog timer, an internal calibrated oscillator, and four power saving modes. The microcontroller can operate with a voltage source within the range 1.8–5.5 V. Its program memory can be reprogrammed in-system through an SPI serial interface. The microcontroller is supported by a suite of programs as well as system development tools such as C compiler. Atmel Studio is an integrated development platform for developing and debugging the Atmel microcontroller-based applications. A 100 nF capacitor is used between the VCC and GND pins of the microcontroller to bypass any undesired high-frequency signals to ground. A pulse width modulation (PWM) signal is generated on bit 5 of Port A. The signal is used to control the operation of the stimulation LED through the LED driver CAT4104. Three 100 µF capacitors are used to smooth out current surges during the pulsing of the stimulation LED.
The devices employ a quad channel constant current LED driver CAT4104. It facilitates four matched low dropout current sinks to drive high-brightness LED strings up to 175 mA per channel. The LED channel current is set by an external resistor (RSET) according to:
I LED 100   × 1.2 V R S E T
A 10 kΩ resistor is thus used to set the LED current to 12 mA. The EN/PWM logic input supports the device enable and high frequency external PWM dimming control. Figure 6 shows the assembled APD and ODBS boards.

3.4. Power Source

The entire CLOS device is powered by a 3.7 V 30 mAh Lithium Ion Polymer battery, for the duration of per-clinical studies. This power source allows uninterrupted operation of the CLOS device for over 5 h, making it suitable for pre-clinical neuroscience studies.

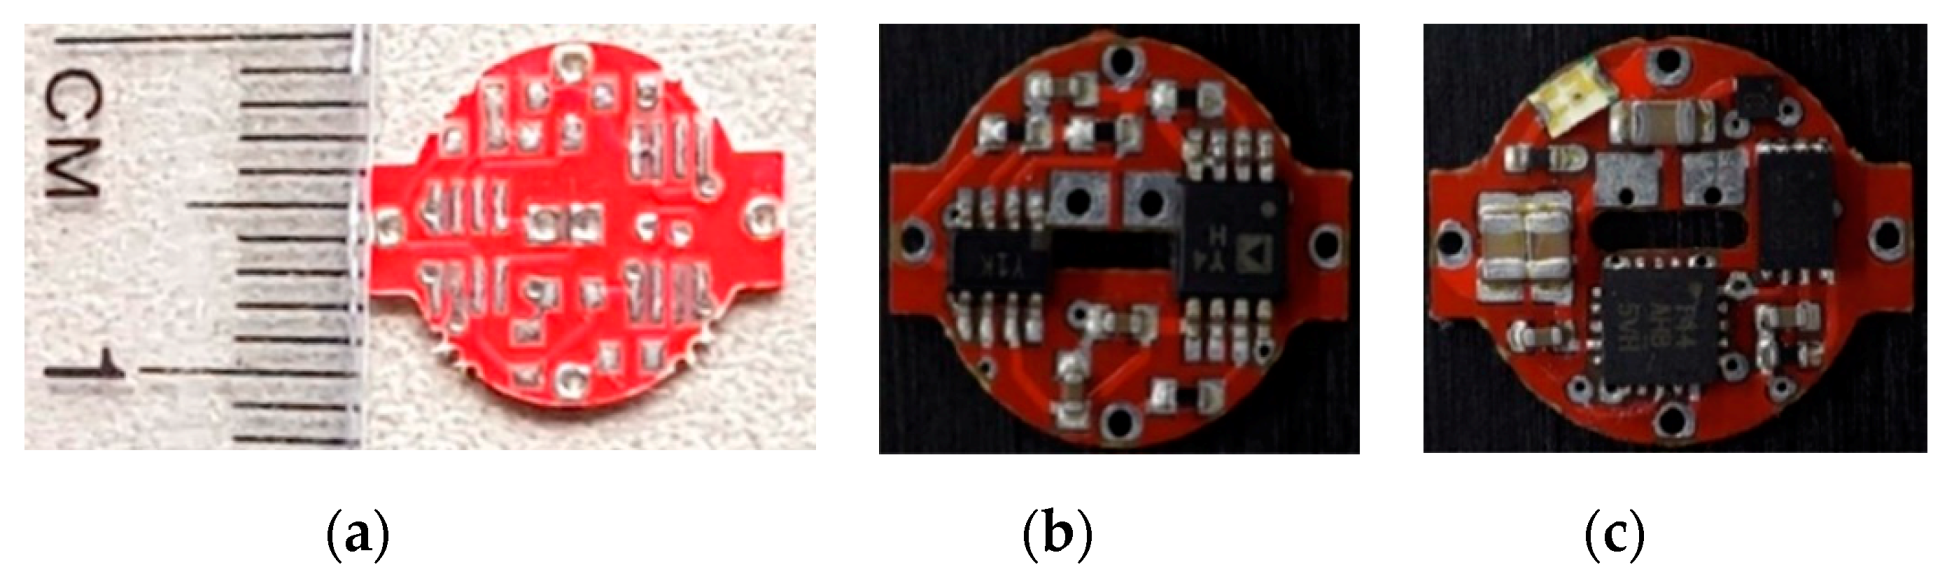
3.5. Integration of the CLOS Device

The three hardware modules including the HE, APD, and ODBS are integrated as shown in Figure 7. The device weighs only 0.44 g excluding the battery and 1.07 g with the battery. The electronic circuity, PCB design, and the stacked architecture of the CLOS device enhance the overall device portability. The device can be easily head-mounted on small rodents in pre-clinical settings.

4. Software Component

The software was developed in C language and uploaded into the ATtiny 44A in the ODBS. The pseudo-code for the program is presented in Figure 8.

4.1. Feature Extractor

In the FE, the acquired neural signals are characterized based on their amplitude variations. The analog neural signals from the APD output are received by the analog to digital converter (ADC) of the microcontroller. These signals are digitized by the ADC. For each sample, the amplitude value is measured (Vm). This value is then used in the CA to perform on-off control logic.

4.2. Control Algorithm

The CA implements a closed-loop on-off control logic. Initially, the distorted neural signals are examined for their maximum amplitude. A threshold value (Vt) is set slightly above this value, in order to differentiate the abnormal neural activity from the normal neural activity. In our implementation, the threshold value is estimated to be 2.5 V. A stimulation timeout counter (Sc) is allocated. For each sample, the measured value (Vm) is compared against the threshold value. If the measured value exceeds the threshold value, the stimulation timeout counter is reset, and the stimulation is disabled. Otherwise, the counter is incremented. When the counter content goes above a set value, the stimulation is enabled. The identification accuracy of the normal and abnormal signals is 100% as distinguishing between the normal and abnormal signals based on examining their amplitudes and using a threshold to identify the signals was a straightforward task.

4.3. Pulse Generator

The PG controls the stimulation parameters (e.g., pulse width, duty cycle, and frequency) and modulates the LED output. The stimulation parameters are set based on the required optical output. If the stimulation is disabled, then pulses are not triggered, and the LED is turned OFF. If the stimulation is enabled, then pulses are triggered, and the LED is turned ON.

5. Experimental Setup

The evaluation of the device is carried out in three stages: with the hybrid electrode, with the action potential detector, and with the integrated CLOS device.

5.1. Evaluation of Hybrid Electrode

The hybrid electrode is analyzed for two operations: (1) signal detection, and (2) optical output. The detection electrodes are analyzed in vitro by injecting synthetic neural signal through NI myDAQ (National Instruments, USA) into a saline solution. The saline solution is prepared with 9 g of NaCl (Sigma-Aldrich Pty Ltd., Castle Hill, Australia) per liter of water [22]. The signals detected by the electrodes were continuously recorded and then analyzed in MATLAB. The signals were compared against the input signals using root-mean square in MATLAB. The results showed less than 3% deviation between the two signals. The optical output of the LED was analyzed using a Thorlabs PDA36A-EC sensor and an oscilloscope, see Figure 9. The LED output was controlled by a pulse width modulation (PWM) signal generated by the ODBS. The LED was driven with varying PWM duty cycles, and the corresponding optical output and power consumption were measured.

5.2. Evaluation of Action Potential Detector

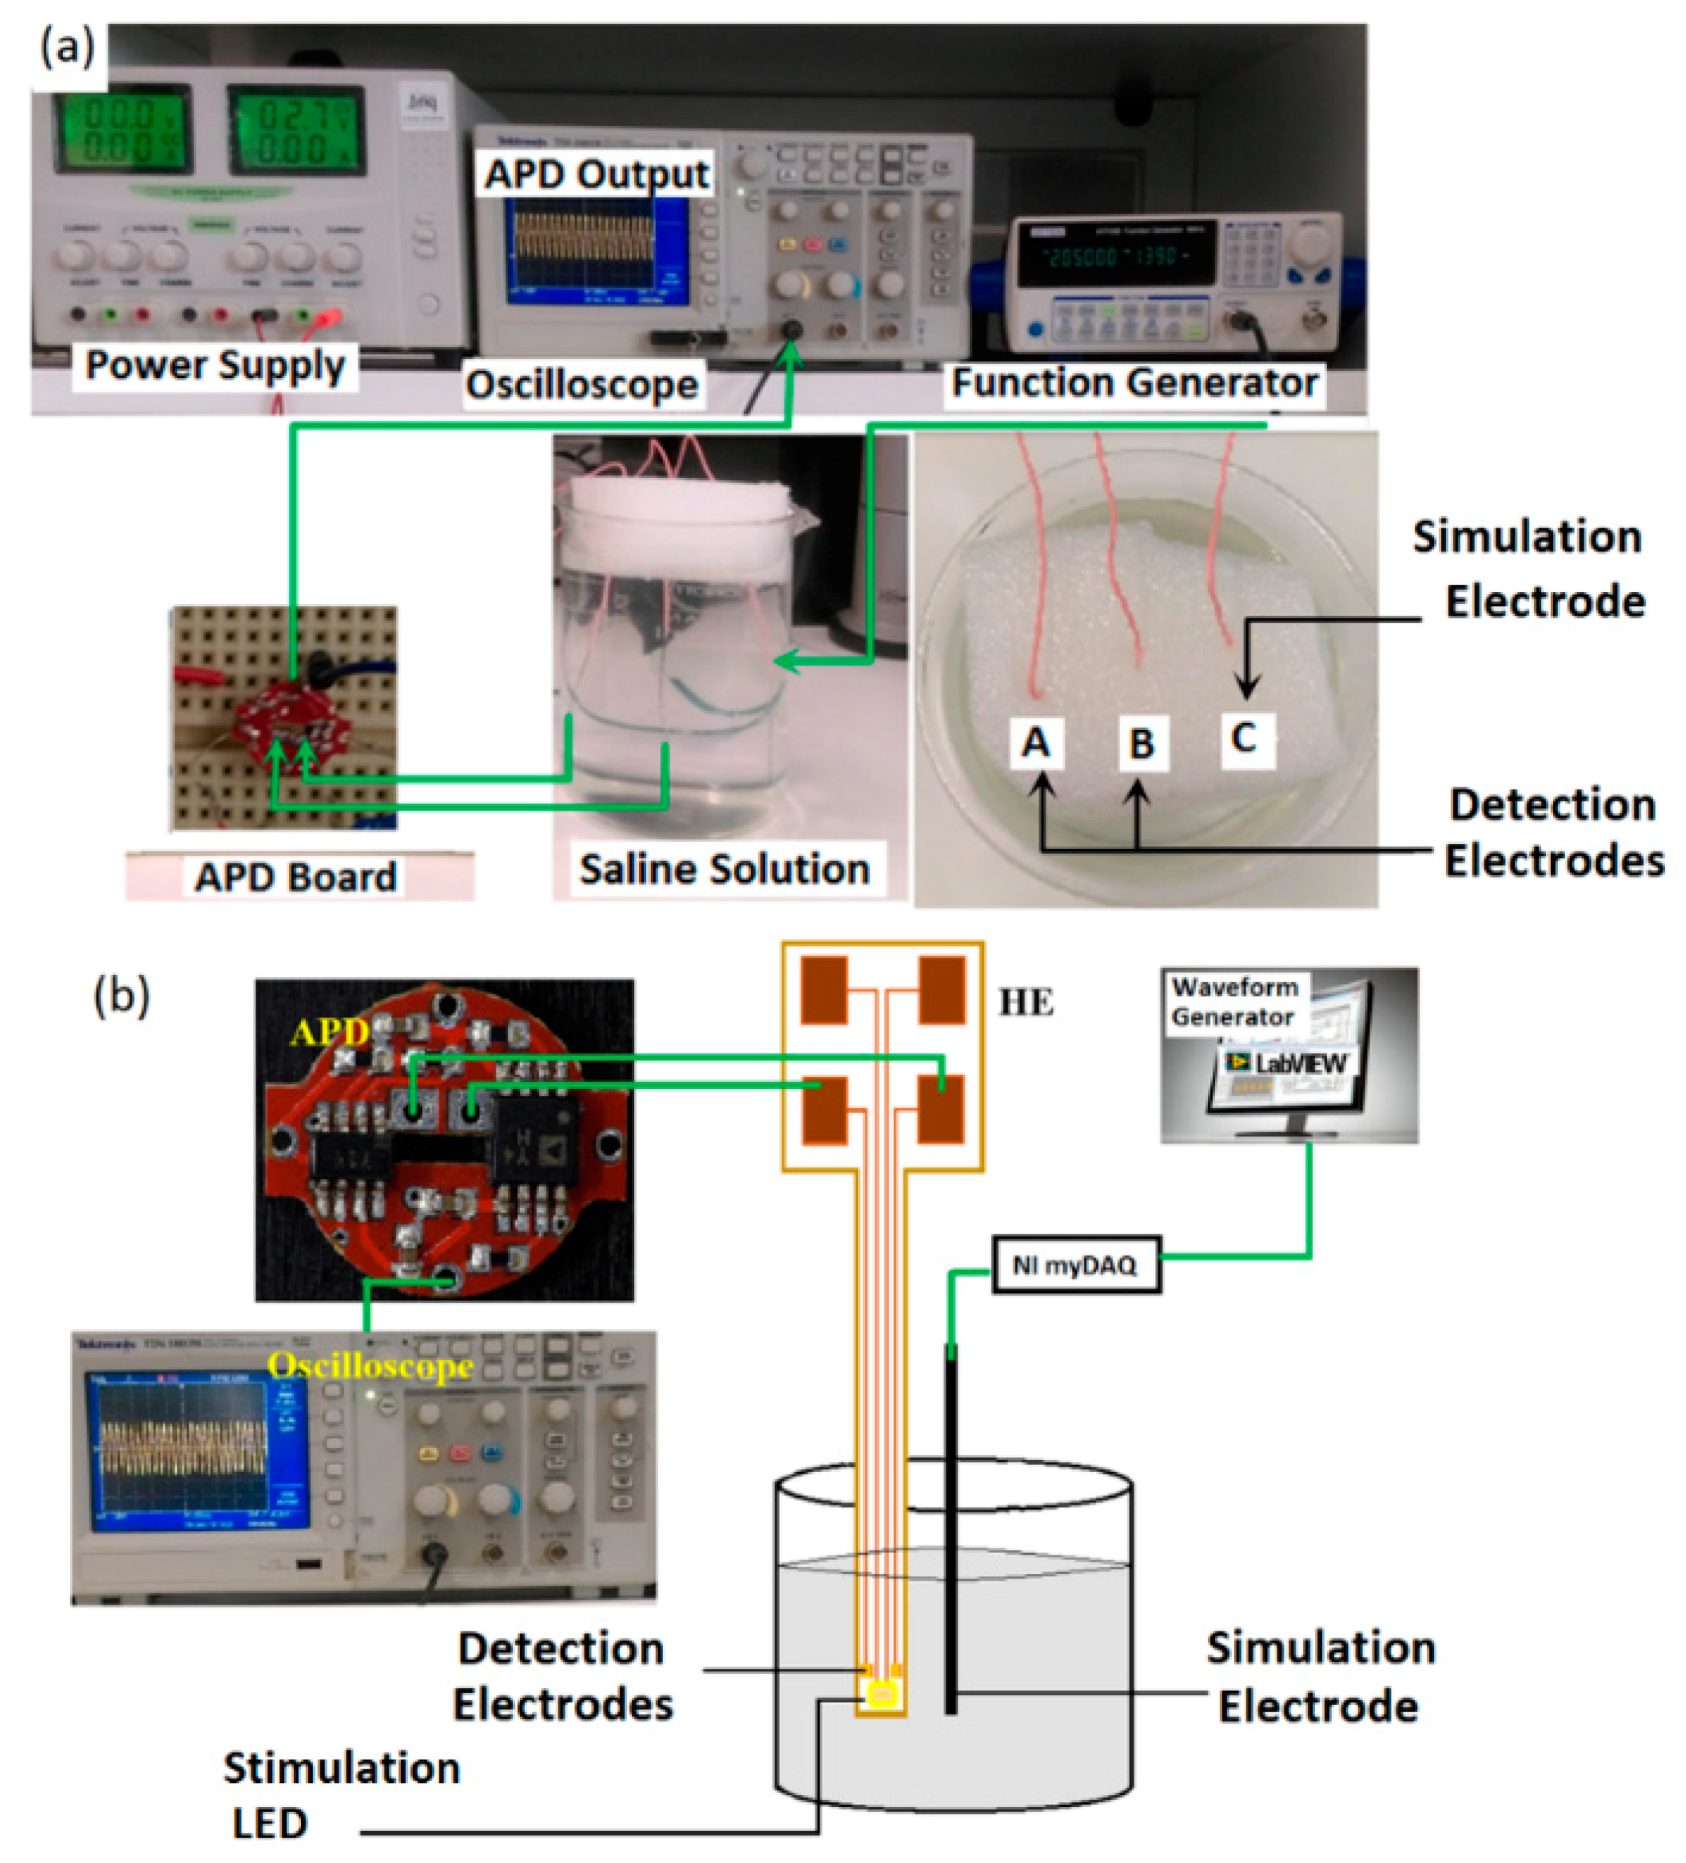
5.2.1. Bench-Testing Setup

Bench-testing of the APD was performed in two test environments: (i) with sine signals generated by a function generator, and (ii) with synthetic neural signals generated by LabVIEW. In both test environments, a power supply was used to power the APD, and its output was monitored by the oscilloscope. The input signal was either generated by a function generator or LabVIEW, see Figure 10. In both instances, the input signal was voltage divided to generate two waveforms of varying amplitudes, which served as the reference and channel input to the APD. The APD amplified and filtered the differential input. The gain and frequency response of the APD were measured by applying sine signals of varying frequencies from 100 Hz to 10 kHz at a constant amplitude. Bode analysis was performed using NI myDAQ and NI ELVISmx Bode Analyzer tool. The analog input channel AI0 acted as the stimulus channel and the analog input channel AI1 acted as the response channel.

5.2.2. In Vitro Test Setup

In vitro testing of the APD was performed in two test environments: (i) with sine signals generated by a function generator, and (ii) with synthetic neural signals generated by LabVIEW. The in vitro test setup aims to reproduce the neural detection conditions within the brain, see Figure 11. The HE consists of the detection electrodes and the stimulation LED. For the APD validation, only the detection electrodes are utilized. One additional wire electrode is used to inject sine/synthetic neural signals into the saline solution. For testing with the sine signals, the input signals are generated by the function generated within the frequency spectrum of the AP signals (i.e., 300 Hz to 6 kHz), see Figure 11a. For testing with synthetic neural signals, the signals are generated by the NI ELVISmx Arbitrary Waveform generator tool and NI myDAQ, see Figure 11b. Then, the generated signals are fed to the simulation electrode through the analog output port of NI myDAQ (AO0).

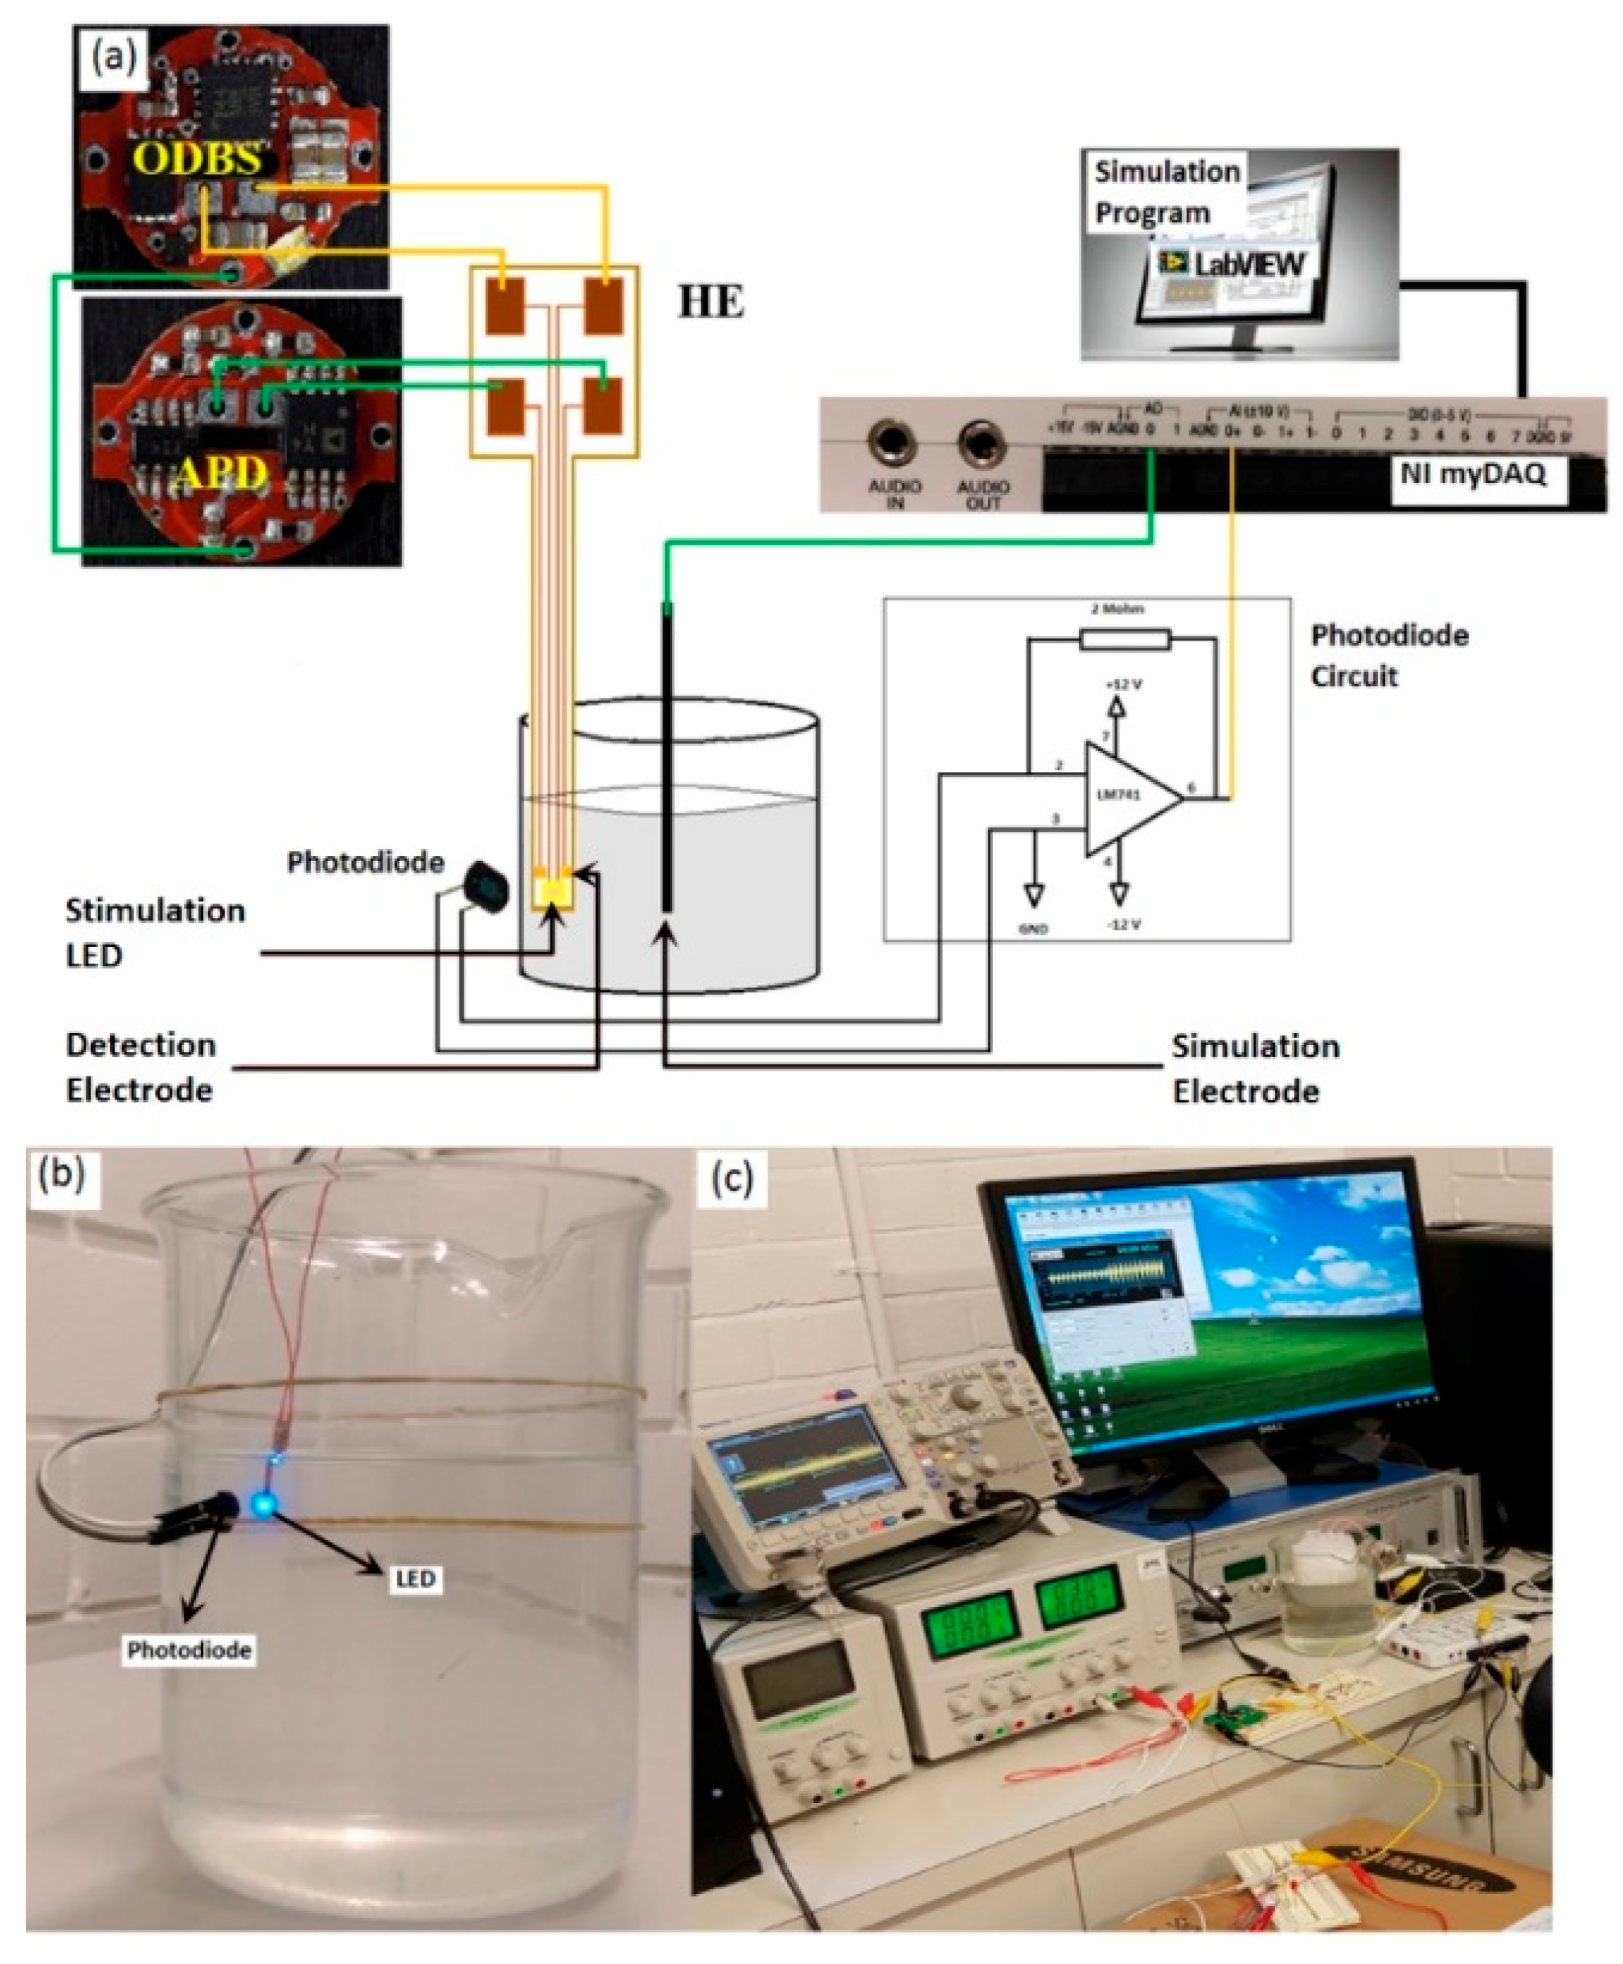
5.3. Evaluation of CLOS Device

In vitro CLOS test setup reproduces the closed-loop optogenetic stimulation condition within the brain. Apart from the HE, one additional wire electrode is used to inject synthetic neural signals into the saline solution. For testing the CLOS device, two synthetic neural signals are generated by using the LabVIEW program, see Figure 12. The optical stimulations were initiated, when the detected neural response met a set of specified criteria in the CA. This criterion was characterized as undesirable neural signal, during which neuromodulation was required. Upon neuromodulation, undesirable neural signals were altered to attain normal neural activity. Therefore, to simulate an in vitro CLOS test environment, two synthetic neural signals of varying signal features are generated by using the LabVIEW program. One waveform with low amplitude and spike count is considered as abnormal neural signal. Another waveform with high amplitude and spike count is considered as normal neural signal.
The challenge was to replicate optical stimulations, in which neural activity is altered upon optical stimulation. The simulation of optical neuromodulation was realized by a photodiode. The VTB8440BH photodiode was used to detect optical stimulations from the LED, which triggered normal neural signals through LabVIEW program. Otherwise, the LabVIEW program initiated abnormal neural signals. The generated neural signals were fed to the simulation electrode through the analog output of NI myDAQ, see Figure 13.

6. Experimental Results

6.1. Evaluation Results of Hybrid Electrode

The detection electrodes immersed in the saline solution were able to actively detect the neural signals. The comparison of the detected signals matched the waveform pattern of the actual input signals. The results show almost null measurable distortion in the output waveform.
The power consumption with and without the LED corresponding to varying PWM duty cycle of the LED was analyzed. Power consumption increased proportional to the PWM duty cycle. At 100% duty cycle, the overall power consumption was 24 mW (including the ODBS and LED), of which ~30% was contributed by the LED. Thus, it is evident that the stimulation parameters not only influence the optical output, but also the power consumption. The results also indicate that implantable chip-LEDs exhibit better optical efficacy, compared to fiber-coupled light-sources.

6.2. Evaluation Results of Action Potential Detector

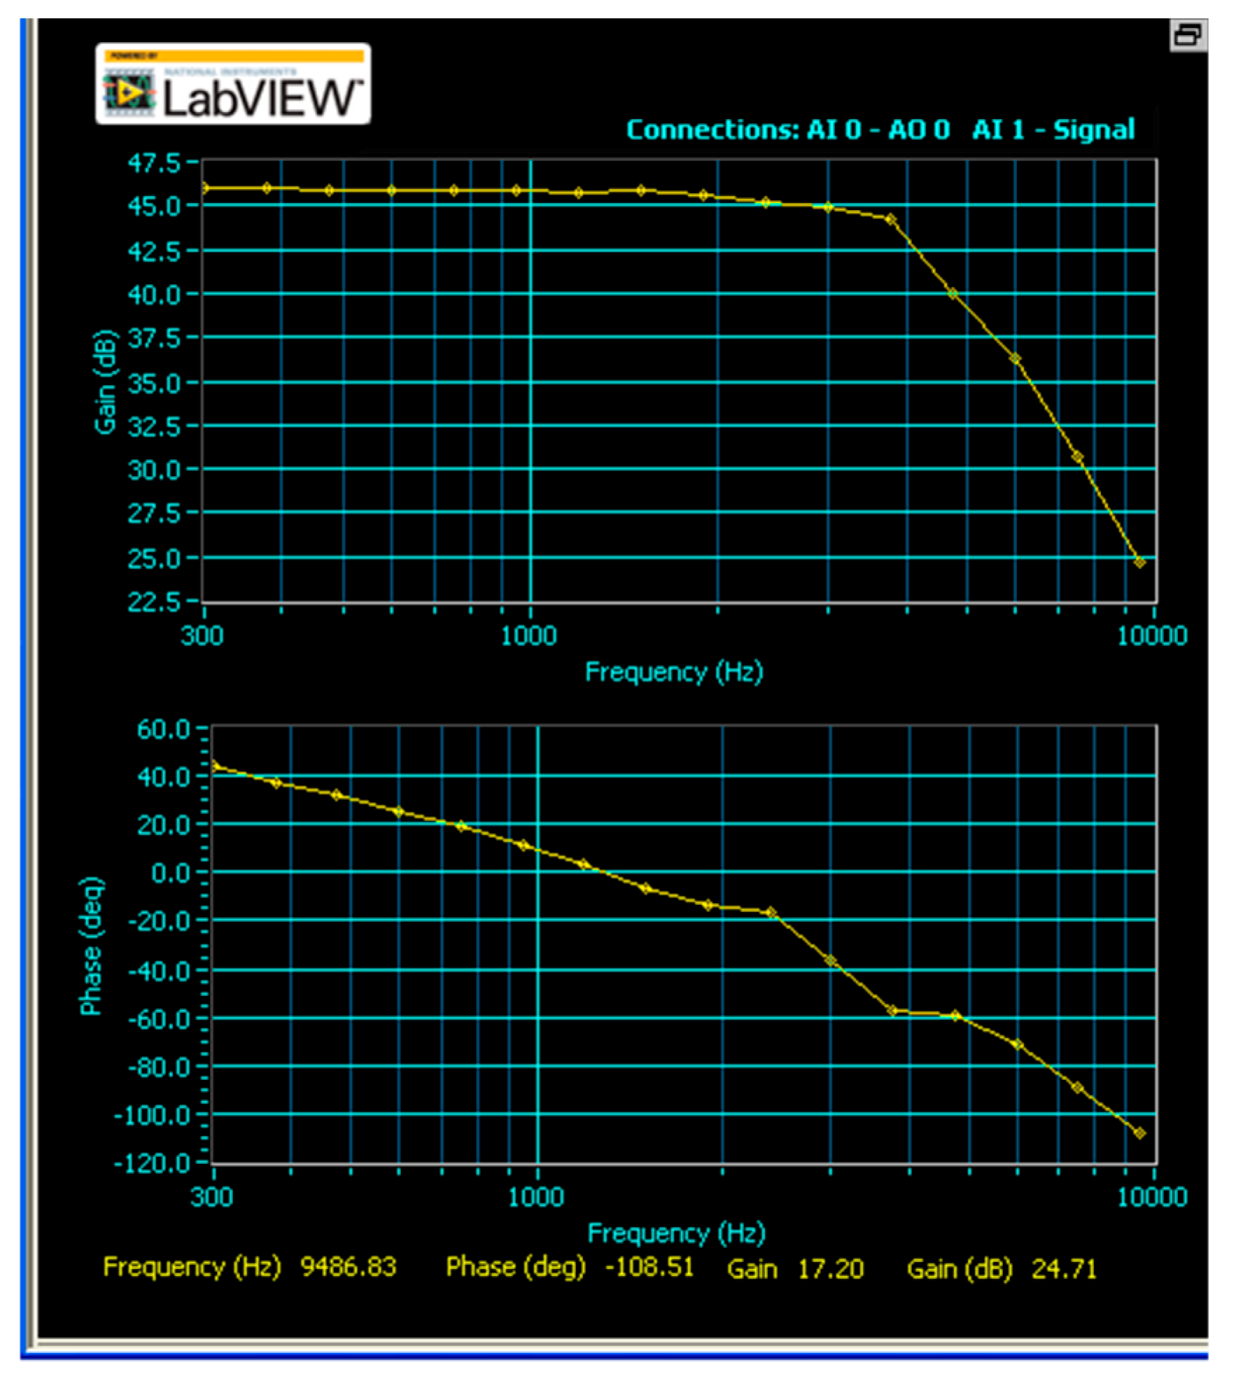
6.2.1. Bench-Testing Results

Considering ideal op-amps, the APD is estimated to provide 1600-times gain between 300 Hz and 6 kHz frequency range. Initially, the empirical response of APD was constructed using sine signals. The results matched the theoretical estimation of gain and cut-off frequency of APD, see Figure 14. A flat passband frequency response was observed between 300 Hz and 6 kHz. Output signals were observed with noise interference and distortion at frequencies below 300 Hz and above 6 kHz, which were out of the passband frequency range. The measured gain factor achieved a maximum gain of about 60 dB within the passband.
The empirical frequency response of the APD was constructed using NI myDAQ and NI ELVISmx Bode Analyzer tool. The empirical frequency response matched the simulated response, see Figure 15. Because of technical limitations in applying very low input voltage using myDAQ, higher gain configurations of the APD could not be analyzed.

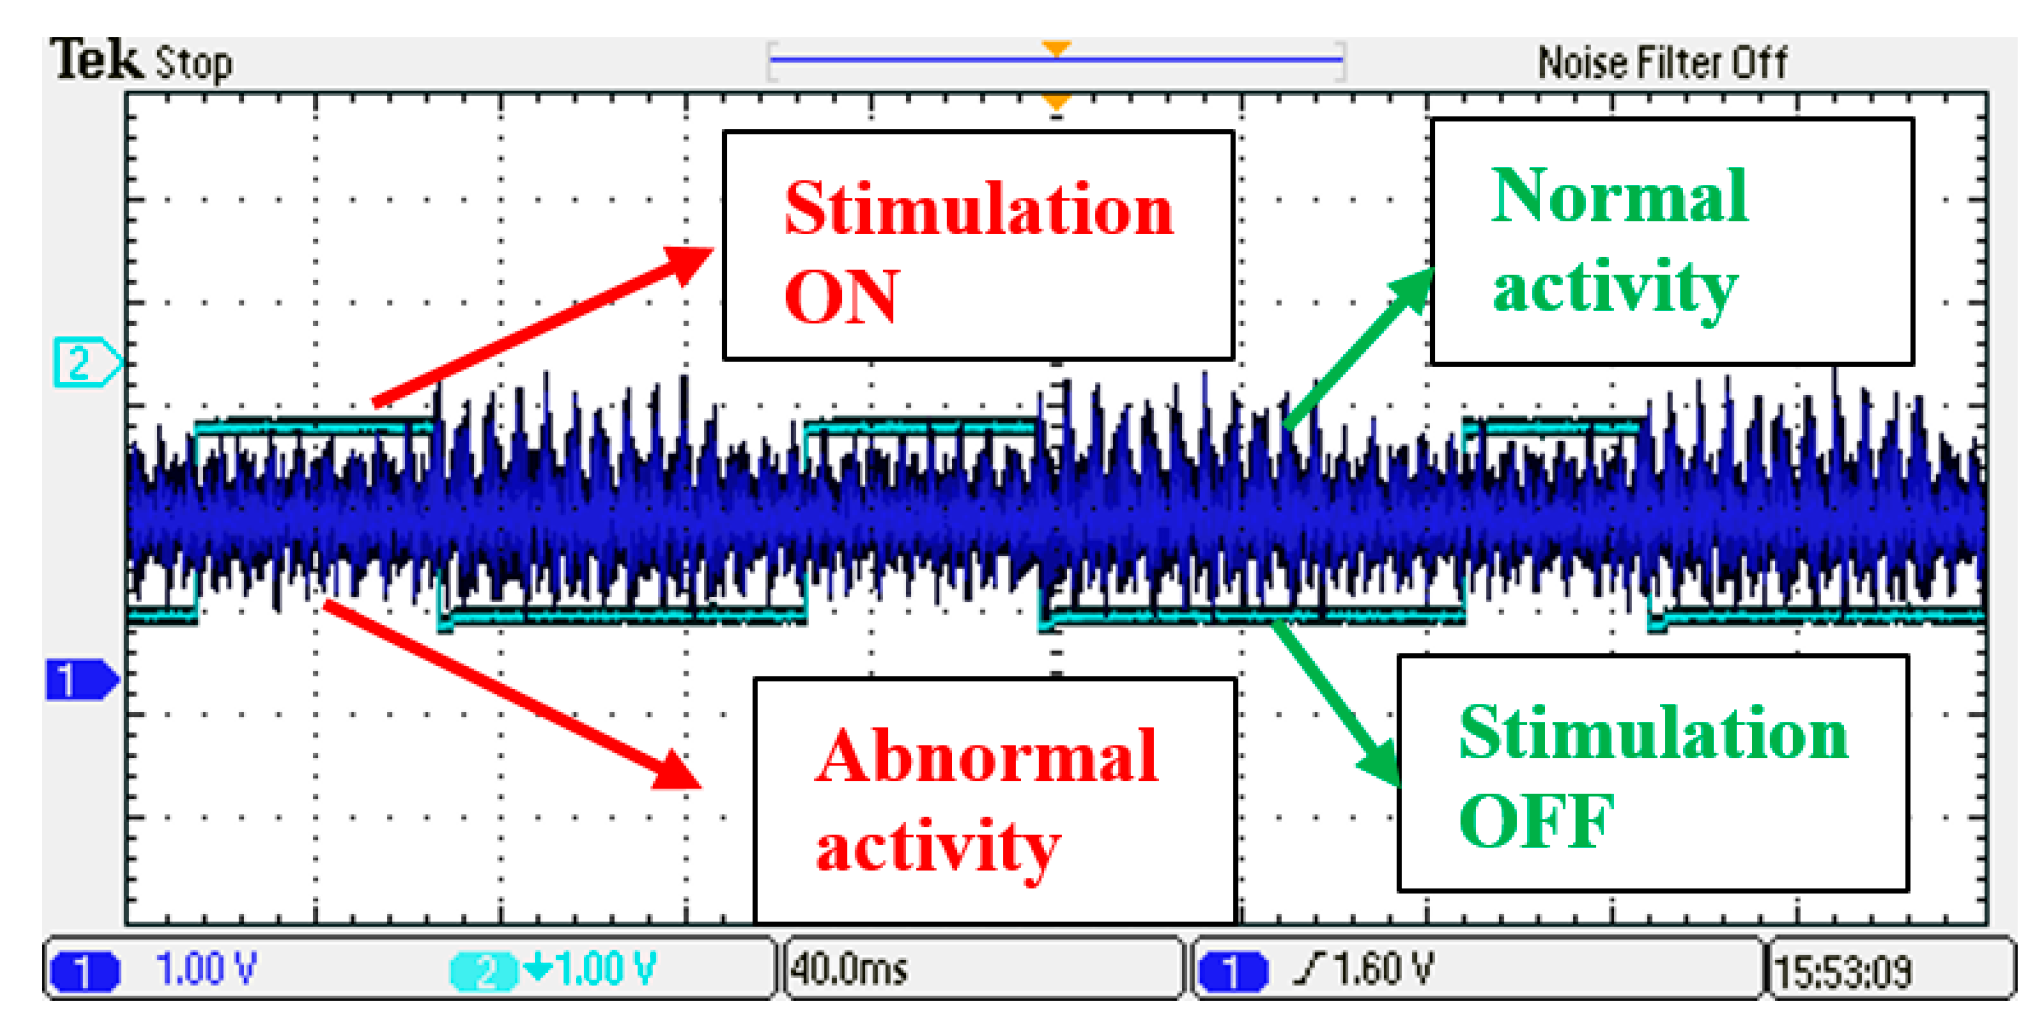
6.2.2. In Vitro Test Results

After analyzing the APD gain and frequency response, we evaluated the APD for the AP signal detection, under in vitro test condition. The output waveform recorded from the APD output during in vitro validation is presented in Figure 16. The APD output waveform verified the theoretical estimates of amplification and filtration. Further, the output was compared against the input neural signal and measured almost null distortion.

6.3. Evaluation Results of CLOS Device

During the in vitro validation of the CLOS device, the LabVIEW was used to inject abnormal signals during no optical stimulations. These signals were sensed and processed by the CLOS device, which immediately triggered optical stimulations by turning the LED ON. During LED ON, the LabVIEW injected normal neural signals to the saline solution. The CLOS device sensed and processed the normal neural signals, and hence terminated optical stimulation, see Figure 17.
In addition, a further CLOS validation was carried out using synthetic neural data that combined both normal and abnormal neural signals. A stream of alternating normal and distorted synthetic neural signals was created using the LabVIEW waveform editor. These data were injected into the saline solution using NI myDAQ. The CLOS device turned the stimulation ON upon identification of the abnormal neural activity, otherwise, turned OFF the stimulation during normal neural activity, see Figure 18. Thus, this confirmed the instantaneous capability of the CLOS device to deliver real-time closed-loop optogenetic stimulations. There was no measurable delay during CLOS. Thus, the CLOS device demonstrated fast and simple closed-loop optogenetic stimulation operation.

7. Discussion

Table 1 shows a comparison of the developed CLOS device against a number of existing counterparts. Krook-Magnuson et al. [8] used off-the-self components except for the implanted electrode and optic fiber. Similarly, Laxpati et al. [9] and Newman et al. [12] employed the open-source NeuroRighter, which is a platform dedicated for multi-electrode recording and stimulation, for closed-loop neuromodulation. These systems are bulky and require animal anesthetics or caging during in vivo experimentations. This issue is addressed in our head-mountable and tetherless CLOS device, which enables free movement of animals during in vivo trials.
A main challenge in the realization of miniature CLOS devices is the incorporation of the entire software components on-board of the device. Although Nguyen et al. [11] developed a custom device for CLOS, their neural signal analysis and closed-loop control modules were implemented in MATLAB and LabVIEW on an external computer. Similarly, other devices also required either MATLAB, LabVIEW or NeuroRighter platforms. Whereas, the CLOS device hosts the entire software on-board of the device.
Nevertheless, the CLOS device also incorporated a power-efficient hybrid electrode. The use of a chip-LED instead of LED coupled with optic fiber eliminated the optical output losses due to low coupling efficiencies, improved the device operation duration, and reduced the electrode size. Because of the small size of the LED, we could integrate both detection electrodes and stimulation LED into a single flexible board of the size 16 mm in length and 1.2 mm in width. The electrode design also improved the operation duration of the CLOS device from 2 h to more than 5 h, due to the reduced power requirement to drive the LED. Furthermore, the device cost was reduced from reported pricing of $12,000 [9] to less than $100.
On the other hand, concerns have been raised with the implantation of chip-LEDs within the brain in terms of their thermal and biocompatibility impacts on the brain tissue. These concerns have been investigated in recent studies. Rossi et al. [23] demonstrated in vivo chronic optical stimulation using an implanted LED. They conducted in vivo temperature measurements using a fluke temperature probe. The results indicated that temperature rise in the neural tissue was a function of the optical power and stimulation duty cycle. However, optical stimulations using common stimulation parameters such as 20% duty cycle and 10 mW power indicated only ~0.3 °C rise in the tissue temperature. Their research also validated long-term stability of implanted LEDs for over 50 days after surgery during in vivo experimentation. Similarly, Cao et al. [17] performed in vivo validation of an integrated neural probe hosting an implantable LED. The neural probe was encapsulated with Polydimethylsiloxane to provide thermal and electrical insulations from neighboring tissues making the probe moisture proof. Alternatively, another research work reported a polycrystalline diamond (PCD) probe with higher thermal conductivity allowing the dissipation of heat through the entire probe preventing localized heat accumulation near the LED. It maintained the maximum surface temperature of the probe below 1 °C. The probe was encapsulated with Parylene C.
In relation to the biocompatibility concern, the main approach used to provide electrical insulation and bio-stability has been the use of Parylene C in implants, electrodes, medical devices and neural interfaces [24,25]. Accordingly, further to the current in vitro experimentation reported in this paper, we plan to study the thermal properties and biocompatibility of the electrode with the CLOS device through in vivo validations in our future work.

8. Conclusions

This paper presented the design, implementation, and validation of a lightweight, portable, tetherless, and miniature closed-loop optogenetic stimulation (CLOS) device suitable for pre-clinical trials with small laboratory animals. The device is validated for its CLOS operation through bench and in vitro tests and has demonstrated its capacity to deliver instantaneous optical stimulations for prolonged operational duration. The entire device is powered by a battery and operated for over 5 h, which is suitable for pre-clinical neuroscience studies. On the other hand, there is room for improvement in terms of the CA, and multi-channel detection and stimulation configuration. Next, the CLOS device will be tested through in vivo validations under pre-clinical laboratory settings.

Author Contributions

Conceptualization, E.S.E. and A.Z.K.; methodology, E.S.E. and A.Z.K.; hardware, E.S.E. and A.Z.K.; software, E.S.E. and A.Z.K.; validation, E.S.E.; formal analysis, E.S.E.; investigation, E.S.E.; resources, A.Z.K.; data curation, E.S.E.; writing—original draft preparation, E.S.E.; writing—review and editing, E.S.E. and A.Z.K.; visualization, E.S.E.; supervision, A.Z.K.; project administration, A.Z.K. All authors have read and agreed to the published version of the manuscript.

Funding

This research received no external funding.

Conflicts of Interest

The authors declare no conflict of interest.

References

  1. Parastarfeizabadi, M.; Kouzani, A.Z. Advances in closed-loop deep brain stimulation devices. J. Neuroeng. Rehabil. 2017, 14, 79. [Google Scholar] [CrossRef] [PubMed] [Green Version]
  2. Montagni, E.; Resta, F.; Mascaro, A.L.A.; Pavone, F.S. Optogenetics in brain research: From a strategy to investigate physiological function to a therapeutic tool. Photonics 2019, 6, 92. [Google Scholar] [CrossRef] [Green Version]
  3. Cardoso-Cruz, H.; Paiva, P.; Monteiro, C.; Galhardo, V. Bidirectional optogenetic modulation of prefrontal-hippocampal connectivity in pain-related working memory deficits. Sci. Rep. 2019, 9, 1–17. [Google Scholar] [CrossRef]
  4. Deisseroth, K. Optogenetics. Nat. Methods 2011, 8, 26–29. [Google Scholar] [CrossRef]
  5. Edward, E.S.; Kouzani, A.Z.; Tye, S.J. Towards miniaturized closed-loop optogenetic stimulation devices. J. Neural Eng. 2018, 15, 021002. [Google Scholar] [CrossRef] [PubMed]
  6. Wu, H.; Ghekiere, H.; Beeckmans, D.; Tambuyzer, T.; Van Kuyck, K.; Aerts, J.M.; Nuttin, B. Conceptualization and validation of an open-source closed-loop deep brain stimulation system in rat. Sci. Rep. 2015, 5, 9921. [Google Scholar] [CrossRef] [PubMed] [Green Version]
  7. Grosenick, L.; Marshel, J.H.; Deisseroth, K. Closed-loop and activity-guided optogenetic control. Neuron 2015, 86, 106–139. [Google Scholar] [CrossRef] [PubMed] [Green Version]
  8. Krook-Magnuson, E.; Armstrong, C.; Oijala, M.; Soltesz, I. On-demand optogenetic control of spontaneous seizures in temporal lobe epilepsy. Nat. Commun. 2013, 4, 1376. [Google Scholar] [CrossRef] [PubMed] [Green Version]
  9. Laxpati, N.G.; Mahmoudi, B.; Gutekunst, C.A.; Newman, J.P.; Zeller-Townson, R.; Gross, R.E. Real-time in vivo optogenetic neuromodulation and multielectrode electrophysiologic recording with NeuroRighter. Front. Neuroeng. 2014, 7, 40. [Google Scholar] [CrossRef] [PubMed]
  10. NeuroRighter. Available online: https://sites.google.com/site/neurorighter/ (accessed on 22 December 2019).
  11. Nguyen, T.K.; Navratilova, Z.; Cabral, H.; Wang, L.; Gielen, G.; Battaglia, F.P.; Bartic, C. Closed-loop optical neural stimulation based on a 32-channel low-noise recording system with online spike sorting. J. Neural Eng. 2014, 11, 046005. [Google Scholar] [CrossRef] [PubMed]
  12. Newman, J.P.; Fong, M.F.; Millard, D.C.; Whitmire, C.J.; Stanley, G.B.; Potter, S.M. Optogenetic feedback control of neural activity. Elife 2015, 4, e07192. [Google Scholar] [CrossRef] [PubMed] [Green Version]
  13. Pashaie, R.; Baumgartner, R.; Richner, T.J.; Brodnick, S.K.; Azimipour, M.; Eliceiri, K.W.; Williams, J.C. Closed-loop optogenetic brain interface. IEEE Trans. Biomed. Eng. 2015, 62, 2327–2337. [Google Scholar] [CrossRef] [PubMed]
  14. Kwon, K.Y.; Sirowatka, B.; Weber, A.; Wen, L. Opto-micro ECoG array: A hybrid neural interface with transparent micro ECoG electrode array and integrated LEDs for optogenetics. IEEE Trans. Biomed. Circuits Syst. 2013, 7, 593–600. [Google Scholar] [CrossRef] [PubMed]
  15. Lee, S.T.; Williams, P.A.; Braine, C.E.; Lin, D.T.; John, S.W.; Irazoqui, P.P. A miniature, fiber-coupled, wireless, deep-brain optogenetic stimulator. IEEE Trans. Neural Syst. Rehabil. Eng. 2015, 23, 655–664. [Google Scholar] [CrossRef] [PubMed]
  16. Cree Direct Attach DA2432 LEDs CxxxDA2432-Sxx00-x Data Sheet. Available online: https://www.cree.com/led-chips/media/documents/CPR3FM.pdf (accessed on 22 December 2019).
  17. Cao, H.; Gu, L.; Mohanty, S.K.; Chiao, J.J. An integrated micro-LED optrode for optogenetic stimulation and electrical recording. IEEE Trans. Biomed. Eng. 2013, 60, 225–229. [Google Scholar] [CrossRef] [PubMed]
  18. AD8293. Available online: https://www.mouser.com/datasheet/2/609/AD8293G80_160-877846.pdf (accessed on 22 December 2019).
  19. AD8237. Available online: https://www.analog.com/media/en/technical-documentation/data-sheets/AD8237.pdf (accessed on 22 December 2019).
  20. ATtiny44A. Available online: http://ww1.microchip.com/downloads/en/devicedoc/8183s.pdf (accessed on 22 December 2019).
  21. CAT4104. Available online: https://www.onsemi.com/pub/Collateral/CAT4104-D.pdf (accessed on 22 December 2019).
  22. Qian, X.; Chen, Y.; Feng, Y.; Ma, B.; Hao, H.; Li, L. A method for removal of deep brain stimulation artifact from local field potentials. IEEE Trans. Neural Syst. Rehabil. Eng. 2017, 25, 2217–2226. [Google Scholar] [CrossRef] [PubMed]
  23. Rossi, M.A.; Go, V.; Murphy, T.; Fu, Q.; Morizio, J.; Yin, H.H. A wirelessly controlled implantable LED system for deep brain optogenetic stimulation. Front. Integr. Neurosci. 2015, 9, 8. [Google Scholar] [CrossRef] [PubMed] [Green Version]
  24. Hsu, J.M.; Rieth, L.; Normann, R.A.; Tathireddy, P.; Solzbacher, F. Encapsulation of an integrated neural interface device with Parylene C. IEEE Trans. Biomed. Eng. 2009, 56, 23–29. [Google Scholar] [CrossRef] [PubMed]
  25. Kuppusami, S.; Oskouei, R.H. Parylene coatings in medical devices and implants: A review. Univers. J. Biomed. Eng. 2015, 3, 9–14. [Google Scholar]
Figure 1. Proposed closed-loop optogenetic stimulation device. (a) Hybrid electrode. (b) Action potential detector. (c) Optogenetic deep brain stimulator.
Electronics 09 00096 g001
Figure 2. Head-mountable configuration.
Electronics 09 00096 g002
Figure 3. (a) Hybrid electrode. (b) Electrode size. (c) Operation of the LED.
Electronics 09 00096 g003
Figure 4. Schematic of the action potential detector.
Electronics 09 00096 g004
Figure 5. Schematic of the optogenetic stimulator.
Electronics 09 00096 g005
Figure 6. (a) Unassembled board. (b) Action potential detector (APD). (c) Optogenetic deep brain stimulator (ODBS).
Electronics 09 00096 g006
Figure 7. Closed-loop optogenetic stimulation (CLOS) device. (a) Connections between the hardware modules. (b) Weight of the device with battery. (c) Weight of the device without battery. (d) Integrated CLOS device.
Electronics 09 00096 g007
Figure 8. Pseudo-code for the software component.
Electronics 09 00096 g008
Figure 9. Setup for the electrode analysis.
Electronics 09 00096 g009
Figure 10. Bench-testing setup for the APD evaluation. (a) With sine signal. (b) With synthetic neural signal.
Electronics 09 00096 g010
Figure 11. In vitro test setup for the APD evaluation. (a) With sine signal. (b) With synthetic neural signal.
Electronics 09 00096 g011
Figure 12. Pseudo-code for LabVIEW program.
Electronics 09 00096 g012
Figure 13. In vitro validation of the CLOS device. (a) In vitro setup. (b) Photodiode and LED setup. (c) In vitro evaluation.
Electronics 09 00096 g013
Figure 14. Output of APD, (a) for input sine signal below 300 Hz, (b) for input sine signal of 1 kHz, and (c) for input sine signal greater than 6 kHz. (d) Plot of APD output at varying frequency range and constant amplitude.
Electronics 09 00096 g014
Figure 15. Empirical frequency response of the APD.
Electronics 09 00096 g015
Figure 16. APD output during in vitro validation.
Electronics 09 00096 g016
Figure 17. Stimulation control signal of the CLOS device.
Electronics 09 00096 g017
Figure 18. In vitro test results of the CLOS device.
Electronics 09 00096 g018
Table 1. Comparison of the developed CLOS device against existing counterparts.
RefDetection ElectrodeStimulation ElectrodeDetector CircuitStimulator CircuitSoftware Size/WeightPower SupplyFixation Method
[8]Plastics One electrodeFiber-coupled diode laserAnalogue Brownlee 410 amplifierNI USB-6221BNC digitizer, optical patch cords MATLAB Bench-top_ Screws and dental cement
[9] 16-channel tungsten MEA, NeuroNexus arrayPlexon Fiber-coupled LEDTriangle Biosystems recording head-stagePlexon V-I controllerNeuro-Righter platformBench-top_Flexible cable, skull screws
[11]32-channel electrodesFiber-coupled LEDRHA2132 amplifier, AD7980 digitizerLED driverMATLAB and LabVIEWBench-top setup PCB—29.5 mm × 43.3 mmBattery +3 V and +5 VFlat cable, micro-drive and screw
[12] MEAFiber-coupled LEDMultichannel systems MEA60 analog amplifier, RZ2 multichannel bio acquisitionCustom LED driverNeuro-Righter platform Bench-top__
[13] 4 × 4 µECoG arrayLaser source and arc lampTucker–Davis high impedance amplifierDigital micromirror deviceComputer based systemBench-top Implant—400 mg__
This workHybrid electrode with implantable LEDAmplifier and filterLED driver and micro-controllerEmbedded C program Head-mountable Size: 6 mm diameter; Weight: 0.44 g LiPo Battery +3.7 VNo tether

