1. Introduction
Modern power grids need to be smarter to provide a sustainable and affordable power supply in the context of ever-increasing consumer demand. The smart grid (SG) is a modern version of the traditional power network that is emerging as monitoring technology advances and power use continues to grow [
1]. This network functionally includes control centers, transmission networks, and substations.
The SG is a cost-effective distributed power line condition monitoring system that allows for the two-way flow of power and information between the customers and providers of an energy service, which improves the efficiency and stability of power delivery [
2]. By using this two-way communication, the advanced metering infrastructure (AMI) makes the energy service not only reliable and secure, but also cost-effective throughout the system [
3]. Technically, the smart grid is a modern solution that adopts a unique digital platform to provide innovative sensing [
4], signal processing, communication, and computing capabilities [
5]. Together with advanced metering and the automation of distribution, the creation of the technical foundation for a smart grid that combines power communication and computer control can lead to a significant improvement in reliability and grid capacity. Furthermore, smart grids track every data point in the system of the energy distribution cycle, which makes it possible to monitor and control the energy service in real time, including pricing, production, and consumption. Consequently, the energy service providers are able to achieve efficient load balancing and a reliable transfer of energy. As a result, smart grids provide better autonomous control measures and improved efficiency through innovative product type solutions.
Along with the development of smart grids, the proportion of electric vehicles (EVs) is expected to increase due to climate concerns, rising crude oil prices, technological advances, and advances in the automatic control of EVs [
6]. International Energy has a plan to have more than 20 million EVs by 2020. As EVs consistently need to be recharged, they require a plan for effective and intentional use of energy otherwise, a large number of EVs can cause an overload [
7]. EVs and their peripheral products constitute a large disperse network of data-collecting elements, promoting the development of the Internet of Things (IoT) [
8]. EVs can also promote urban development through the integration of renewable energy and comparatively low emissions. There are two modes of EV in the power grid: Consumers and producers. In this context, consumer means grid-to-vehicle (G2V) and the producer means vehicle-to-grid (V2G) [
9]. In the consumer mode (G2V), the electric vehicle can be charged.
In recent years, various electric vehicle charging scheduling schemes and pricing strategies have been proposed to reduce charging operation costs and improve grid reliability. A centralized hybrid game strategy for charging and discharging has been proposed in a V2G network [
10], so as to eliminate the need for a centralized control system, developing a distributed charging strategy for plug-in hybrid vehicles. In addition to charging scheduling control [
11], more and more research has been conducted on designing appropriate demand response mechanisms to improve overall system efficiency [
12]. Dynamic pricing decision mechanisms based on charging stations and electric vehicles have been considered [
13]. However, most existing studies assume a certain understanding of the arrival of future electric vehicles and electricity prices [
14]. Some researchers have proposed that the Markov Decision Process (MDP) is based on the premise that the distribution of future events is known [
15]. However, the assumed distribution and actual time distribution often do not match, resulting in inefficient pricing and scheduling strategies in actual scenarios. In recent years, machine learning has become one of the most active technologies in many research fields. In natural language processing, image recognition has made remarkable achievements. Therefore, a learning-based approach driven by real data is ideal for solving this problem. For example, some papers have proposed a real-time EV charging strategy based on reinforcement learning [
16]. When EVs participate in demand response plans with real-time price signals, making full use of these price signals can greatly reduce charging costs. Another paper proposed a ML-based demand response strategy to control electric vehicle charging in response to real-time pricing, thereby minimizing the overall energy cost of electric vehicles. However, these algorithms all arrange users’ charging strategies based on electricity prices to minimize user charging costs. In order to maximize the profit of the electricity supplier, it is necessary to predict the actual charging behavior of the user so as to formulate an optimal electricity price to maximize profit.
Based on the above reasons, we propose a 5G smart grid electric vehicle charging behavior prediction method based on hybrid intelligence. This method consists of two parts, one is a smart grid network architecture based on cloud computing and fog computing, and the other is a user behavior analysis method based on human in the loop (HITL)-based K-Means clustering and k-nearest neighbors (k-NN) algorithm running on this structure. The smart grid network architecture based on cloud computing and fog computing is the hardware foundation for implementing intelligent algorithms and consists of three layers. The user layer is used to collect user information, the service layer is responsible for data analysis, request response, and provides cloud computing, fog computing, data driven charge and discharge scheduling determined by artificial intelligence technology, and finally multiple communication technologies are integrated at the network layer to ensure the interaction between the user layer and service layer. This structure can give full play to the big data computing capability of cloud computing and the real-time response capability of fog computing, ensuring the efficient real-time operation of the proposed algorithm. The HITL-based K-Means clustering and k-NN algorithm is the core of software predicting the charging behavior of EV. It marks the data set through an automatic process, making it unnecessary for new users to join the charging network clustering. This method can dispatch electric vehicles in the smart grid more efficiently. Cross-validation experiments and performance evaluation measures show that this technology can classify the charging behavior of users and has good prediction ability. The classification results can be used as an important basis for scheduling charge and discharge.
In this article, we first present the three-tier architecture of a smart grid. Then we introduce the application of hybrid artificial intelligence in V2G systems. Finally, we conclude the article.
2. Smart Grid Network Architecture with EV Access
2.1. Network Architecture Design
In this section, we introduce the smart grid network architecture based on cloud computing and fog computing, which is the hardware foundation for implementing intelligent algorithms. The smart grid network architecture consists of three layers, namely the user layer, service layer, and network layer. The user layer is used to collect user information, the service layer is responsible for data analysis, requesting responses, and providing data-driven charging and discharging scheduling determined by cloud computing, fog computing, and AI technology, and the network layer integrates multiple communication technologies to ensure the interactions of the user layer and service layer. The smart grid network architecture based on cloud computing and fog computing is the hardware foundation, which can realize various intelligent algorithms.
As shown in
Figure 1, according to the cross-layer design, the V2G auxiliary service system framework of this model can be divided into the service layer [
17], network layer, and user layer. This cross-layer design takes into account the information integration and service interaction requirements of the service network and security requirements of all levels [
18].
The V2G auxiliary service system adopts service-oriented technology, optimized control, and coordinated control theory to guide the distributed control system. The specific application of service-oriented technology is based on the actual charging demand of EV users and the real-time operating state of the power grid. Information interaction and hierarchical control can be achieved through visualization technology and user interface technology.
Figure 2 is the implementation diagram of EV grid integration, which shows the three layers of the V2G auxiliary service system mentioned above. The mesh communication between EV and EV supply equipment can be achieved through power line communication (PLC) and 5G networks. The data from electric vehicles and any other devices is stored by cloud. It could be processed for a variety of application purposes, such as optimized charging.
As shown, the user layer could provide an interface for the user to interact with the service and collect the information of each entity in real time and upload it to the network layer. The network layer is the connection between the user layer and service layer. The service layer is responsible for dealing with user requests, making intelligent decisions, and providing macro control over the entire grid.
2.2. The User Layer
The user layer is the lowest level and it is composed of various types of end-users. The end-users are comprised of all vehicle-to-grid system entities and electric vehicle users that need to use the services in service layer. The end-users can initiate a service request to the service layer through the service access point (SAP) using the communication device. Accordingly, they will also receive responses from the upper layers through a similar SAP.
The data collected by sensors on EVs are diverse and plentiful. It includes the user’s driving behavior as uploaded by smart devices and wearable devices, battery security data collected by the battery sensors, and EV charging information uploaded by the charging station. This makes it easy to collect EV user behavior information, including the distance of the trip, the connection and disconnection times of the charger, and the battery state of charge (SOC). These data could be used to analyze the behavior of EV users through artificial intelligence algorithms.
2.3. The Network Layer
The network layer consists of a variety of communication devices and technologies that enable interaction between data in the user layer and computing resources in the service layer. In the network layer, 5G communication is the most widely used. The network layer also integrates other common communication technologies such as 3G/4G, satellite, GPS, etc., to form a heterogeneous converged network [
19].
In smart grids, utilities may face bandwidth blocking caused by large amounts of data transmission, which may lead to communication barriers. This is because with the popularity of V2G services, the number of uploaded data has grown rapidly. However, in the context of 3G or 4G, the service layer could not fully meet the V2G service performance specifications. Fortunately, the 5G mobile network supports a variety of connectivity and transmission advantages and is expected to readily facilitate services provided by various clouds. 5G technology features high speed, high capacity, low power consumption, low delay, and high reliability [
20]. It is the main development direction of mobile Internet and IoT, which can fully meet the bandwidth, delay, reliability, security, and mobility requirements of the V2G system [
21].
In the V2G communication of the auxiliary service system, we propose to apply 5G technology. Specifically, as V2G uses multicast to aggregate data about the remaining energy in EVs and release the energy requirements of the smart grid. It has shortcomings such as bandwidth, delay, reliability, safety, and mobility, which can be solved by 5G technology. First, we analyzed the communication requirements and communication technologies in the V2G system. Next, we designed an overall system architecture and information transmission process based on 5G technology. This process includes a V2G service connection process initiated by the EV, a V2G service connection process initiated by the V2G server, and an aggregator registration update process initiated by the EV. Our proposed 5G-based V2G system can meet the requirements of wireless communication networks, allowing it to improve the integration of renewable energy with the power grid. Together, this improves the economic and environmental efficiency of the power grid.
EVs send V2G service data messages to the aggregator through the Internet interface, and then the aggregator updates the corresponding Internet ID in the main table of the EV information module and sets the network label of the data exchange. Therefore, the aggregator can receive IP packets from the EV [
22]. When the electric vehicle uses a two-way charger for charging, the PLC and the aggregator are used for data interaction, and the aggregated data is transmitted to the cloud computing center via 5G communication. When the electric vehicle is traveling, the sensor real-time data and user requests are sent to the cloud computing center through the car-connected wireless network. When the power demand on the consumer side of the grid changes drastically, the charging point (CP) accesses these sensors through multicast technology to summarize the battery status of the EV, issue the power demand, and assign the state of charge (SOC) transition instructions in V2G [
23].
2.4. The Service Layer
The service layer consists of two parts: A traditional cloud layer and a temporary fog layer. The service layer can provide various V2G services to end-users of the user layer through SAP.
Cloud computing (CC) is a kind of distributed computing technology. It splits a huge computational processing program into a myriad of smaller subroutines through the network and passes the processing results back to the user after calculation and analysis. We have integrated cloud computing and V2G systems to enable V2G system entities to handle more complex service applications.
However, providing a reliable and low latency response V2G service is a new challenge. In detail, in V2G system, smart meters can collect large amounts of data from EVs, drivers, charging stations, and infrastructure, which requires the execution of data analysis tools on the cloud. Since this data is different in volume, velocity, and variety, storing, processing, and analyzing the data is a challenging task. Although SG can transfer all data to the cloud-based infrastructure for further processing, it is difficult for Cloud Computing (CC) to store and process these collected data in a short time. Therefore, we apply fog computing (FC) to solve these problems.
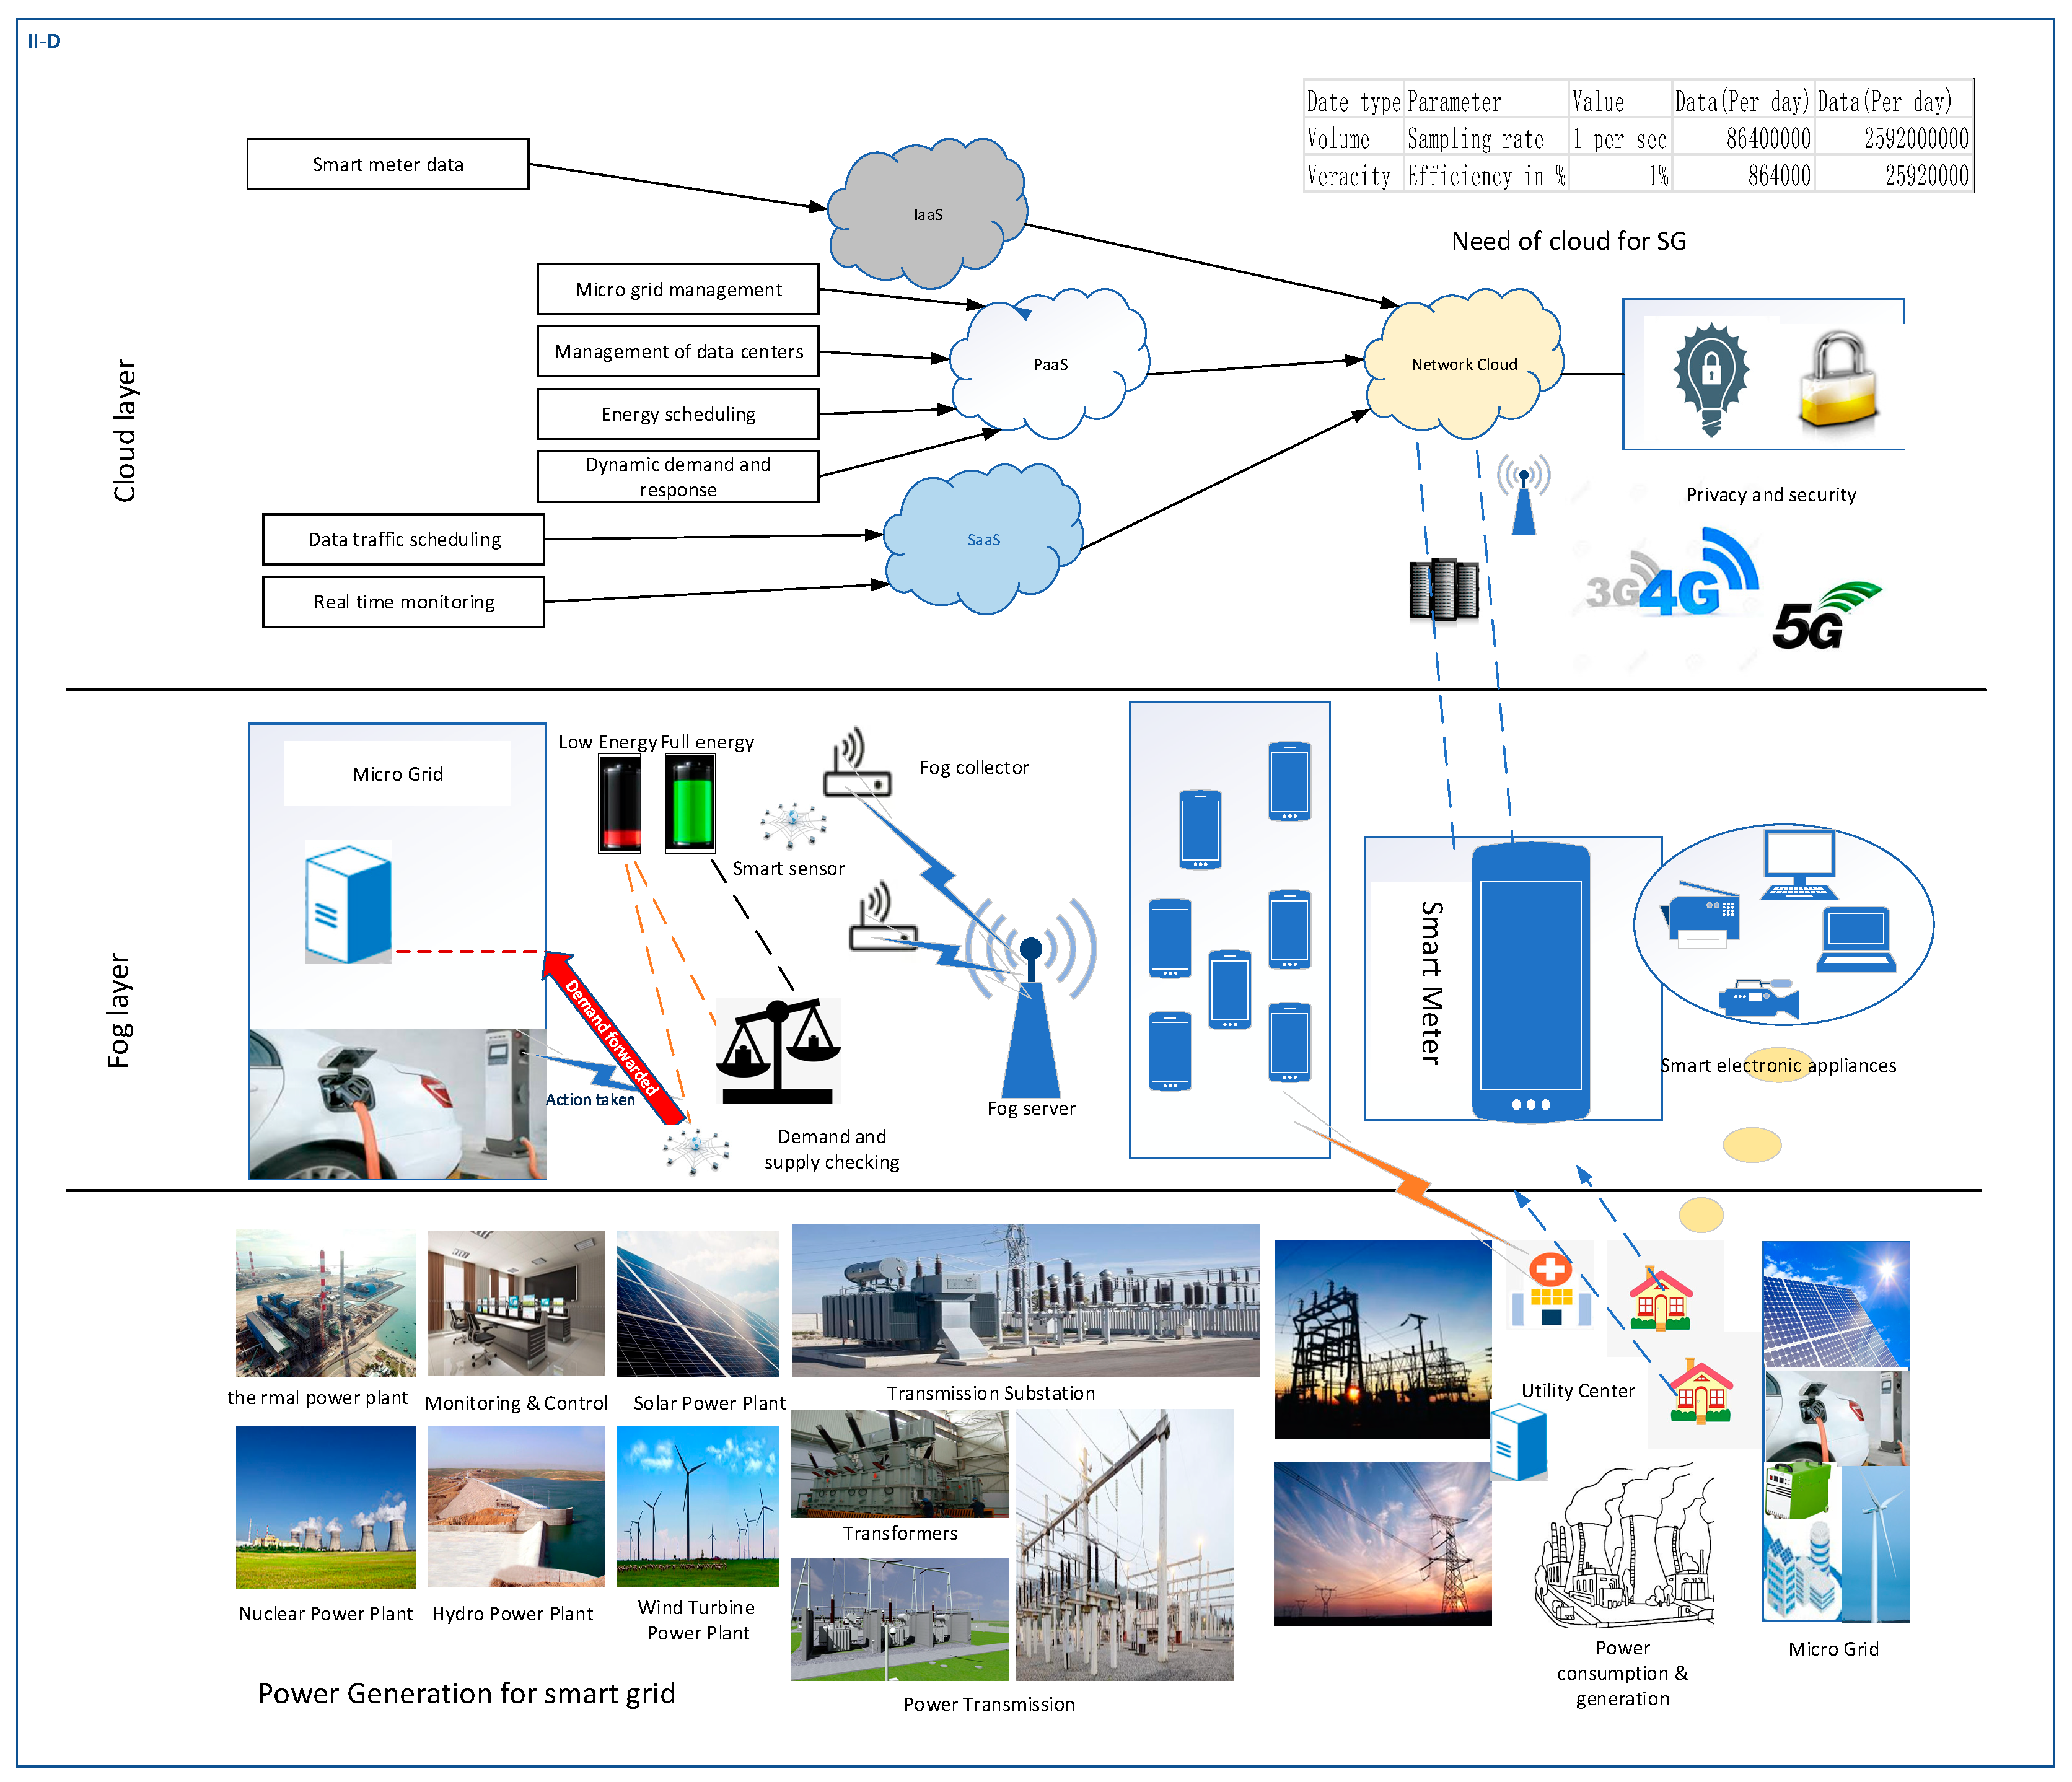
Fog computing, as shown in
Figure 3, is an integrated version of mobile cloud computing (MCC) and mobile edge computing (MEC) that demonstrates a better infrastructure that includes resources for network edge services to provide applications for future Internet and services [
24]. Generally, it acts as a bridge between the terminal device and the cloud. FC collects data from SG entities and then stores and calculates them locally. The data is transferred to the cloud for storage after processing. It reduces the need for network bandwidth for overly large data and can help protect sensitive data by providing local analytics.
3. Hybrid Artificial Intelligence
3.1. The Introduction of Hybrid Artificial Intelligence
AI is an area of computer science that addresses common cognitive problems related to human intelligence, such as learning, problem solving, and pattern recognition. Despite the great progress made in the artificial intelligence approach, most effective artificial intelligence systems require a high degree of manual supervision to prevent errors [
25]. This is largely because artificial intelligence can only move toward a specific goal, while human intelligence can flexibly adjust the target according to the current situation. The successful application of AI depends not only on big data and powerful algorithms but also on people-oriented design. Specifically, AI should reflect the realities of user needs. To achieve this, we introduced the concept of Human-in-the-loop (HITL) hybrid intelligence.
HITL is the combination of supervised machine learning (SML) and active learning (AL) [
26]. This concept uses human and machine intelligence to create machine learning models. In this process, humans directly participate in algorithm training, parameter adjustment, and result judgment, as shown in
Figure 4. User feedback can help overcome the deficiencies of the AI system, leading to a virtuous cycle of tasks. In this way, the decision-making ability of the AI system can be greatly enhanced and errors would largely be decreased. In conclusion, our goal is to use human training to reduce errors in AI predictions and improve the accuracy of the AI algorithm.
We could apply HITL in situations where: (1) There is little data available at present. Because of the scarcity of data in the early stages of a project, it is difficult to classify the data. At this stage, people can make initial judgments, from which the machine can learn and eventually take over the tasks. (2) The cost of errors is high. If errors will cause great interference to the AI prediction results, manual supervision is required. (3) There are class imbalances. Machines are prone to errors when dealing with imbalanced data, but humans can solve these problems by modifying the AI algorithm.
3.2. The Impact of EV User Charging Behavior on the Grid
Unregulated charging of electric vehicles will likely pose great challenges to a city’s power supply system. In contrast, the controlled charging behavior of an EV can actually enhance the stability of the smart grid and achieve peak shaving and valley filling effects [
27]. The user’s charging behavior mainly affects the stability of the grid by the following factors: (1) The time to start charging and time to end charging: If all users choose to start charging their electric car after work and end charging in the morning, this activity would accentuate the peaks and valleys of the grid. (2) The amount of charging required: Users that need more charge will absorb more power from the grid. (3) Charging scene of the electric car: If an electric car is charged during travel, it has a higher charging priority and is not very predictable. However, if a user is charging at home at night, the charging priority is lower, and the charging behavior of the user can be reasonably scheduled to improve the stability of the smart grid.
3.3. Use HITL to Analyze User’s Charging Behavior
Power companies should develop appropriate rules to manage the charging behavior of electric vehicles. By analyzing the user behaviors of EV users, we can formulate rules to schedule the charging behavior of EVs. By using artificial intelligence, we can cluster and classify user behaviors and predict the user’s charging behavior.
In details, in order to increase the ability of the smart grid to handle charging loads, we collected user information and applied artificial intelligence technology to interpret the data. By utilizing user’s charging data in the smart grid, we can categorize EV users and select users who are more suitable for load balancing. This can help efficiently manage the charging or discharging behavior of EVs in the SG and achieve efficient load balancing and reliable energy transfer.
However, for a small number of users with special charging behaviors, using artificial intelligence methods alone cannot achieve good results, and can even increase the error of the entire system. Therefore, we propose the use of the HITL method to analyze the user’s charging behavior.
4. Simulation
We used real charging records of electric vehicles, released by Adaptive Charging Network (ACN)-Data as a data set to analyze user charging behavior. The ACN-Data is a dynamic dataset of workplace EV charging which currently includes over 30,000 sessions with more added daily. We compiled 26,000 charge records for 318 electric car users, including the user’s charge connection time, charge completion time, charge disconnect time, and charging amount [
28].
The data suggest that, for the vast majority electric car users, their charging behavior is predictable, e.g., starting to charge after work every day and disconnecting the electric car and charging pile before work the next morning. However, the charging behavior of a small number of users is not regular. Even if only those users with regular charging behavior can be scheduled, the stability of the power grid will be greatly improved. As a result, we use the HITL-based K-Means clustering and k-NN algorithm to predict the charging behavior of EV. The AI algorithm flow chart based on hybrid artificial intelligence is shown in
Figure 5. In this simulation we used MATLAB R2016a as the simulation software. The computer’s CPU is Intel core i5 5200U and the memory is 4 GHz.
Clustering analysis is a crucial analytical algorithm in data mining [
29]. Clustering is to divide similar objects into different groups or more subsets by static classification so that the member objects in the same subset have similar properties. The K-means algorithm has been widely used for its simple algorithmic design, faster clustering speed, and good clustering effect. Hence, in this article, we used K-means to analyze the uncertainty of EV user charging behavior.
In order to analyze the users’ charging behavior, we first clustered the users’ behavior. When selecting variables as the basis for user behavior clustering, we mainly considered the following ideas: (1) The user mainly affects the grid in their choice of charging start time, charging end time, charging amount, and charging scene. (2) The amount of charge is roughly positively related to the charging time. (3) Some users have regular charging behavior and some users have no regular charging behavior. Combining the above points, in order to achieve better clustering results, we chose the average charging time, the standard deviation of the charging time, and the connection time as the basis for clustering user behavior.
Before clustering the data, we preprocessed the data. We manually screened and removed low-quality data from the raw data set. For example, we removed users with fewer than three records, which were random and not useful to determining patterns of behavior. Then, the user data was normalized using the linear normalization method, with specific rules:
We used the K-means algorithm to classify EV user charging behavior, however, for data at cluster boundaries, the clustering effect may not be ideal [
30]. Drawing on the idea of HITL, after clustering the data with the K-means algorithm, we used manual methods to check and re-mark data at the boundary.
Finally, for the new user data, we used the k-NN algorithm to for classification. This allowed us to filter out users with unstable behavior for further processing.
4.1. HITL Based K-Means Clustering for EV Driver Behavior
K-means is an unsupervised learning algorithm, which means the data to be processed has no labels [
31]. It divides data points into k clusters so that each point belongs to the cluster corresponding to his nearest mean [
32]. The ‘k’ represents the number of clusters and the ‘means’ represents the mean of the data objects in the cluster. The algorithm makes each point belong to the cluster corresponding to his nearest mean (this is the cluster center) and uses it as the standard of clustering. There are many ways to calculate distance. The most popular way in this algorithm uses Euclidean distance to measure distance. The formula is given below:
In this formula, xi and yi are two points in a n-dimensional Euclidean space.
In the beginning of K-means algorithm, m objects are randomly selected from n data objects as the initial cluster center, and then the distance between each object and the cluster center is calculated and the corresponding object is re-divided according to the minimum distance. Finally, the mean of each cluster as a new cluster center is recalculated. The kth iteration cluster center is updated as follows:
where |
Ck| represents the number of data points in
kth cluster, center
k is a vector containing D attributes as shown as below:
Moreover, the K-means algorithm requires constant iteration to re-divide the clusters and update the cluster center. In this article, we use the sum of squared errors (SSE) to determine when to terminate the iteration. The SSE is as follows:
where
K represents the number of clusters. When the difference of SSE between two iterations is less than a certain threshold δ, the iteration is terminated.
The main disadvantage of this algorithm is that the random selection of the initial K point may lead to local convergence. Therefore, we used hybrid intelligence to refine the results. In this work, the use of HITL helped refine the classification and clustering results. After clustering the data with the K-means algorithm, we used manual methods to check and re-mark the data at the boundary [
33], so that we could obtain a better result. The detailed description of the HITL-based K-means algorithm is shown in
Figure 6.
Before classification, we first normalized the data. As mentioned before, the user data were processed into the same tuple structure is as follows:
To find the best number of clusters, we used the elbow algorithm to get the K-SSE curve, as shown in
Figure 7.
When the number of clusters is approaching the ideal cluster number, SSE shows a rapid decline. However, when the number of clusters exceeds the ideal cluster number, SSE will continue to decline. At the meantime, the rate of decline will slow down. By plotting the K-SSE curve and finding the inflection point on the way down, the
K value can be better determined. Therefore, our goal is to determine a small value of
k that still has a low SSE, and the elbow usually represents where increasing
k provides diminishing returns. By observing the curve, the clustering effect is better when the number of classifications
k = 3. Next, on the basis of clustering, we used manual discriminant methods to check and re-mark the data at the boundary, with final results shown in
Figure 8.
After clustering, human intelligence is used to assign labels to user behavior. Based on the simulation results, we define red and blue users as behaviorally stable EV users because their standard deviation of charging behavior is low, which means that their charging behavior is regular and predictable, and such users can participate in the centralized scheduling of the grid. In contrast, green users are unstable EV users because their standard deviation of charging behavior is large, their charging behavior is unpredictable, and it is not useful for such users to participate in the centralized scheduling of the grid.
Then, we use the hybrid enhancement intelligence method to delete the users with unstable behavior by batch deletion and manual filtering. We regard the remaining users as users with stable behavior that can participate in the power supply scheduling of the grid.
4.2. k-NN Classification for EV Driver Behavior
After clustering the data in the dataset by K-means and HITL methods, we also need to classify the new EV users’ behavior to manage and optimize the charging behavior of new electric vehicle users. However, it is unrealistic to re-cluster the entire data set every time new data is added. So, we would like to use the K-Nearest Neighbors (k-NN) method to classify new EV driver behavior according to the results of the K-means clustering algorithm.
k-NN is a supervised learning method that classifies new data by measuring the distance between new data points and the remaining marked data points. In the k-NN algorithm, all the selected neighbors have been correctly classified. It is a distance-based algorithm where the category of new data can be determined based on the category of the nearest neighbors, e.g., using the Euclidean method (Equation (1)) to calculate the distance between data points. Then, we can select the training data of the first k distances closest to the new data and assign it the same data category. There is no fixed rule for the selection of
k values. Generally, according to the distribution of samples, a smaller value is best, and a suitable
k value can be determined by cross-validation. The detailed description of the k-NN algorithm is shown in
Figure 9.
We define the training error rate as the ratio of the K-nearest training sample marker to the input marker, and the error rate is expressed as:
and as a result, the proper
k can maximize the coefficient below in the training set.
After that, we use cross-validation to evaluate the performance of the model, which can prevent over-fitting. As mentioned before, there were 223 data in total after screening, which we divided into six groups. As shown in
Figure 10, the first five groups were used for cross-validation.
In cross-validation, four groups of data were used as a training set and 1 group of data remained as a test set. Each group of data had an opportunity to be test set. The result of cross-validation results showed that when
k = 5, the training error rate was the smallest, and the correct rate for different groups acting as the test set is shown in
Figure 11. Finally, the remaining 48 data were used as the final verification set, and the accuracy was found to be 97.91%.
The confusion matrix is used to visualize the performance of an algorithm [
34]. In predictive analysis, the confusion matrix is a table made up of False Positives (FP), False Negatives (FN), True Positives (TP), and True Negatives (TN). By using a confusion matrix, it is easy to see if the learning machine will confuse two similar classes. Assuming that the False Positives, False Negatives, True Positives, and True Negatives represent the corresponding number of samples respectively:
The classification result’s “confusion matrix” in this experiment is shown in
Figure 12.
In order to comprehensively consider the generalizable performance of the model, the Receiver Operating Characteristics (ROC) curve can be drawn to see the quality of the model partition type [
35]. In the case of uneven class distribution, the ROC curve is usually more efficient. In the ROC curve, the vertical axis is the True Positive Rate (TPR), and the horizontal axis is the False Positive Rate (FPR), which are defined as Equations (10) and (11).
Area Under ROC Curve (AUC) is the area under the ROC curve and is an indicator of the performance of the algorithm. The AUC can be obtained by calculating the total area under the ROC curve. For example, supposing that the ROC curve is formed by sequentially connecting a series of points of coordinates
, the AUC can be estimated as:
AUC-ROC curve is a performance measurement for a classification problem at various threshold settings. ROC is a probability curve and AUC represents degree or measure of separability. It tells how much a model is capable of distinguishing between classes. The higher the AUC, the better the model is at predicting 0 as 0 and 1 as 1. The higher the AUC, the better the model is at distinguishing between the drivers with regular behavior and irregular behavior.
As shown in
Figure 13, the ROC curve is plotted with TPR against the FPR where TPR is on the
y-axis and FPR is on the
x-axis. Area A, B and C are the AUC of three different classification results with different parameters. From
Figure 9, it can be seen that the AUC-A is larger than AUC-B, and AUC-B is larger than AUC-C. After comparing these three curves, we could know that the AUC-ROC curve corresponding to AUC-A has the best performance.
The ROC curve of the classification model we built is shown in
Figure 14. The grey dotted line is the set of points where FPR equals PTR. We found that the curve was close to the upper border with AUC = 0.994, indicating that the classification effect of our model was very good. Therefore, using this model, we could expect to classify the behavior of new users of electric vehicles to determine whether they could be efficiently uniformly scheduled. Power companies could potentially use these classification results to develop appropriate scheduling strategies to centrally coordinate the charging behavior of these electric vehicles in order to achieve peak-shaving and valley filling.


