Article

A Review on Stochastic Approach for PHEV Integration Control in a Distribution System with an Optimized Battery Power Demand Model

1
Department of Electrical Engineering, School of Electronics, Information & Electrical Engineering (SEIEE), Shanghai Jiao Tong University, Shanghai 200240, China
2
Institut de Recherche Dupuy de Lôme (UMR CNRS 6027 IRDL), University of Brest, 29238 Brest, France
3
College of Logistics Engineering, Shanghai Maritime University, Shanghai 201306, China
*
Author to whom correspondence should be addressed.
Electronics 2020, 9(1), 139; https://doi.org/10.3390/electronics9010139
Submission received: 11 December 2019 / Revised: 1 January 2020 / Accepted: 7 January 2020 / Published: 10 January 2020
(This article belongs to the Section Electrical and Autonomous Vehicles)

Abstract

:
The future adoption of electric vehicles (EV) as the main means of commuting will put an additional stress on the distribution grid; the level where EVs are mainly expected to be charged. Estimation of the EV charging influence on the distribution grid is a critical task for distribution system operators (DSO) in order to plan for grid reinforcement and to avoid service failure. Due to the unpredictable nature of daily human activities, stochastic modeling for daily EVs’ owner behavior and residential power consumption is needed. In our study a new estimation model for the EV power demand during the charging process is developed to accurately estimate the charging demand, which is combined with daily household power consumption loads based on real life measurements to estimate the total demand in the system. This demand can be applied to the standard IEEE 69 distribution system and can quantify the influence of different penetration levels under an uncontrolled (dumb) charging case, also under a proposed controlled charging algorithm for both summer and winter seasons.

1. Introduction

Global warming is one of the biggest issues of the twenty-first century. The Paris Agreement was the first universal agreement on climate change [1]. It highlighted the need to limit the increase in the global average temperature to well below 2 °C above pre-industrial levels by 2100 [2]. To meet this objective, considerable reductions in greenhouse gas emissions from different sectors of human activity need to take place. Currently, and according to Reference [3], up to 16% of man-made carbon dioxide (CO2) emissions come from motor vehicles (cars, trucks and buses).
The electrification of road transport will significantly reduce this share by deploying more efficient and eco-friendly car technologies such as all-battery electrical vehicles (BEV), plug-in hybrid electric vehicles (PHEV) and fuel cell electric vehicles (FCEV) [4] and, as reported by the International Energy Agency (IEA), electric drive cars need to represent 35 percent of global sales in 2030 [3]. PHEV is a new emerging electric car technology. It is an advanced combination of a hybrid electric vehicle (HEV) and an battery electric vehicle (BEV). Currently, a PHEV is defined according to IEEE as a car, truck or other vehicle that can be driven solely by an electric motor for at least ten miles without consuming any gasoline (called a “PHEV-10”), and with batteries that can be recharged by plugging it into a wall outlet [5]. PHEV uses both an internal combustion engine and an electric motor to deliver motive power. In the charge-depleting mode, it draws energy primarily from the battery pack; once the battery state-of-charge is depleted, it switches to charge sustaining mode, in which the primary energy is sourced from gasoline. These vehicles can provide high fuel economy due to the large battery pack that can accept more regenerative braking energy and provides more flexibility for engine optimization during an extended driving range. Compared to HEV, PHEVs are proven to produce fewer emissions, run more economically and have better fuel flexibility [6].
Despite the benefits that the EVs can provide to the power grid, the multiple EVs charging can impose serious stress on the distribution grid if it coincides with daily peak hours [7,8,9,10,11]. Charging algorithms were introduced to lessen this charging impact through scheduling and/or achieving maximum profit at the charging stations [12,13,14,15]. This impact is related to highly random parameters such as the non-charging load patterns of the feeders’ nodes, charging location, charging level, start charging time, the initial state of charge of the battery and the battery capacity.
In the last decade, numerous research has been conducted to assess the impact of PHEV charging on the distribution grid, and they took different assumptions, the author of Reference [16] proposed a stochastic approach to evaluate the impact of the uncontrolled charging of PHEVs on the distribution grid; however, the model mentioned only three possible charging periods (21h00–06h00, 18h00–21h00 and 10h00–16h00) which is less accurate as vehicle owners may leave the workplace at different times in the day. References [17,18] discussed the impacts of PHEV charging assuming an empty state of charge for the vehicle at the time arriving at its destination, while SoC is a function of the range, the initial SoC and the energy depletion mode energy use of the vehicle. In References [19,20,21,22] the authors studied the impact of plug-in electric vehicles without any specific estimation of battery charging power demand, however studies in References [23,24,25] show that the Li-Ion battery requests a variable charging power depending on the battery’s SoC and the charger rating power.
In Reference [24], the author proposed a statistical approach to estimate the power demand based on the SoC evolution during the charging and to compute the energy gained during a certain interval then with a simple division to get the average power demand during the same time interval. The method results exceed the rated power of the charger, which can be unrealistic. While the author of Reference [23] discussed the estimation of this demand; by assuming an almost linear relation between the SoC and the charging time ratio; where the latter is the proportion of the charging time to the time needed for the full SoC battery to be achieved under a certain charging level, the function of the charging power demand versus the ratio of charging time was also depicted and served as a chart to deduce the power demand in p.u. of rated charging power.
Our paper provides a detailed model of a stochastic evaluation framework of the PHEV charging influence on the distribution grid based on real-life measurement and standard distribution grid, taking into consideration the stochastic nature of the mobility and charging models of the PHEV’s owners:
(1)
A precise estimation of PHEV power demand during the charging process was overlooked in most previous works and if mentioned it was vaguely explained, in this paper the power demand is expressed in the function of battery SoC and the rated power of the charger.
(2)
The study in this paper focuses on the technical impacts (voltage deviation and power losses in the distribution grid).
(3)
The developed framework investigates the seasonal effect by taking two sets of daily residential power consumption for summer and winter as well, while ignoring the seasonal effect that can cause an underestimation or an overestimation of the effects.
The rest of the paper is outlined as follows. First the different assumptions and parameters of the framework are presented in Section 2. In Section 3, the uncertainties in the mobility and charging behaviors are properly developed. Section 4 presents the generation process of residential loads. In Section 5, case studies and numerical results are discussed. The conclusions of the work are drawn in Section 6.

2. Framework Assumptions and Parameters

Monte Carlo simulation is the most compelling method used when a model includes stochastic parameters or when a dynamic complex system needs to be evaluated. To predict the influence of EVs on the distribution grid, the first step in this endeavor is to establish the proper models for the different parameters that can correctly reflect the uncertainty of the human behavior.
Since daily electricity load consumption is known to have a lower peak and average value during the weekends, our study involves a one working day scenario with a one-hour resolution, and it is carried out for a predefined number of households randomly distributed across the distribution grid feeders; it is also assumed that each household owns one PHEV.
PHEV owners can have multiple choices of places and modes to recharge their vehicle batteries package, from” home charging” using a standard outlet, and because of the long night stay a relatively low charging rate is sufficient to achieve a fully charged state, to “parking lot/home charging” where the PHEV can be plugged in at a working place parking lot equipped with EV chargers. This charging behavior affects the day charging patterns and influences the charging characteristics required for developing the different models. Based on the PHEV’s location, it can be recharged using two possible charging levels, ‘level1’ or known as the slow charging which is performed at home, using a standard outlet so no extra installation is needed, it is a 1.4 kW (120 V) charging power and takes around five and half hours to fully charge the PHEV. The fast charging or ‘level 2’ is available at parking lots and delivers 3.3 kW (240 V) charging power and it can charge the battery fully in two and a half hours.
Several plug-in hybrid EV models are available in the market and they come with different battery capacity sizes. Li-Ion battery technology is widely used due to its desirable characteristics such as the high energy density, wide operating temperature range, low self-discharge rate, no memory effect and high efficiency [26] and become an essential part of new electric vehicle generation.
PHEVs are mainly categorized based on their all-electric range (AER): PHEV-10, PHEV-30 and PHEV-60, where the numerical subscript stands for the vehicle AER in miles. This study considers a PHEV [27], the parameters of which are summarized in Table 1, with an AER of 25 miles that almost covers the average American daily trip according to the National Household Travel Survey [28].

3. Stochastic Modeling for the PHEV’s Mobility and Charging Behaviors

In this study, a one-day PHEV behavior resolution is taken into consideration; important parameters such as the departure time, time of arrival at home and the traveled distance are needed to build our scenario. Surveys have been carried out to track the daily driving behavior of individuals; the American National Household Travel Survey (NHTS) conducted in 2009 is the most comprehensive report [29].
The 2009 NHTS was conducted over a period from March 2008 through May 2009, and it collected data associated with 150,147 households resulting in a set containing about 1.048.575 single trip data including time, the purpose, the length of trip and around 150 other attributes. Since our study was carried out on working days, filtering algorithms were implemented in the MATLAB environment to extract a reliable dataset we can later build our model on. Using the MATLAB distribution-fitting tool we can obtain the best fitting probability density function for the departure time, the arrival at home time and the daily driven distance.

3.1. PHEV Departure Time

It is the time at which the PHEV leaves the house, known as the first trip start time, so that the first trip is selected; only trips with the following attributes are kept. TDTRPNUM = 1, a weekday by checking the attribute TDWKND (TDWKND = 2 in a weekday) and it is a home-based work trip using the attribute TRIPPURP = “HBW”.
Processing the data shows that the departure time follows a Gaussian PDF that can be expressed in the following equation:
f ( t d e p ) = 1 σ d e p 2 π exp { 1 2 σ d e p 2 ( t d e p μ d e p ) 2 } ,
where tdep is the departure time, µdep = 7.37 and σdep = 1.93.

3.2. PHEV Arrival Home Time

The final trip end time is the time at which the driver comes back home. Data of NTHS were analyzed to fit a Gaussian distribution and can be expressed as follows:
f ( t a r r ) = 1 σ a r r 2 π exp ( 1 2 σ a r r 2 ( t a r r μ a r r ) 2 ) ,
where tarr is the arrival time, µarr = 16.36 and σarr = 3.3.

3.3. PHEV Daily Trip Length

The daily driving distance is an important parameter, which can vary from weekdays to weekend days. The data was analyzed to fit a probability density function.
A lognormal PDF can be used to describe the PHEV daily mileage, and it can be described as the following expression
f ( d ) = 1 d s d 2 p exp { 1 2 s d 2 ( ln ( d ) m d ) 2 } ,
where d is the travelled distance, µd = 2.2 is the mean of ln(x) and σd = 1.1 is the standard deviation of the lognormal PDF.

3.4. PHEV Battery Charge Model

When the PHEV is plugged into a charger, the two locations considered in this study determine the charging level (1.4 kW or 3.3 kW). It is assumed that charging the battery from empty to full would require 5.5 h and 2.5 h by using level 1 and level 2 charging modes, respectively. If a constant current charging mode is used, the evolution of SoC during charging follows the equation [30]:
S o C ( t + 1 ) = S o C ( t ) + 1 N ,
where N is the number of hours required to fully charge the battery from an empty state.

3.5. PHEV Battery Discharge Model

All the PHEVs are assumed to be fully charged in the morning (SoC initial = 1). To benefit fully from the PHEV electrical characteristics, the daily distance is mainly driven in all-electric mode, until the batteries reach a minimum SoC set to be 0.2 to mitigate the impact of the duty cycle on PHEV’s battery state of health (SoH) [31]. PHEV runs with an efficiency of η = 0.37 kWh/mile [32], therefore the whole or partial daily trip will be purely electric then switches to a gasoline engine to reach its final destination and allows us to calculate the final battery SoC.
S o C = { max { 0.2 , 1 0.37 D } ,   D < A E R S o C r e g ,   D > A E R
where D is travelled distance and SoCreg is a random value between 0.2 and 0.3 as the battery can be charged from the regenerative braking.

3.6. PHEV Battery Power Demand

During the plug-in time of the PHEV to grid through the charger, the electric vehicle can be considered as a typical load, though its power demand value needs a careful modelling due to the nonlinearity of the battery charging process.
The plot of the two graphs describing the change in the PHEV battery SoC and power demand during the charging time shown in Figure 1 is based on the findings of a direct linear relation between the SoC and battery power demand being established as described in Equation (6), which will later be used in the direct estimation of the PHEV power demand and thus reducing the simulation running time
P P H E V ( S o C ) = { 1   p . u . 10 ( 1 S o C )   p . u . 0   p . u . f o r f o r f o r 0.2 < S o C < 0.9 0.9 < S o C < 1 S o C = 1

4. Daily Residential Load Profiles

The daily residential power demands are classified into two major categories—the controllable and the fixed ones—controllable demand is defined as the load that can be controlled without a noticeable influence on the customer’s daily activity [33], in our study only PHEV charging demand is considered controlled demand.
We also assume base load demand will not cause any disturbance in the distribution grid. The fixed daily residential accounts for the total energy consumption in the absence of electric vehicle charging, and it differs from one day to another day.

4.1. Measured Data for Fixed Daily Residential Load

Daily household average power profile demands data can be obtained from the National Grid US website for a period of one year from July 2012 until July 2013 [34], the load shapes available on the website are estimates of the amount of electricity the average customer in a particular rate class uses each hour of the year. The estimates are based on data collected from statistically valid samples. The data file provides average load shapes for residential, large commercial and industrial rate classes.
Only residential power demand profiles data with the attribute ‘R1 = RESIDENTIAL GENERAL USE’ are taken into consideration, as it falls in the scope of our study, the figure below shows it to be normalized to the peak value of the daily load’s profiles of summer and winter seasons.

4.2. Scenario Reduction Algorithm

A crucial step in the application of stochastic programming is to obtain a set of scenarios that realistically represent the distribution of the random parameters but is not too large. To establish a bus power demand profile, two main approaches are considered—a deterministic and a stochastic approach. The first one consists of simply choosing one daily profile and associating it with a specific feeder, while the latter approach takes a random profile from a reduced set of scenarios based on its probability of occurrence.
A scenario reduction algorithm is conducted to deduce the most representative profiles and their occurrence probability while maintaining the statistical properties of the original set.
In the literature, the commonly used distance between two scenarios is the difference between two corresponding scenario vectors [29], an alternative scenario technique was proposed in Reference [30] based on values of the objective functions of the single-scenario optimization problem for risk neutral and risk-averse electricity trading problems.
The Kantorovich distance between two scenarios Si and Sj can be calculated according to a norm in the space of the parameter vectors as shown in Table 2 by:
d k ( S i , S j ) = t = 1 24 ( S i t S j t ) 2 ,
with an initial probability
P ( S i ) = 1 K
where K is the number of scenarios in the original set.
The deletion process is performed iteratively, removing one scenario in each iteration, while updating the probability of the remaining scenarios; until a desired number of scenarios is maintained, the process can be summarized in the following steps:
1)
Determine the scenario ‘k’ to be eliminated from the original set, mathematically this scenario is determined as follows:
P ( S k ) min S n ¹ S k d k ( S n , S k ) = min m Î { 1 , k , N } { P ( m ) min m 1 n d m ( S n , S m ) }
2)
Update the remaining load profile set and calculate the distance between each pair of scenarios.
3)
Update the probability of the nearest load profile Sn to the removed one Sk
P ( S n ) = P ( S n ) + P ( S k )
The two original sets for summer and winter seasons are processed using the scenario reduction algorithm to extract the ten representative profiles shown in Figure 2. as well as their probabilities of occurrence for each scenario are plotted in Figure 3.

4.3. Genetic Algorithm for Scenario Generation

Genetic algorithms are general-purpose search techniques based on principles inspired by the genetic and evolution mechanism observed in natural systems and population of living beings [35]. Different selection techniques have different strategies of computing the probability for a specific scenario to be selected, but all of them are based on the fact that the individual with the highest fitting values are more likely to be chosen. Proportional Roulette Wheel Selection (PRWS) is a genetic algorithm where scenarios are chosen in such a way the probability of selection is proportional to the fitness of the scenario.
The fitness evaluation is performed by a function that assigns a fitness level to each member in the set. This fitness level is used to associate a probability of selection with each individual scenario.
F k = i = 1 k P ( i )
where P(i) is the probability of ith representative load profile.
After an optimal set is obtained, a daily profile can be generated using the PRWS. In each Monte Carlo simulation, we start by generating a random variable between 0 and 1 that plays the role of the pointer, in such a way that if the generated number is enclosed between the two fitness levels Fi-1 and Fi the ith profile is chosen, to determine the load profile with the fitness value to be used.

5. Methodology and Numerical Results

The IEEE 69-bus test system has been considered in this study as a case study for the distribution grid; the one-line diagram of the radial network is shown in Figure 4. It is a 12.66 kV distribution system with 69 buses and 7 laterals and it has a total peak load of 3800 kW and 2690 kVAr [36]. The complete load data of this system are provided in Reference [36].
The Monte Carlo method is the general description for stochastic simulation using a random numbers sequence generator; it can be used to solve stochastic problems as well as deterministic ones. The Monte Carlo simulation creates a fluctuating convergence process and there is no guarantee that a few more samples will definitely lead to a smaller error.
However, the error bound or the confidence range decreases as the number of samples increases [37]. The coefficient of variance is often used as a convergence measure and stopping rule, the alternative is to use a specific number of iterations as a stopping rule.
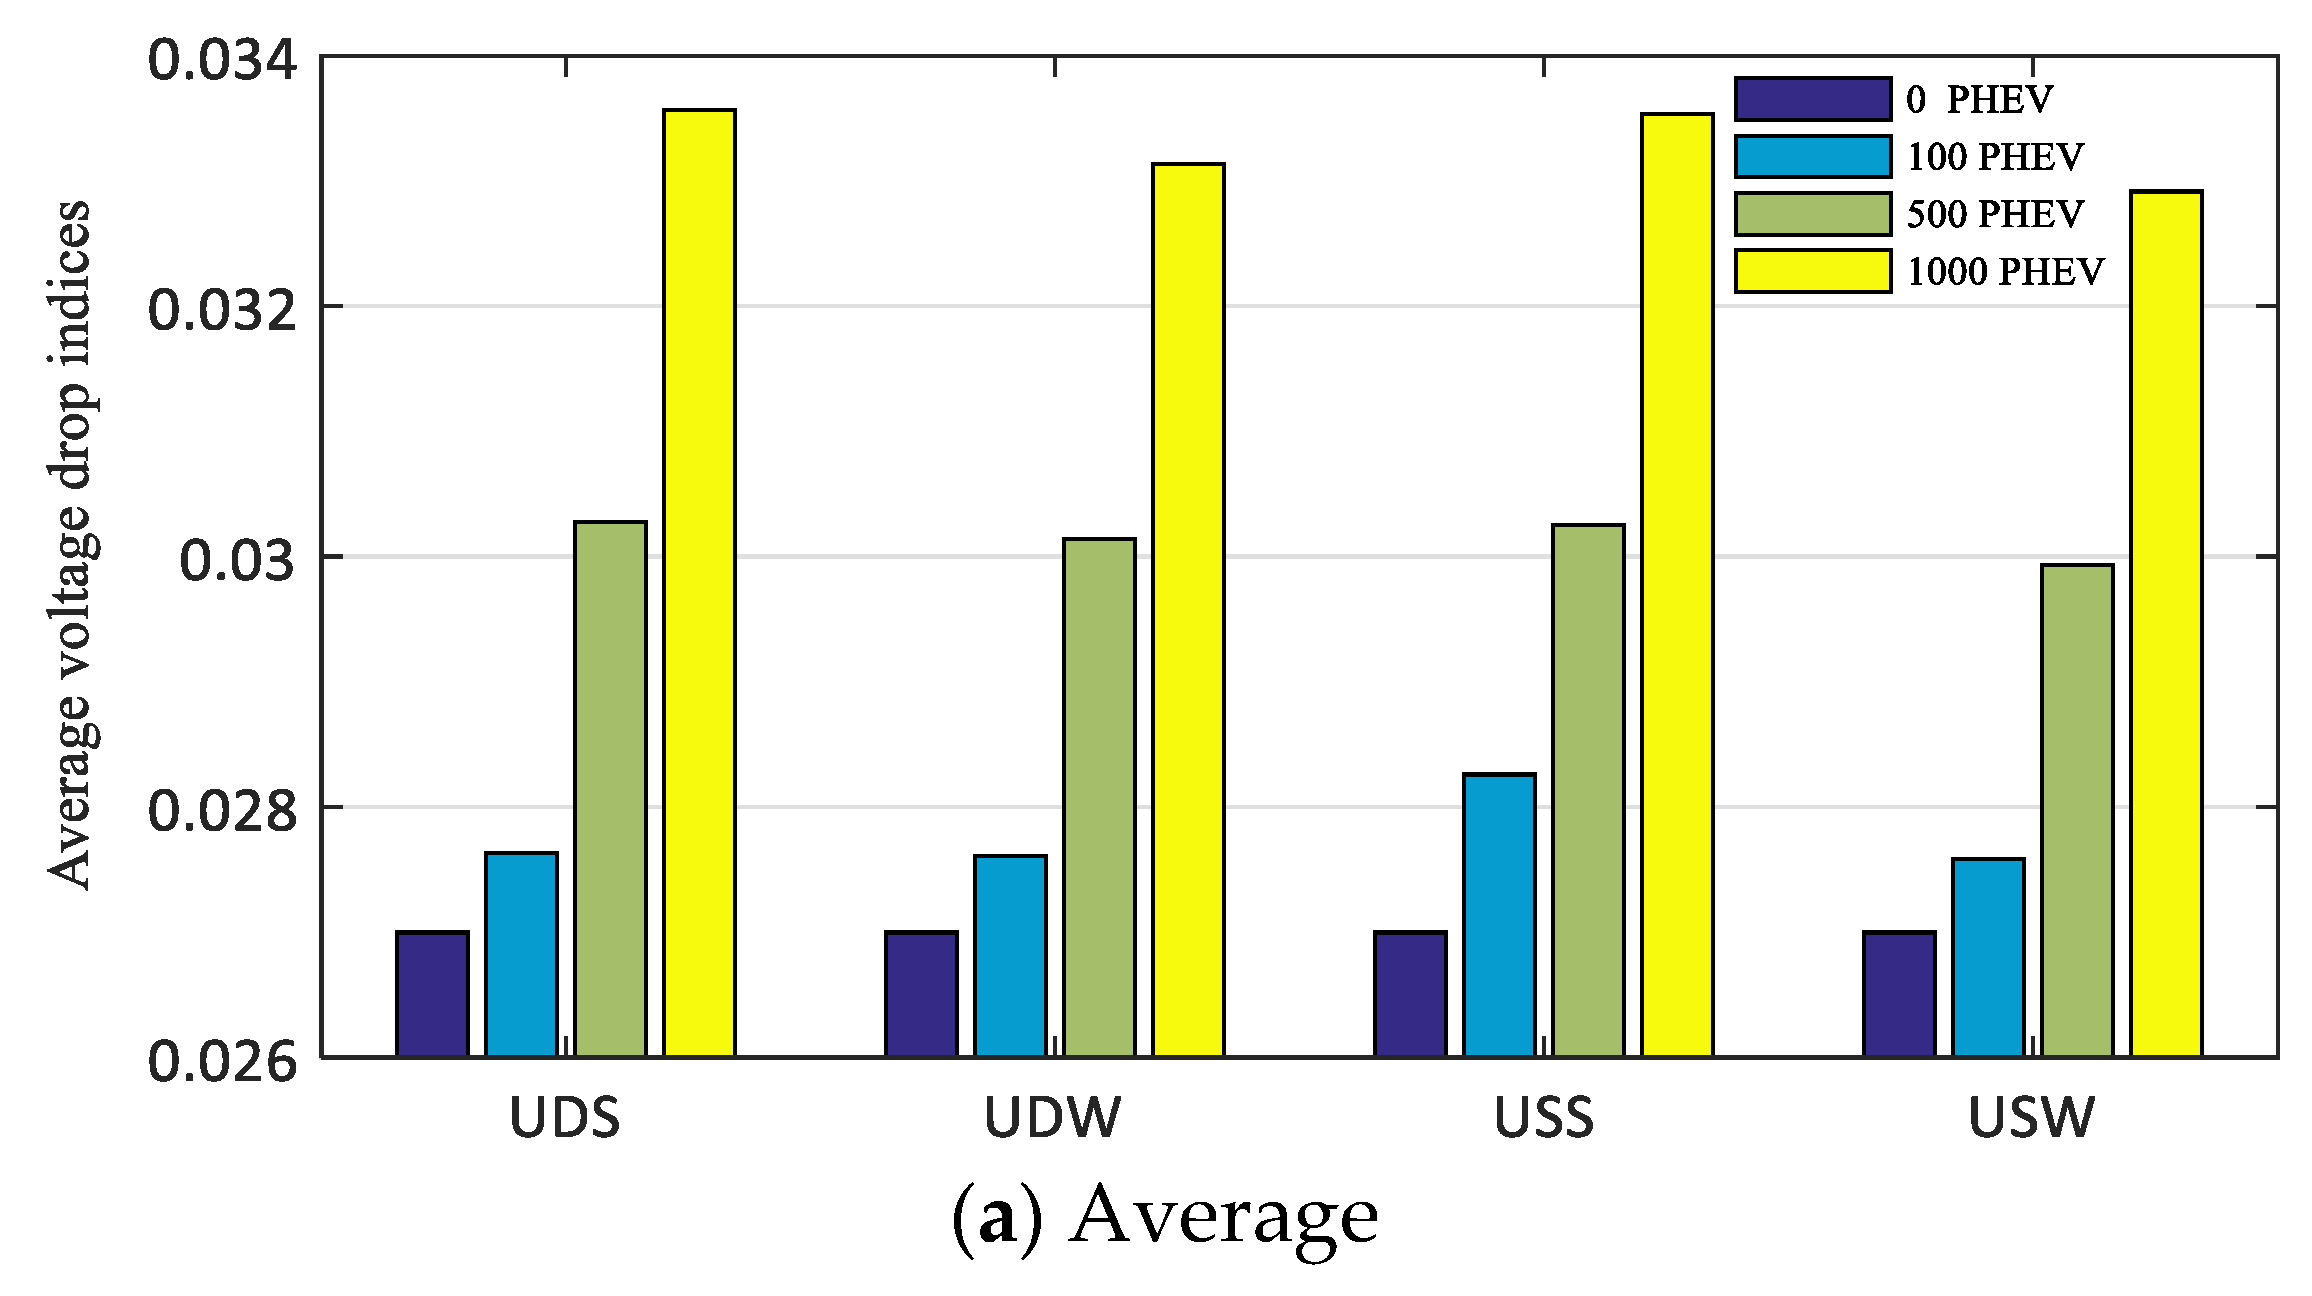
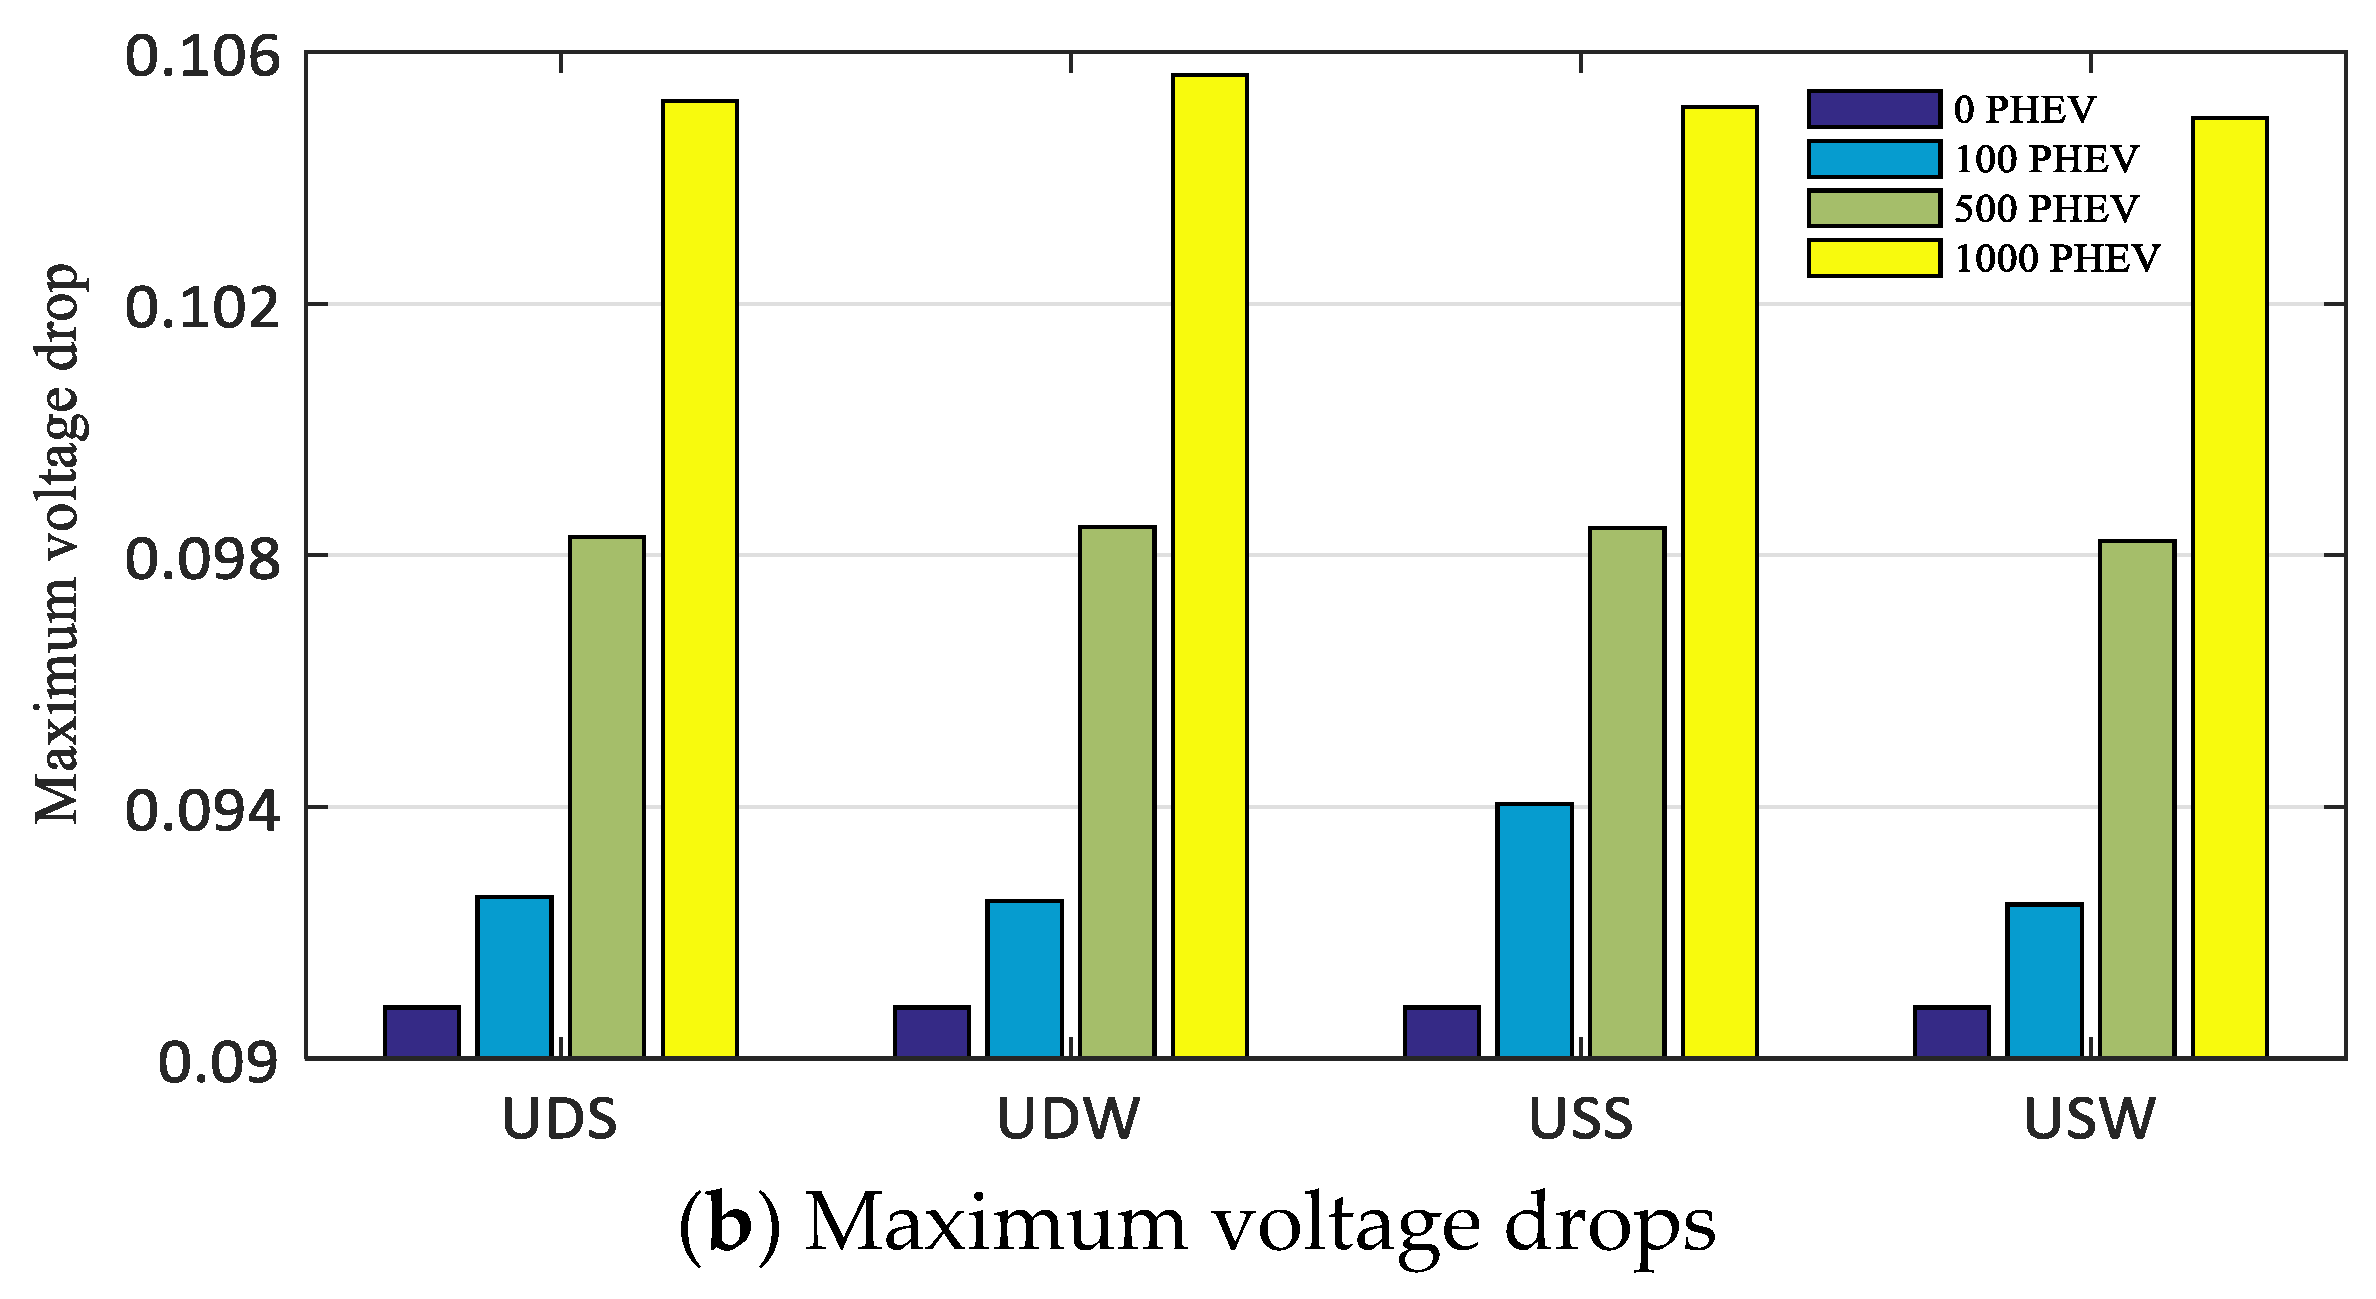
To assess the influence of the different integration levels of PHEVs, the Average and Maximum Voltage drop (AVD and MVD) indices are considered along with Maximum Daily Real Power Losses (MDRPL) during a one-day scenario.
A V D = t = 1 T i = 1 N | V r e f V t , i | V r e f T N b
M V D = M a x ( | V r e f V t , i | V r e f )
for t = 1, 2…, T and i = 1, 2…. Nb
M D R P L = M a x ( i = 1 N b P l o s s i )
for t = 1, 2…..., T. Where Vref is the rated bus voltage, Vt,i is the node voltage at time t. Nb and Nl are the numbers of nodes and branches and T is the number of time intervals.

5.1. Case 1: “Uncontrolled Charging”

In our first case study, we consider the dumb or the uncontrolled charging where there is no constraint on the charging time and the vehicle is allowed to charge instantly upon the plug-in or after a predefined time set by the owner and the charging stops only if the battery is full or the vehicle is used.
At the beginning of the one-day scenario cycle, a daily load profile is randomly selected from the ten-representative belonging to a specific season (summer or winter) and assigned to a random node in the distribution grid. Next, the different parameters of the daily PHEV’s behavioral parameters are generated in the departure time, arrival time and SoC to daily commuted distance using the PDFs in Equations (1)–(3), which allow us to establish the daily PHEV owner schedule in advance and determine the location of PHEV at each time frame.
PDF-based methods are inaccurate due to the correlation of different driving parameters. Since the correlation of driving parameters is ignored in this work, to maintain accuracy, we first use the PDF to generate the departure time and the daily traveled distance, then the arrival time is generated and compared with the departure time, if the generated arrival time falls after the departure time, we keep it otherwise we regenerate another one. In our simulation we assume the travelled distance from work to home is the same as from home to work in the morning.
In case (1), there is no constraint and the PHEV owner can charge whenever it arrives at the destination (home/workplace). Thus, the power demand used to charge the PHEV can be estimated then added to the fixed residential load demand, the total residential power is distributed randomly on the grid feeders; the power flow analysis is performed to calculate the grid steady-state parameters and to assess the impact.
Four levels of PHEV penetration starting from 0 vehicles, 100, 500 and 1000 PHEVs are integrated into the distribution system. It can be adjusted for any desired number of vehicles. Deterministic and Stochastic approaches are both verified which leads us to four distinctive cases:
1-
The Uncontrolled Deterministic Summer (UDS).
2-
The Uncontrolled Deterministic Winter (UDW).
3-
The Uncontrolled Stochastic Summer (USS).
4-
The Uncontrolled Stochastic Winter (USW).
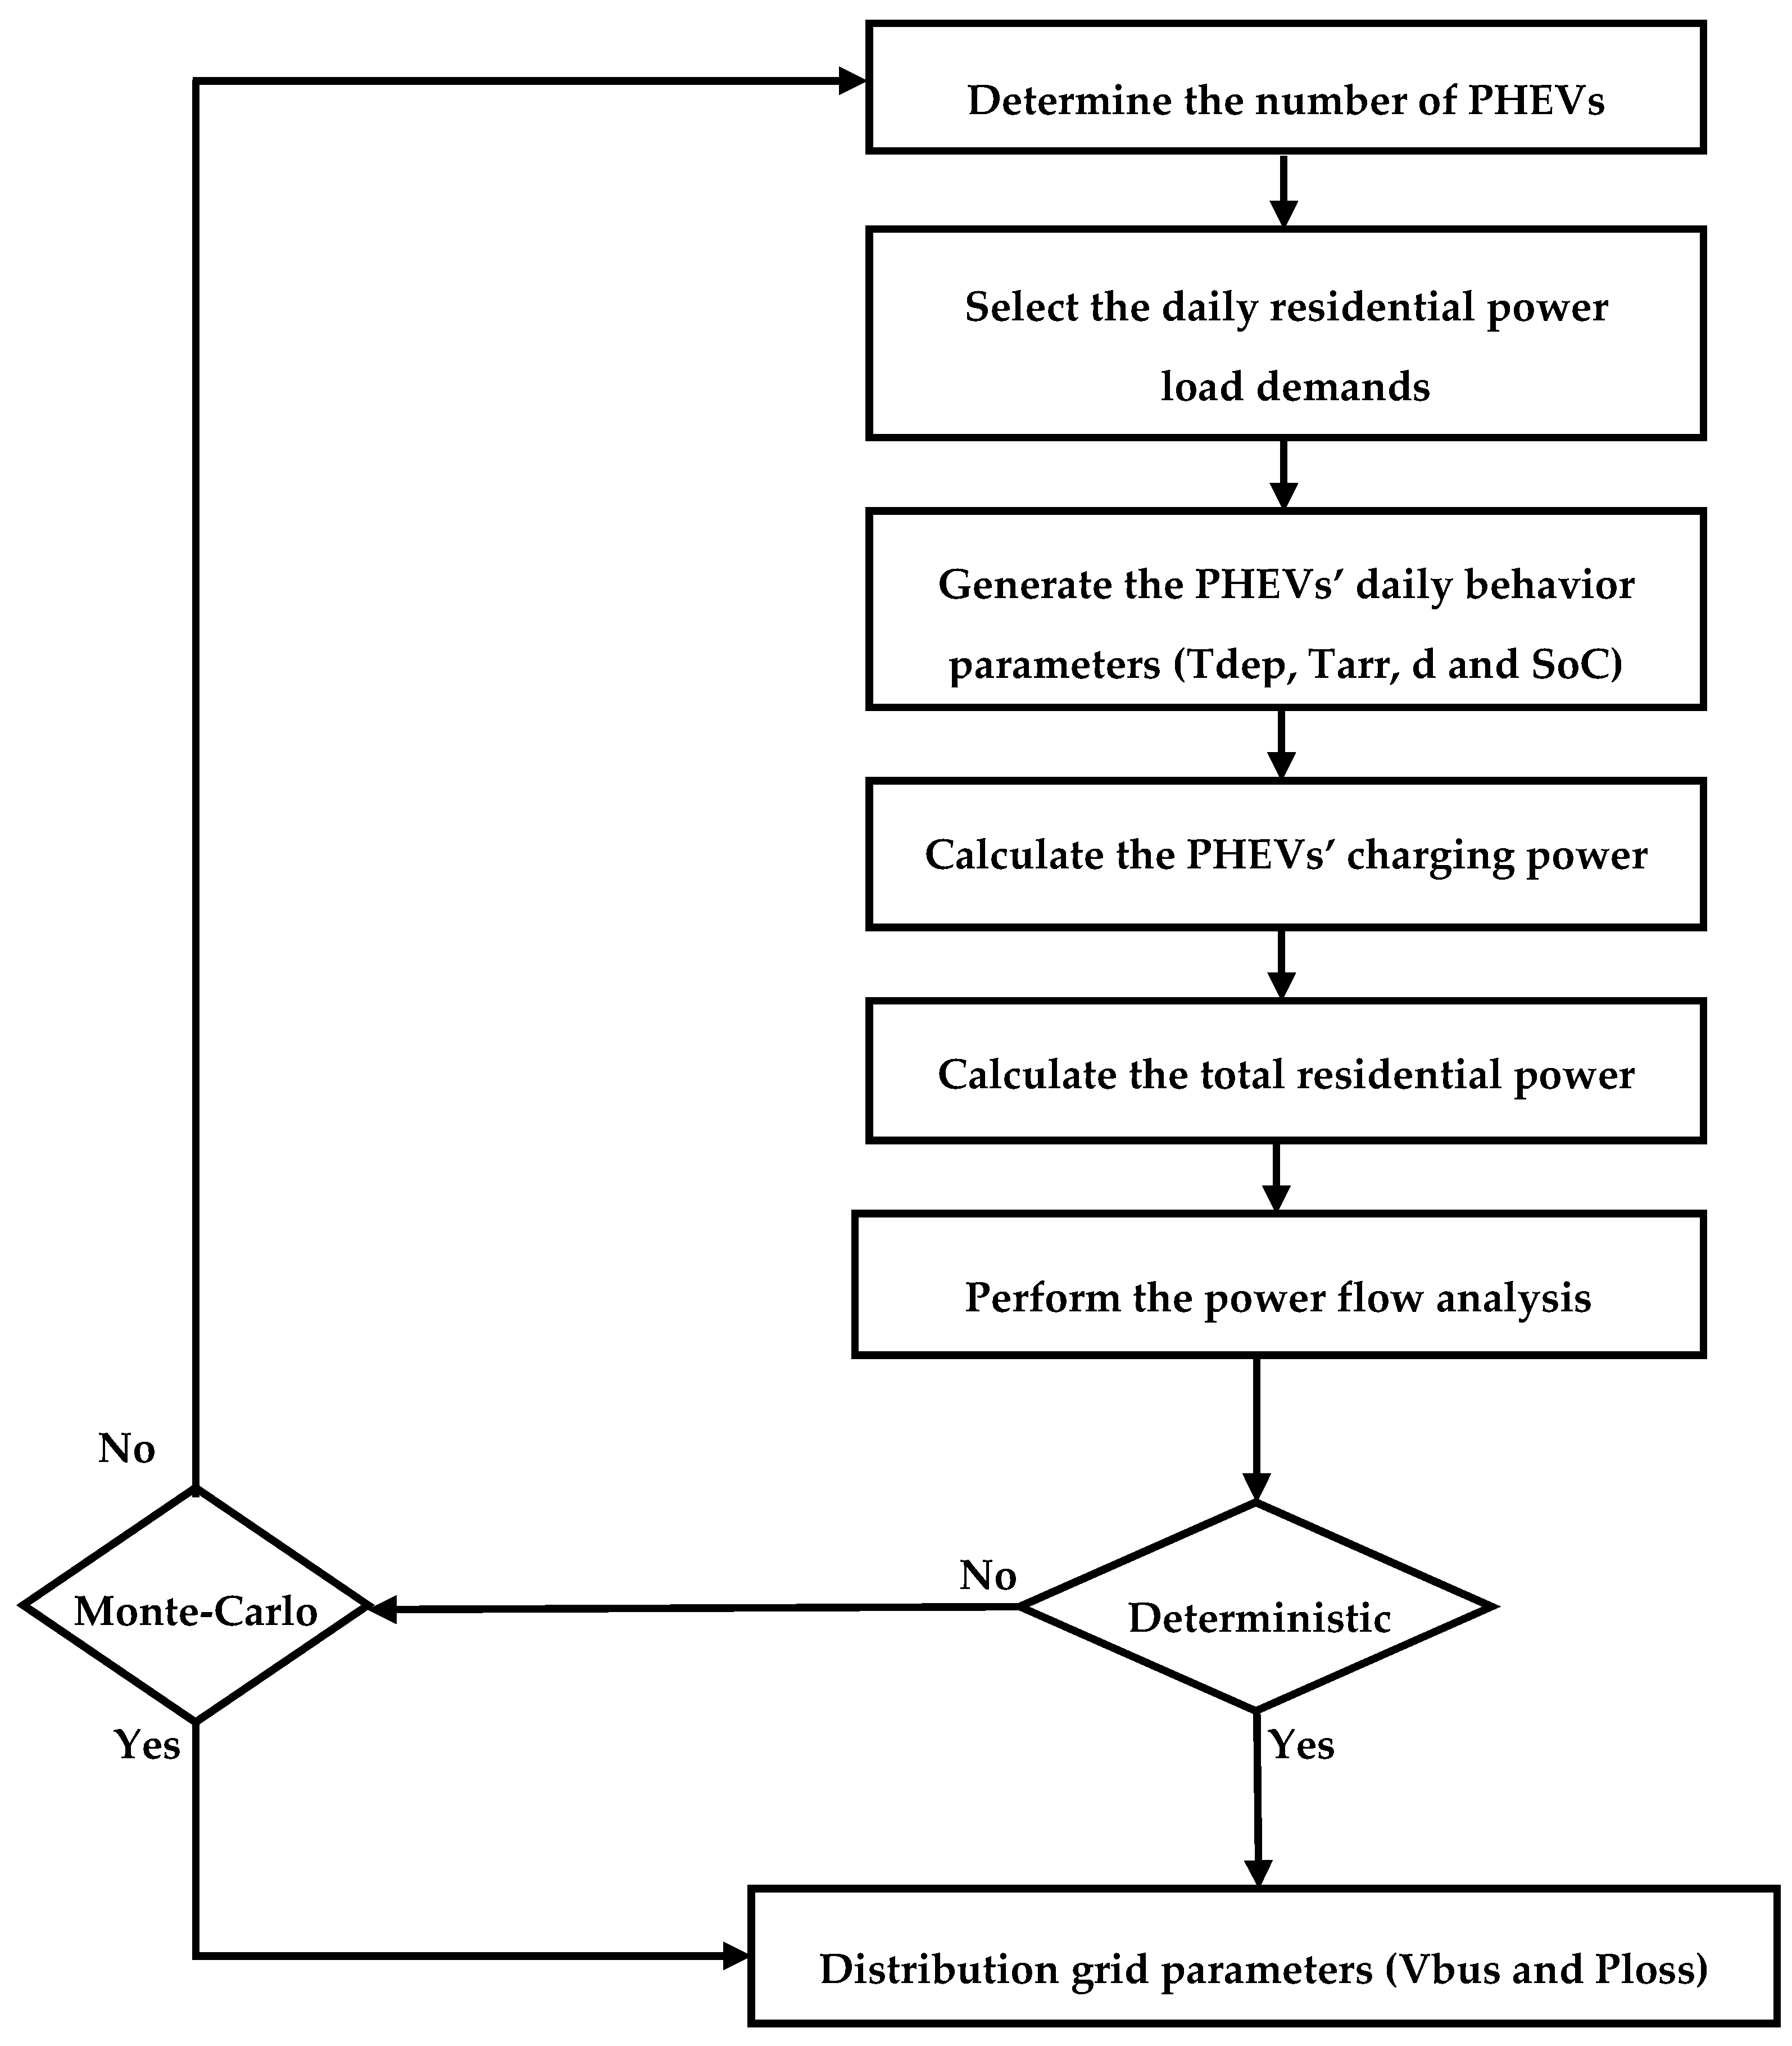
The steps followed in the simulation for the uncontrolled charging (deterministic and stochastic) case are showed in Figure 5. The results of the simulation depicted in Figure 6 show an increase in the average and maximum voltage drop as the number of integrated PHEVs increases with a higher impact in the summer season compared to the winter as the residential power demand are much higher during the first season.
Furthermore, the stochastic approach results in less troubling results and that can be related to the low probability of high-power demand profiles in the representing scenarios so they appear less in the simulation.
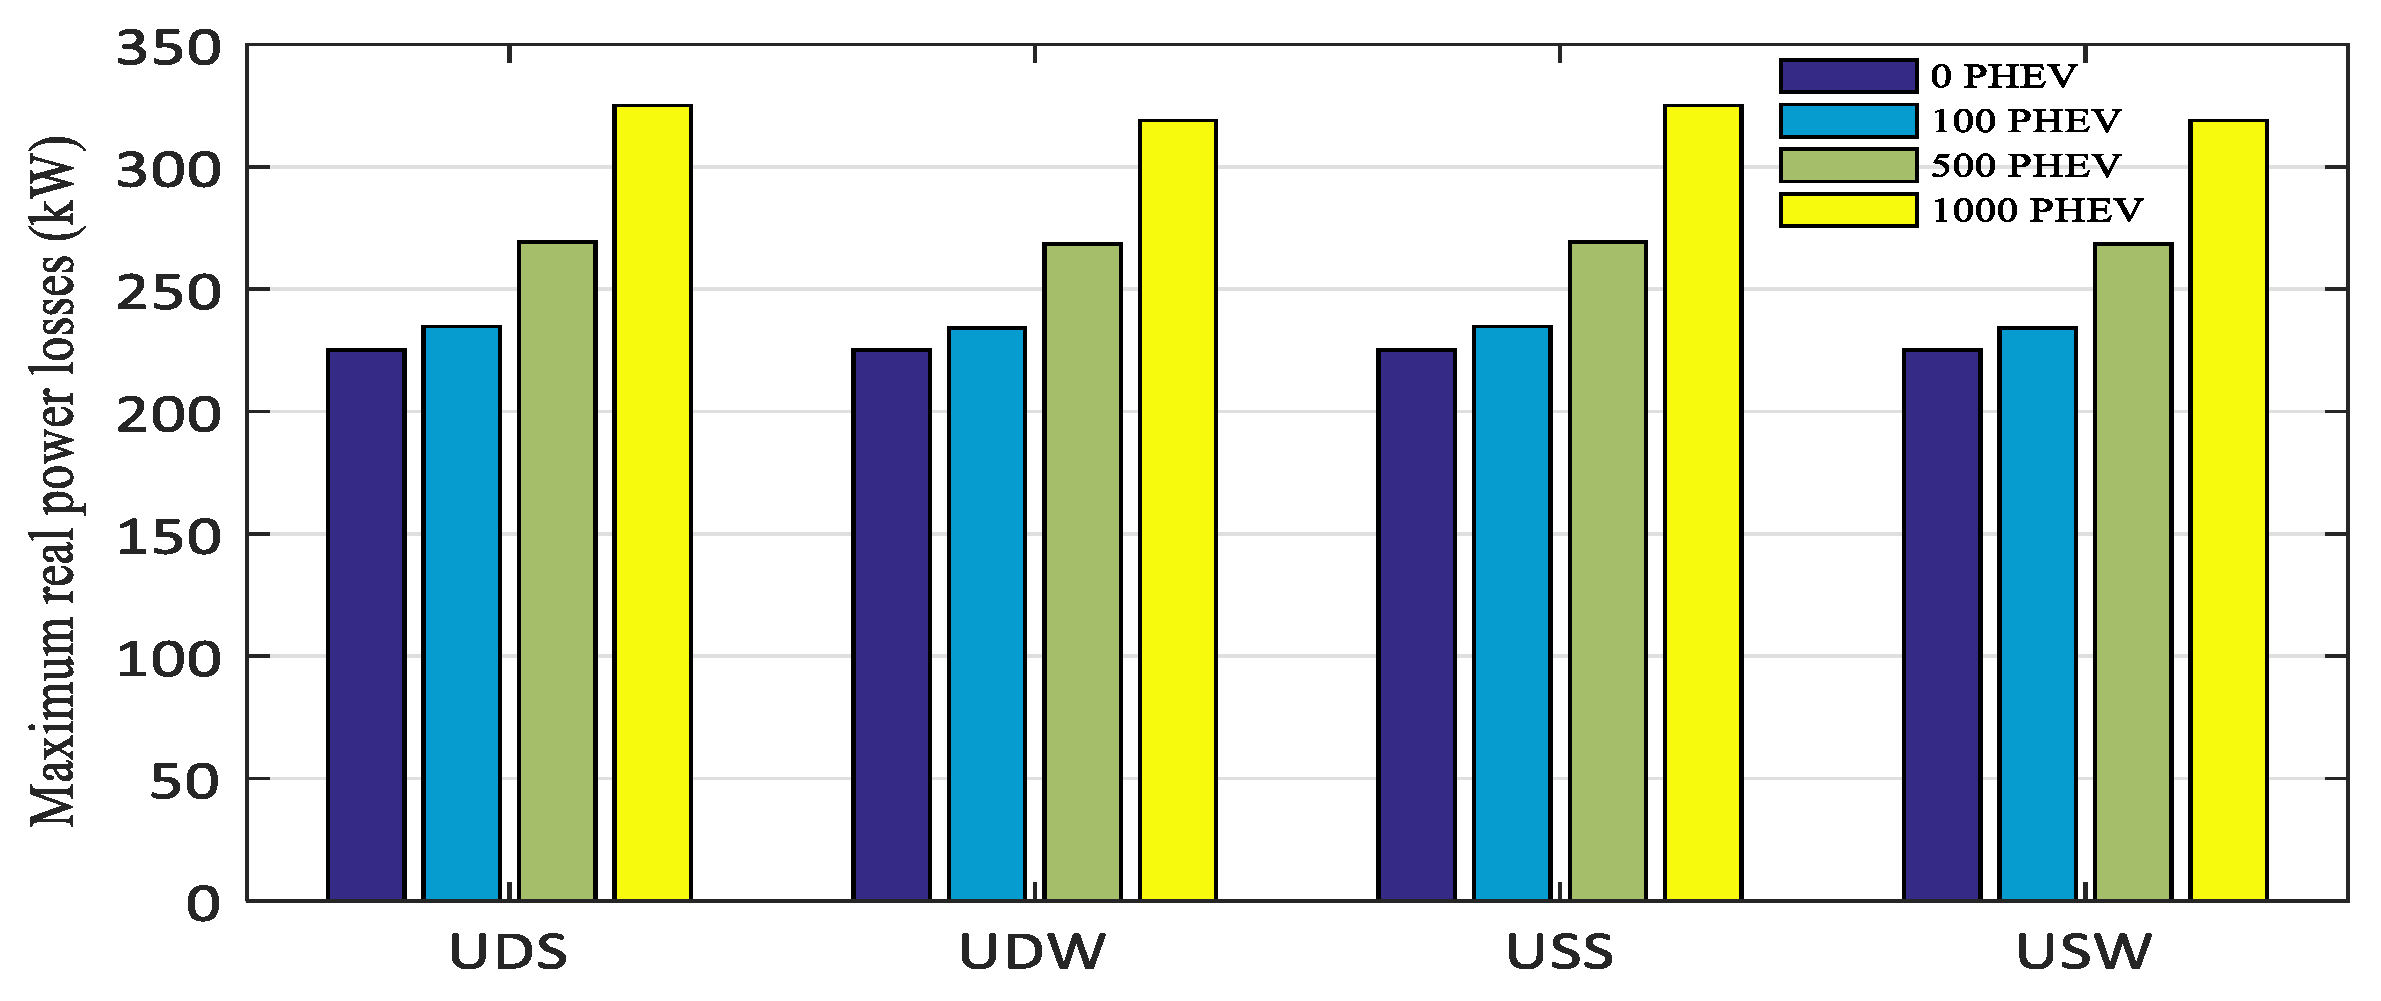
Maximum daily real power losses depicted in Figure 7 show a significant increase in the maximum power losses as the number of integrated PHEVs increases from 0 to 1000, while the stochastic approach results in fewer losses compared to the deterministic due to the fact that high demand scenarios are less probable to be taken in the simulation process.

5.2. Case 2: ‘Controlled Charging’

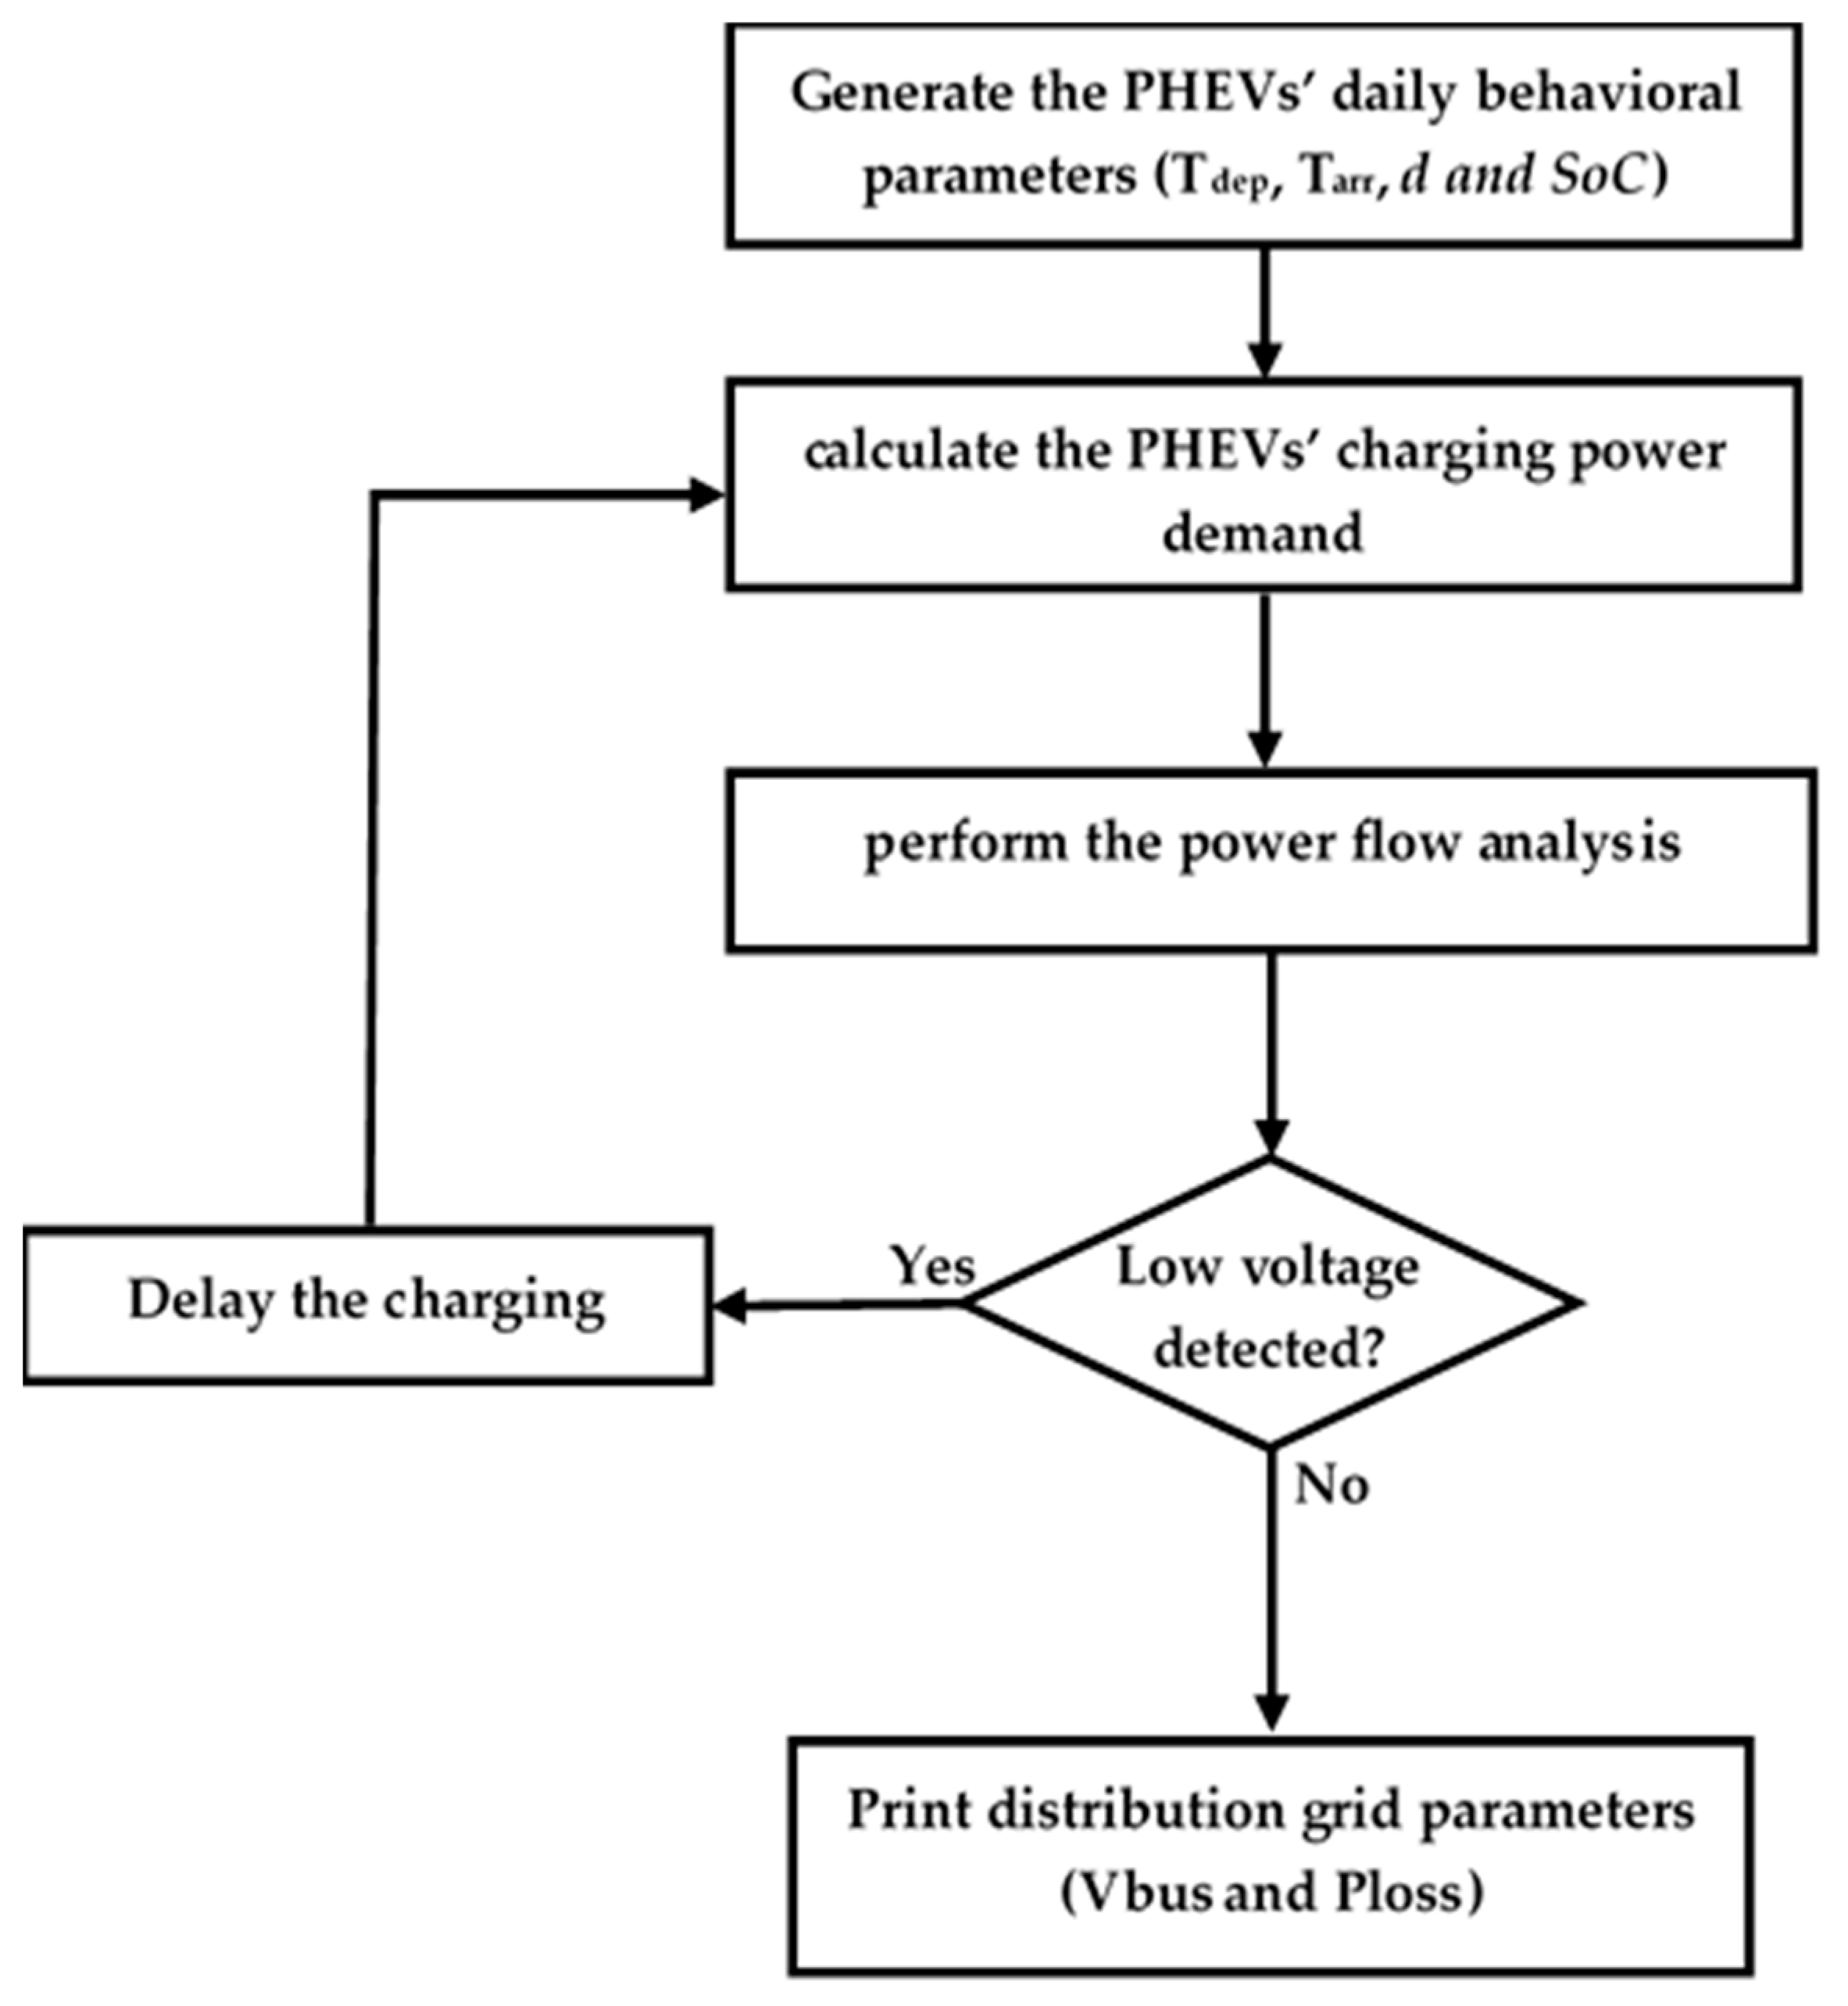
In this charging technique, a constraint on the minimum voltage across the whole distribution grid was set, so before performing any charging the algorithm goes through the following steps:
  • It estimates the total residential power demand (household demand and the power demand to charge the EVs) and runs the power flow analysis.
  • Check for the state of charge of the electric vehicles and proceed to charge them following the rule “first came-first served”.
  • Before the charging demand is approved, another power flow analysis is performed to ensure the voltage profile is still within the margin of voltage prior to the charging power request. Otherwise, the charging is delayed to the next time-frame (i.e. temporal load shifting).
The proposed charging scheme flowchart is shown in Figure 8, while the simulation results of the second case of the presented study presented in Figure 9 and Figure 10.
Results illustrate that the applied controlling technique succeeded in reducing the maximum voltage drop and power losses in the distribution grid, and this reduction is much clear as the penetration of EVs is increased in the power system (from 0 to 1000 EVs in our study).
Voltage levels for both approaches (probabilistic and stochastic) stayed in the tolerable range (0.95 to 1.05 as cited by the EN50160 standard) while meeting the PHEV owners charging requirements. Also, a noticeable decrease in the maximum total power losses in the distribution grid is achieved through this charging technique.
One drawback of the proposed technique that we can mention is the long computational time, as the Monte Carlo simulation was performed for 1000 cycles to ensure the convergence of the system results and the need to check using the power flow analysis in each charging request.

6. Conclusions

Stochastic models for the daily travel and charging behavior of PHEV owners were established based on a real-life survey. Recordings for average daily power consumption were selected to generate random residential loads. The new model was used to more accurately estimate the power demand of each vehicle during the charging process. Voltage drop and line losses were monitored and used as assessment criteria. Numerical results show the challenging task of operating distribution systems under the high-expected penetration of electric vehicles in the near future. A controlling scheme to regulate the charging of EVs will mitigate this influence and may delay the need for a grid reinforcement, which will have a financial benefit for both EV owners and DSO. Exploring the new electric car technologies, including the BEVs and FCEV on the one hand and the bi-directional flow of energy between the grid and EV on the other hand, is the next step in this research.

Author Contributions

Conceptualization, R.B., J.W., and M.B.; Methodology, R.B., J.W., and M.B.; Software, R.B.; Validation, R.B., J.W., M.B., G.Y., and L.Z.; Formal Analysis, R.B.; Investigation, R.B.; Writing—Original Draft Preparation, R.B.; Writing—Review & Editing, R.B., J.W., M.B., G.Y., and L.Z.; Supervision, R.B., J.W., M.B., G.Y., and L.Z. All authors have read and agreed to the published version of the manuscript.

Funding

This research received no external funding.

Conflicts of Interest

The authors declare no conflict of interest.

Abbreviations

The following abbreviations are used in this manuscript:
BEVbattery electrical vehicles
PHEVPlug-in hybrid electric vehicles
FCEVFuel Cell Electric Vehicles
NHTSNational Household Travel Survey
AERAll-electric range
AVDAverage Voltage Drop
MVDMaximum Voltage Drop
MDRPLMaximum Daily Real Power Losses
UDSThe Uncontrolled Deterministic Summer case
UDWThe Uncontrolled Deterministic Winter case
USSThe Uncontrolled Stochastic Summer case
USWThe Uncontrolled Stochastic Winter case
Nomenclature
tdepDeparture time
µdepThe mean value of the departure time PDF
σdepThe standard deviation of the departure time PDF
tarrArrival time
µarrThe mean value of the arrival time PDF
σarrThe standard deviation of the arrival time PDF
dThe daily travelled distance
µdThe mean value of daily travelled distance PDF
σdThe standard deviation of the daily travelled distance PDF
SoCState of Charge
NThe number of hours required to fully charge the battery from an empty state
DTraveled distance
SoCregSoC recharged from the regenerative braking
DkThe Kantorovich distance between two scenarios
SiThe ith Scenario
Kthe number of scenarios in the original set
Fkfitness level to each member in the set
P(i)the probability of ith representative load profile
VrefThe rated bus voltage
Vt,iThe node voltage at time t
NbThe numbers of nodes in the power system
NlThe numbers of branches in the power system
TThe number of time intervals

References

  1. United Nations Framework Convention on Climate Change (UNFCCC). Paris Declaration on Electro-Mobility and Climate Change & Call to Action. December 2015. Available online: https://unfccc.int/media/521376/paris-electro-mobility-declaration.pdf (accessed on 30 June 2019).
  2. International Energy Agency. Global EV Outlook 2017. Available online: https://webstore.iea.org/download/direct/291?fileName=GlobalEVOutlook2017.pdf (accessed on 25 May 2019).
  3. International Organisation of Motor Vehicles Manifacturers. Climate Change and CO2. May 2008. Available online: http://oica.net/wp-content/uploads/climate-change-and-co2-brochure.pdf (accessed on 25 May 2019).
  4. Jayakumar, A.; Chalmers, A.; Lie, T.T. Review of prospects for adoption of fuel cell electric vehicles in New Zealand. IET Electr. Syst. Transp. 2017, 7, 259–266. [Google Scholar] [CrossRef]
  5. Hong, B. Plug-in Hybrid Electric Vehicles (PHEVs); IEEE Emerging Technologies Portal: New York, NY, USA, 2012. [Google Scholar]
  6. U.S Department of Energy. Vehicle Technologies Program. October 2011. Available online: https://www.energy.gov/eere/electricvehicles/electric-vehicle-basics (accessed on 20 May 2019).
  7. Boudina, R.; Wang, J.; Benbouzid, M.; Khoucha, F.; Boudour, M. Impact evaluation of large scale integration of electric vehicles on power grid. Front. Energy 2018. [Google Scholar] [CrossRef]
  8. Lopes, J.A.P.; Soares, F.J.; Almeida, P.M.R. Integration of electric vehicles in the electric power system. Proc. IEEE 2011, 99, 168–183. [Google Scholar] [CrossRef] [Green Version]
  9. Putrus, G.A.; Suwanapingkarl, P.; Johnston, D.; Bentley, E.C.; Narayana, M. Impact of electric vehicles on power distribution networks. In Proceedings of the Vehicle Power and Propulsion Conference, Dearborn, MI, USA, 7–10 September 2009. [Google Scholar] [CrossRef]
  10. Jayaweera, D.; Islam, S. Risk of supply insecurity with weather condition-based operation of plug in hybrid electric vehicles. IET Gener. Transm. Distrib. 2014, 8, 2153–2162. [Google Scholar] [CrossRef] [Green Version]
  11. Haidar, A.M.A.; Muttaqi, K.M.; Haque, M.H. Multistage time-variant electric vehicle load modelling for capturing accurate electric vehicle behaviour and electric vehicle impact on electricity distribution grids. IET Gener. Transm. Distrib. 2015, 9, 2705–2716. [Google Scholar] [CrossRef]
  12. Kim, Y.; Kwak, J.; Chong, S. Dynamic pricing, scheduling, and energy management for profit maximization in PHEV charging stations. IEEE Trans. Veh. Technol. 2017, 66, 1011–1026. [Google Scholar] [CrossRef]
  13. Dong, Q.; Niyato, D.; Wang, P.; Han, Z. The PHEV charging scheduling and power supply optimization for charging stations. IEEE Trans. Veh. Technol. 2016, 65, 566–580. [Google Scholar] [CrossRef]
  14. Berthold, F.; Ravey, A.; Blunier, B.; Bouquain, D.; Williamson, S. Design and development of a smart control strategy for plug-in hybrid vehicles including vehicle-to-home functionality. IEEE Trans. Transp. Electrif. 2015, 1, 168–177. [Google Scholar] [CrossRef]
  15. Hu, J.; Si, C.; Lind, M.; Yu, R. Preventing distribution grid congestion by integrating indirect control in a hierarchical electric vehicles’ management system. IEEE Trans. Transp. Electrif. 2016, 2, 290–299. [Google Scholar] [CrossRef] [Green Version]
  16. Clement-Nyns, K.; Haesen, E.; Driesen, J. The impact of charging plug-in hybrid electric vehicles on a residential distribution grid. IEEE Trans. Power Syst. 2010, 25, 371–380. [Google Scholar] [CrossRef] [Green Version]
  17. Su, W.; Chow, M.-Y. Performance evaluation of an EDA-based large-scale plug-in hybrid electric vehicle charging algorithm. IEEE Trans. Smart Grid 2012, 3, 308–315. [Google Scholar] [CrossRef]
  18. Hajimiragha, A.; Canizares, C.A.; Fowler, M.W.; Elkamel, A. Optimal transition to plug-in hybrid electric vehicles in Ontario, Canada, considering the electricity-grid limitations. IEEE Trans. Ind. Electron. 2010, 57, 690–701. [Google Scholar] [CrossRef]
  19. Shafiee, S.; Fotuhi-Firuzabad, M.; Rastegar, M. Investigating the impacts of plug-in hybrid electric vehicles on power distribution systems. IEEE Trans. Smart Grid 2013, 4, 1351–1360. [Google Scholar]
  20. Rezaee, S.; Farjah, E.; Khorramdel, B. Probabilistic analysis of plug-in electric vehicles impact on electrical grid through homes and parking lots. IEEE Trans. Sustain. Energy 2013, 4, 1024–1033. [Google Scholar]
  21. Tan, J.; Wang, L. Integration of plug-in hybrid electric vehicles into residential distribution grid based on two-layer intelligent optimization. IEEE Trans. Smart Grid 2014, 5, 1774–1784. [Google Scholar] [CrossRef]
  22. Gray, M.K.; Morsi, W.G. Power quality assessment in distribution systems embedded with plug-in hybrid and battery electric vehicles. IEEE Trans. Power Syst. 2015, 30, 663–671. [Google Scholar] [CrossRef]
  23. Wang, X.; Karki, R. Exploiting PHEV to augment power system reliability. IEEE Trans. Smart Grid 2017, 8, 2100–2108. [Google Scholar] [CrossRef]
  24. Gao, S. Design, Analysis and Control of Vehicle-to-Grid Services. Ph.D. Thesis, The University of Hong Kong (HKU), Hong Kong, China, 2014. [Google Scholar]
  25. Marra, F.; Yang, G.Y.; Træholt, C.; Larsen, E.; Rasmussen, C.N.; You, S. Demand profile study of battery electric vehicle under different charging options. In Proceedings of the 2012 IEEE Power and Energy Society General Meeting, San Diego, CA, USA, 22–26 July 2012. [Google Scholar]
  26. Jiang, J.; Zhang, C. Fundamentals and Application of Lithium-Ion Batteries in Electric Drive Vehicles; John Wiley & Sons: Singapore, 2015; Volume 2015, pp. 19–20. [Google Scholar]
  27. Toyota Motor Sales. Toyota Prius Prime 2017 Hybrid Electric Car. Available online: https://www.toyota.com/priusprime/ (accessed on 25 October 2017).
  28. Santos, A. Summary of travel trends: 2009 national household travel survey. 2011. Available online: https://nhts.ornl.gov/2009/pub/stt.pdf (accessed on 10 March 2019).
  29. U.S. Department of Transportation Federal Highway Administration. National Household Travel Survey; U.S. Department of Transportation Federal Highway Administration: Washington, DC, USA, 2009. [Google Scholar]
  30. Leou, R.-C.; Su, C.-L.; Lu, C.-N. Stochastic analyses of electric vehicle charging impacts on distribution network. IEEE Trans. Power Syst. 2014, 29, 1055–1063. [Google Scholar] [CrossRef]
  31. Kromer, M.A. Electric Powertrains: Opportunities and Challenges in the US Light-Duty Vehicle Fleet. 2007. Massachusetts Institute of Technology. Available online: http://energy.mit.edu/wp-content/uploads/2007/05/MIT-LFEE-07-003-RP.pdf (accessed on 15 March 2019).
  32. Darabi, Z.; Ferdowsi, M. Aggregated Impact of Plug-in Hybrid Electric Vehicles on Electricity Demand Profile. IEEE Trans. Sustain. Energy 2011, 2, 501–508. [Google Scholar] [CrossRef]
  33. Hua, L.; Wang, J.; Zhou, C. Adaptive electric vehicle charging coordination on distribution network. IEEE Trans. Smart Grid 2014, 5, 2666–2675. [Google Scholar]
  34. National Grid US. National Grid Residential Load Data. Available online: https://www9.nationalgridus.com/masselectric/energy_supplier/index.asp (accessed on 7 October 2017).
  35. Kazarlis, S.A.; Bakirtzis, A.; Petridis, V. A genetic algorithm solution to the unit commitment problem. IEEE Trans. Power Syst. 1996, 11, 83–92. [Google Scholar] [CrossRef]
  36. Baran, M.E.; Wu, F.F. Optimal capacitor placement on radial distribution systems. IEEE Trans. Power Deliv. 1989, 4, 725–734. [Google Scholar] [CrossRef]
  37. Li, W. Reliability Assessment of Electric Power Systems Using Monte Carlo Methods; Springer Science & Business Media: New York, NY, USA, 1994; p. 51. [Google Scholar]
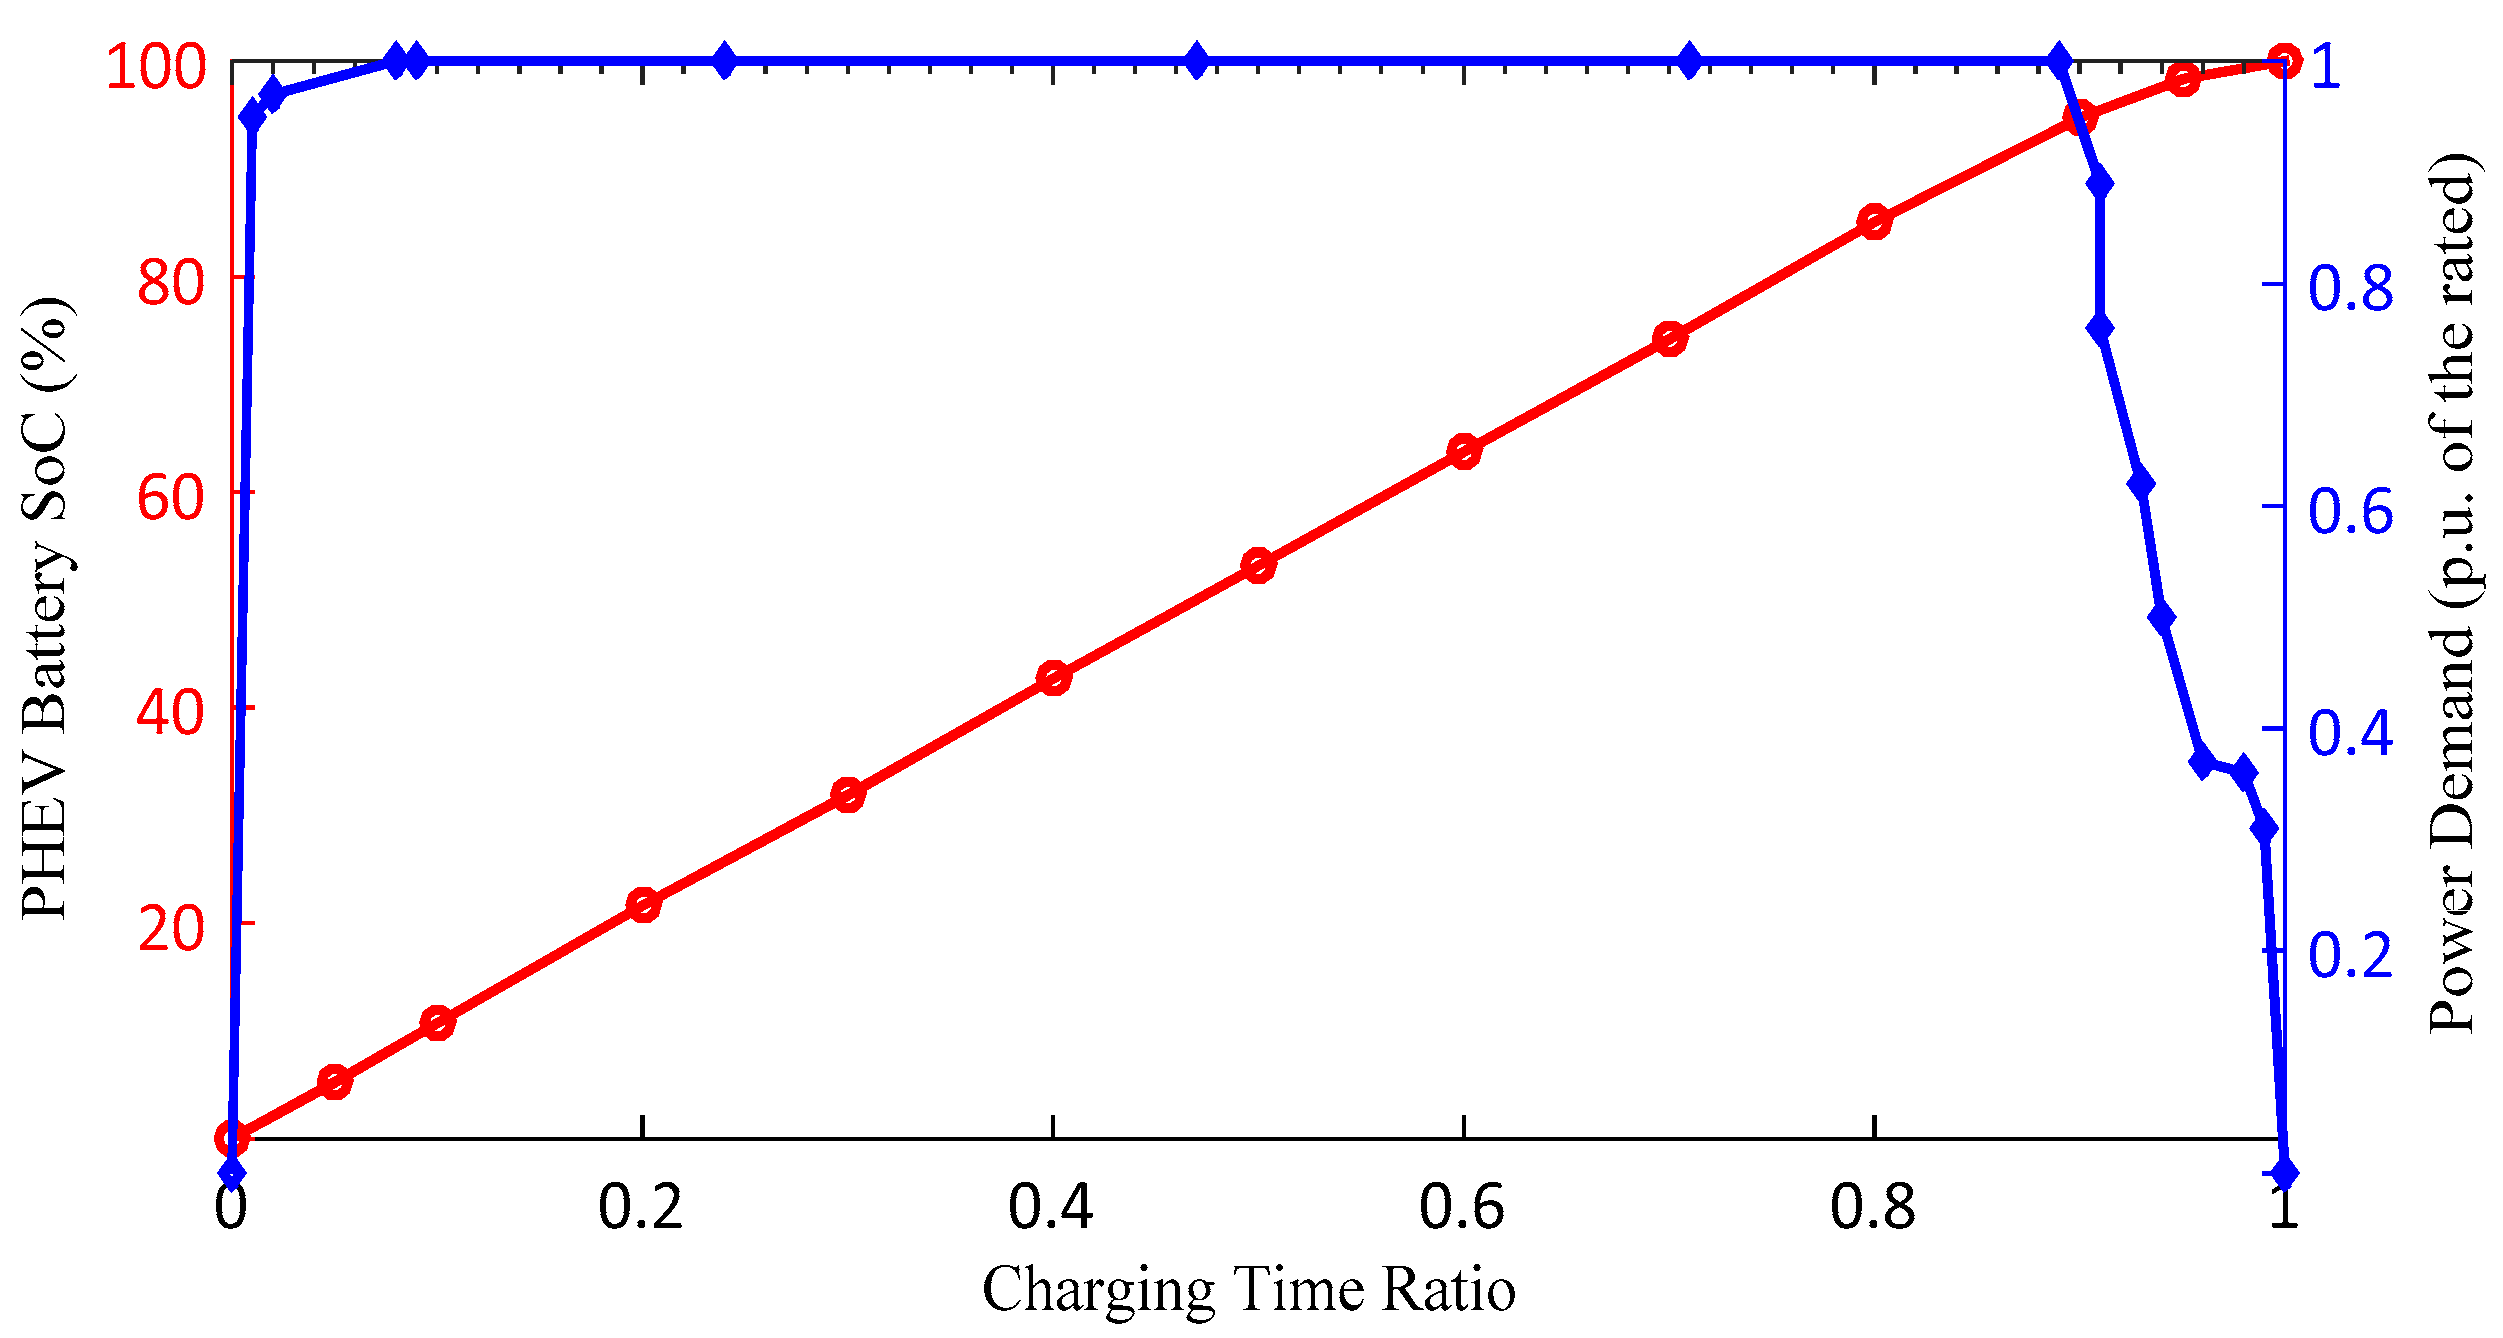
Figure 1. PHEV SoC and power demand during the charging.
Electronics 09 00139 g001
Figure 2. Scenarios representative subset for summer (a) and winter (b).
Electronics 09 00139 g002
Figure 3. Probability of occurrence of summer (a) and winter (b) reduced profiles.
Electronics 09 00139 g003
Figure 4. One-line diagram of the IEEE 69 radial distribution test system.
Electronics 09 00139 g004
Figure 5. Uncontrolled charging scheme flowchart.
Electronics 09 00139 g005
Figure 6. Voltage drop of the distribution grid buses.
Electronics 09 00139 g006aElectronics 09 00139 g006b
Figure 7. Maximum total active power losses in the distribution grid lines.
Electronics 09 00139 g007
Figure 8. Controlled charging for the PHEV fleet.
Electronics 09 00139 g008
Figure 9. (a) Maximum voltage and (b) Maximum total power losses for controlled and uncontrolled charging using stochastic approach.
Electronics 09 00139 g009
Figure 10. (a) Maximum voltage and (b) Maximum total power losses for controlled and uncontrolled charging using deterministic approach.
Electronics 09 00139 g010
Table 1. Plug-in hybrid electric vehicle (PHEV) Fleet Characteristics.
ParametersValueUnit
Average battery capacity8.8kWh
All-electric range 25Mile
Full Charging Time (Level 1)5.5Hour
Full Charging Time (Level 2)2.5Hour
Depletion Mode Energy Use (η)0.37kWh/mile
Table 2. Distance matrices between all the scenarios.
123N
100.488770.619570.2168
20.4887700.357140.6437
30.619570.3437500.77604
.... .
N0.21680.64370.776040