Abstract
Engineering laboratories are key elements in engineering learning and are essential for a concrete understanding of engineering topics and experiments. These key laboratories are no longer just hardware-dependent, they are a creative combination of programmable hardware and also user-defined driving software. In this work, an educational power system protective relaying laboratory platform was designed and implemented using a programmable logic controller (PLC) and human–machine interface (HMI) in order to introduce engineering students to the operating mechanisms experimentally. It engaged the students in selecting settings and upgrading the inverse definite minimum time (IDMT) protection relays for overcurrent, overvoltage, undervoltage, and differential current. With the platform and the help of the HMI, the students mastered (or came close to mastering) the field of protective relays, especially those explicitly implemented in the platform. The students were also able to see the real-time response that is equivalent to the relay operation time of the protective relays under the various possible settings, and the kinesthetic learning that was involved gave them a deeper understanding of what is involved in relays upgrading.
1. Introduction
Power system protection laboratory experiments are essential for electrical engineering teaching. They support the theoretical understanding of the students, and thus they increase the efficacy of the teaching process. Currently, there is general agreement on the high value of laboratory work in engineering education. Some authors even say that laboratory sessions are the heart of engineering [1]. The design and operation of a solid-state directional, inverse-time overcurrent protective relay were suggested in 1978 [2]. Trutt proposed a microprocessor-based relay protective system in [3]. Abe et al. [4] introduced programmable logic array-based digital system design laboratories. A digital logic design using computer-aided design and hardware description language was discussed in [5]. Lee et al. [6] suggested the usage of the power system simulation laboratory to enhance the teaching and research activities in protective relay education. These facts have been reflected in continuous attempts to develop new and more attractive laboratories.
A laboratory equipment system developed for designing digital systems based on programmable logic devices was described by several published works, such as in [7,8,9]. A remote laboratory environment for logic circuit design based on field programmable logic devices was presented in References [10,11]. Simon et al. showed a remote laboratory platform for electrical drive control using a programmable logic controller (PLC) [12]. Education and training of future protective engineers was discussed by Reference [13]. Sothong and Chayratsami were designed a combinational logic training system using field-programmable gate arrays (FPGAs) [14]. The development of the modern power system laboratory was presented and discussed in Reference [15], which highlighted the need to reform power engineering education to integrate computer engineering, data communication, and networking. Overcurrent model implementation for real-time simulation and hardware in the loop validation was introduced by Almas et al. in [16]. A PLC–HMI-based control platform (HMI: human–machine interface) was developed to exercise the proportional-integral-differential controller (PID) and fuzzy controlled process behavior under different settings of the controller’s parameters [17]. Vadi and Bayindir [18], showed that a remote access laboratory using an open platform communication (OPC) and PLC for synchronous motor control experiments.
The Institute of Electrical and Electronics Engineers (IEEE) power system relaying committee announced that a laboratory is essential for students to acquire the ability to operate relays in real life [19]. Hernandez et al. proposed a remote laboratory platform for electrical drive control using a programmable logic controller (PLC) [20]. The design and implementation of high-speed FPGAs for under and overvoltage protective relays was reported by Venkateshmurthy and Nataraj [21]. Kotsampopoulos et al. suggested a laboratory education of modern power systems based on a power hardware-in-the-loop (PHIL) simulation [22]. Based on hardware and software integration, and to bridge the gap between theory and practice, Giacaman and De Ruvo [23] presented an educational, real-time platform for automating reliance on a smart grid. In this work, we developed and assessed a PLC–HMI-based system to exercise students in protection relays covering overcurrent and over and undervoltage, including differential current protective relays. Birchfield et al. considered the use of sizeable electric power grids in the university and electric power system courses [24]. These courses give the students more understanding and experience of actual power systems.
This work is structured as follows: Section 2 describes the key points considered in constructing this platform and the way these features relate to each other. Section 3 gives the hardware structure, and Section 4 details the software utilities. Section 5 shows the two wiring diagrams required to execute all of the functions that could be tested or studied using the proposed platform. Section 6 discusses the feedback from the students with regards to the experiment. Conclusions are summarized in Section 7.
2. Proposed Platform
The development of this teaching platform was motivated by the fact that most hardware and hardwired applications, such as power system protective relays, can be reproduced using software. These software-based instances represent advanced applications as they have inherited the features of the past generation and add new features such as remote control and monitoring, in addition to the fact that their upgrading or modifications are easy. This platform was designed to explore with our engineering students the importance of the PLC and HMI programming topics they consider in their final year, and to encourage them to start from where the others finished. This platform might bridge the gap between theory and practice in the area of power system protective relays, and can also improve student learning. This is similar to the active classroom programmer (ACP) that allows the instructor to fully control the lesson [23].
The platform was developed to meet the following aims:
- (1)
- To show engineering students that there is a strong link between the programming instructions they have been taught and the implementation of working applications.
- (2)
- To create a low-cost, multifunction platform in order to teach and exercise the behavior of the overcurrent, overvoltage, and undervoltage protective relays under different time multiplier settings and characteristic curves.
The proposed platform was designed to read two current signals, two voltage signals, and to control the closing/opening of five magnetically operated contacts. The current signals are taken from current transmitters connected as burdens to current transformers (CTs). The voltage signals are taken from voltage transmitters connected to the power circuit source and load terminals. Through its HMI, the platform allows the user to experiment with:
- The overcurrent protective relay.
- The overvoltage protective relay.
- The undervoltage protective relay.
- The current differential protective relay.
Figure 1 shows the functional block diagram that states the sources and destinations of the digital closing/opening signals (QA: source side closing contact, QC: load side closing contact, QB, QD and QE are load connecting contacts) and current/voltage analog signals (A2D stands for analog to digital converter). The PLC–HMI-based electronics control circuit components and wiring are shown in Figure 2. The hardware and software implementations of the present work are illustrated in the following sections.
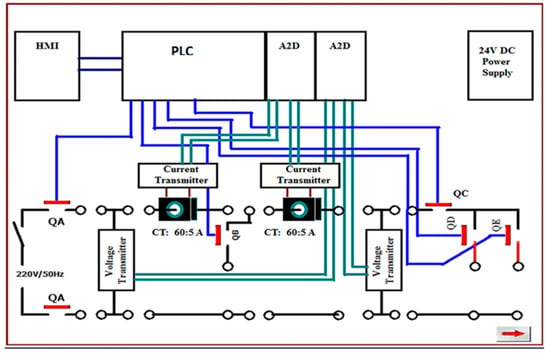
Figure 1.
The functional blocks of the proposed platform.
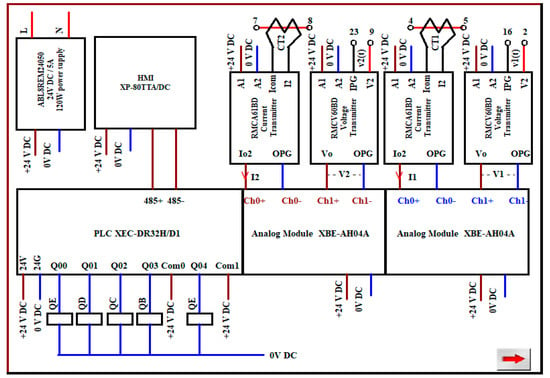
Figure 2.
The electronics control circuit components and wiring of the proposed platform.
Hardware Structure
Figure 3 shows the front, left side, right side, and inside of the casing that was designed. The front (Figure 3a) was selected to accommodate the HMI. The left side (Figure 3b) was used to attach an Ethernet socket to provide remote usage and monitoring (i.e., to use the remote control software provided by LSIS Company, such as XP-remote and XP-manager) and also a 13A socket for power service. The right side (Figure 3c) was provided with banana power sockets to allow the user to create his or her own circuits. The inside (Figure 3d) highlights the installed devices.
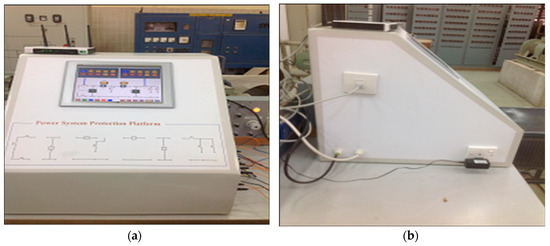
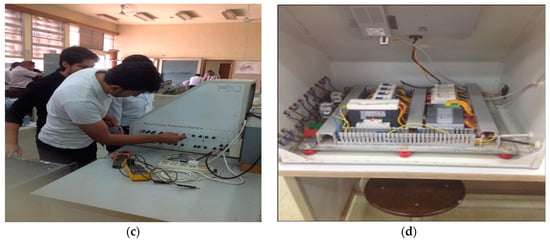
Figure 3.
Prototype of the proposed platform, (a) the front side, (b) the left side, (c) the right side, (d) the inside view.
The devices installed were:
XEC-DR32H/D1 (PLC): A programmable logic controller used to develop the virtual instances of the inverse definite minimum time (IDMT) protective relays for overcurrent, overvoltage, undervoltage, and differential current.
XBF-AH04A: A 12 bit analog module used to convert analog signals into digital one. Two modules of this type were used. One module, at the source side, was used to convert the sending end current and voltage signals into 0–20 mA analog signals. The second, at the load side, was used to convert the receiving end (load end) current–voltage signals into two 0–20 mA analog signals.
XP80-TTA/DC (HMI): A touch panel to provide the user interface screens through which the user selects the protective relay, sets the parameters of the protective relays, and monitors the protective behavior of the individual relays.
ABL8REM24050: A 24 V, 5 A, 120 W DC power supply to power the analog module and also to excite the PLC inputs and PLC-output-connected actuators.
RMCA61BD: A current transmitter used to convert the current transformer’s secondary current into a suitable (0–20 mA or 4–20 mA) analog current signal or suitable (0–10 V DC) analog voltage signal for reading by the XBF-AH04A analog module attached to the PLC.
RMCV60BD: A voltage transmitter used to convert the voltage difference between two points into a suitable 0–20 mA or 4–20 mA analog current signal or (0–10 V DC) analog voltage signal for reading by the analog module attached to the PLC.
LC1D09: A magnetic contactor to provide a PLC-controlled power switch. Five of this type of contactor were used. These five contractors were labeled QA, QB, QC, QD, and QE. QA is used to connect and disconnect the energizing power source. The default function of QB was to create a deliberate internal fault when studying differential current relay. QC was used to disconnect the load under a fault condition. QD and QE were used to connect and disconnect the first and second stages of the load, respectively.
LS BKN C16: A miniature circuit breaker to protect the experimental setup.
3. Software Structure
The software structure can be divided into two parts: the mathematical background and PLC–HMI software utilities, which are detailed in the following subsections:
3.1. Mathematical Background
The inverse definite minimum time (IDMT)-based protection relay function was considered according to the following scenario. The adopted scenario was “if the input signal (current in case of over-current relay and voltage in case of over and undervoltage relays) exceeds the pickup value (current and voltage pickup values), the relay detects an over state and waits for a specific time before issuing a trip signal”. The waiting time depends upon the adopted characteristic curve setting.
The proposed protective relay prototype introduced in this work used the following well known characteristic equations to develop the overcurrent, overvoltage, undervoltage, and percentage differential relays. The IDMT over-current relay characteristic is represented as [25,26]
where T is the relay operation time, TMS stands for the time multiplier setting, I represents the current flowing in the relay, Is defines the overcurrent setpoint, and k, a, and c are constants defining the curve. In this work, Equation (1) was translated as shown in Figure 4.
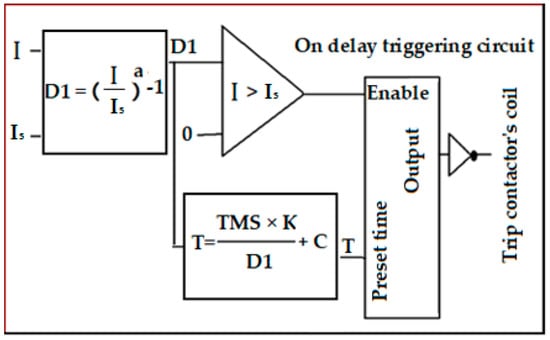
Figure 4.
Circuit implementation of Equation (1).
The characteristic equation of the IDMT overvoltage relay can be represented as
where V is the operating voltage and Vs is the over-voltage set point. Here, the circuit description of Figure 4 is also valid for Equation (2), where, I is replaced by V and Is replaces VS.
Equation (3) represents the IDMT undervoltage relay characteristic.
where V is the operating voltage and Vs is the undervoltage set point. For the undervoltage protection relay, the same circuit description shown in Figure 4 works if D1 is equal to .
Finally, the percentage differential relay equations are represented in Equations (4) and (5), respectively, as follows.
where, Id is the differential current, It represents the restraint equivalent current, and k forms the slope of the percentage differential characteristic. Figure 5 shows the circuit implementation of this type of protective relay. The relay operates when .
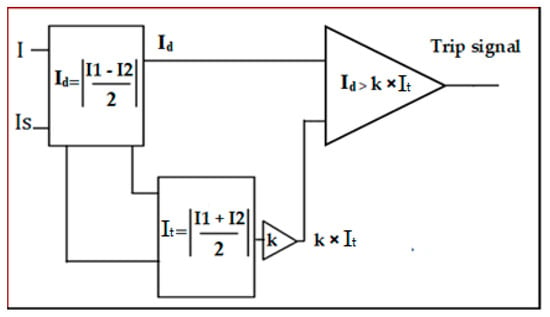
Figure 5.
Circuit implementation of Equations (4) and (5).
3.2. PLC–HMI Software Utilities
This protective relaying platform was implemented using two application software services. The first (PLC-related one) allows the PLC to evaluate the current and voltage signals coming from the current and voltage transmitters. The second (touch-panel-related one) allows the user to interact with the PLC utility. It also enables the selection of different characteristic curves for protective relaying and allows online monitoring of the response of the protective system when using different operating configurations.
3.2.1. PLC Software Utilities
The PLC was programmed to support the study of IDMT protection relays for overcurrent, overvoltage, undervoltage, and also to provide an introduction to the basic principles of the percentage differential protective relays algorithms. The structured text (ST) language of these algorithms was:
- 1.
- IDMT over-current relay algorithm:The flowchart for the IDMT overcurrent relay algorithm is shown in Figure 6, in which OC1k, OC1a, OC1c, IS1, CM1, and OC1Td stand for k, a, c, Is, I, and T in Equation (1), respectively. The related PLC-structured text code is listed in Appendix A, Figure A1.
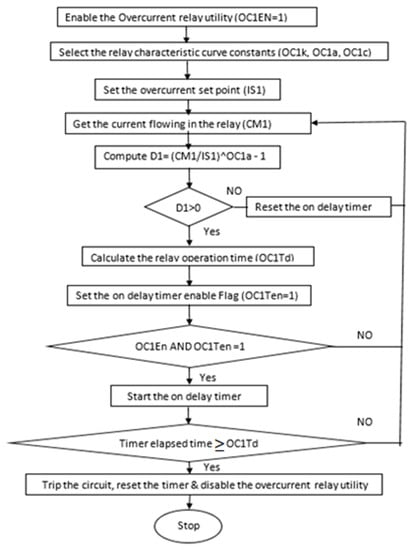 Figure 6. Overcurrent protection utility.
 - 2.
- IDMT over-voltage relay algorithm:The flowchart for the IDMT over-voltage relay algorithm is shown in Figure 7, in which OV1k, OV1a, OV1c, VS1, VM1, and OV1Td stand for k, a, c, Vs, V, and T in Equation (2), respectively. The related PLC-structured text code is listed in Appendix A, Figure A2.
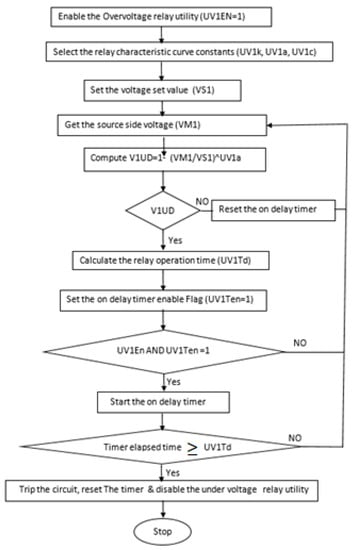 Figure 7. Overvoltage protection utility.
 - 3.
- IDMT under-voltage relay algorithm:The flowchart for the IDMT relay algorithm is shown in Figure 8, in which UV1k, UV1a, UV1c, VS1, and VM1 stand for k, a, c, Vs, and V, respectively. The related PLC-structured text code is listed in Appendix A, Figure A3.
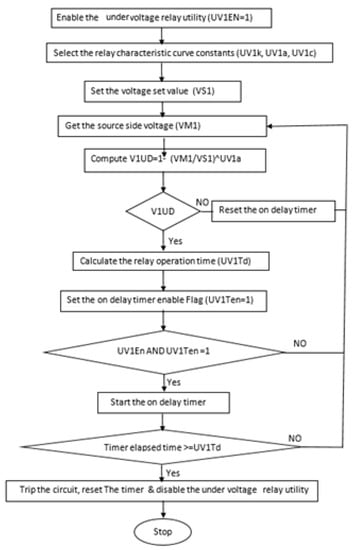 Figure 8. Undervoltage protection utility.
 - 4.
- Percentage differential relay algorithm:The flowchart of the basic percentage differential relay algorithm is shown in Figure 9, in which CM1 stands for Ict1 and CM2 stands for Ict2 in Equations (4) and (5), respectively. The related PLC-structured text code is listed in Appendix A, Figure A4.
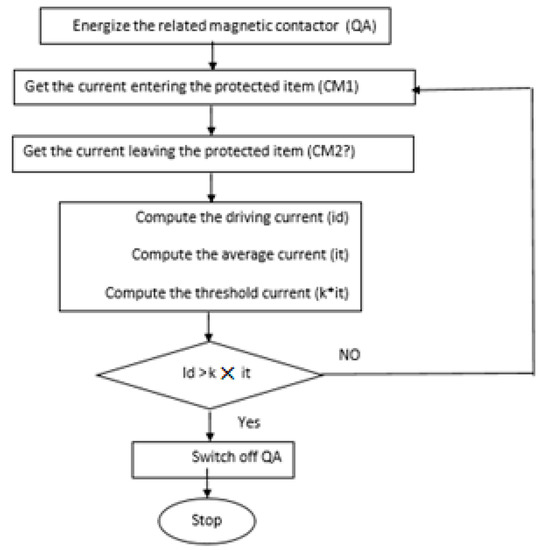 Figure 9. Differential relay utility.
3.2.2. HMI-Based Graphical Interface
This utility consists of six base screens, in which each screen has a particular function. The relay-related screens are provided with simple drawing facilities to allow the user to sketch the required experiment drawing or to write his/her comments. The following are a description of each screen and its function.
(1) Application Title Screen (see Figure 10): This displays the supported functions of the proposed prototype and allows the user to go to the navigation screen.
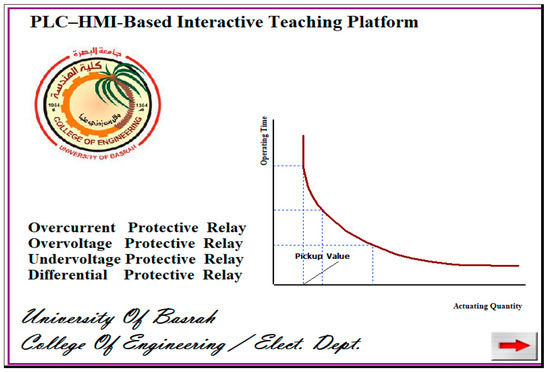
Figure 10.
Title screen of the proposed application.
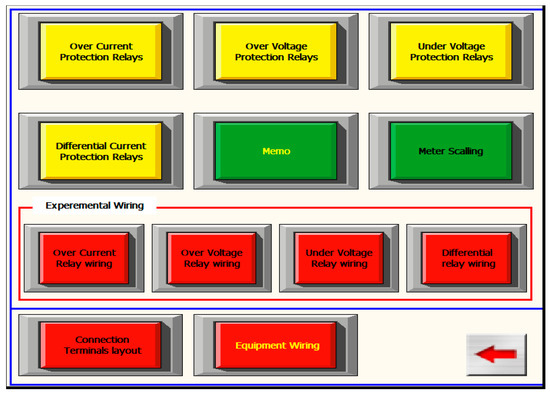
(2) Navigation Screen (see Figure A5, Appendix B): This screen provides quick access to the four protective functions’ running screens. It is also used to select the memo screen, which works as a whiteboard for the instructor. This screen also allows the designer to calibrate the measuring process by clicking over the meter scaling software button. In addition to the previously mentioned utilities, it also allows the user to get an idea about how to do the experimental wiring for the supported relaying function by clicking through the software screen change switches labeled as overcurrent relay wiring, overvoltage relay wiring, undervoltage relay wiring, and differential relay wiring. Table 1 highlights the details of each of the software buttons mounted on this screen.

Table 1.
Navigation screen configuration.
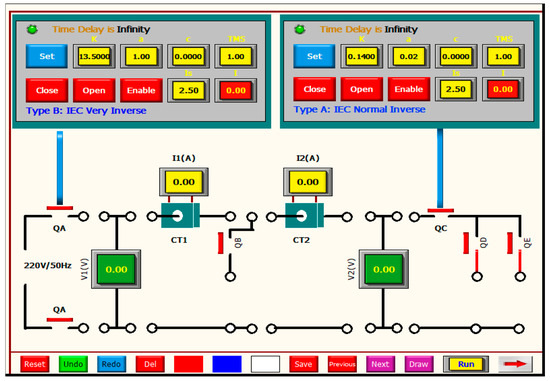
(3) Overcurrent Protective Relay Screen (see Figure A6, Appendix B): This screen allows the user to experiment with the relay behavior using different characteristic curves, and also to practice the grading of relays. With the help of this screen, the user can select the characteristic curve parameters (k, a, and c) he or she is interested in by pressing of the “SET” button, which causes the display of the IDMT curve specification popup window (see Figure A10, Appendix B). It also allows the user to display the values of the selected specifications using the numerical display devices labeled k, a, and c. The TMS and Is are entered using the numerical input devices labeled TMS and Is, respectively. The enabling of the relay running and the manual closing and opening of QA is done by the bit switches marked “Enable”, “Close”, and “Open”. The screen also adopts a memo device which allows the user to state the way they will do the circuit wiring and also to save or retrieve their drawing using the memo devices (Reset, undo, redo, Del, red, blue, and white pen selection buttons, save, previous, …etc.).
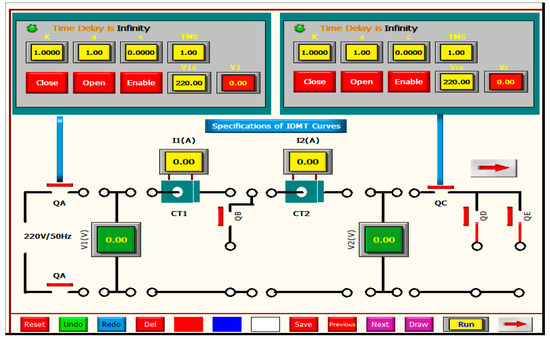
(4) Overvoltage Protective Relay Screen (see Figure A7, Appendix B): This screen allows the user to experiment with the behavior of over-voltage relays under IDMT or under the user-configurable parameters (see Figure A11, Appendix B). This screen, as its predecessor, allows the user to select the protective relay characteristic curves, display the selected curve parameters, set the undervoltage set-point, monitor the operating voltage, close and open the circuit feeding contacts (QA, QC), and load supply contacts (QD, QE). It also has a simple drawing facility to allow the user to state the way they are going to do the wiring.
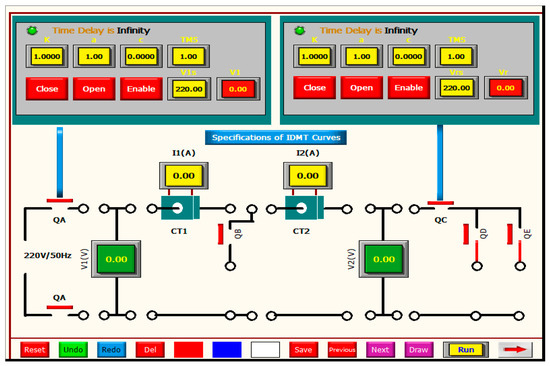
(5) Undervoltage Protective Relay Screen (see Figure A8, Appendix B): This screen allows the user to experiment with the behaviour of under-voltage relays under IDMT, or under the user-configurable parameters (see Figure A11). This screen is similar to that of overvoltage.
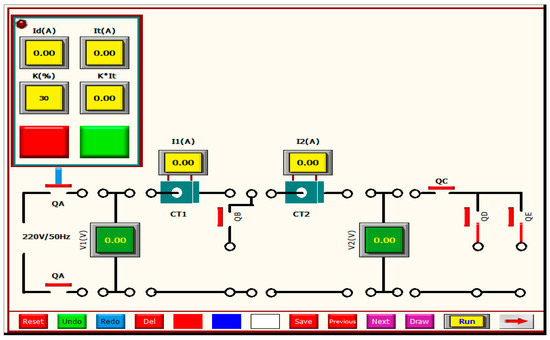
(6) Percentage Differential Relay Screen (see Figure A9, Appendix B): This screen introduces the user to the basic operating principles of this type of protective relay. With this screen, the user can monitor the differential current (Id), the average restraining current (It), and the percentage of the restraining current (k X It) using the numerical devices labeled Id (A) and It (A), respectively. The slope k of the percentage differential characteristics is also entered using the numerical input device labeled k (%). The fault creation is done by QB contact. QC, QD, and QE are bit type switches used to make and break the circuit loading magnetic contactors.
The red and green software buttons are bit switches used to energize and de-energize the magnetic contactor label QA.
Additionally, there are a number of subsidiary pop-up screens:
- (i)
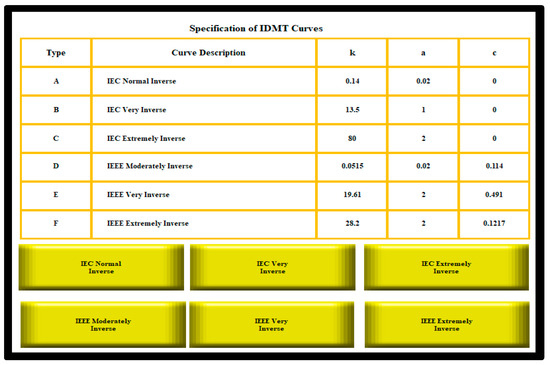
- Specification of IDMT curves for overcurrent relay pop-up screen (see Figure A10, Appendix B): through this pop-up screen, the user can select one of the six characteristic curves (IEC normal inverse, IEC very inverse, IEC extremely inverse, IEEE moderately inverse, IEEE very inverse, and IEEE extremely inverse). For example, to adopt the IEC very inverse characteristic curve, for which k = 13, a = 1, and c = 0, the following steps should be followed:
- Click the set button on the left top corner of Figure A6 to display the popup screen of the IDMT characteristic curves (see Figure 13).
- Click the IEC very inverse software button (near the bottom of Figure A10) to assign k = 13, a = 1, and c = 0 to the numerical input devices labeled k, a, and c, respectively, in Figure A6.
- (ii)
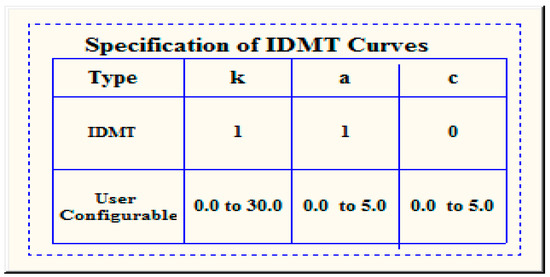
- Specifications of IDMT curves for overvoltage and undervoltage relays pop-up screen (see Figure A11, Appendix B): with the help of this pop-up screen, the user can select either IDMT or the user’s configurable settings.
4. Universal Power Circuit Wiring Diagrams
The proposed educational power system’s protective relay platform power circuit wiring points are designed in such a way that the wiring for different protective configurations (overcurrent, overvoltage, undervoltage, and differential protective relays) is as flexible as possible. As can be seen from Figure 11, two core power cables are provided, the cores of which are labeled as L and N, five magnetic-contactor-activated contacts (QA, QB, QC, QD, QE), and 27 banana sockets numbered 1,2…27, in addition to two voltage transducers and two current transformers.
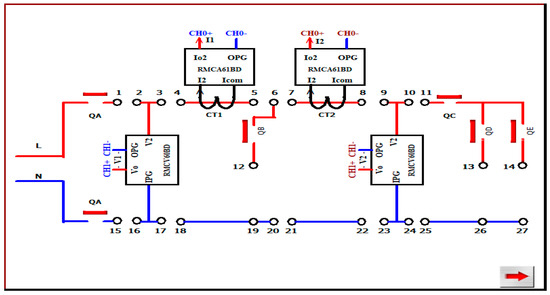
Figure 11.
Universal power circuit layout.
The power cable is used to supply the electric circuit under protection either directly from a single-phase 230 V/50 Hz AC power source, or via an autotransformer to easy the experimental practicing of overcurrent, overvoltage, undervoltage, and differential protective relays.
The 27 banana sockets are distributed a way that allows the circuit under consideration to be sectionalized, and that makes the load connections and fault creation easy.
The voltage transducers are used to supply the PLC with the real-time values of the voltages at the sending and receiving ends of the protected circuit. The current transformers are used to feed the PLC with the currents values drawn from the source and supplied to the endpoint loads.
The wiring of this structure can take one of the following configurations.
4.1. Overcurrent Relay Wiring
It is well known that an overcurrent relay is responsible for protecting its client from the over-current. To create such a training setup, the platform should be wired as shown in Figure 12. As can clearly be seen from the figure, there are two variable loads that enable different loading levels. These loads are connected to the live supply line by the QA, QC, QD, and QE magnetic contacts. The overcurrent protection utility disconnects these loads when there are overcurrent issues. The controlled disconnection is done via the QA and QC magnetic contacts. QC acts as the first line of defense, whereas QA serves as the second line of defense. With this configuration, the specifications of the IDMT curves for over-current relay shown in Figure A10 can be tested.
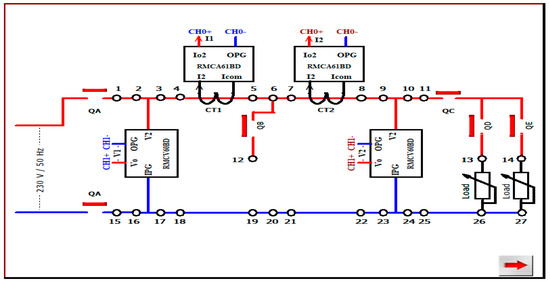
Figure 12.
Wiring required to study overcurrent relays.
4.2. Overvoltage and Undervoltage Relay Wiring
With this platform, the overvoltage and undervoltage protective relay characteristic curves shown in Figure A11 can be discussed under two different wiring configurations—one with a parallel-connected element (resistor or capacitor or inductor) between Bananas 6 and 19 under the control of magnetic contact QB as shown in Figure 13 and the second with a series-connected element (resistor or capacitor) between Banana 5 and Banana 7, as shown in Figure 14. In these configurations, the voltage level can be changed by the supplying autotransformer or by the series- or the parallel-connected element.
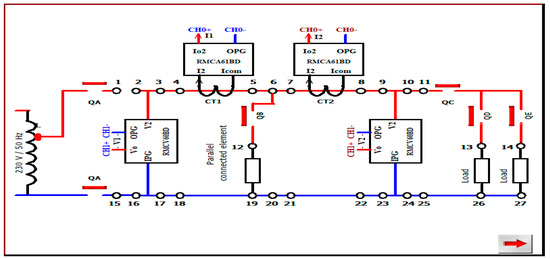
Figure 13.
Wiring required to study overvoltage relays.
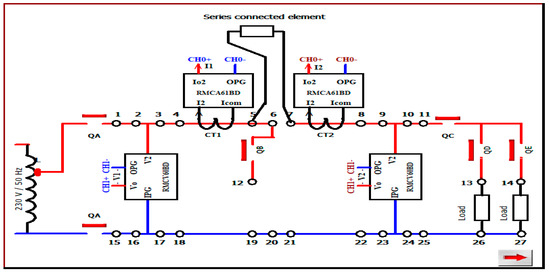
Figure 14.
Wiring required to study undervoltage relays.
4.3. Differential Relay Wiring
Figure 15 shows the wiring required to introduce the basic principles of a differential current relay. In this case, as is clear from the figure, the element to be protected is inserted between Banana 5 and 7. Banana 6 is connected to an internal point of the element under consideration (where the fault takes place). Fault creation is established by closing QB, which connects the fault point to the neutral line.
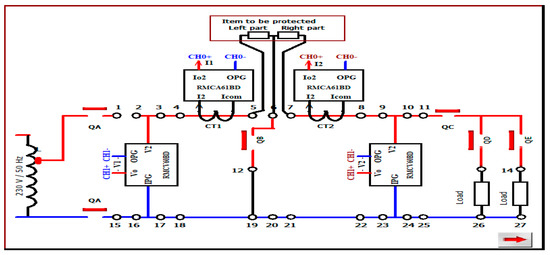
Figure 15.
Wiring required to study the percentage differential relay.
5. Experimental Results
To test the validity of the proposed training platform, it was powered from a 220 V/50 Hz off-grid photo voltaic (PV) solar inverter and illustrative samples were taken.
5.1. Overcurrent Relaying Function
In this context, three tests were carried out: the effect of the relay type selection (see the sample snapshot in Figure 16) on the relay operation time and the relay upgrading test as shown in Figure 17, in addition to the operating time/current responses for the IEC standard settings, as shown in Figure 18. From these figures, Table 2 was derived which states that the adopted relay characteristic curve had an important effect on the relay operation type. Figure 17 shows that with this platform, the teacher can show his/her students the concept of relay upgrading in which the load is protected by two protective relays; the one close to the load takes the role of first line of defense, whereas the second (close to the source) acts as the second line of defense. Figure 18 shows the time/current characteristics for the IDMT overcurrent relay for IEC extremely inverse, IEC very inverse, and IEC normal inverse. The curves were taken with TMS equal to unity. The figure shows that the normal relay had the lowest operating time, whereas the extremely inverse relay had the highest. It also states that for the upgrading condition, the normal one is recommended to play the role of the first line of defense, whereas the very inverse is suitable for the second line of defense.
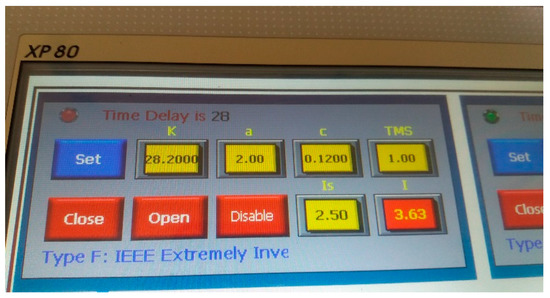
Figure 16.
Overcurrent operation under IEEE extremely inverse snapshot.
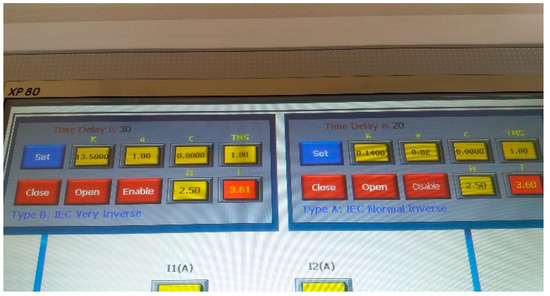
Figure 17.
Two relays mode of operation (relay upgrading).
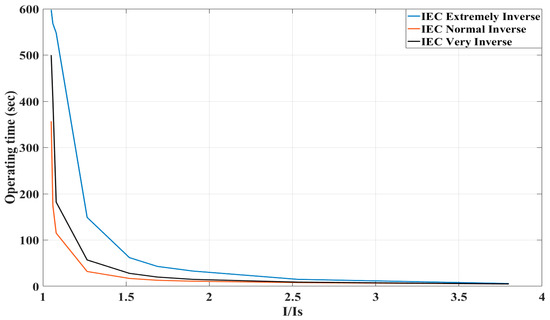
Figure 18.
Time–current characteristics.

Table 2.
Relay characteristic curve type effect.
5.2. Overvoltage Relaying Function
As mentioned earlier, this platform was designed to implement four different types of protective function. Overvoltage relaying is one of these functions. Figure 19 shows a snapshot of the real-time operation of this platform under this mode of operation. Figure 20 displays the time–voltage response for k = 1, a = 1, and TMS = 1. From the curve, it is clear that as the operating voltage increased above the setting voltage, the operating time reduced in an inverse manner.
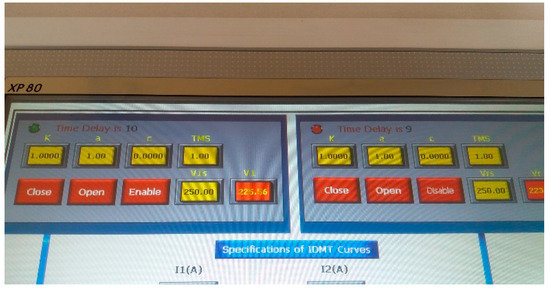
Figure 19.
Overvoltage relaying operation mode.
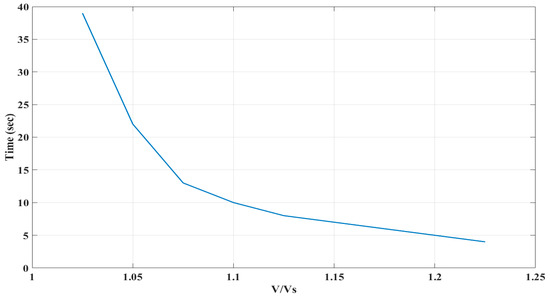
Figure 20.
Time–voltage response for overvoltage relay.
6. Results Evaluation
This platform was tested by 43 volunteer students from a fourth year electrical engineering degree course in a power and machines laboratory. Each student was provided with a set of 10n questions as listed in Table 3. The students were asked to answer using a point scale from 0–10. The results are shown in Figure 21. In Table 3, we show the average and standard deviation for the students’ answers. It can be seen that the average grading was above 70% (good evaluation), and this also is indicated in the evaluation graph (see Figure 21). The evaluation process showed that the students found this new platform agreeable. Analysis of the results showed the perception that the platform significantly improved the quality of the theoretical course on power protection in the fourth year of the electrical engineering degree course (University of Basrah). The key factors in this evaluation were

Table 3.
Average scores and Standard deviation (STDEV) for Evaluation statements.
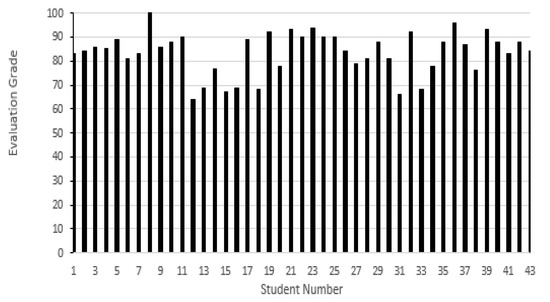
Figure 21.
Students’ evaluation graph.
- The adoption of the software instance of the discussed power system protective relays.
- The flexibility of testing different standard characteristic curves.
- The additional possibility of using a user-defined characteristic curve, which could not be tested using hardware based protective relay.
- The friendly HMI interfaces that allows the soft and easy running and testing of such applications.
7. Conclusions
PLC and HMI were efficiently integrated to build a dynamic educational power system protective relays platform, which could be used for wideband protective applications through development of the appropriate application-dependent firmware. This platform reduced the total cost required to train the power system engineering students to understand overcurrent protective relays, over and under voltage protective relays, and differential current relays through adopting software instances. In addition to the cost reduction, this training platform also reduced the maintenance requirements inherent in hardware versions. The experimental data results showed that the proposed platform can be easily used to extract the IEC curves and to show the behavior of the protective relays under different characteristic curve settings. The data also showed why the normal inverse must be used as the first line of defense, whereas the other settings can play the role of the second line of defense. The protective relaying platform developed here introduces an invaluable kinesthetic learning aspect to a theory-based course and takes the engineering students inside the real practical usage of protective relays, thus enhancing the teaching efficacy.
Author Contributions
Conceptualization, J.R.M. and R.S.A.; Methodology, J.R.M. and R.S.A.; Software, J.R.M.; Validation, J.R.M. and R.S.A.; Supervision, R.A.A.-A. All authors have read and agreed to the published version of the manuscript.
Funding
This research received no external funding.
Conflicts of Interest
The authors declare no conflict of interest.
Appendix A. Structure Text Codes
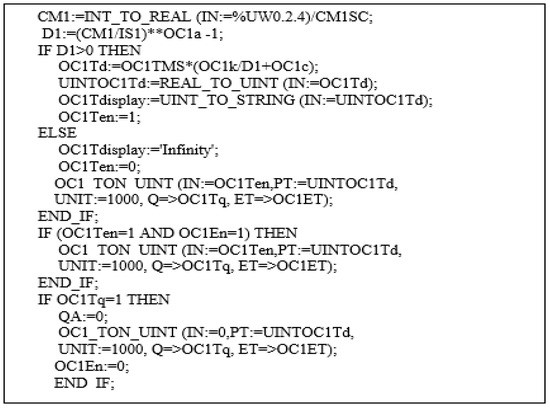
Figure A1.
ST of the IDMT overcurrent relay algorithm.
The above figure shows the ST of the IDMT over current relay algorithm, Where CM1 stands for the secondary current of the source side current transformer. IS1 is the current set value. OC1a, OC1TMS, OC1k, and OC1c represent the IDMT relay equation parameters.OC1Td is the calculated opening delay time.
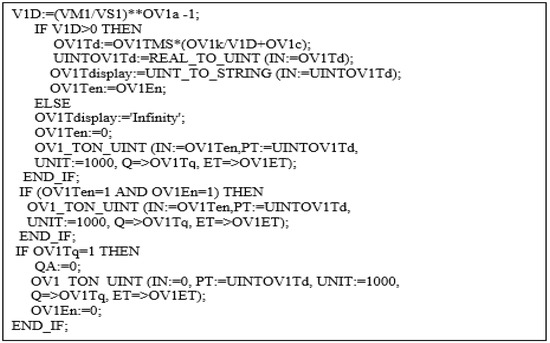
Figure A2.
ST of the IDMT overvoltage relay algorithm.
The above figure show the ST of the IDMT overvoltage relay algorithm, where VM1 stands for the source side voltage measured by the first voltage transmitter. VS1 is the voltage set value. OV1a, OV1TMS, OV1k, and OV1c represent the IDMT overvoltage relay equation parameters.OV1Td is the calculated opening delay time.
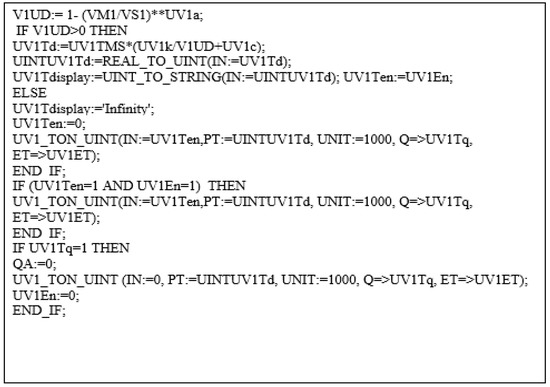
Figure A3.
ST of the IDMT undervoltage relay algorithm.

Figure A4.
ST of the percentage differential relay algorithm.
The above depicts the code of the percentage differential relay algorithm, where id represents the driving current, it stands for average current through the restraint coil; kit is the threshold current.
References
- Webb, J.W.; Reis, R.A. Programmable Logic Controllers Principles and Applications, 5th ed.; Phi Learning Private Limited: Delhi, India, 2002. [Google Scholar]
- Spangenberg, T.S.; Lowry, J.L. A solid-state protective relay for use in educational laboratories. IEEE Trans. Educ. 1978, 21, 149–152. [Google Scholar] [CrossRef]
- Trutt, F.C. Microprocessor-aided instruction power-system protection. IEEE Trans. Educ. 1981, 24, 87–89. [Google Scholar] [CrossRef]
- Abe, A.; Omori, T.; Naraoka, M. A Programmable Logic Array Suitable for Use in Digital System Design Laboratories. IEEE Trans. Educ. 1992, 35, 338–350. [Google Scholar] [CrossRef]
- Kleinfelder, M.W.; Gray, M.D.; Dudevoir, L.G. A Herarchical Approach to Digital Design Using Computer-Aided Design and Hardware Description Languages. In Proceedings of the 29th ASEE/IEEE Frontiers in Education Conference, San Juan, PR, USA, 10–13 November 1999. [Google Scholar]
- Lee, W.; Gu, J.; Li, R.; Didsayabutra, P. A physical laboratory for protective relay education. IEEE Trans. Educ. 2002, 45, 182–186. [Google Scholar]
- Supronowicz, H.; Olszwski, A.; Gawinski, H. Laboratory Stand for Designing Digital System. In Proceedings of the International Conference on Computer as a Tool, Warsaw, Poland, 9–12 September 2007. [Google Scholar]
- Mealy, B.J.; Parks, B. Work in progress—PLD-based introductory digital design in a studio setting. In Proceedings of the 37th Annual Frontiers in Education Conference—Global Engineering: Knowledge without Borders, Opportunities without Passports, Milwaukee, WI, USA, 10–13 October 2007; pp. F1C-1–F1C-2. [Google Scholar]
- Oliver, J.P.; Haim, F. Lab at Home: Hardware Kits for a Digital Design Lab. IEEE Trans. Educ. 2009, 52, 46–51. [Google Scholar] [CrossRef]
- Fujii, N.; Koike, N. A new e-learning system integrating a top-down e-learning and new virtual remote laboratory environments for logic circuit design. In Proceedings of the 37th Annual Frontiers in Education Conference—Global Engineering: Knowledge without Borders, Opportunities without Passports, Milwaukee, WI, USA, 10–13 October 2007; pp. S3G-1–S3G-6. [Google Scholar]
- Gomes, L.; Patrício, G.; Ferreira, R.; Costa, A. Remote experimentation for introductory digital logic course. In Proceedings of the 3rd IEEE International Conference on E-Learning in Industrial Electronics (ICELIE), Porto, Portugal, 3–5 November 2009; pp. 98–103. [Google Scholar]
- Simon, C.-F.; Balada, L.M.; Bellmunt, O.G.; Martines, N.L.; Puxan, O.B.; Robles, R.V. A remote laboratory platform for electrical drive control using programmable logic controllers. IEEE Trans. Educ. 2009, 52, 425–435. [Google Scholar] [CrossRef]
- Brahama, S.; Ree, D.; Gres, J.; Girgis, A.; Horowitz, S.; Hunt, R.; Kenzunovic, M.; Madani, V.; Maclaren, P.; Phadke, A.G.; et al. The education and training of future protection engineers: Challenges, opportunities, and solutions. IEEE Trans. Power Deliv. 2009, 24, 538–544. [Google Scholar] [CrossRef]
- Sothong, S.; Chayratsami, P. Design of combinational logic training system using FPGA. In Proceedings of the IEEE Frontiers in Education Conference (FIE), Washington, DC, USA, 27–30 October 2010; pp. F4F-1–F4F-4. [Google Scholar]
- Nedic, Z.; Nafalski, A. Development of a modern power system laboratory. World Trans. Eng. Technol. Educ. 2014, 12, 734–737. [Google Scholar]
- Almas, M.S.; Leelarruji, R.; Vanfretti, L. Overcurrent relay model implementation for real-time simulation and hardware-in-the-loop (HIL) validation. In Proceedings of the 38th Annual Conference on IEEE Industrial Electronics Society (IECON 2012), Montreal, QC, Canada, 25–28 October 2012; pp. 4789–4796. [Google Scholar]
- Mahmood, J.R.; Ali, R.S.; Migdadi, H.; Abd-Alhameed, R.A.; Ibrahim, E.M. Development of Educational Fuzzy Control Laboratory Using PLC and HMI. In Proceedings of the Internet Technologies and Applications Conference (ITA15), Wrexham, UK, 8–11 September 2015; pp. 383–387. [Google Scholar]
- Vadi, S.; Bayindir, R. Development of an OPC and PLC based remote-access laboratory: A synchronous motor control experiment. Int. J. Appl. Math. Electron. Comput. 2015, 3, 172–177. [Google Scholar] [CrossRef]
- Wang, Q.; Tang, Z.; Knezevic, I.; Yu, J.; Karady, G. Power system protection education and digital relay training based on a physical platform. In Proceedings of the 48th North American Power Symposium, Denver, CO, USA, 18–20 September 2016. [Google Scholar]
- Hernandez, D.C.; Ramos, G.; Penafiel, N.; Juan, M.R.; Bernal, D. Implementation of an educational real time platform for relaying automation on smart grid. Electr. Power Syst. Res. 2015, 130, 156–166. [Google Scholar]
- Venkateshmurthy, B.S.; Nataraj, K.R. Design and Implementation of high speed FPGA for under & over voltage protective relay. In Proceedings of the International Conference on Recent Advances in Electronics and Communication Technology (ICRAECT), Hammamet, Tunisia, 22–24 December 2017. [Google Scholar]
- Kotsampopoulos, P.C.; Kleftakis, V.A.; Hatziargyriou, N.D. Laboratory education of modern power systems using PHIL simulation. IEEE Trans. Power Syst. 2017, 32, 3992–4001. [Google Scholar] [CrossRef]
- Giacaman, N.; De Ruvo, G. Bridging theory and practice in programming lectures with active classroom programmer. IEEE Trans. Educ. 2018, 61, 177–186. [Google Scholar] [CrossRef]
- Birchfield, A.B.; Overbye, T.J.; Davis, K.R. Educational applications of large synthetic power grids. IEEE Trans. Power Syst. 2019, 34, 765–772. [Google Scholar] [CrossRef]
- Onah, A.J. Investigating phase over current (OC) protection in medium voltage networks. EJERS Eur. J. Eng. Res. Sci. 2019, 4, 41–49. [Google Scholar] [CrossRef]
- Horowitz, S.H.; Phadke, A.G. Power System Relaying, 4th ed.; Wiley: Hoboken, NJ, USA, 2014. [Google Scholar]
© 2020 by the authors. Licensee MDPI, Basel, Switzerland. This article is an open access article distributed under the terms and conditions of the Creative Commons Attribution (CC BY) license (http://creativecommons.org/licenses/by/4.0/).
