1. Introduction
With the development of social economy, inland navigation and ocean shipping are developing rapidly. Moreover, the number of ships and the corresponding loading capacity and the transportation velocity has continuously increased in recent decades [
1]. On the other hand, frequency of accidents, including collisions with bridges or other ships, has increased, so that automatic detection of sea targets has been widely applied in modern ships. It is of great significance to monitor adjacent ships to prevent collisions. The automatic detection of sea targets helps managers to determine the distribution of surface vessels in time, effectively manage the ship parking and prevent illegal activities such as illegal fishing and illegal ship docking [
2]. Target visual inspection has great practical value and application prospects. Applications include intelligent video surveillance, robot navigation, automatic positioning and focusing of ships in digital cameras, road detection in aircraft aerial or satellite images and obstacles in vehicle camera images [
3]. The detection, identification and tracking technology of sea surface moving targets have important applications in preventing collisions, coastal defense safety, customs management, maritime smuggling and port vessel dispatching etc. [
4].
Studies show that there are some challenges in the conventional ship target detections. Firstly, the current intelligent video surveillance system is mainly used in the terrestrial environment. It is a very challenging task to achieve target detection under complex water surface backgrounds. This is mainly due to the influence of light, wind, water waves and other factors. In the process of dynamic change, the image contains a large amount of related noise, such as the chaotic and irregular texture of the fish, the irregular texture of the wave etc., while the sky moving clouds, near-shore wave breaking and swaying branches has caused a lot of interference for target detection. These factors are likely to cause the ship's detection accuracy to be low and easy to miss detection and false detection. Secondly, the traditional method of machine learning based on image processing lacks specificity for region selection, which is easy to cause sliding window redundancy and high time complexity [
5].
In view of the problems existing in ship target detection methods, many scholars have studied better methods for detecting ship images. Li et al. [
6] combined the background-difference method with the maximum between-class variance method (OTSU) to extract the in-situ navigation targets of different rivers under different weather and different angles, and have certain weather adaptability. Shi and An [
7] used a background suppression algorithm based on multi-structural element morphological filtering to effectively suppress background noise and sea clutter and quickly detect ship targets. Traditional target detection methods have problems such as low accuracy and poor universality.
Deep learning is a branch of machine learning and can be understood as the development of the neural network. The development of neural networks has driven the development of deep learning, and neural networks have promoted the development of many fields, such as in the prediction of the electricity price. Weron summarized the electricity price forecasting methods in the past 15 years, explaining the complexity, advantages and disadvantages of the available solutions, as well as the opportunities and threats that forecasting tools provide or may encounter and speculating on the direction Electricity Price Forecasting (EPF) will or should take in the next decade or so [
8]. Cincotti et al. [
9] proposed three different methods to model prices time series: a discrete-time univariate econometric model (ARMA-GARCH) and two computational-intelligence techniques (Neural Network and Support Vector Machine). Price series exhibit a strong daily seasonality, addressed by analyzing separately a series for each of the 24 hours. Amjady and Keynia [
10] proposed a combination of wavelet transform (WT) and a hybrid forecast method to predict the price of electricity more accurately and more stably.
In recent years, with the rapid development of deep learning theory, target detection has entered a new stage. Hinton et al. [
11] first proposed deep learning techniques represented by deep neural networks in 2006, which attracted the attention of academic circles. Krizhevsky et al. [
12] constructed a deep convolutional neural network in 2012 and achieved great success in large-scale image classification. Then, in the target detection task, the deep learning method also surpassed the traditional method. In 2013, Region-based Convolutional Neural Network (R-CNN) was born. The MAP value of the VOC2007 test set was increased to 48%. In 2014, the network structure was upgraded to 66%, and the MAP of the ILSVRC2013 test set was also raised to 31.4. In 2015, He et al. [
13] proposed Res Net with a depth of up to hundreds of layers, the number of network layers (152 layers) is more than five times higher than that of any successful neural network, and the image classification error rate on the Image Net test set is as low as 3.57%. The R-CNN proposed by Girshick [
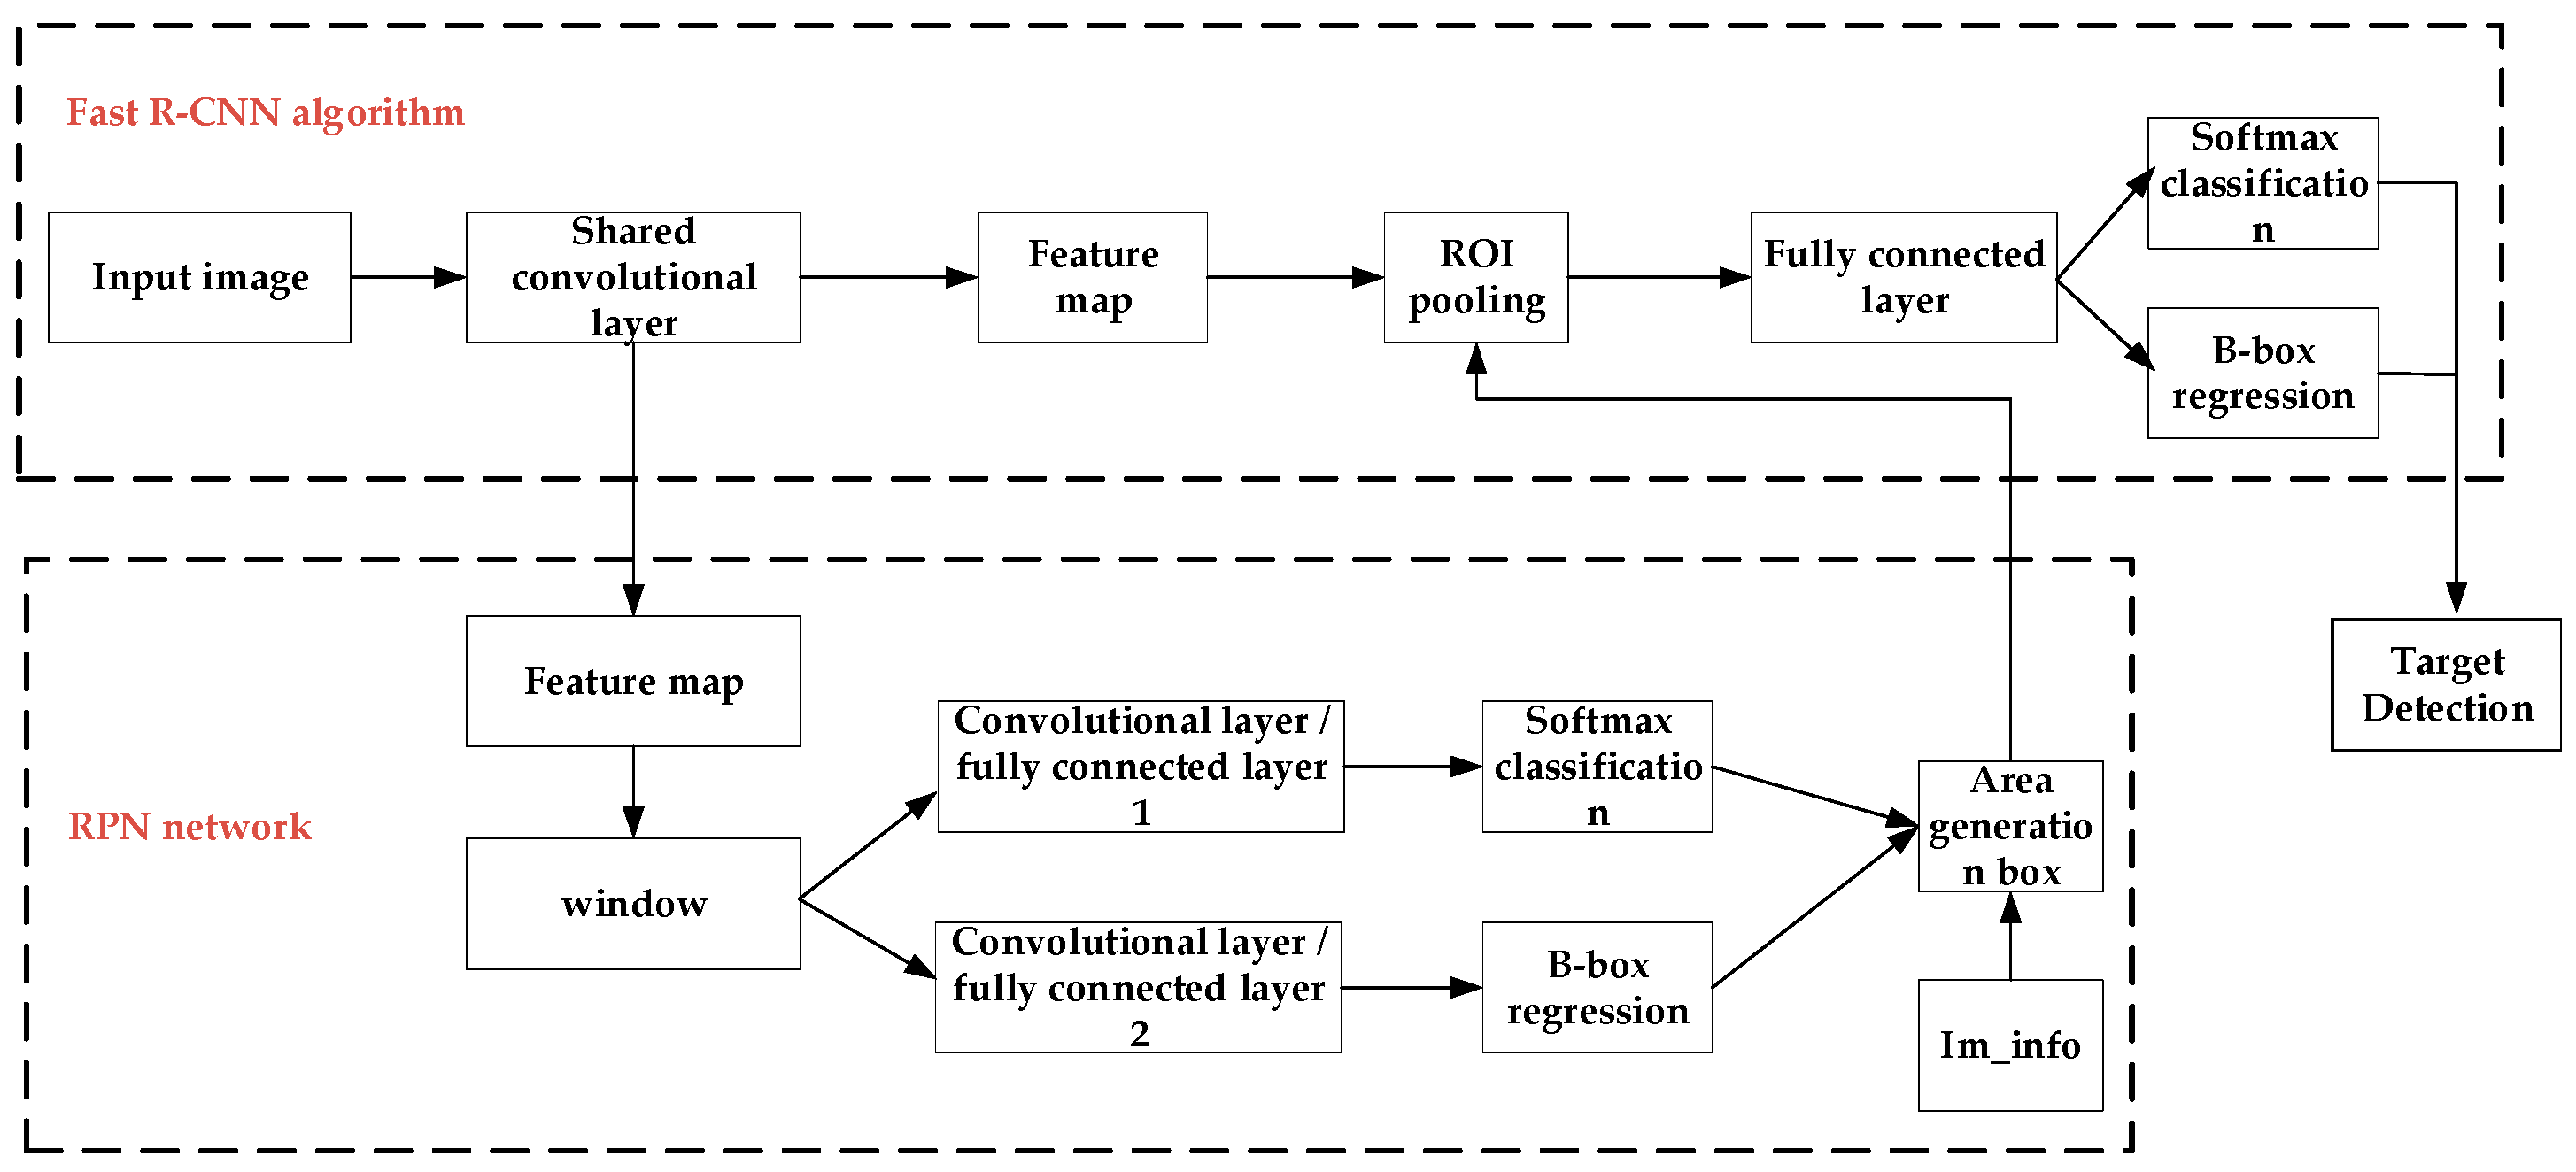
14] has made breakthroughs in the field of target detection, and successively appeared algorithms such as Spatial Pyramid Pooling (SPP), Fast Region-based Convolutional Neural Network (Fast R-CNN), Faster R-CNN, You Only Look Once (YOLO), Single Shot Multi-Box Detector (SSD) [
15,
16,
17,
18]. The innovative algorithm of deep learning is applied to the detection of ship targets, and the detection effect is significantly improved. The deep learning frameworks can learn the training image through the convolutional neural network and automatically extracts target features from the image. Furthermore, these frameworks have high learning ability, fast recognition speed and high detection precision. Gu et al. [
19] improved the Faster R-CNN and applied it to ship detection. After the first fully connected layer of the regional generation network, a dropout layer was added to improve the detection rate, and the accuracy rate reached 90.4%. Wu [
20] filtered a large number of invalid regions through a candidate region optimization network, and the average detection time of the improved algorithm is 7ms less than that of Faster R-CNN algorithm.
Although the improved deep learning algorithm improves the detection speed of ship target detection, it loses the accuracy. In this paper, the image-based ship detection technology in video surveillance is studied. Faster R-CNN watercraft detection algorithm based on narrowing idea is proposed to improve the detection accuracy of Faster R-CNN algorithm and shorten the detection time of the algorithm.
3. Methodology
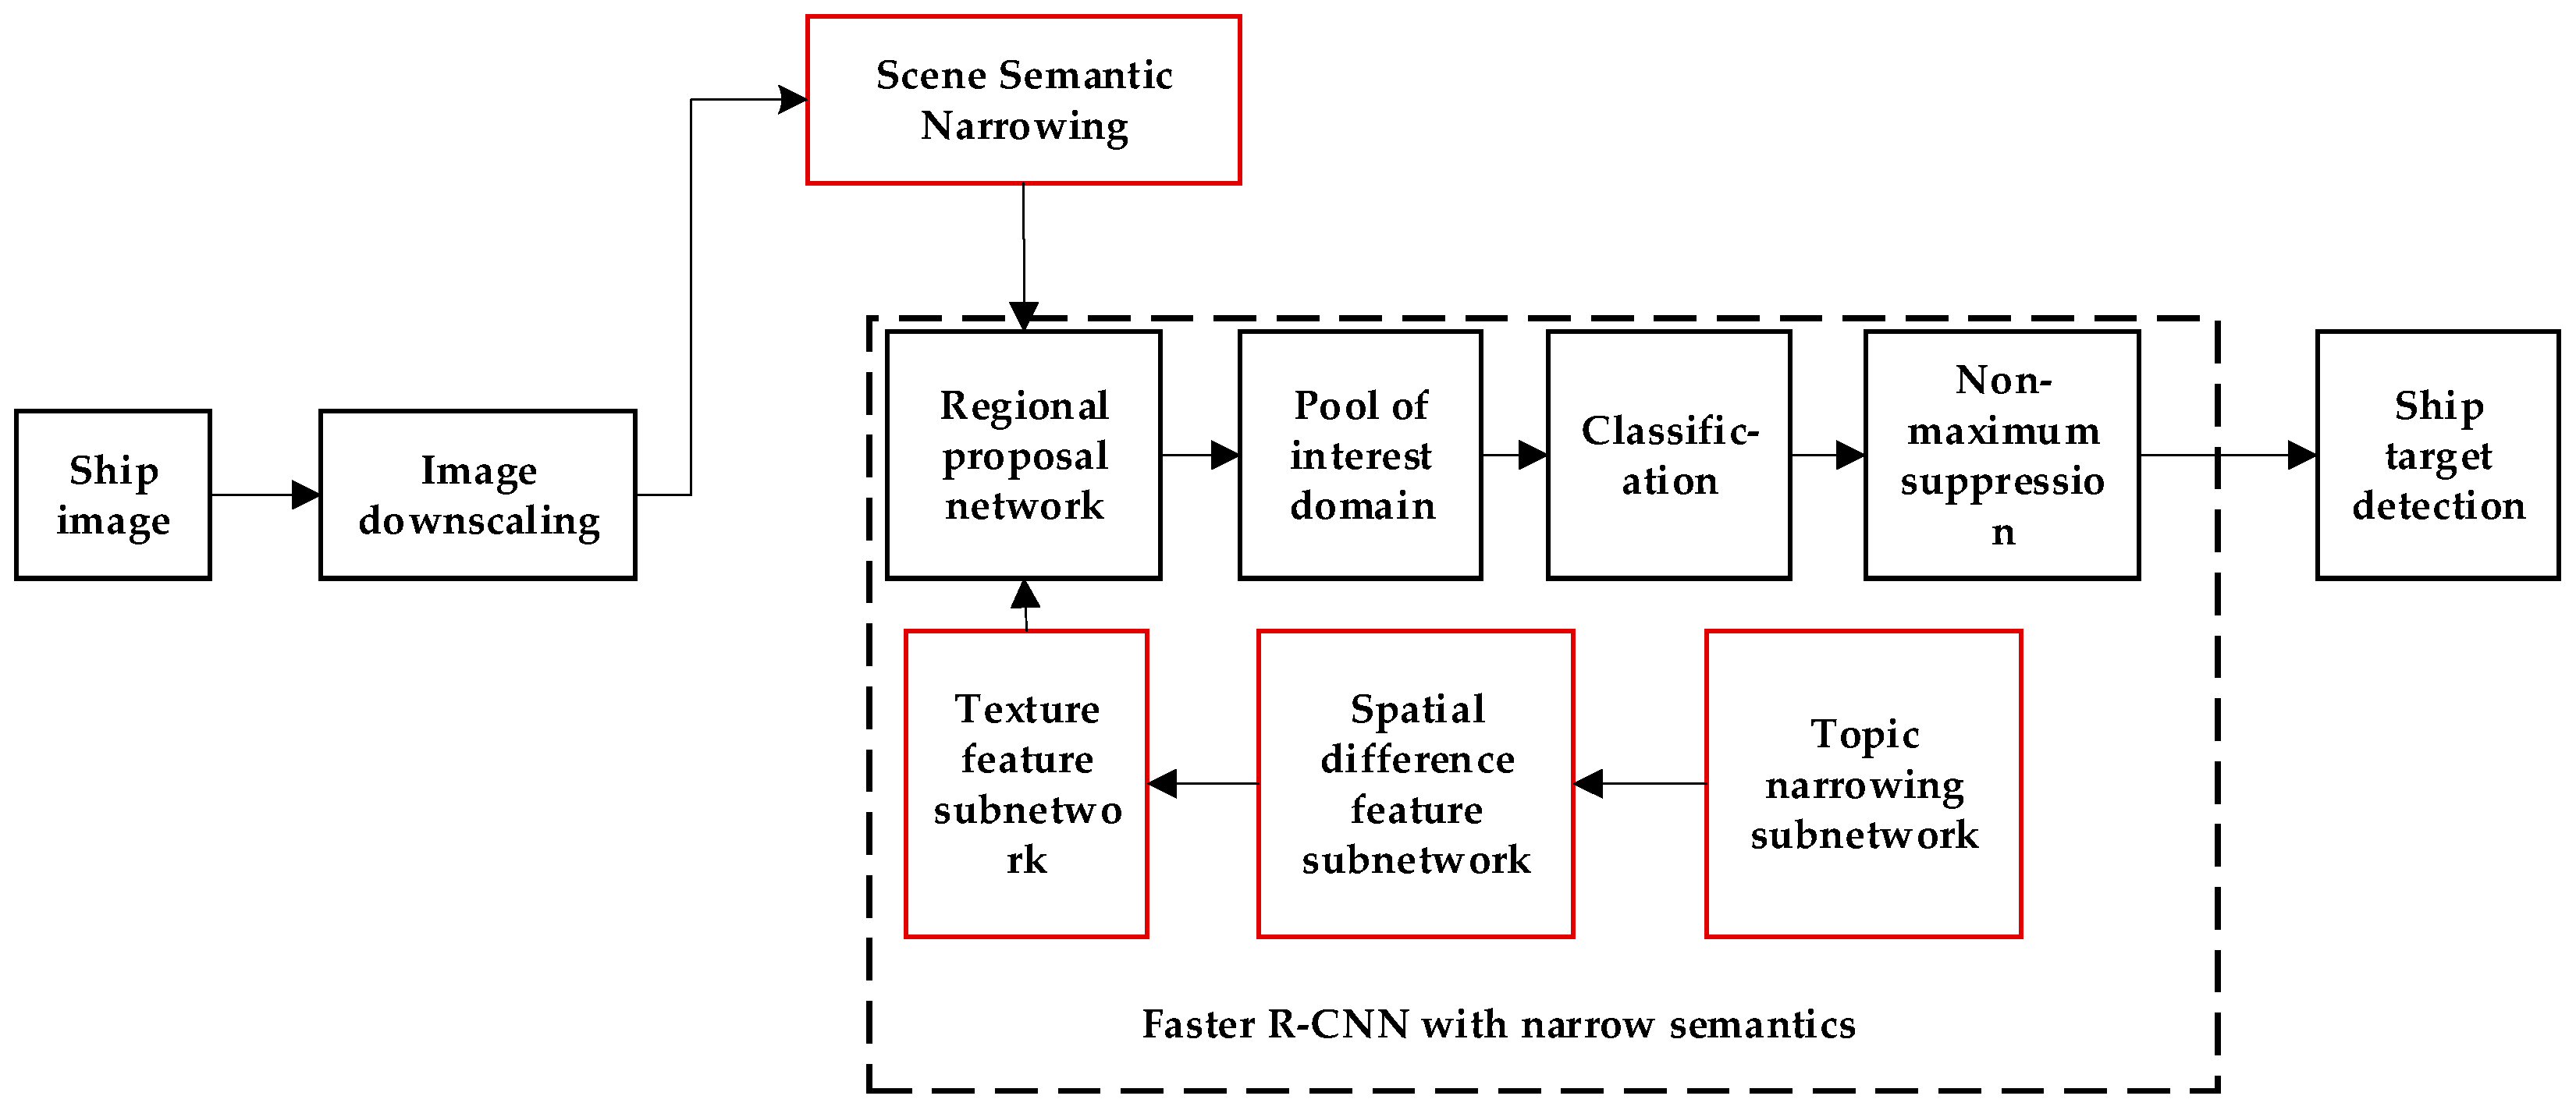
The method in this paper is shown in
Figure 2. The non-red part of the dashed box is the basic structure of the basic Faster R-CNN, and the red part is the improved part of this article. The length and width of the ship image are initially down-scaled in accordance with the definition of the image pixel pyramid and the local correlation between image pixels. Then, the narrowing method is used to establish the ship image characteristics based on the common sense and prior knowledge. The semantic relationship between the reasonable scene and the ship is a hierarchical narrowing network composed of the target area positioning network, ship area generation network and the Faster R-CNN convolutional neural network. It should be indicated that the target area positioning network mainly displays the area, where the ship appears in the image.
In order to separate the target from the background area, the method of narrowing the theme is utilized to summarize the main factors that affect the understanding of image content. Human visual cognition experience and computer vision are applied to detect ship texture features and spatial difference features. The sub-network is a collaborative deep network with clear functions in the overall black box and subnet. During training the network, the narrowed subnet is trained in advance and parameters of the narrowed subnet are solidified or only fine-tuned during the overall convolutional network training. Based on the black box training and according to the relevance of the experience theme and the task, the theme narrowing subnet is added to enhance the description ability of the overall network, thereby realizing a more detailed image description under limited resource conditions.
In the present study, it is intended to improve the detection rate and accuracy of the Faster R-CNN scheme. Therefore, different methods are utilized in the regards. It should be indicated that selected methods are related to each other from different aspects.
3.1. Image Downscaling
Since each image contains huge number of data pixels, analyzing it is a difficult and time-consuming process. In order to reduce the time of image analysis and processing, this paper uses the method of image downscaling. The images before and after downscaling differ in scale, but the key details of the images are approximately equal. The image is downscaled by the length and width of the image. However, downscaling the image decreases the image quality, distorts the image and blurs it so that the image cannot be scaled down arbitrarily. The image downscaling process is performed in accordance with the definition of the image pixel pyramid (the pyramid of an image is a collection of images whose resolution is gradually reduced in a pyramid shape) and the local correlation between the pixel points of the image. The original image prior to the downscaling process is referred to as the Y-image, while the obtained image after the downscaling process is referred to as the Z-image. During the downscaling process, the pixel data in even columns and rows of the Y-image are retained in the Z-image, while that of odd columns and rows of the Y-image are removed. Although the images before and after the downscaling have different dimensions, the key pixel information of the front and back image features have similarities due to the local correlation between pixels. Moreover, part of the noise pixel information will be removed after downscaling [
21].
In order to avoid the details of the original image being lost during downscaling, only the pixel information of even rows and even columns of the original image are saved. Equation (1) shows the pixel correlation between the original Y-image and the downsized Z-image, wherein each pixel of the coordinates in the original Y-image generates a pixel of the coordinates in the Z-image and N represents a natural number set [
22].
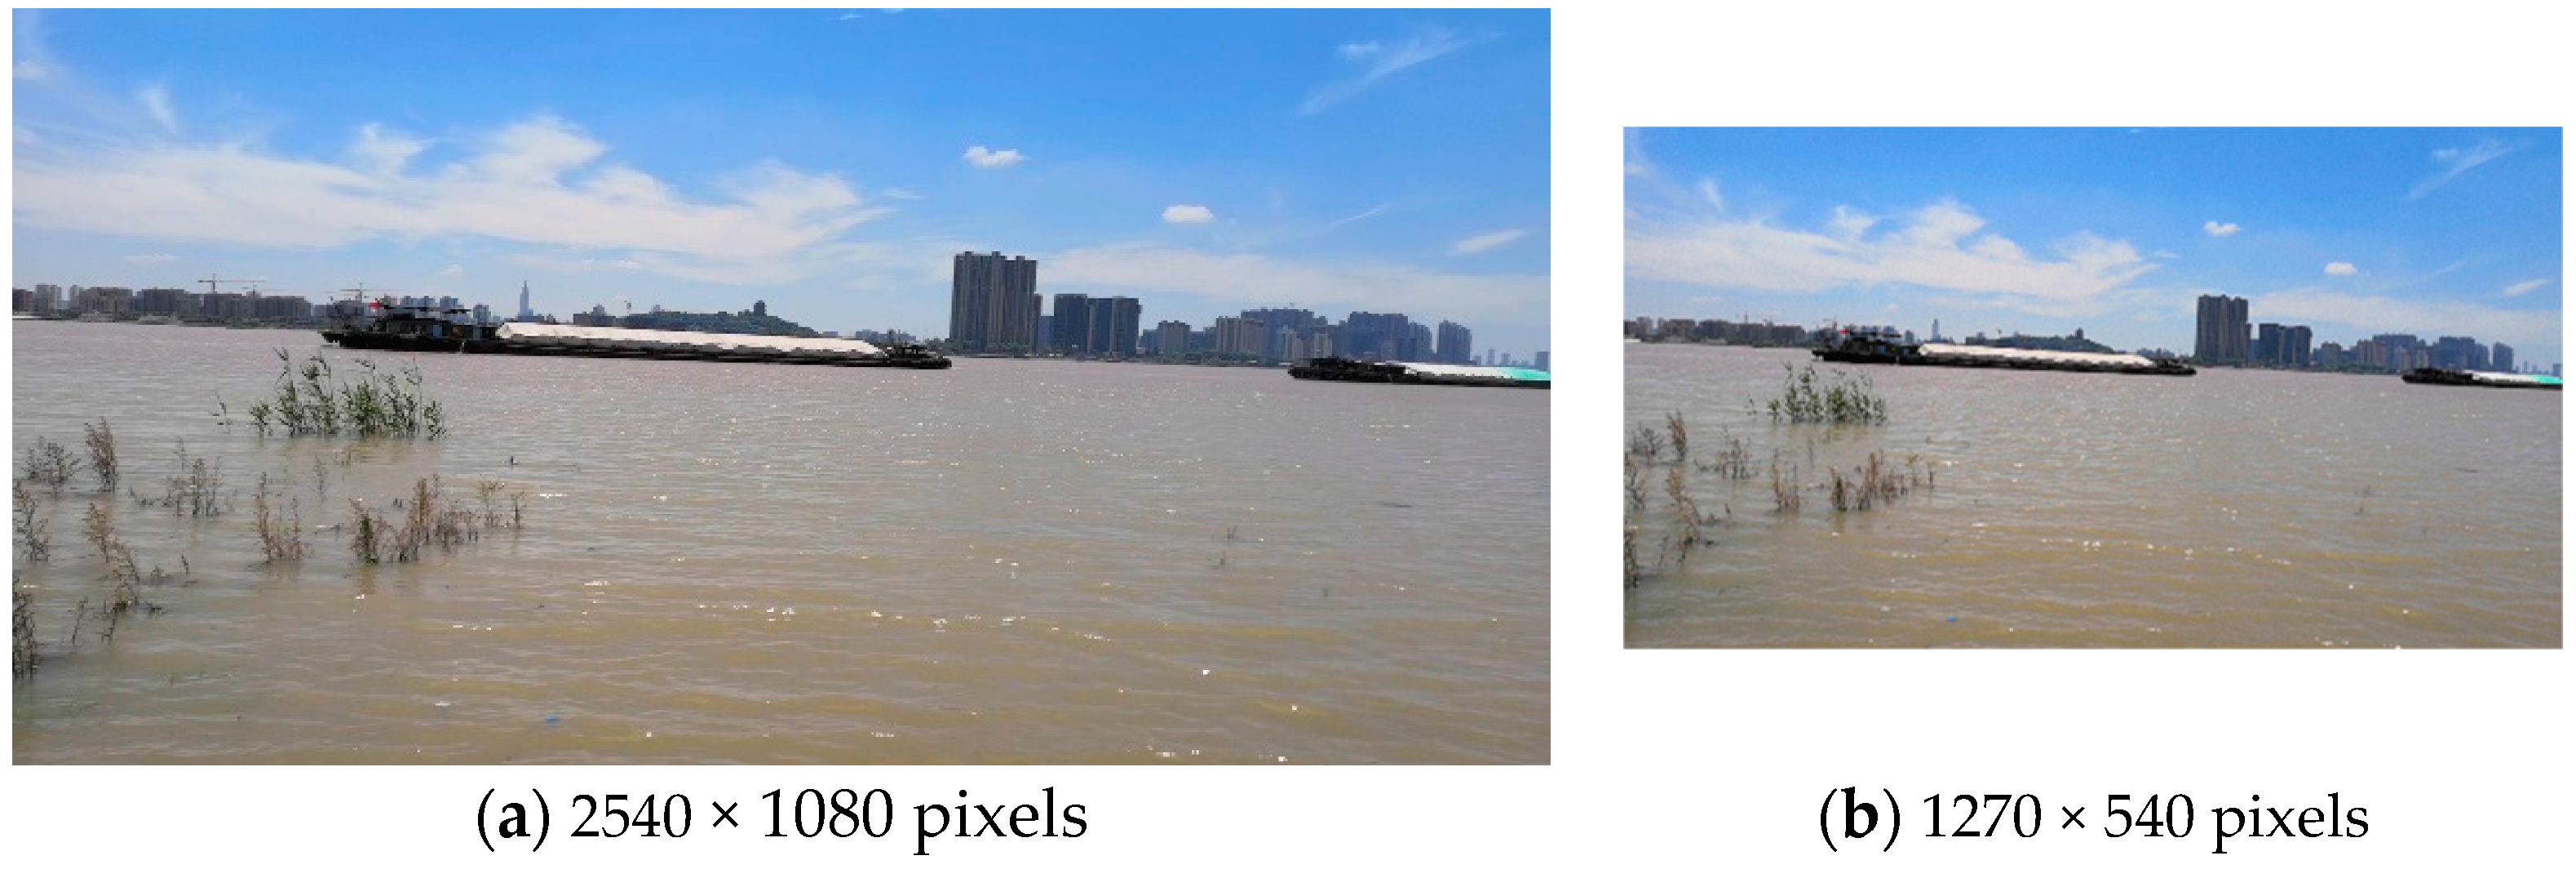
Figure 3 illustrates a comparison between the original the downsized image.
Figure 3a indicates that the length and width of the Y-image are 2540 and 1080 pixels, respectively. Moreover,
Figure 3b shows that the image size after downscaling reduces to 1270 × 540 pixels. In other words, the size of the graph b is 1/4 of that of the graph a. Although downscaling can reduce the noise problem to some extent, it adversely affects the image feature information more or less. It should be indicated that since the test image is large and the relative detail loss is negligible, the downscaling impact on the image quality is ignored. Since the image size is reduced, the number of pixels of the subsequent processing is greatly reduced so that the detection speed of the target image increases.
3.2. Scene Semantic Narrowing
Aiming at certain types of regions and certain geographical locations in the image, it is the focus of attention and a more detailed interpretation can be realized by performing appropriate analysis. For example, aircraft inspection missions are usually carried out in airport type areas. Furthermore, ship inspections are usually performed in three types of areas: ports, docks and high seas. On the other hand, optimized training can be performed for different areas and classification tasks. Considering existing historical images, monitoring tasks in the same geographical area, such as monitoring of a naval formation, can achieve highly accurate target detection, classification and change detection in the region [
23].
The narrowing of scene semantics is mainly based on the characteristics of the task and image, the common sense and prior knowledge about the task and establishment of a reasonable correlation between the scene and the semantics of the target [
24]. The role of scene and semantic narrowing are:
- (1)
Achieving rapid localization from large images to local areas, containing mission targets.
- (2)
Implementing semantic analysis from global to local and achieving target and scene classification that mutually support the semantic correlation.
- (3)
Forming the scene-target correlation in the image to facilitate the analysis and understanding of the image.
In the present study, the video image detection of the ship is considered as an example. It should be indicated that the ship image has a large amount of data, while the ship target occupies small number of pixels in the original image. However, most of the pixel data is not necessary for target detection. Therefore, a detection method is adopted in the present study to reduce the target pixel area from the original image.
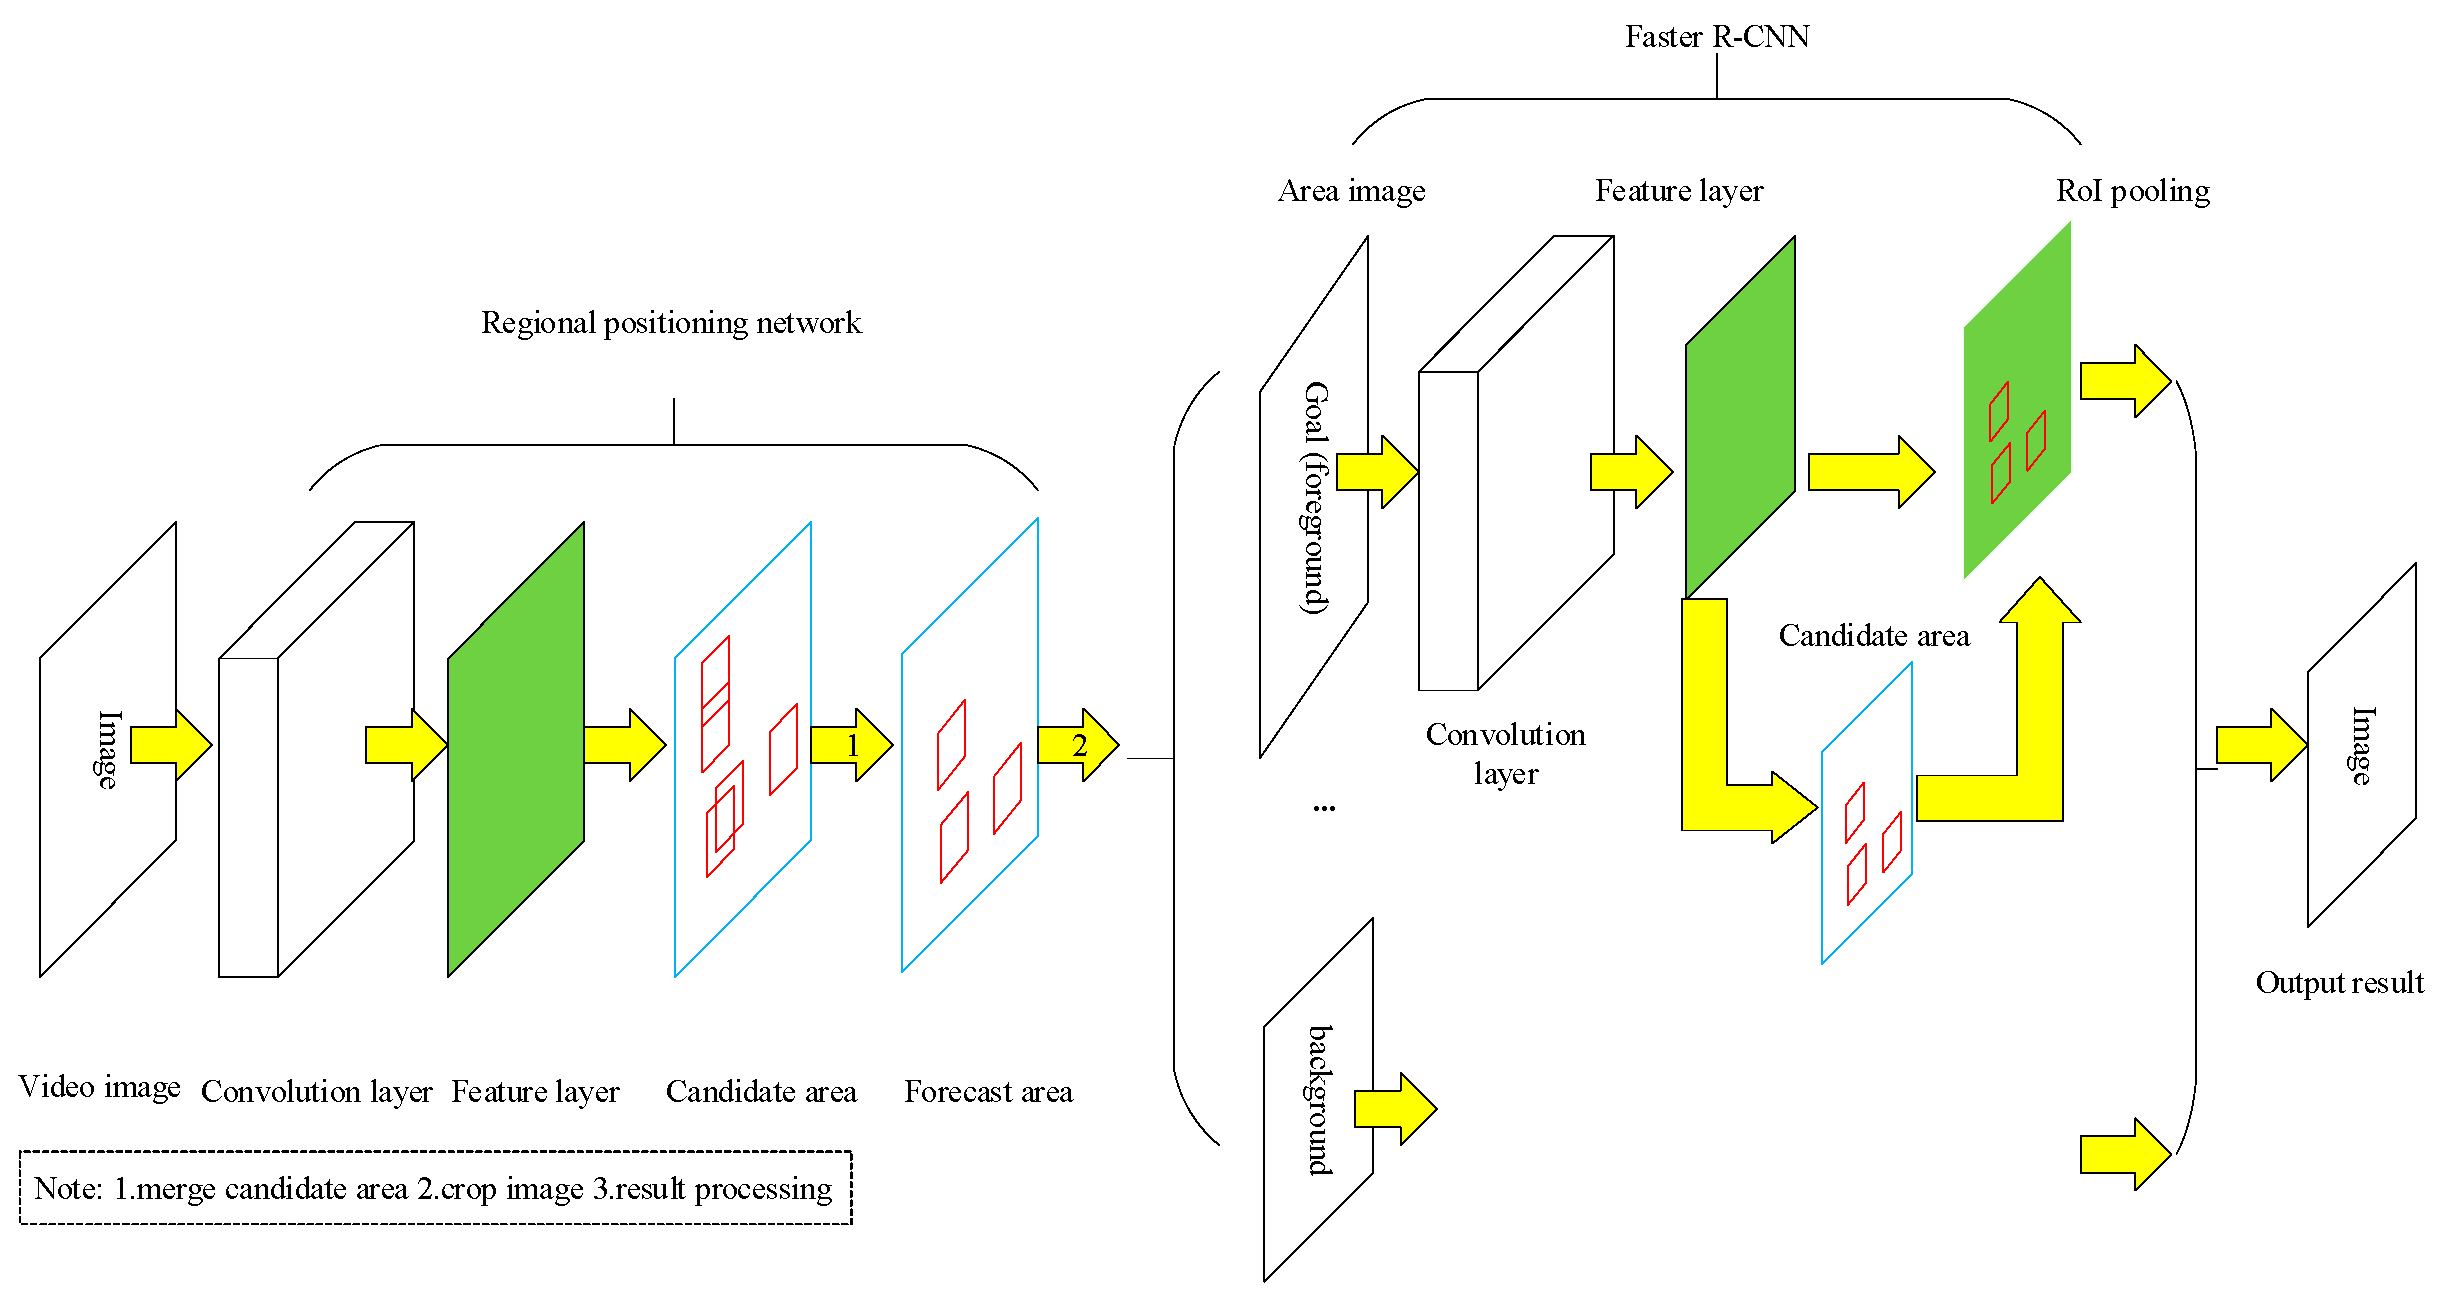
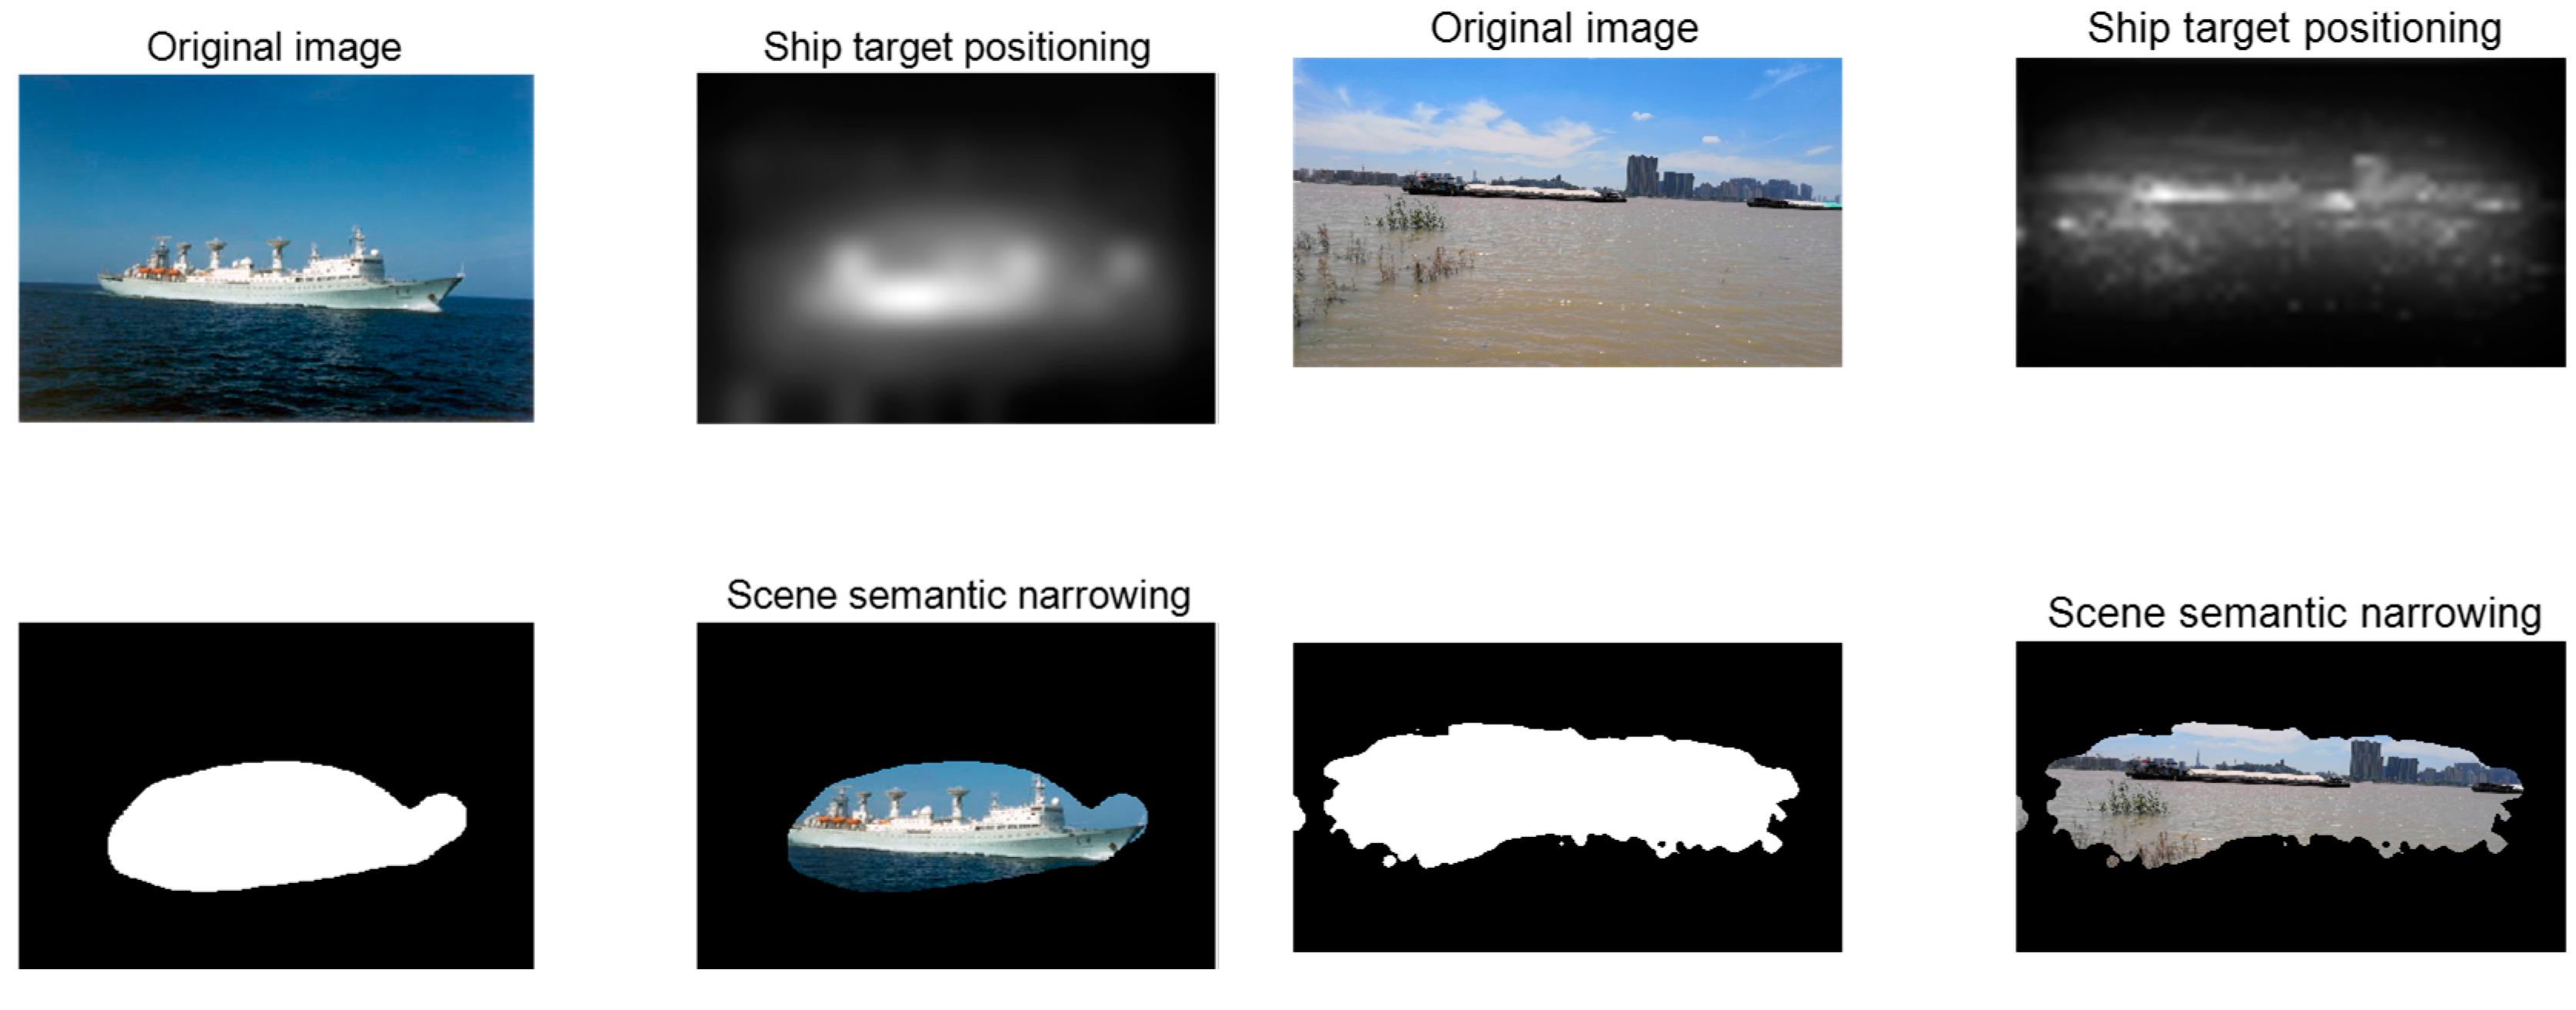
Figure 4 indicates that this method uses a target area positioning network, a target area generation network and a hierarchical narrowing network composed of the Faster R-CNN convolutional neural network. The target area positioning network mainly separates the area, where the ship appears in the remote sensing image, from the background area. When the background is removed from the original image, the Faster R-CNN convolutional neural network detects and classifies the target from the ship target area. The semantic algorithm is applied to locate the target and determine whether the detected target is a ship or not. The hierarchical narrowing scheme has remarkable advantages over the conventional schemes, including lower computational expenses and lower target detection search scales.
Figure 5 is a result of narrowing the target scene of the ship. By scene semantic narrowing method, it directly locates the ship area and reduces most of the background area, thus, reducing the search scale of ship target detection.
3.3. Topic Narrowing Subnetwork
Considering long distance of image shooting and the influence of optical path propagation medium, each single pixel contains high range of features so that mixed elements are a challenge [
25]. However, an image often contains too much unnecessary information. To realize the expression of all information, it is necessary to use a more complex network than the existing deep learning network architecture. On the other hand, the network size that computers can handle is limited. Different methods have been proposed to improve the description ability of the deep network for images with limited computing resources. A widely adopted solution is to split the image or down sample, which will inevitably result in loss of information. In order to achieve a more detailed expression of images in limited conditions, a deep convolutional network with the narrowing function of the subject is proposed. Moreover, the main factors affecting the understanding of the image content are investigated [
26]. The human visual cognitive experience and the computer vision research are utilized in this regards.
Based on the task, an appropriate theme is selected as a narrow sub-network to realize the collaborative deep network with clear functions of the overall black box and subnet [
27]. During the network training, the narrowed subnet is initially trained and parameters of the narrowed subnet are solidified or only fine-tuned during the overall convolutional network training. Based on the black box training and according to the relevance of the experience theme and the task, the theme narrowing subnet is added to enhance the description ability of the overall network, thereby realizing more detailed image description in limited resource conditions. The topics here mainly include imaging factors and visual characteristics. At present, there is similar research on the narrowing of the theme, mainly focusing on object-oriented topics, such as R-CNN, Fast R-CNN, YOLO and other target detection algorithms. Based on the advantages of the existing methods, the present study will carry out a more in-depth research on narrowing the deep network structure framework of various topics [
28].
The outline of the training steps of the deep convolutional network Faster R-CNN with the theme narrowing function is as follows:
- (1)
The meaning of the intermediate feature layer is initially defined in the topic-oriented deep network image feature learning so that the advanced semantic image is initially oriented. Then, features narrowing learning is performed to generate neural networks sensitive to different advanced image features, including texture, lighting, imaging, atmospheric, topographic and other features. Each feature is a manifold dimension of the image that describes a unique component with minimal information redundancy between them.
- (2)
During the theme network training, the solidified topic narrowing subnet part is initialized according to the obtained training result from the aforementioned step. Moreover, the main network of the task is initialized in accordance with the random initialization or pre-training network. It should be indicated that the task labeling database is used for the training and only the theme part is trained at this stage. Then, parameters, including the fully connected parameters of the cured topic network, are optimized without updating other parameters of the solidified topic subnet.
- (3)
In order to update the topic narrowing subnet, the annotation data of each topic is used and each subnet is separately fine-tuned by alternate iteration. When the subnet tuning training is completed, the overall network is fine-tuned to obtain the final optimized network parameters [
29,
30].
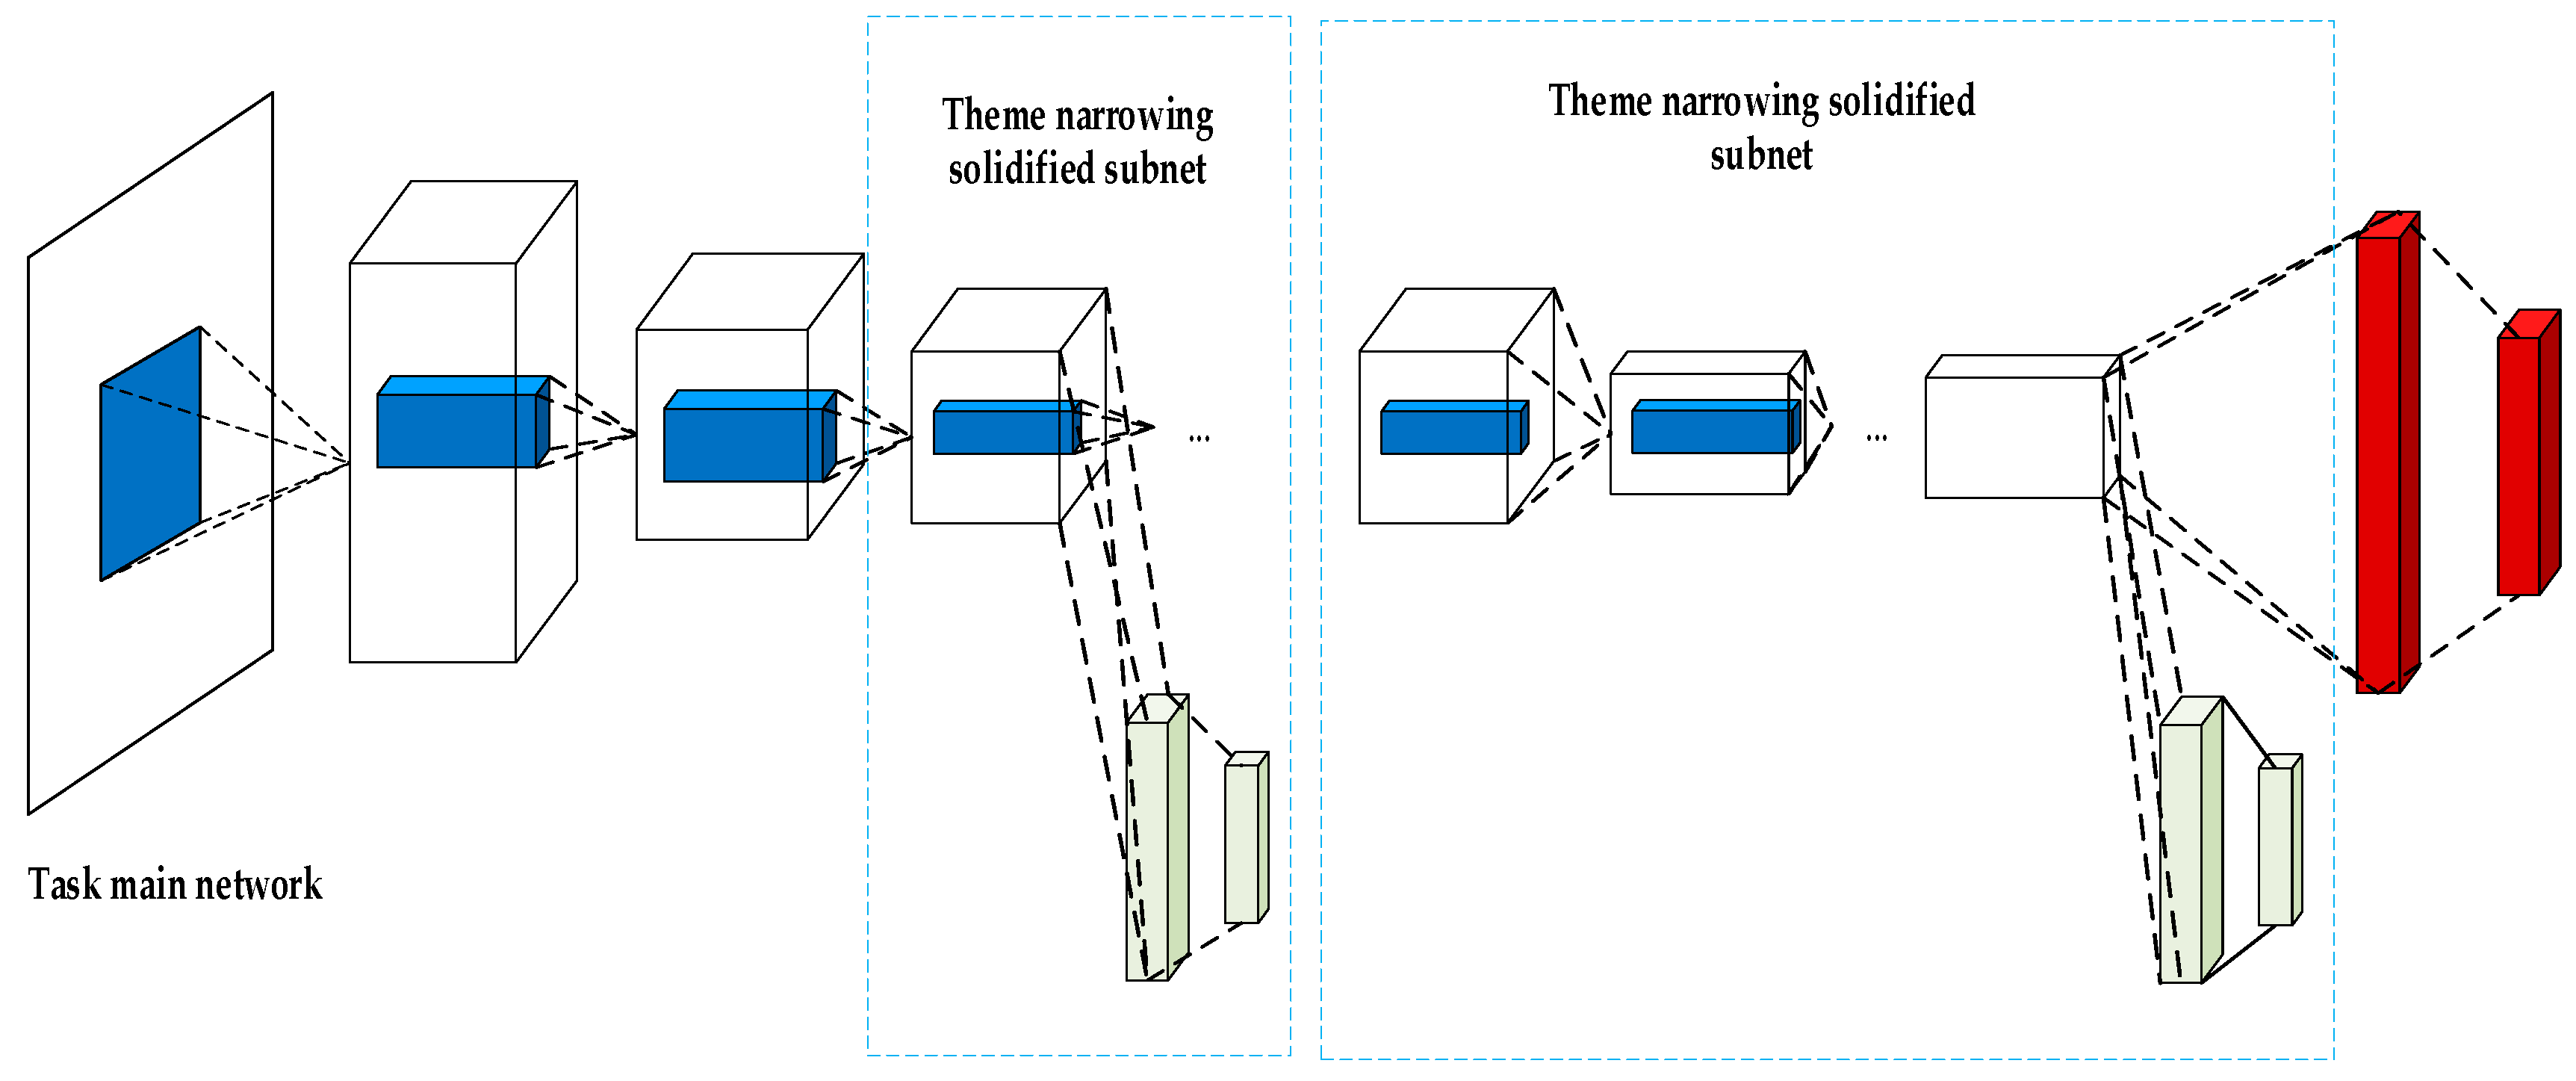
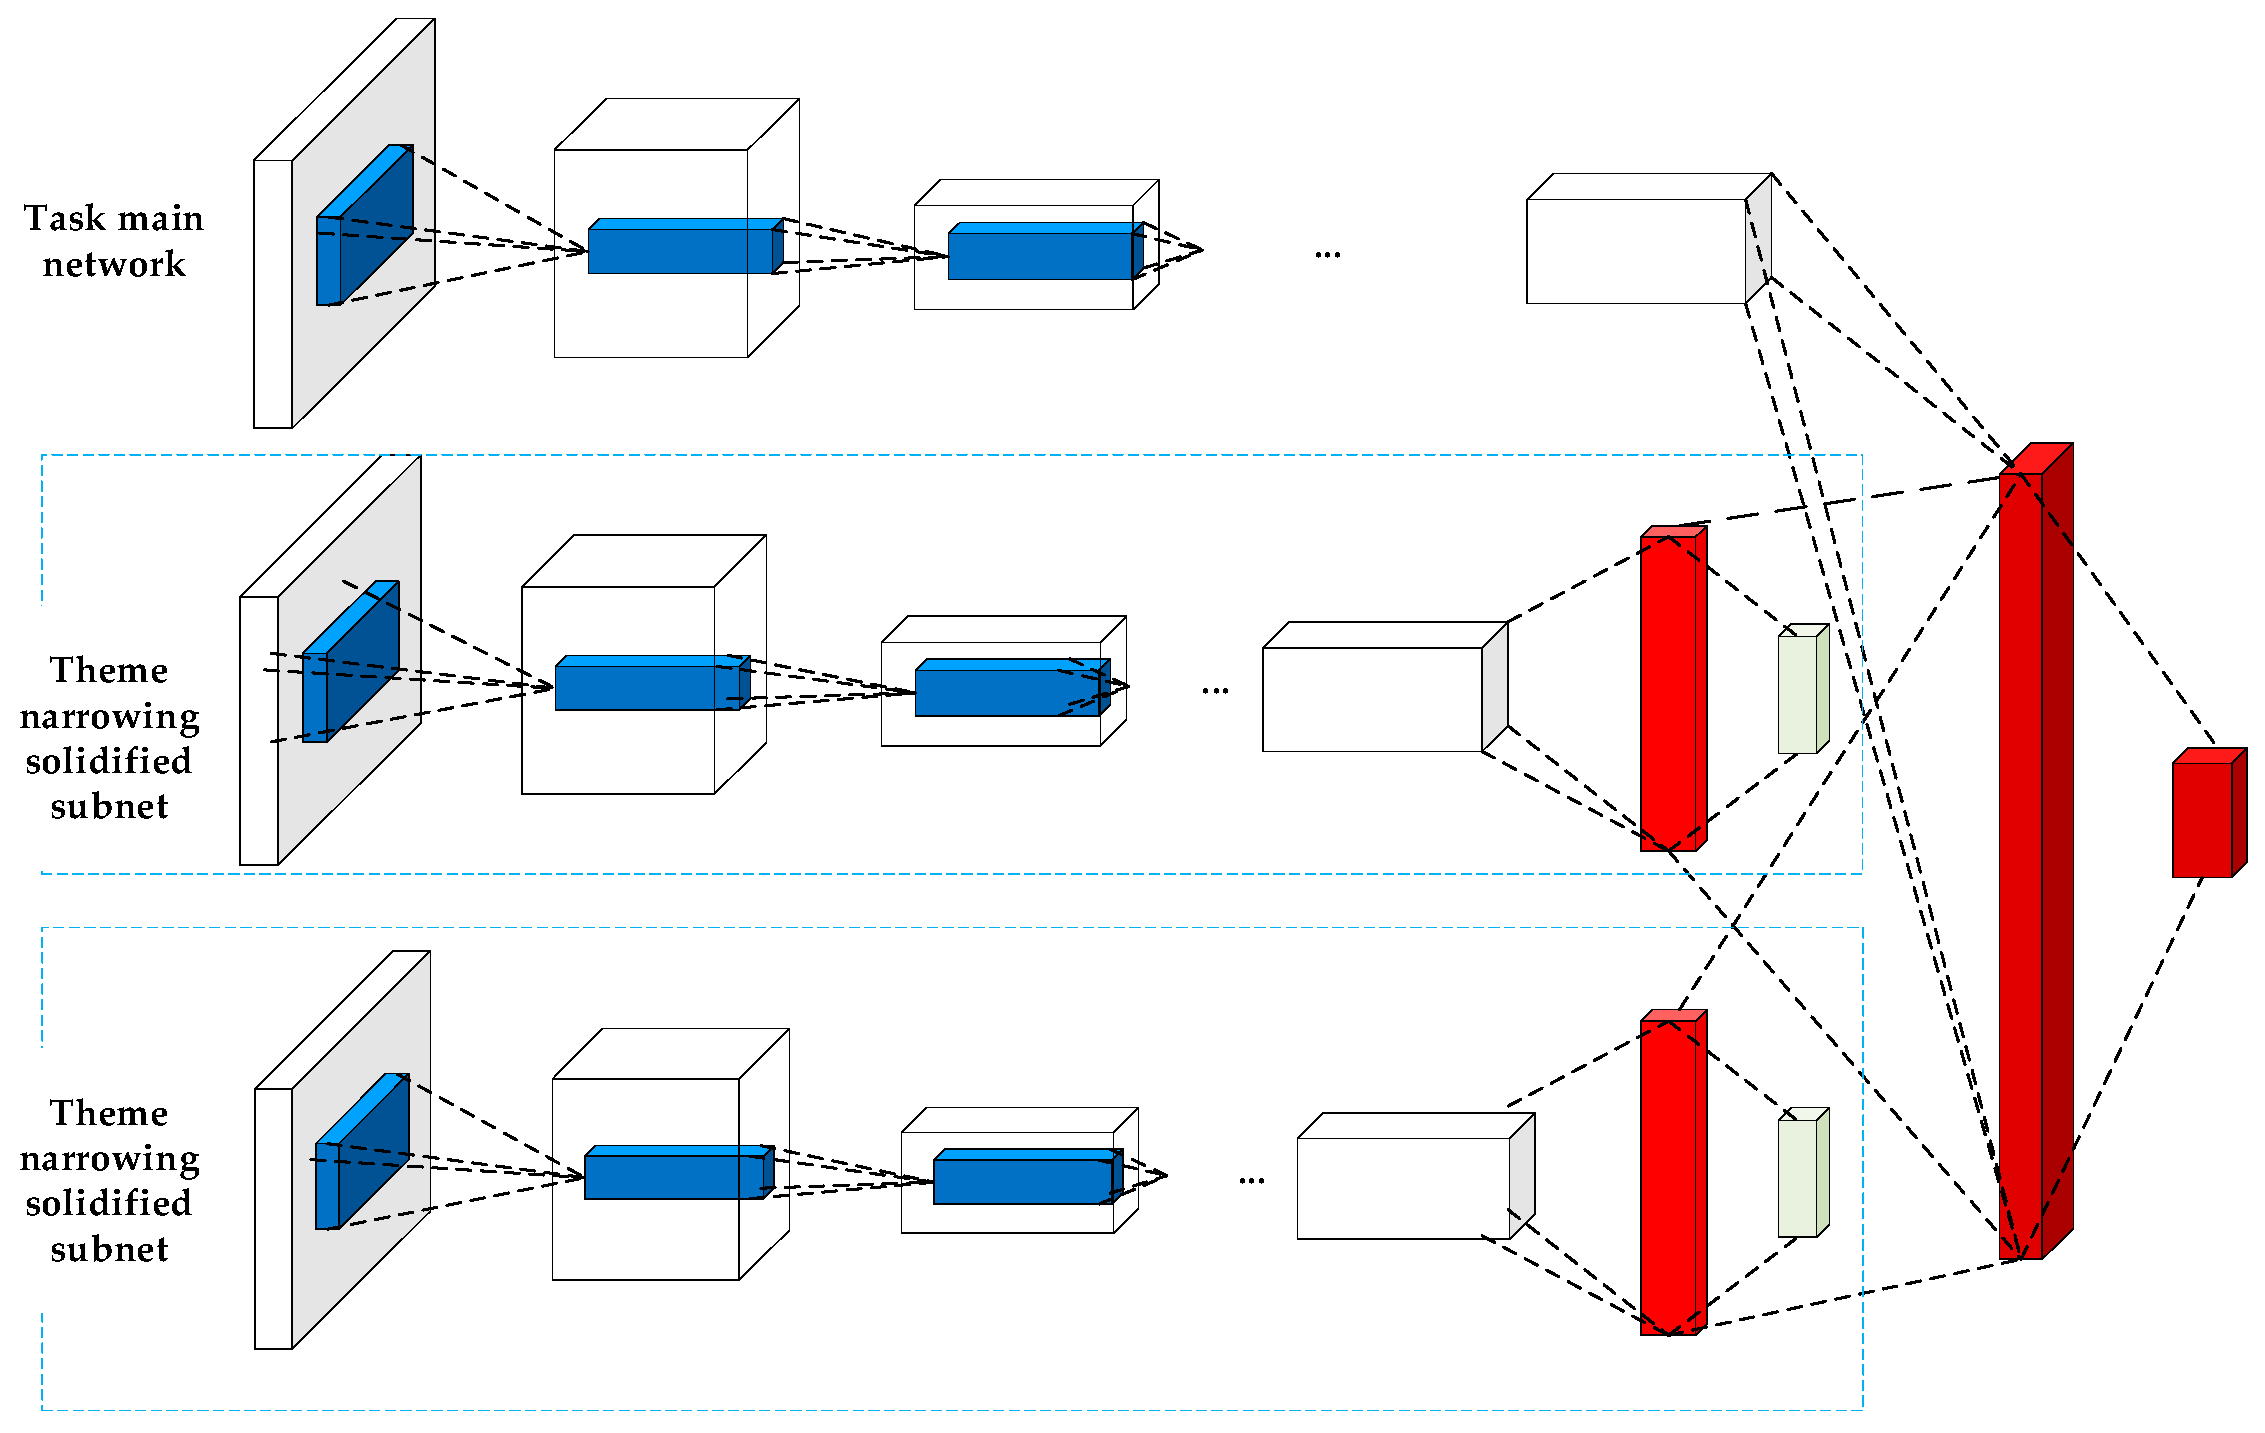
Two collaborative ways have been introduced thus far in the convolutional neural network: the serial collaboration and the parallel cooperation.
Figure 6 schematically shows the diagram of the serial cooperation and indicates that there is a specific causal correlation between the narrowing of the two themes. Furthermore,
Figure 6 indicates that there is a large difference between the scales. On the other hand,
Figure 7 schematically illustrates the diagram of the parallel cooperation. It indicates that when the task does not require two-subject causal correlation, most of the topic collaboration will use parallel collaboration. Studies showed that the parallel cooperation has faster performance compared with the serial cooperation. It should be indicated that different narrowing themes and two collaborative ways can be included in a deep network. The parallel cooperation is used in the present study and the main network and the subnet are simultaneously collaborated in parallel. Furthermore, texture features and spatial difference features are incorporated into the topic framework as subnetworks [
31,
32].
3.3.1. Characteristic Components of Ship Images
A. Texture Features Components of Ship Images
Texture features are important features of ship images and are constant in terms of noise, rotation and illumination parameters. In this section, the narrowing algorithm is added to the RPN network. The texture feature is an indicator to show the performance of the method. The texture analysis can deepen the fusion training of the feature image. Combined with the narrowing of the scene and theme, the convolutional neural network algorithm is accelerated. The texture features studied in this section are indicated by DWT (Discrete Wavelet Transform) in local binary mode [
33].
DWT is widely used in the field of digital imaging since it provides spatial and frequency information for digital images. In the present study, the 2-D Wavelet (Daubechies (db)) is utilized in the MATLAB toolbox, which mainly includes scale conversion functions
and three wavelet functions, including horizontal
, diagonal and vertical functions
. The scale transformation and the wavelet functions are composed of the product of two one-dimensional functions. It should be indicated that three wavelet functions represent horizontal, diagonal and vertical gray scale variations, respectively. The specific definitions are as the following:
If there is a point on the input size image, the image discrete wavelet transform can be obtained by Equations (4) and (5) as follows:
where
is the initial arbitrary scale ratio, usually chosen to be zero. When the scale ratio is
, the coefficient
is an approximation of
. When the scale ratio
, the coefficient
Added horizontal, diagonal and vertical detail to the ship.
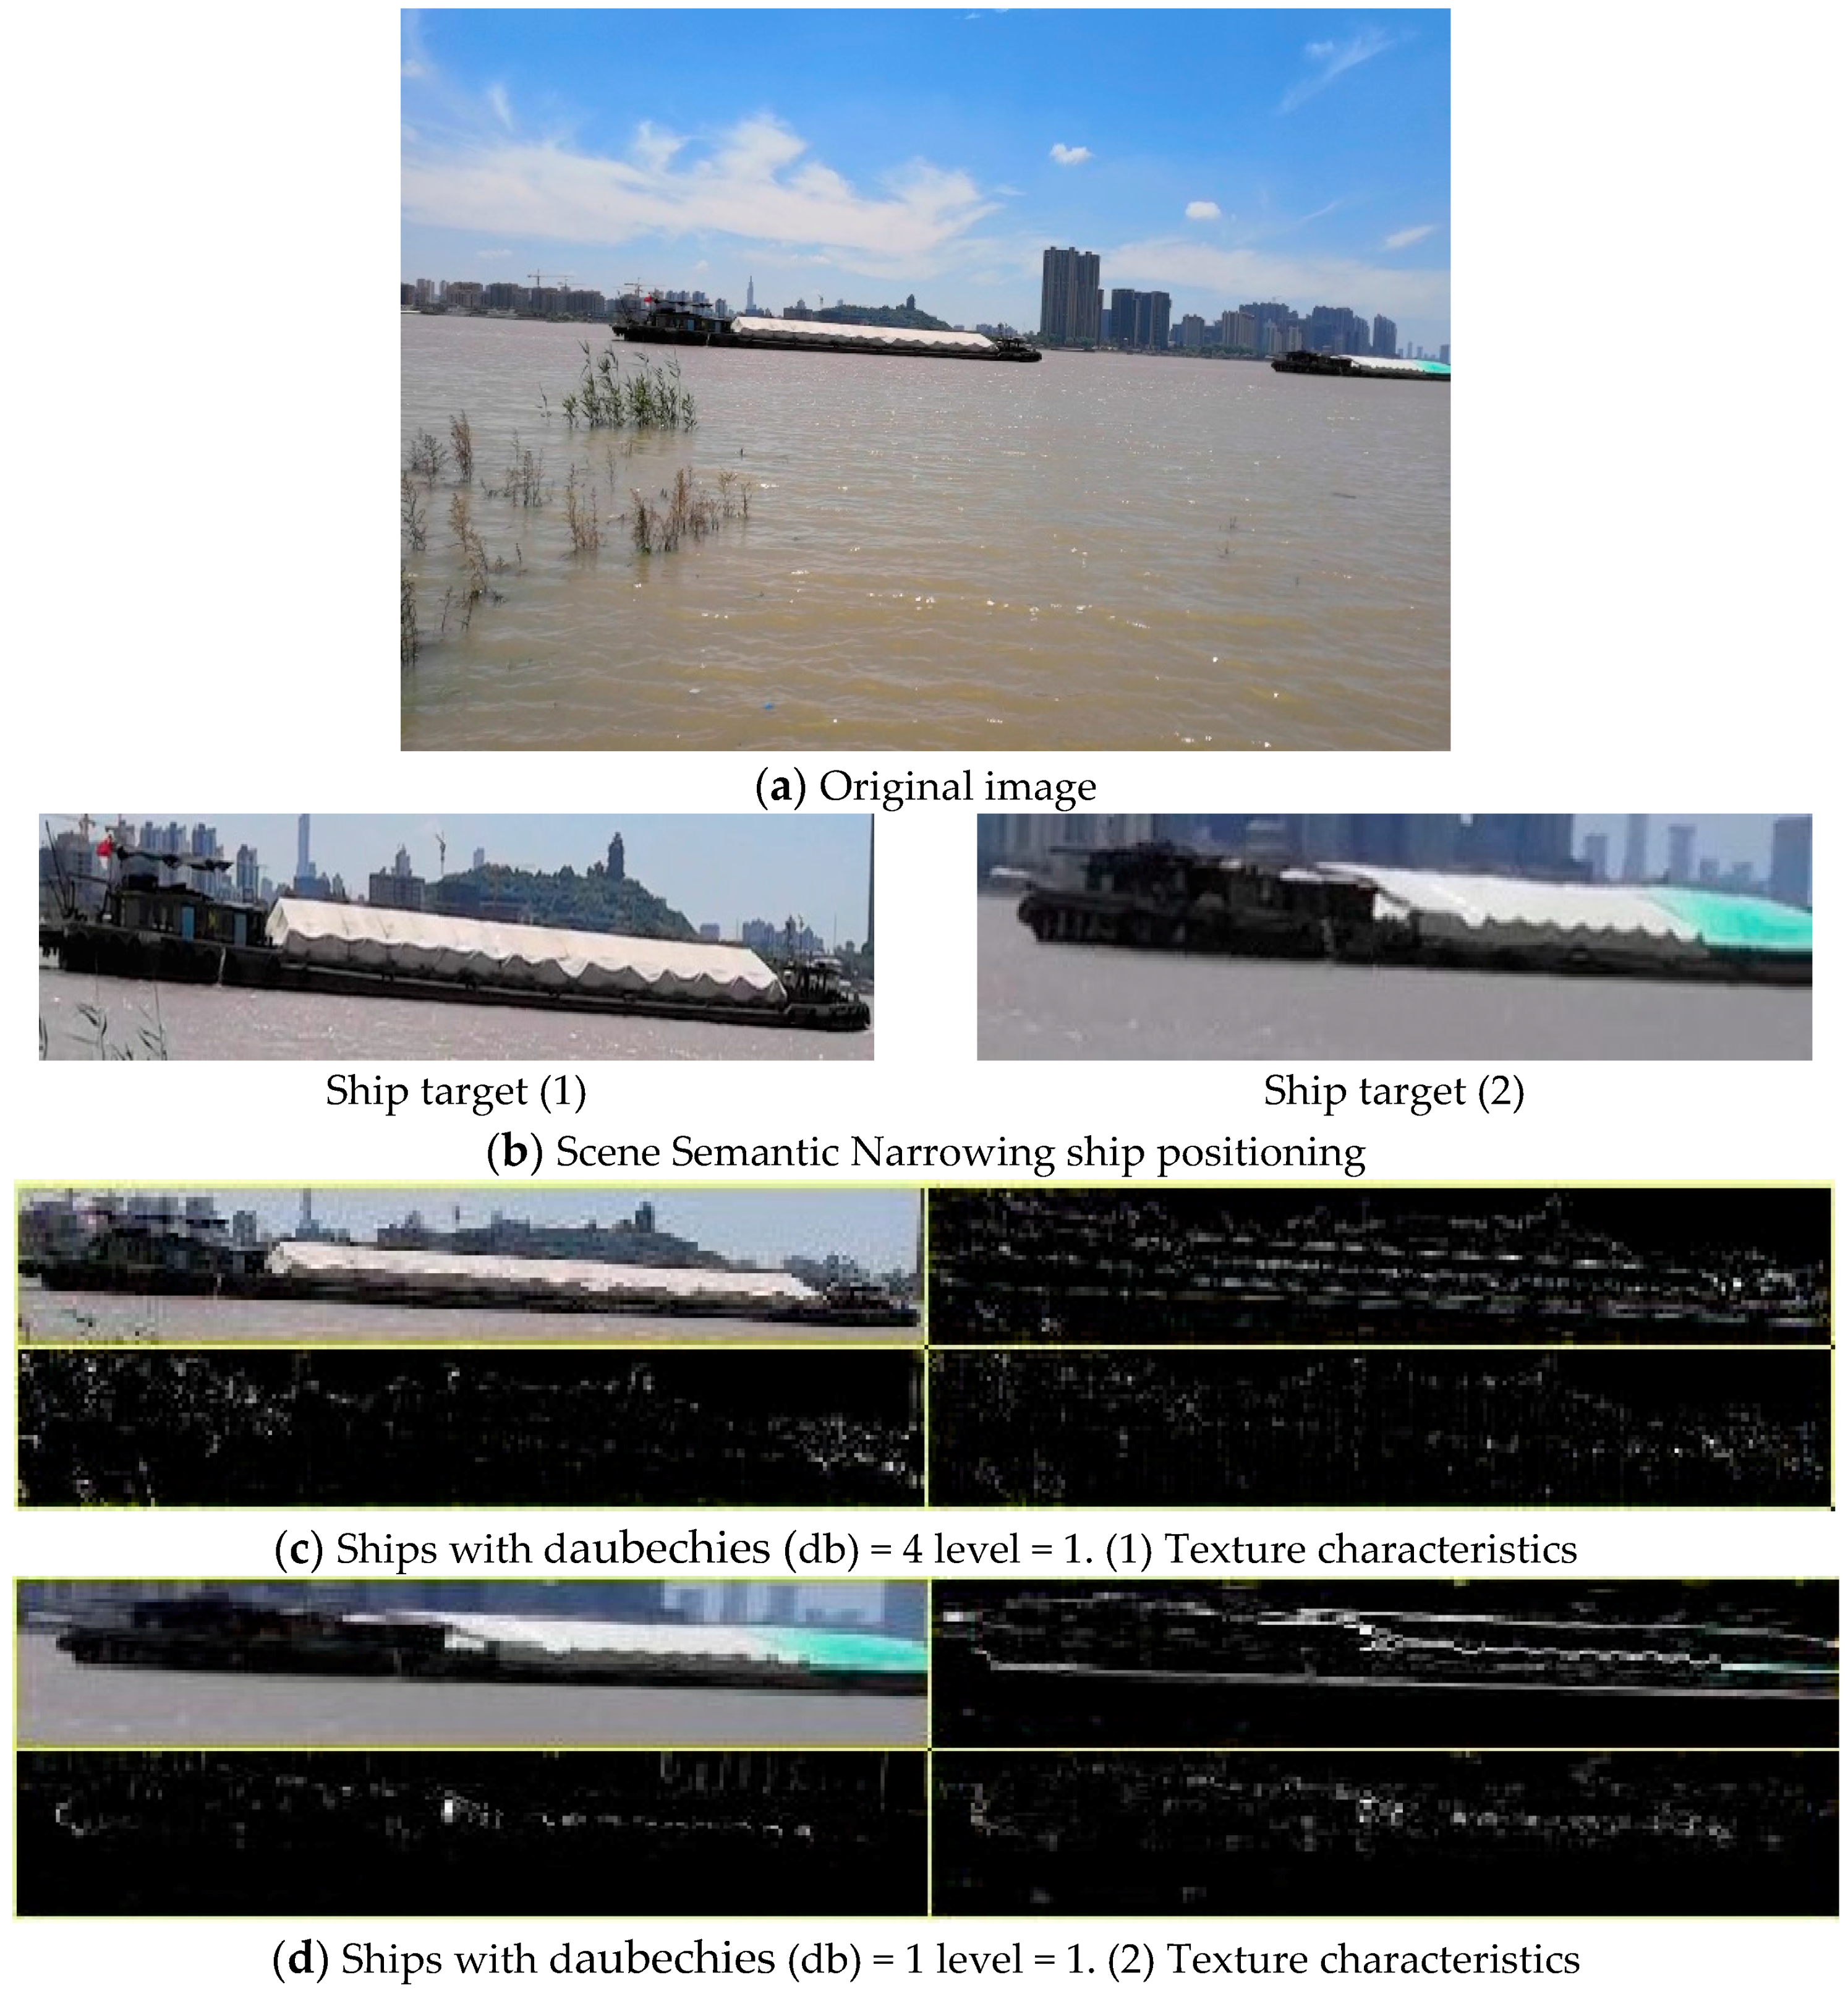
Figure 8 shows the sample video ship image, which is considered in this section to perform the DWT wavelet transform.
Figure 8c,d indicate that the ship has four areas, including the upper left, which is the positioning map of the ship, the upper right, which is the horizontal texture feature map, the lower left, which is the diagonal texture feature map, and the lower right, which is the vertical texture feature map. In the texture feature, the horizontal, diagonal and vertical textures of the ship are clearer than the texture of the non-ship area, so the texture feature can be observed as a unique component of the narrowing process of the subject.
B. Ship Image Spatial Difference Features Component and Coefficient of Variation Component
(1) Spatial difference features
The ship has a unique feature in that it does not maintain a stable color and the area without the ship has a different color even in a small area. In other words, the ship is composed of several different colors in a small area, and this feature is called the spatial difference feature [
34]. Thus far, the analysis of spatial difference features mainly originates from three methods of filter, variance/histogram and spatial wavelet. The spatial difference features used in this section are analyzed based on histograms by processing and analyzing typical color video frames. The standard deviation
of the color component histograms of three different channels obtains the spatial difference characteristics of the ship's target [
35]. Reviewing the literature indicates that the threshold value of the standard deviation of the green component of the histogram
is standard deviation (std) = 55, while if the standard deviation of the green component of the histogram is greater than 55, the foreground target area is the ship and if it is below 55, the background is not detected as ship.
(2) Coefficient of variation
The spatial difference is the process of obtaining the standard deviation and the standard deviation is essentially a variant of variance [
36]. For the standard deviation, in the field of mathematical statistics, the coefficient of variation can express discrete data more reasonably. Therefore, the coefficient of variation (cv) of spatial differences is used as a characteristic parameter of the ship and is used as a unique component of the narrowing process of the subject. The mathematical definition of the coefficient of variation is as follows:
where
and
indicate the variance and the mean value, respectively.
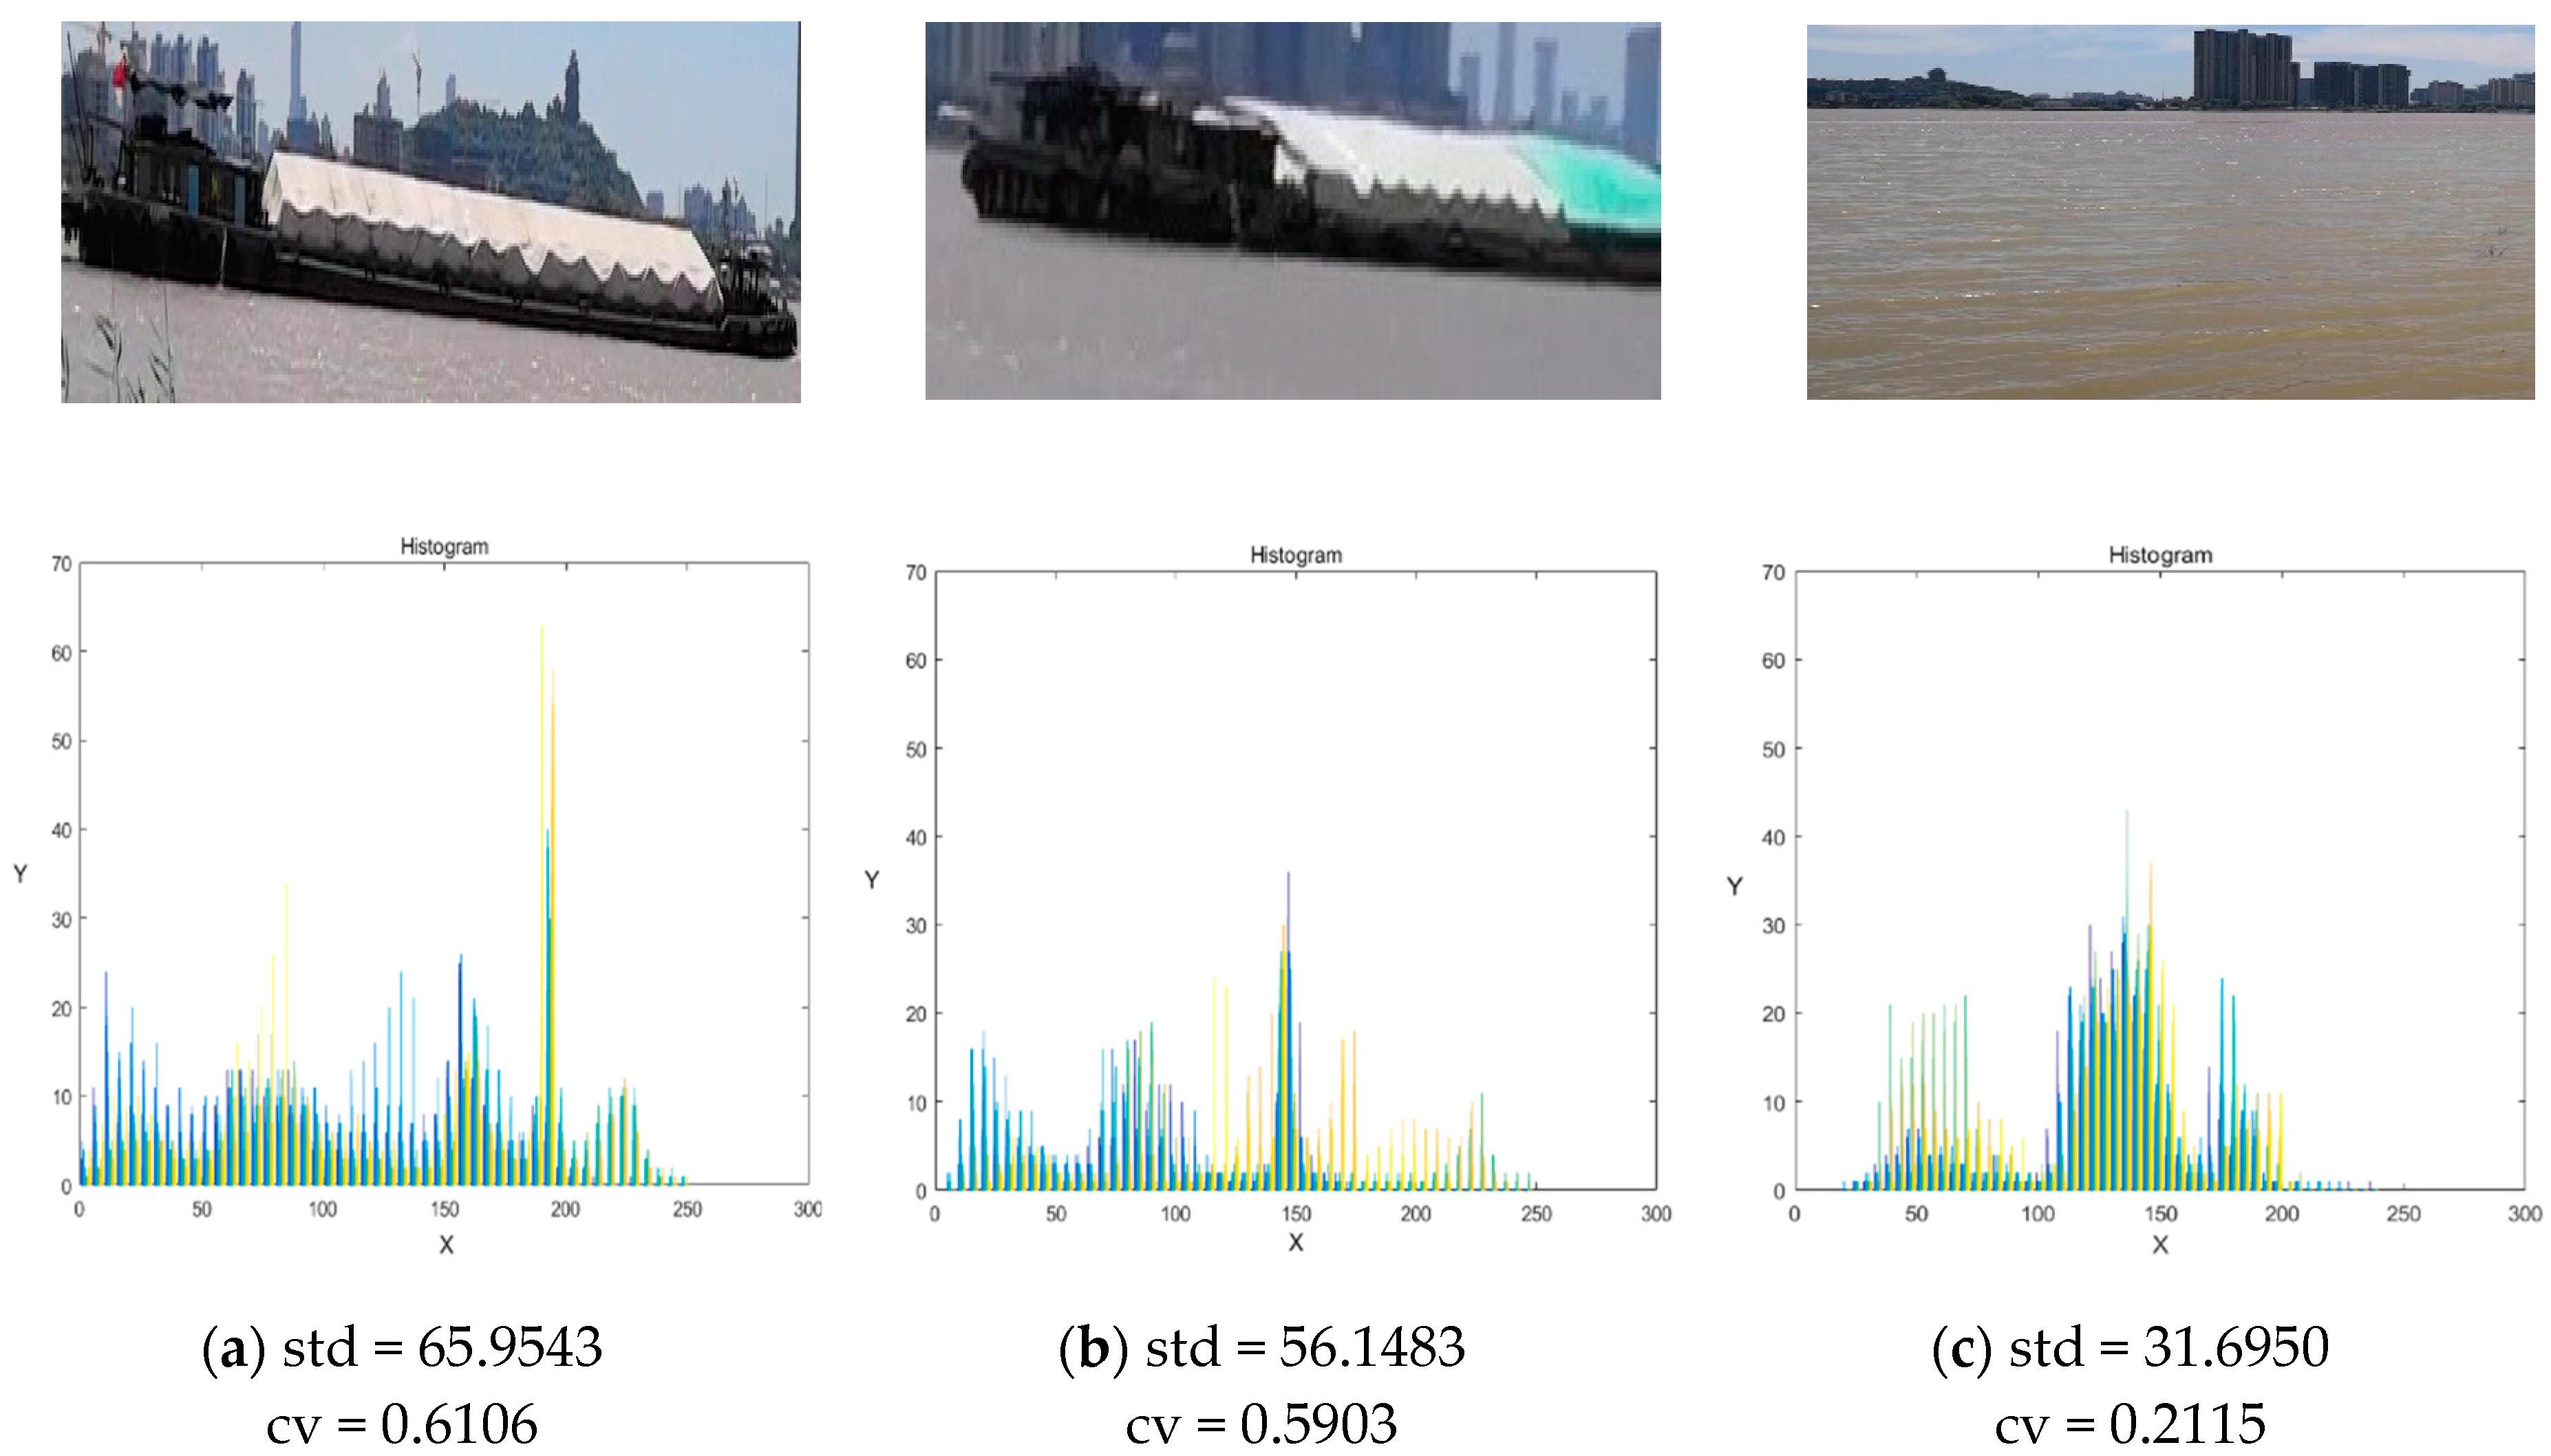
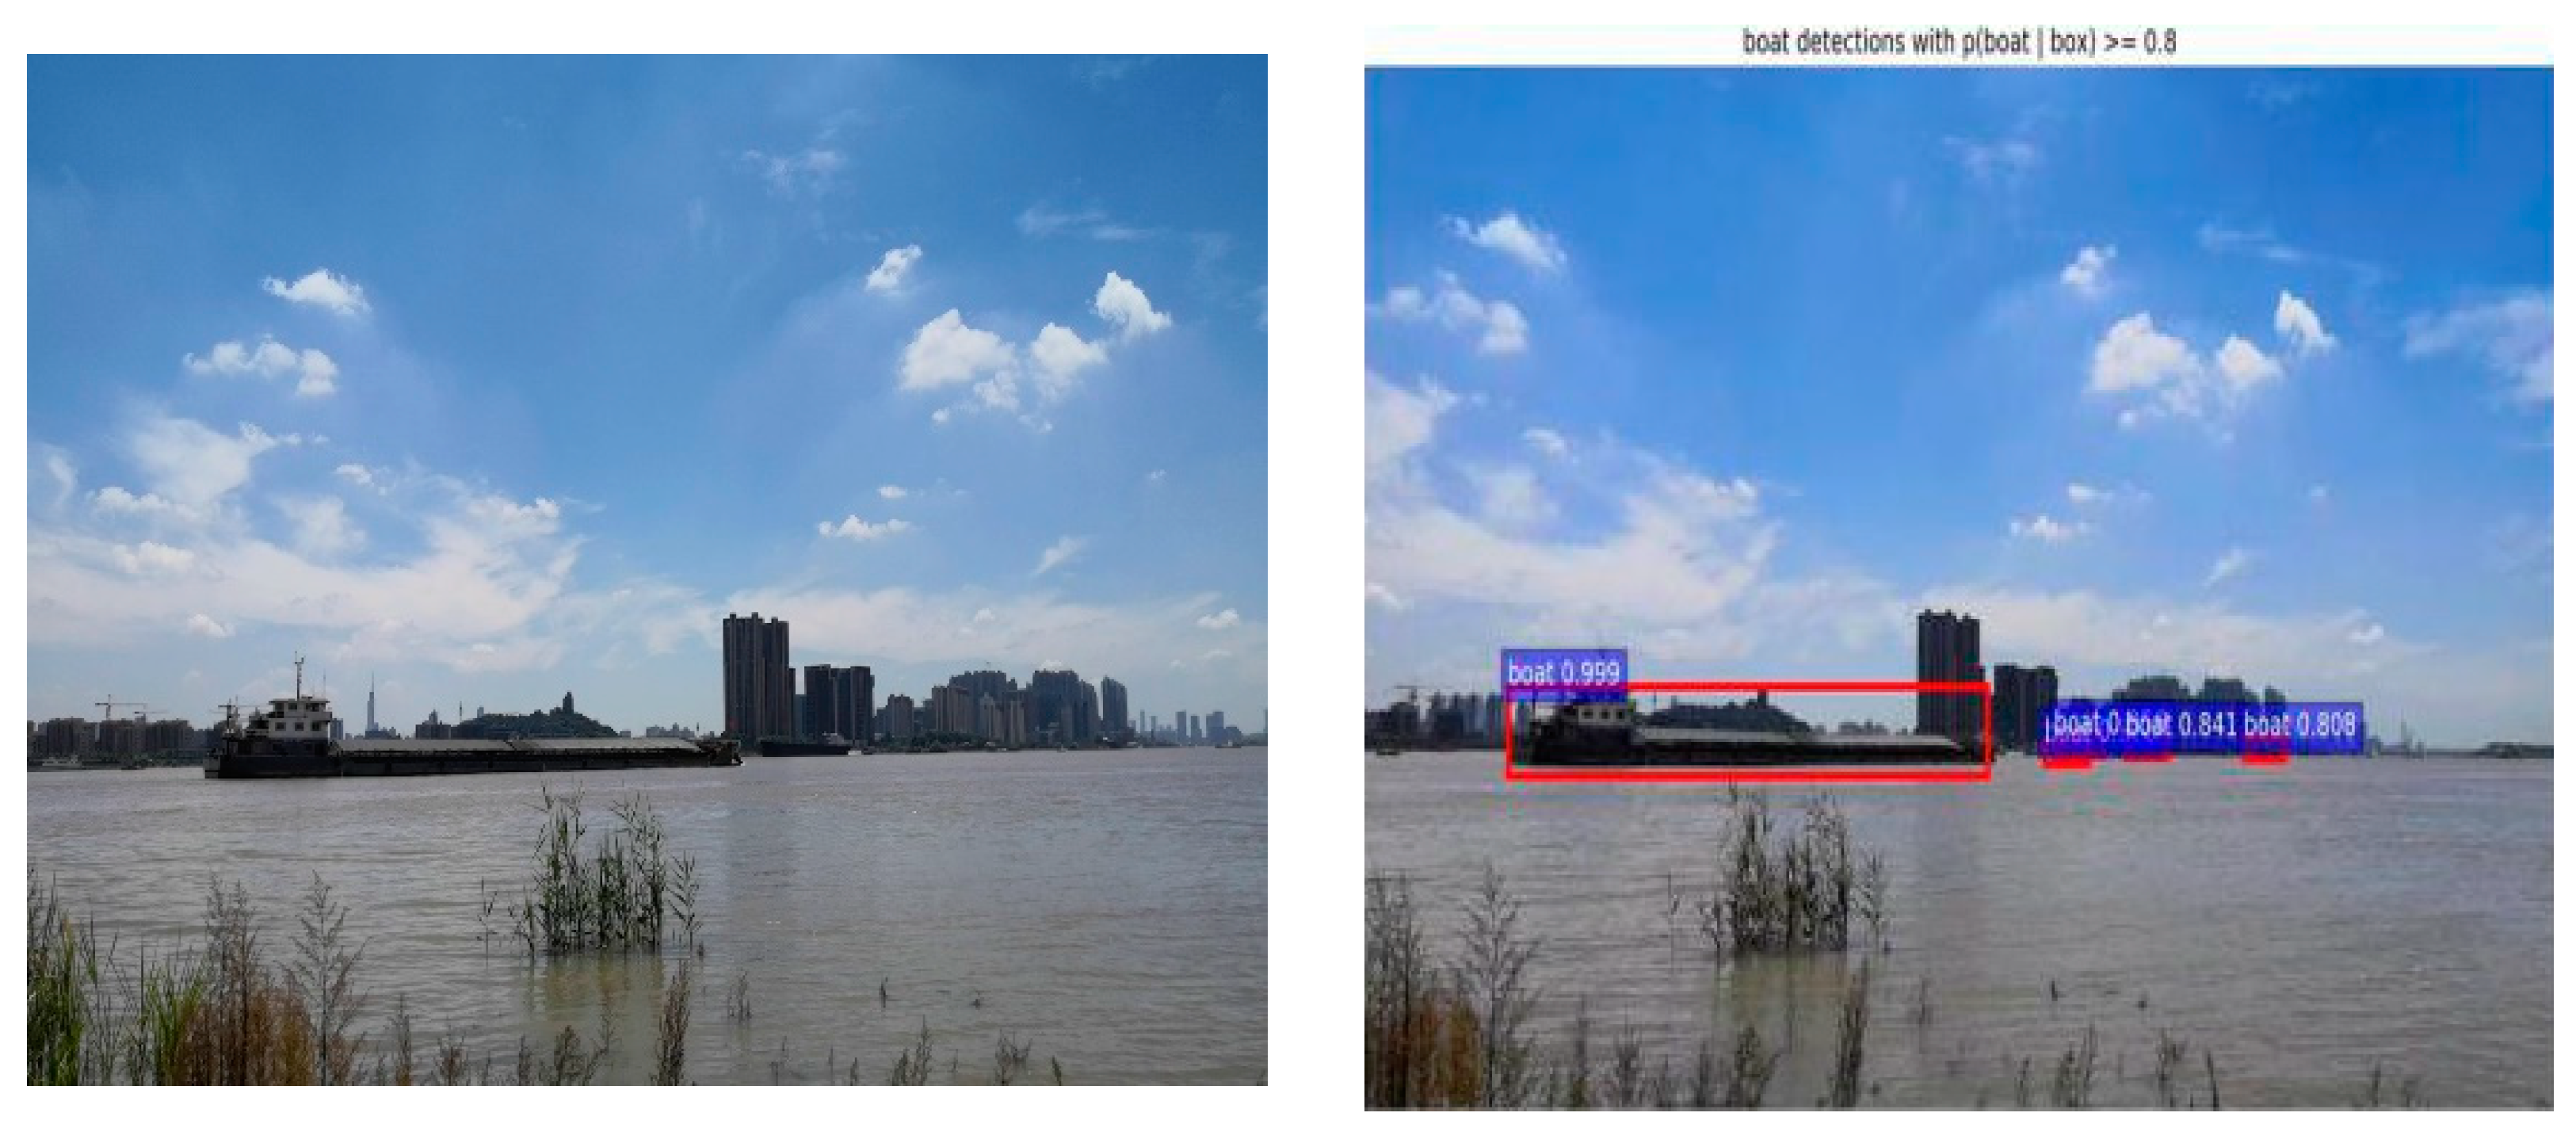
Figure 9 shows an example of a video image.
In
Figure 8a, the original picture is taken as an example. The images in
Figure 9a–c are extracted and the difference characteristics are analyzed separately. The figure shows the std values of (a) and (b) are above 55, while the std value of (c) is less than 55, thus, (a) and (b) are the ship's target and (c) is the background. Therefore, the feature analysis is accurate. In order to better verify the accuracy of the ship's features, this section exemplifies four groups of ship images and extracts the ship area image and the non-ship area image (each ship image has two ship targets and one background), and then analyzes the difference characteristics of images.
Table 1 shows that the standard deviation of the ship area image is greater than 55, and the std value of the background image is lower than 55. Therefore, the spatial difference feature can be better as a unique component to become a subject narrowed subnetwork.
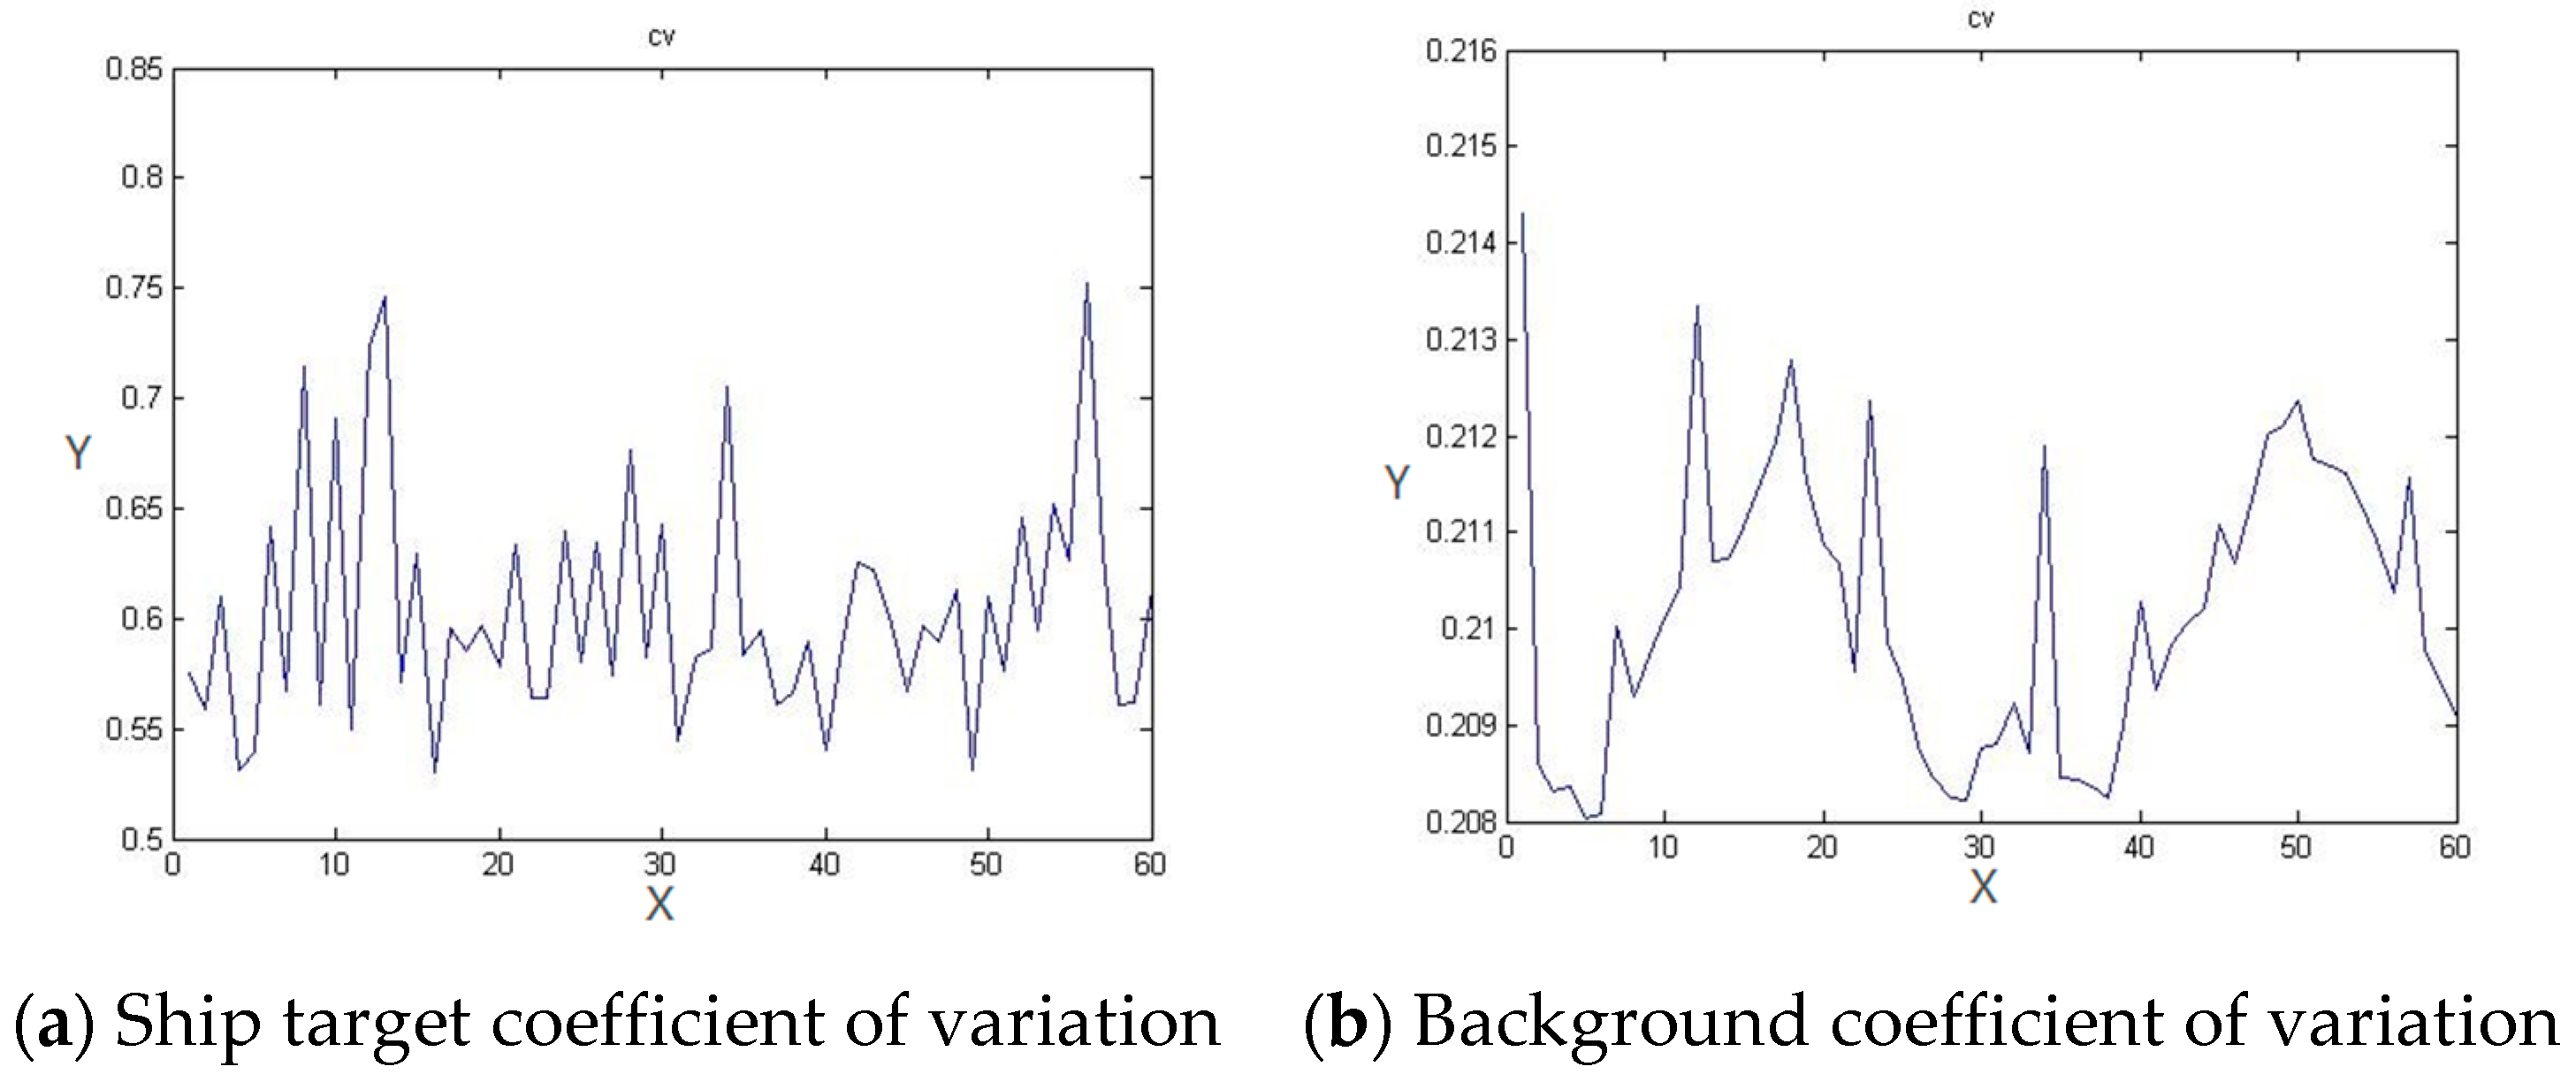
In addition, the comparison of the coefficient of variation in
Figure 10 shows that the coefficient of variation of the target area of the ship and the background area are maintained at 0.6 and 0.21, respectively. Therefore, the coefficient of difference reflects the spatial difference feature and becomes a sub-network with a narrowed theme as a unique component.
4. Training and Experiment
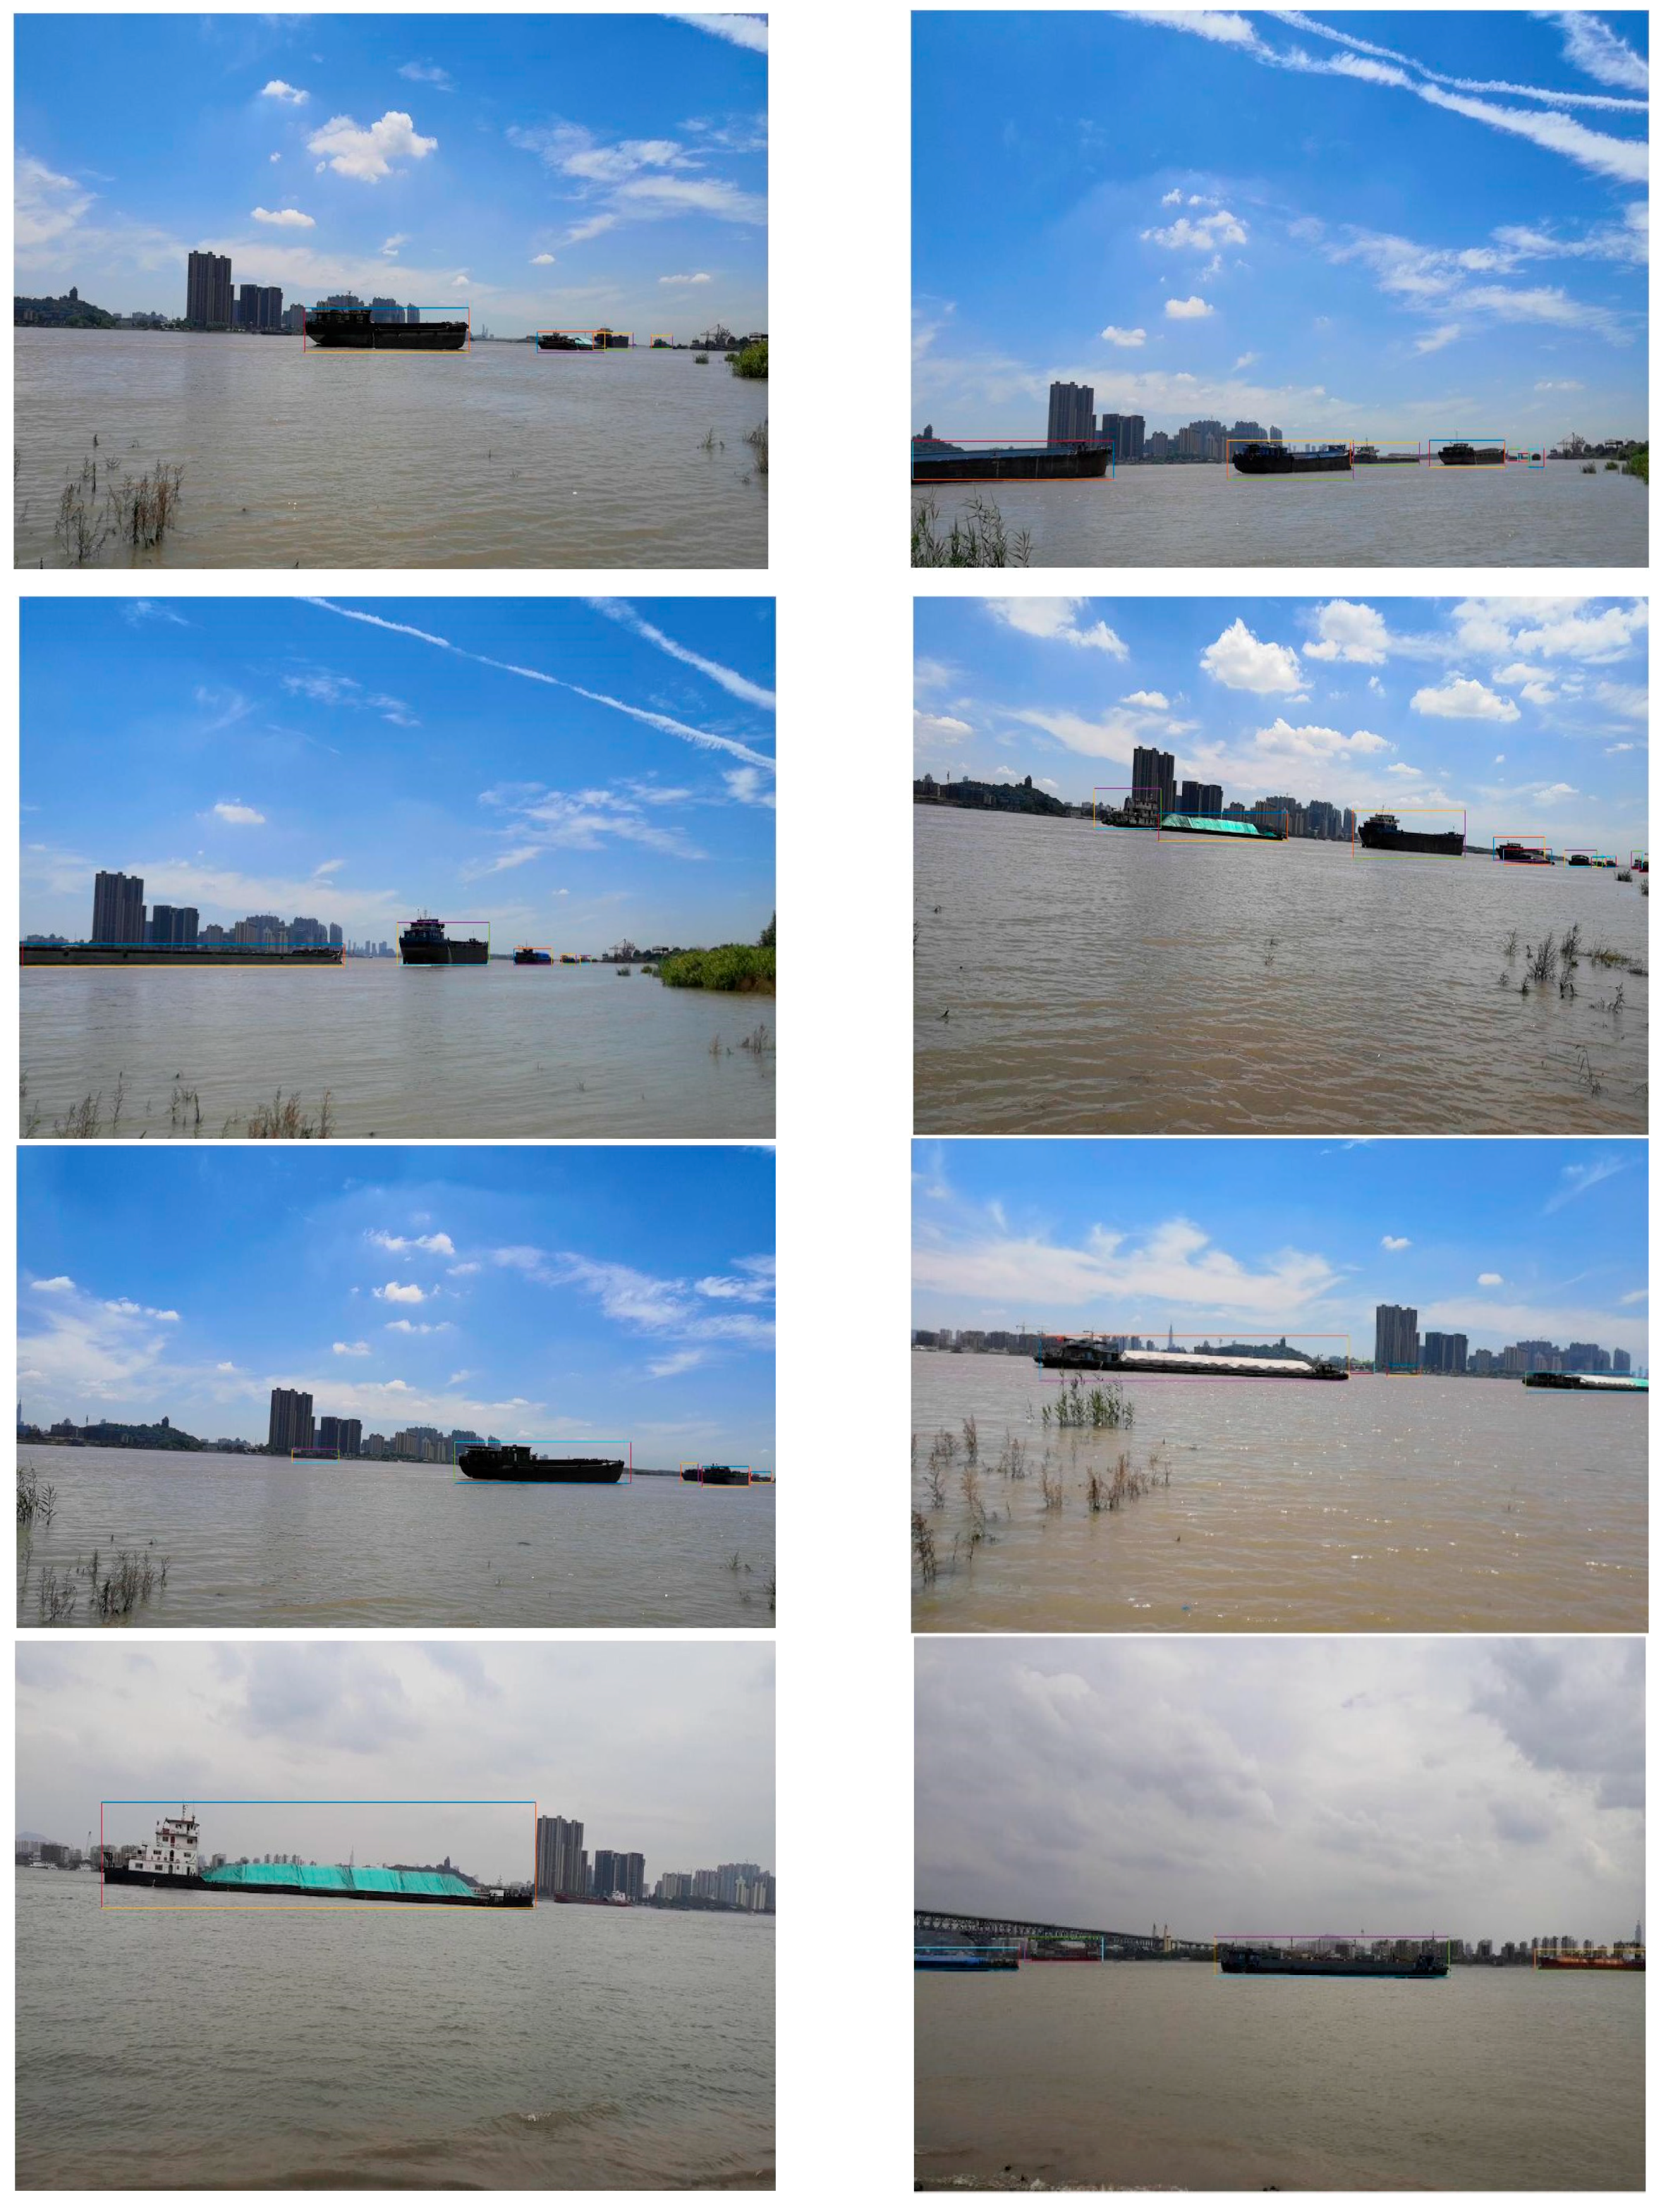
The training set is designed to directly affect the performance of the algorithm. The larger the number of pictures in the training set, the stronger the accuracy and robustness of the algorithm. Since there is currently no special ship image training set, the present study establishes a training set of pictures of the watercraft and labels the pictures in the training set. Moreover, in order to quantitatively analyze the algorithm, a test set of pictures of water ships is also established.
Since there is currently no public ship database, the present study utilizes the method of shooting video to collect ship data. The Yangtze River was selected as a shooting point based on field visits in various places in Jiangsu Province. According to the needs of this work, 34 videos were taken. The pixels are 1980 × 1080 with a total size of 3.58 GB. The program uses VS2015 to frame the video, extracts 30,000 multi-target images and selects 10,000 multi-target images and 2700 single-target images. The MATABLE tool is used to mark and record the position of the top left and bottom right of the image, then it is saved as mat file and txt file for later needs. After labeling, the MATLAB program is utilized to convert the .txt file into an .xml file. Finally, the data is prepared for deep learning training and the database is well established. Part of the picture labeled data is shown in
Figure 11.
4.1. Training
In order to verify the effectiveness of the algorithm and the efficiency of parallel optimization, an experimental simulation environment is established. The processor used is an Intel i7 8, the RAM is 16GB, the GPU processor is NVIDIA 1080Ti, the experimental platform is Windows 10 and the software environment is Python3.7, Opencv3.4.1, VS2015, JetBrains PyCharm 2019.1.1, Anaconda3, CUDA8.0, Cudnnv6.0.
Since the identification of ships and the identification of common targets are similar in function and there is currently no picture training set related to ship identification, the present study selects the existing VGG16 network as the feature extraction network and uses it in the existing Image Net general target. It should be indicated that the weights obtained by training on the training set are used as initial values. The training and the test pictures are 10,000 and 2700, respectively. The specific operational steps of the proposed method are as the following:
- (1)
Downscaling the image of the ship.
- (2)
Labeling all of the training sets and saving them in the format of .xml file.
- (3)
A hierarchical narrowing network composed of a target area positioning network, a target area generating network and a Faster R-CNN convolutional neural network are trained.
- (4)
During network training, the narrowed subnet is trained in advance; then, texture features and spatial difference features are added, and the parameters of the narrowed subnet are solidified during the overall convolutional network training.
- (5)
By using the migration learning method, the network is initialized with the parameters trained by the ImageNet dataset, and then the RPN network is independently trained with training times of 2000.
- (6)
The candidate area generated in the previous step is trained as an input picture to train a Faster R-CNN network. Until then, no parameters of any layer have been shared, and the number of trainings in this step is set to 1500 times.
- (7)
The RPN network is retrained by using the parameters of the Faster R-CNN network trained in the previous step; however, the parameters of the convolutional layer shared by the RPN network and the Fast R-CNN network are maintained, which is unique to the RPN. The number of training sessions of the convolutional layer is set to 2000.
- (8)
The convolutional layers shared by the RPN network and the Fast R-CNN network are maintained unchanged. However, parameters of the layers that are unique to the Fast R-CNN network are fine-tuned, and finally the function of quickly and accurately detecting and recognizing images is achieved. It should be indicated that the number of training sessions is 1500.
- (9)
The trained frame is detected by the test set image, while the original test image is detected by the conventional Faster R-CNN algorithm and the result is compared.
The training set is 10,000 images, the test set is 2700 images and the validation set is 2700 images. The result statistics are shown in
Table 2. The original feature extraction network is initialized using ImageNet's classification samples and the remaining new layers are randomly initialized. It should be indicated that each mini-batch contains 256 anchors extracted from one image, and the foreground background sample is 1:1. In the first 6K iterations, the learning rate is 0.001, while after 2K iterations, the learning rate becomes 0.0001. Moreover, the momentum and the weight decay are set to 0.9 and 0.0005, respectively.
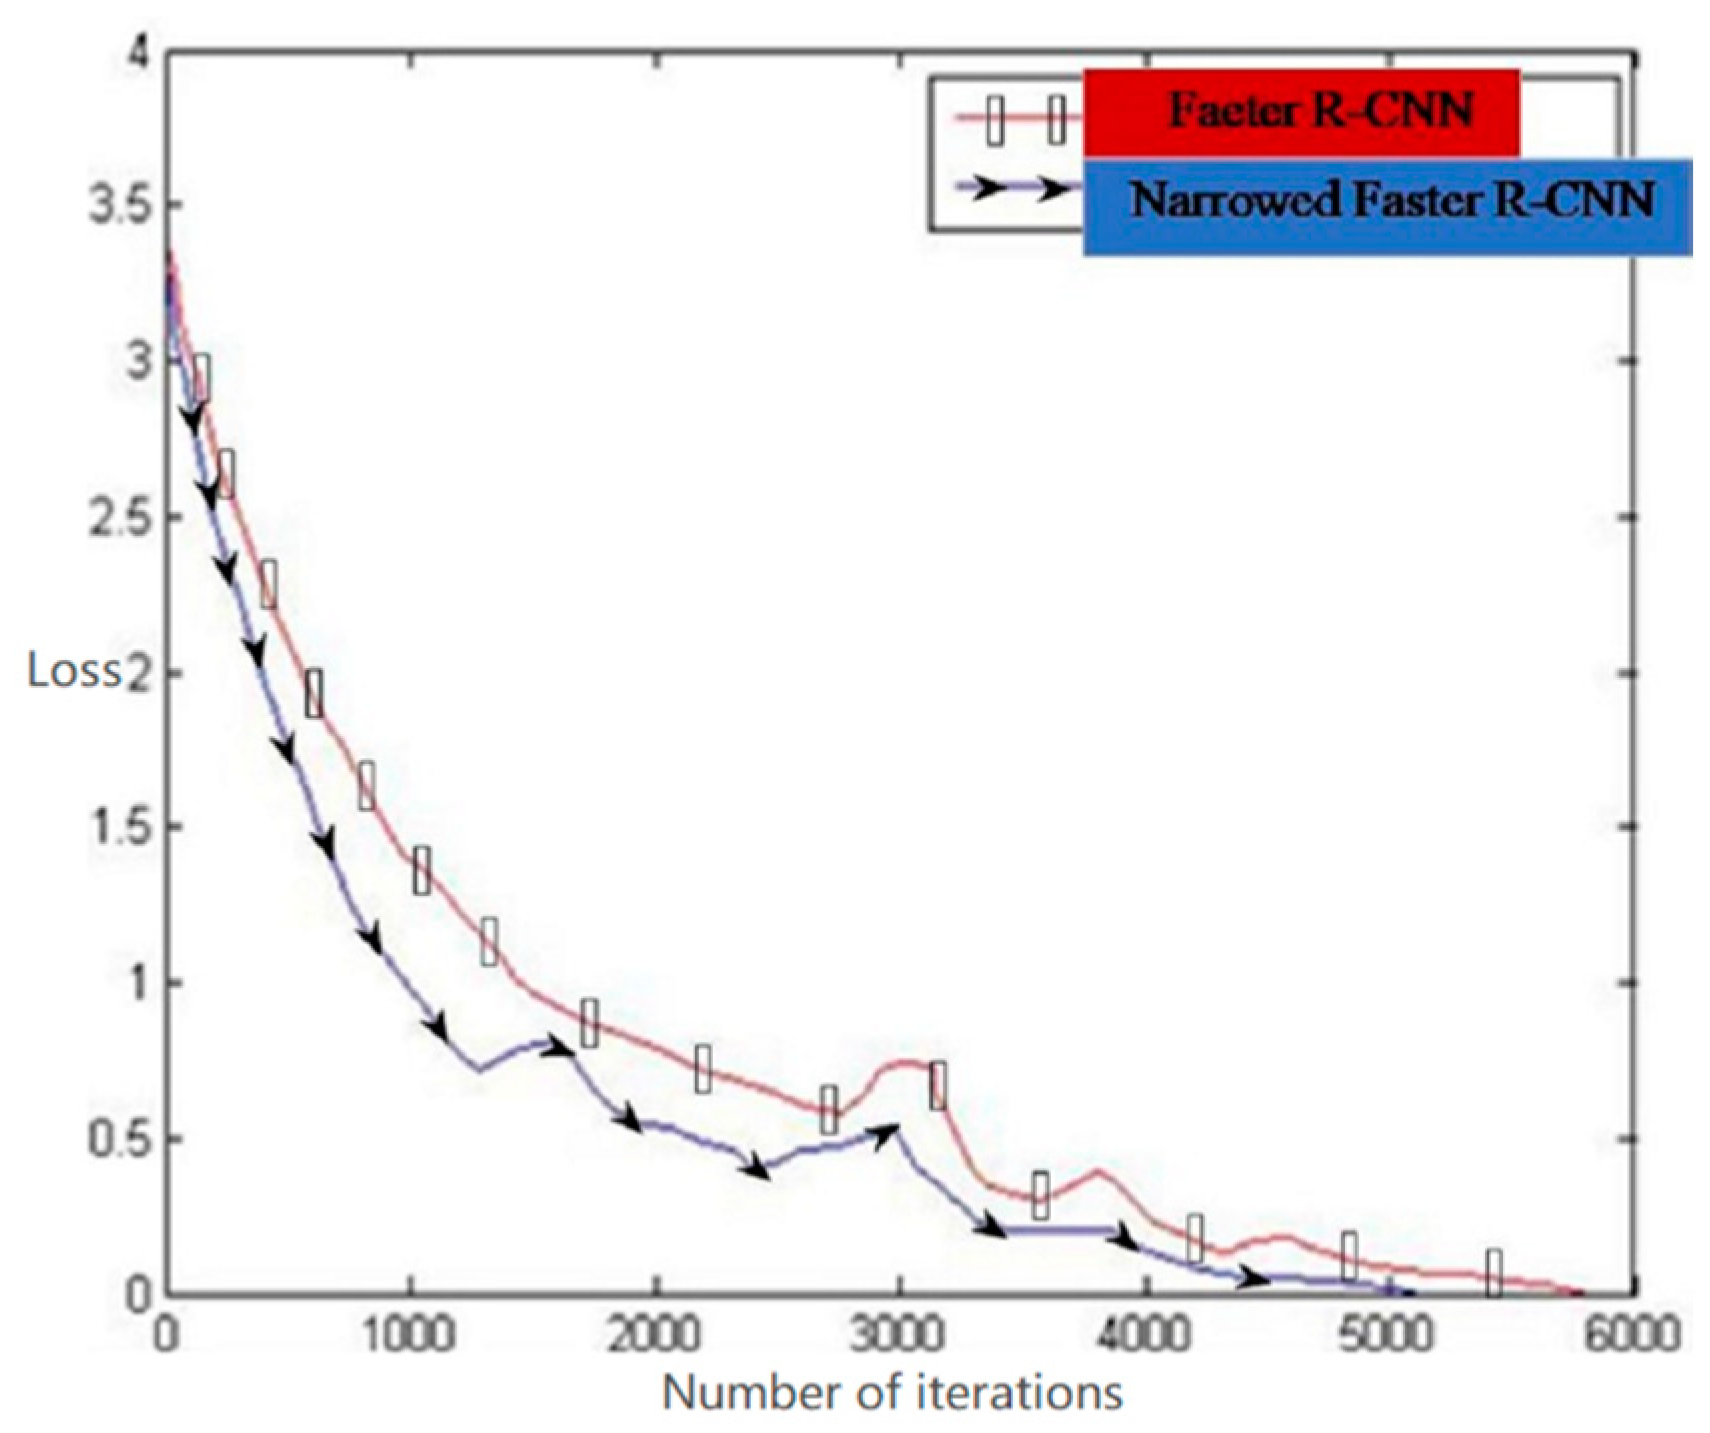
Figure 12 shows the change of the loss function of the Fast R-CNN algorithm and the proposed algorithm for the same training set image as the training times increase. The red line with rectangle shows the training result of the conventional Fast R-CNN algorithm, while the blue line with ellipse is the training result of the proposed algorithm.
Figure 12 illustrates that the loss function value of the algorithm in the training is significantly lower than that of the unmodified Fast R-CNN algorithm, and can converge to a stable state more quickly. This is because the bounding box size in this study is set corresponding to the data set in the present study, the image is downscaled and the theme and the scene are narrowed, which makes the image redundant information less. Moreover, in the training process of bounding box regression, the candidate region can be adjusted to a position close to the detection target frame, so the framework of the proposed method has a lower function loss value and can converge more quickly.
4.2. Experimental Results and Analysis
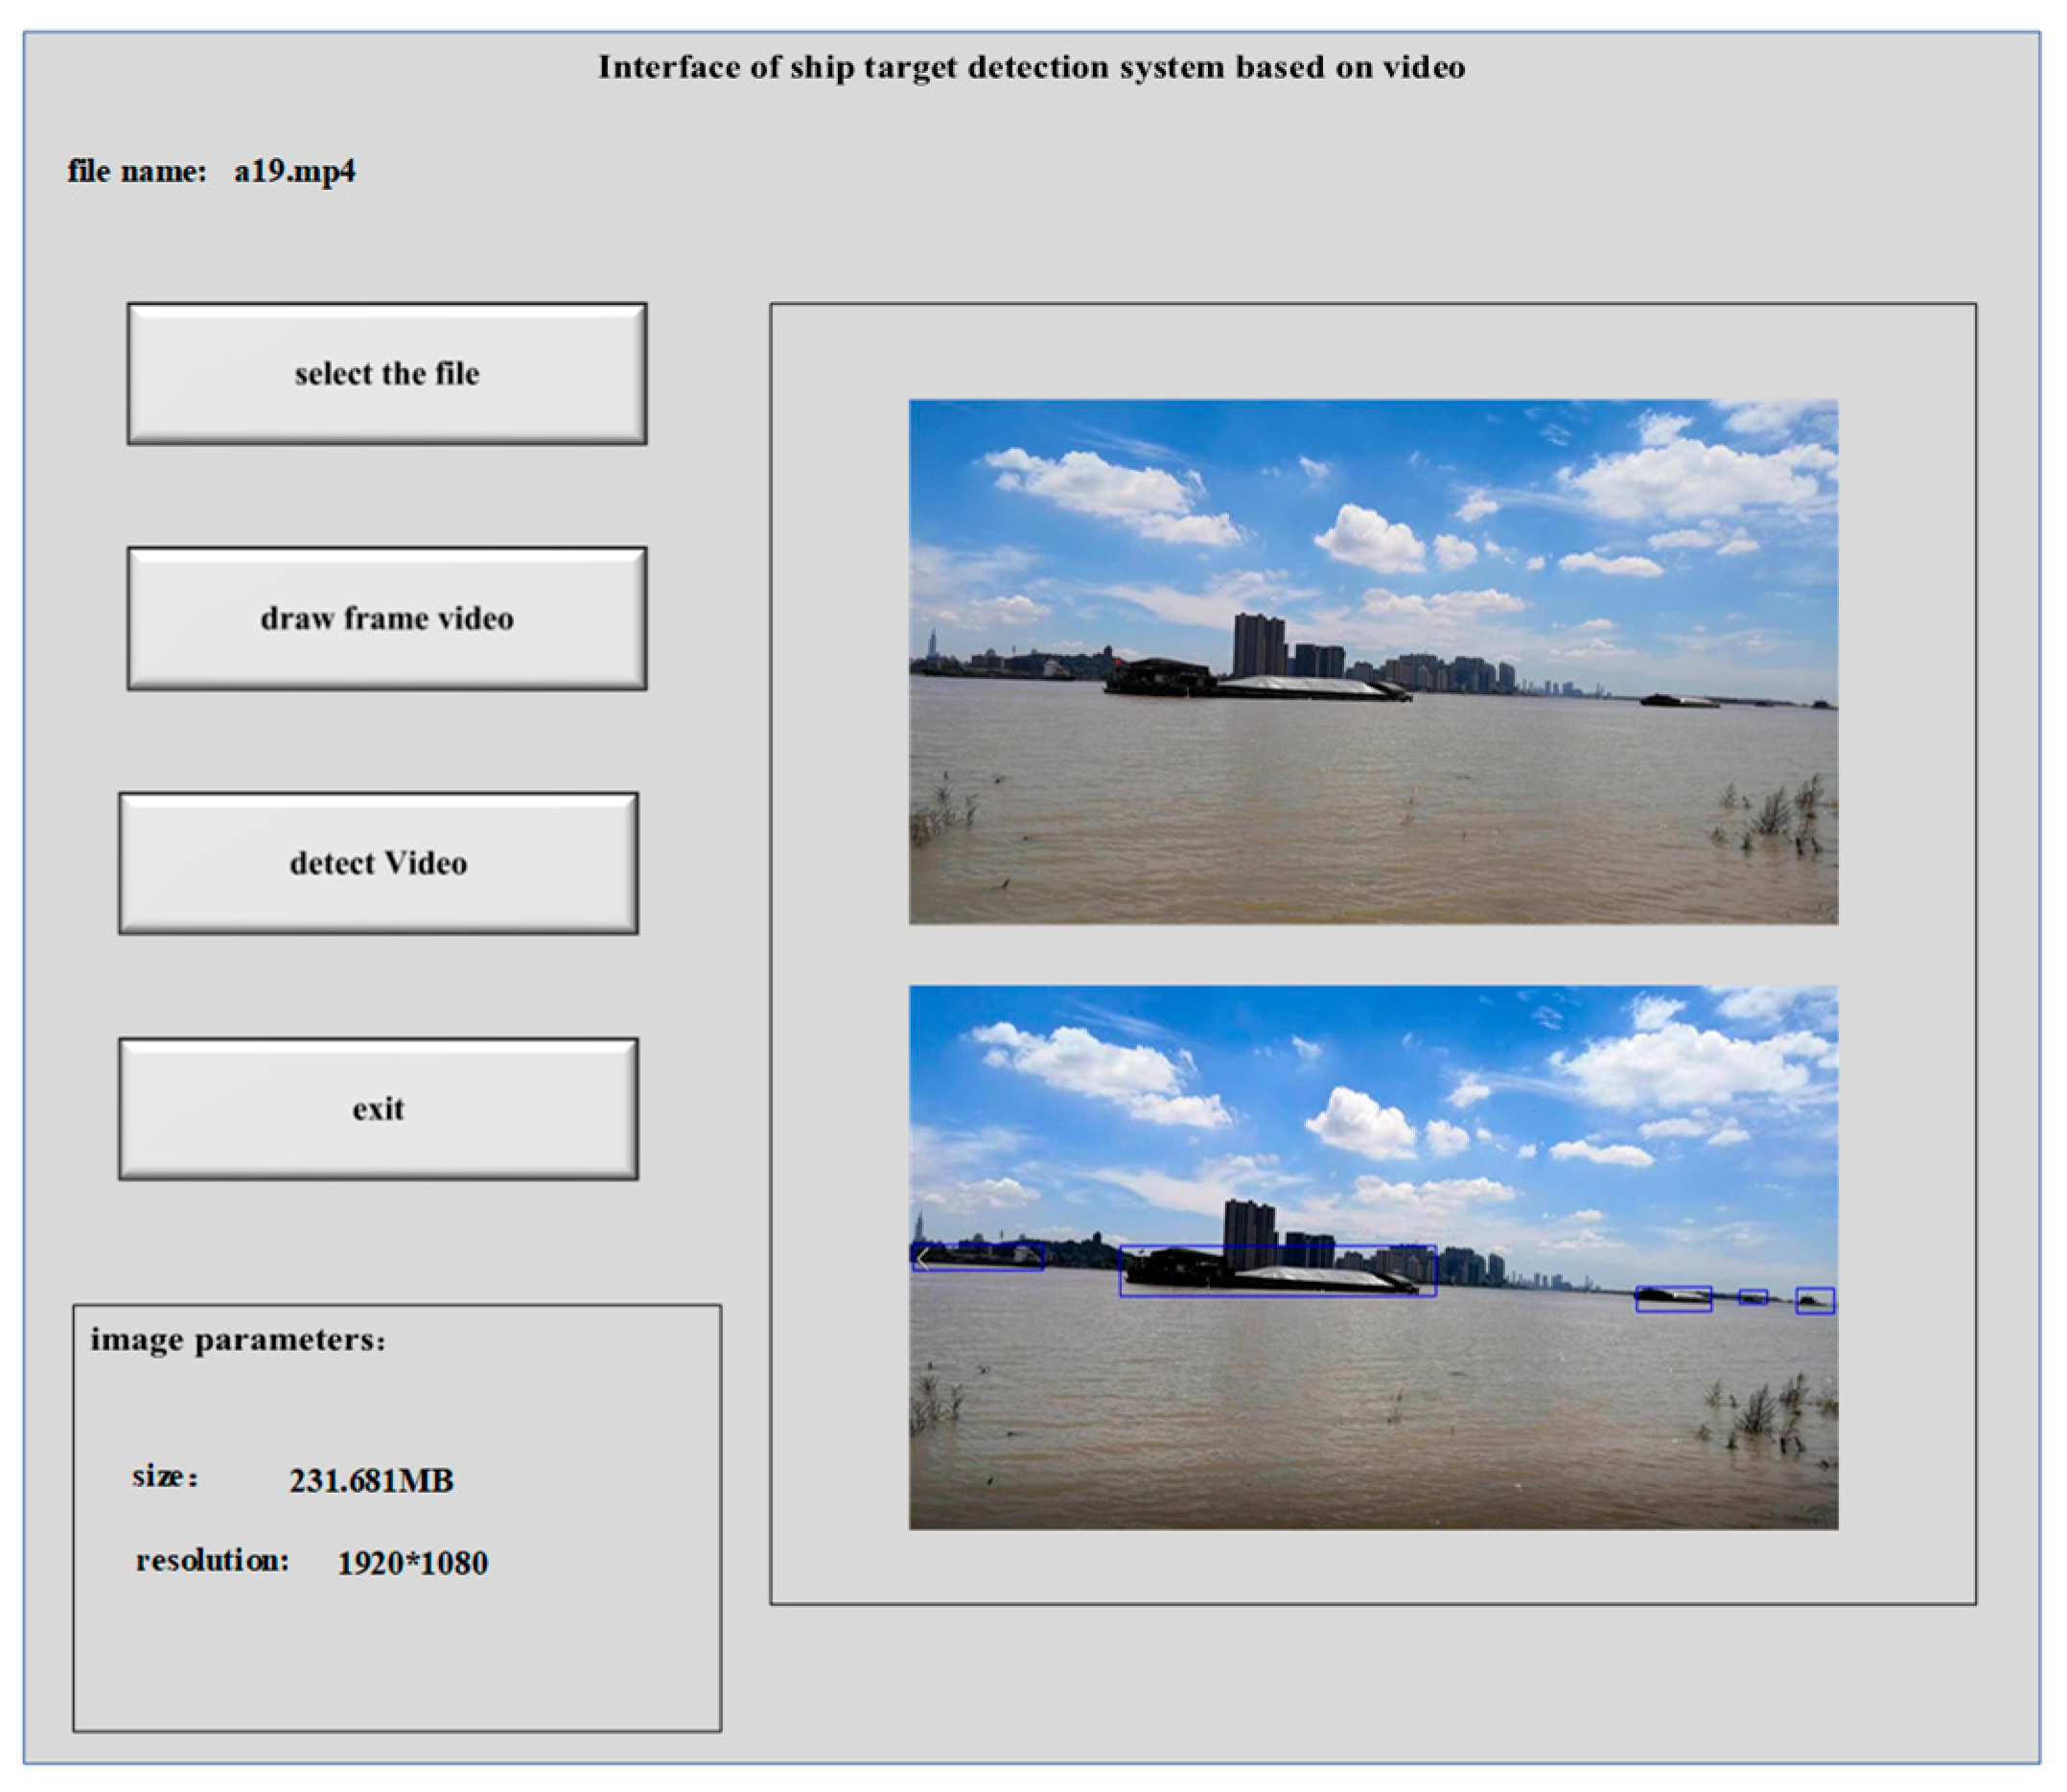
In the present study, the ship target detection system V1.0 is developed by using QT5.3 software. The main applications of this system are to detect the ship target on the inland river, use the real-time image acquisition device to collect the image information and play the real-time picture in the host computer system. Then, utilizing the existing algorithm for information in the picture to detect possible ship targets in the image is the most important part of the system. The system interface is shown in
Figure 13.
There are 2700 test pictures in this paper. Faster R-CNN algorithm with narrowing semantics improves the detection speed of the downscaled image, because the number of target pixels in the image decreases and the convolution calculation of the pixels is accelerated.
Table 3 shows the specific time comparison. Narrowing includes topic narrowing and scene narrowing. It is concluded that the Faster R-CNN algorithm takes less time to reduce the scale and narrow the image than the original algorithm.
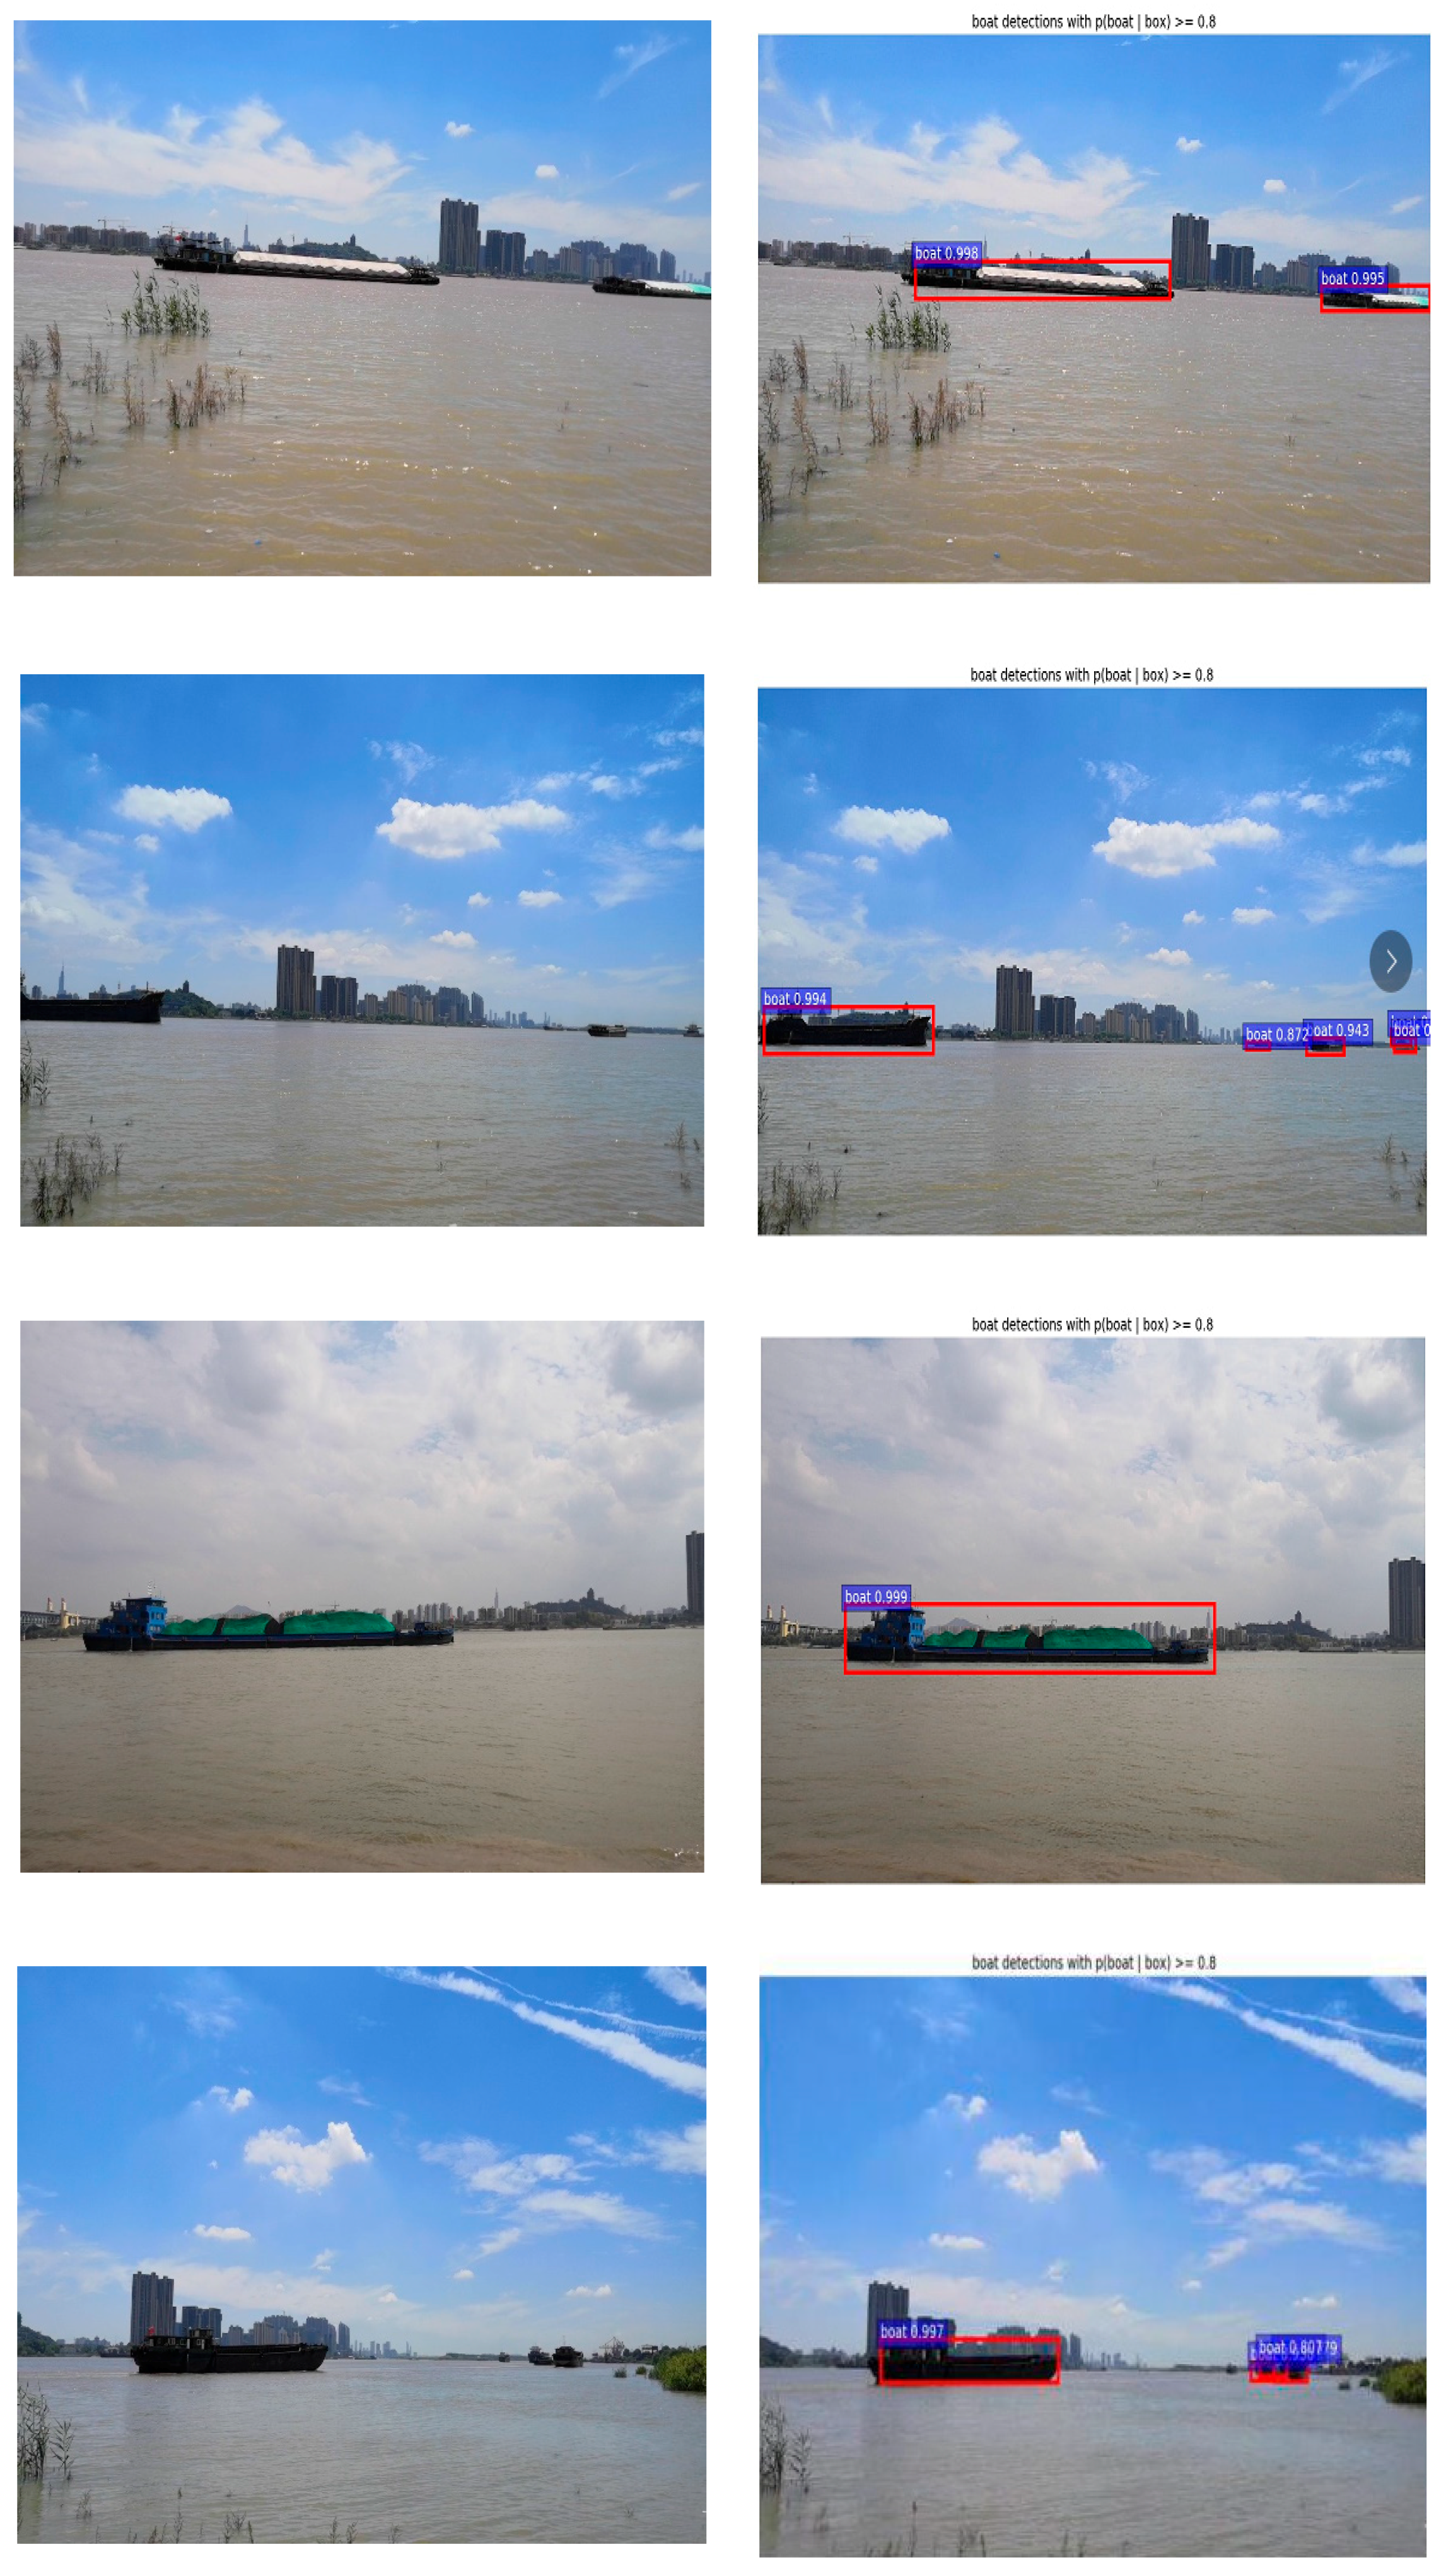
Figure 14 and
Table 4 indicate that the proposed method is obviously superior to the conventional deep learning algorithms, including SSD and YOLO, and the detection rate is improved. 18 images are recognized per second. The conventional Faster R-CNN algorithm can be used to detect and recognize targets in ship images reasonably; however, the speed of target detection is relatively slow and only about 13 images are recognized per second. The improved Faster R-CNN algorithm proposed in this paper has better detection rate and speed rather than the combination of classical algorithms, including SVM + HOG. This method can shorten the training and detection time of the algorithm and the detection rate is higher since it saves the time of generating nine bounding boxes for each feature map element corresponding to the original image, and reduces the scale of the image to the subsequent algorithm. The size of the bounding box generated in the proposed algorithm is more practical for this data set. At the same time, by combining the methods of scene and topic narrowing, the algorithm can process faster, which can improve the speed of ship image detection and recognition as well as its accuracy.
5. Conclusions
In the present study, the image downscaling, scene narrowing and theme narrowing methods were combined with the deep learning Faster R-CNN. It was observed that the RPN network in the Faster R-CNN algorithm can be better processed in limited resources. The image downscaling method was used to preprocess the image, which enhanced the useful information of the ship image, reduced the number of pixels of the subsequent image and sped up the detection. The scene semantic narrowing method was used to locate the target area and the Faster R-CNN convolutional neural network was constructed into a hierarchical narrowing network, which reduced the target detection search scale, directly located the ship area, reduced most of the background area and improved the calculation speed of Faster R-CNN. The Faster R-CNN with the narrowing function of the theme was studied. The texture feature and the spatial difference feature were selected as the narrowed sub-network, which realized the deep cooperation between the main network and the subnet. In the network training, the narrowed subnet was trained in advance. When the convolutional network was trained, the parameters of the narrowed subnet were solidified or only fine-tuned, and the network parameters were optimized. Furthermore, it as found that the learning and test speeds of the R-CNN algorithm improved the detection rate of the Faster R-CNN algorithm.
The algorithm in this paper also had a high accuracy rate for detecting ships with small targets at a long distance. In the future, it will still be necessary to further study the fast and regional convolutional neural network algorithm, try new methods and adjust the network structure and parameters to further optimize the algorithm and improve the universality of the algorithm.


