Article

Toward a Comfortable Driving Experience for a Self-Driving Shuttle Bus

1
New Mobility TF, ICT R&D Center, SK Telecom, Gyeonggi-do 13595, Korea
2
Seamless Transportation Lab, School of Integrated Technology, Yonsei University, Incheon 21983, Korea
*
Author to whom correspondence should be addressed.
Electronics 2019, 8(9), 943; https://doi.org/10.3390/electronics8090943
Submission received: 31 July 2019 / Revised: 20 August 2019 / Accepted: 22 August 2019 / Published: 27 August 2019
(This article belongs to the Special Issue New Advances of Intelligent Vehicles)

Abstract

:
The convergence of mechanical, electrical, and advanced ICT technologies, driven by artificial intelligence and 5G vehicle-to-everything (5G-V2X) connectivity, will help to develop high-performance autonomous driving vehicles and services that are usable and convenient for self-driving passengers. Despite widespread research on self-driving, user acceptance remains an essential part of successful market penetration; this forms the motivation behind studies on human factors associated with autonomous shuttle services. We address this by providing a comfortable driving experience while not compromising safety. We focus on the accelerations and jerks of vehicles to reduce the risk of motion sickness and to improve the driving experience for passengers. Furthermore, this study proposes a time-optimal velocity planning method for guaranteeing comfort criteria when an explicit reference path is given. The overall controller and planning method were verified using real-time, software-in-the-loop (SIL) environments for a real-time vehicle dynamics simulation; the performance was then compared with a typical planning approach. The proposed optimized planning shows a relatively better performance and enables a comfortable passenger experience in a self-driving shuttle bus according to the recommended criteria.

1. Introduction

Fully autonomous driving vehicles are expected to achieve outstanding results in decreasing traffic accidents, improving traffic flow, and improving fuel efficiency. Autonomous vehicles are convenient for humans as they free humans from the driving workload. Thus, riding in a self-driving vehicle can be accomplished without paying attention to the roadway environment. Currently, user acceptance is of fundamental importance for achieving successful market penetration; this has motivated research on the study of human factors in harmony with the development of self-driving vehicles.
Although remarkable achievements have been published in recent decades regarding the development of an autonomous vehicle control system [1,2,3], there remains a lack of investigation on the control strategy in terms of self-driving service operations in accordance with comfortable driving factors for passengers. Typically, ride quality or driving comfort is determined by various factors such as noise, temperature, engine vibration, indoor air quality, and type of seats [4]. Although it is difficult to define “ride convenience” because it is highly related to personal preference and individual tastes, driving comfort for autonomous car users has been studied with respect to human–machine interface (HMI) [5,6,7].
The autonomous shuttle bus is a public transit vehicle in which many passengers are boarded in a cabin as opposed to an individual commercial car. Autonomous driving transportation services must guarantee sustainable shuttle service operation, and a comfortable driving experience must be safely controlled for the passengers [8,9]. In the case of a self-driving shuttle bus, there is a lack of flexibility in dynamic path planning because the self-driving bus must follow a pre-defined path as a public transit vehicle in an urban situation. An autonomous driving strategy based on increased turning or adjusting the desired trajectory radius for a lower lateral force of the vehicle is not recommended. Passengers in the cabin may feel uncomfortable due to sudden changes when the bus departs from the reference route.
According to prior research [10,11,12], the acceleration or deceleration of a vehicle and the temporal derivative of acceleration (i.e., “jerk”) significantly impact the safety of driving and the comfort of the passengers. Careful and appropriate control of the acceleration, braking, and steering of the vehicle can improve the comfort of the passengers. It is recommended to set limitations on the magnitudes of acceleration and jerk of the vehicle motion.
For example, in the case of the Korea Train eXpress (KTX), the maximum speed is over 300 km/h. Although they are traveling at a faster speed, passengers report feeling less motion sick and are more comfortable than in a public bus [13,14]. This is because the acceleration magnitude and jerk have been strictly managed since the construction stage of the Train. The speed and acceleration profile of a train or subway is managed based on the criterion of longitudinal and lateral acceleration and longitudinal and lateral jerk, with respect to the curvature of the train tracks. Standard values of acceleration and jerk criteria are limited to 0.9–1.47 m/s2 and 0.3–0.9 m/s3, which have been used for public highway or railway transportation in many countries [14,15]. These acceleration and jerk criteria are also applicable to the driving and planning strategies for self-driving public transit vehicles.
Lateral acceleration is caused by cornering or by making lane changes. If the vehicle can maintain an appropriate speed when approaching the curvy section of a road, the lateral force will be limited, and passengers will feel more comfortable, similar to being in a train. The contributions of this study are as follows. First, we review the previous research regarding comfort in terms of vehicle movements and recommended comfort driving criteria with respect to accelerations and jerks for self-driving public transit vehicles. Second, on the basis of the proposed comfort criteria, we propose a method for time-optimal planning to obtain a desired velocity profile in consideration of the vehicle dynamics for stability, time efficiency, and driving comfort. Finally, this study evaluates the feasibility of the proposed controller and planning strategy through software-in-the-loop (SIL) environments for a real-time dynamic vehicle simulation. We also compare the performance to a typical planning method.
This paper is organized into six sections. Section 2 explains a comfort criterion using vehicle movements and forces, and presents investigating previous works. Section 3 and Section 4 present the vehicle kinematic model and time-optimal planning method, respectively. The simulation results and conclusions are presented in Section 5 and Section 6, respectively.

2. Comfort Driving Criteria for Public Transit Vehicles

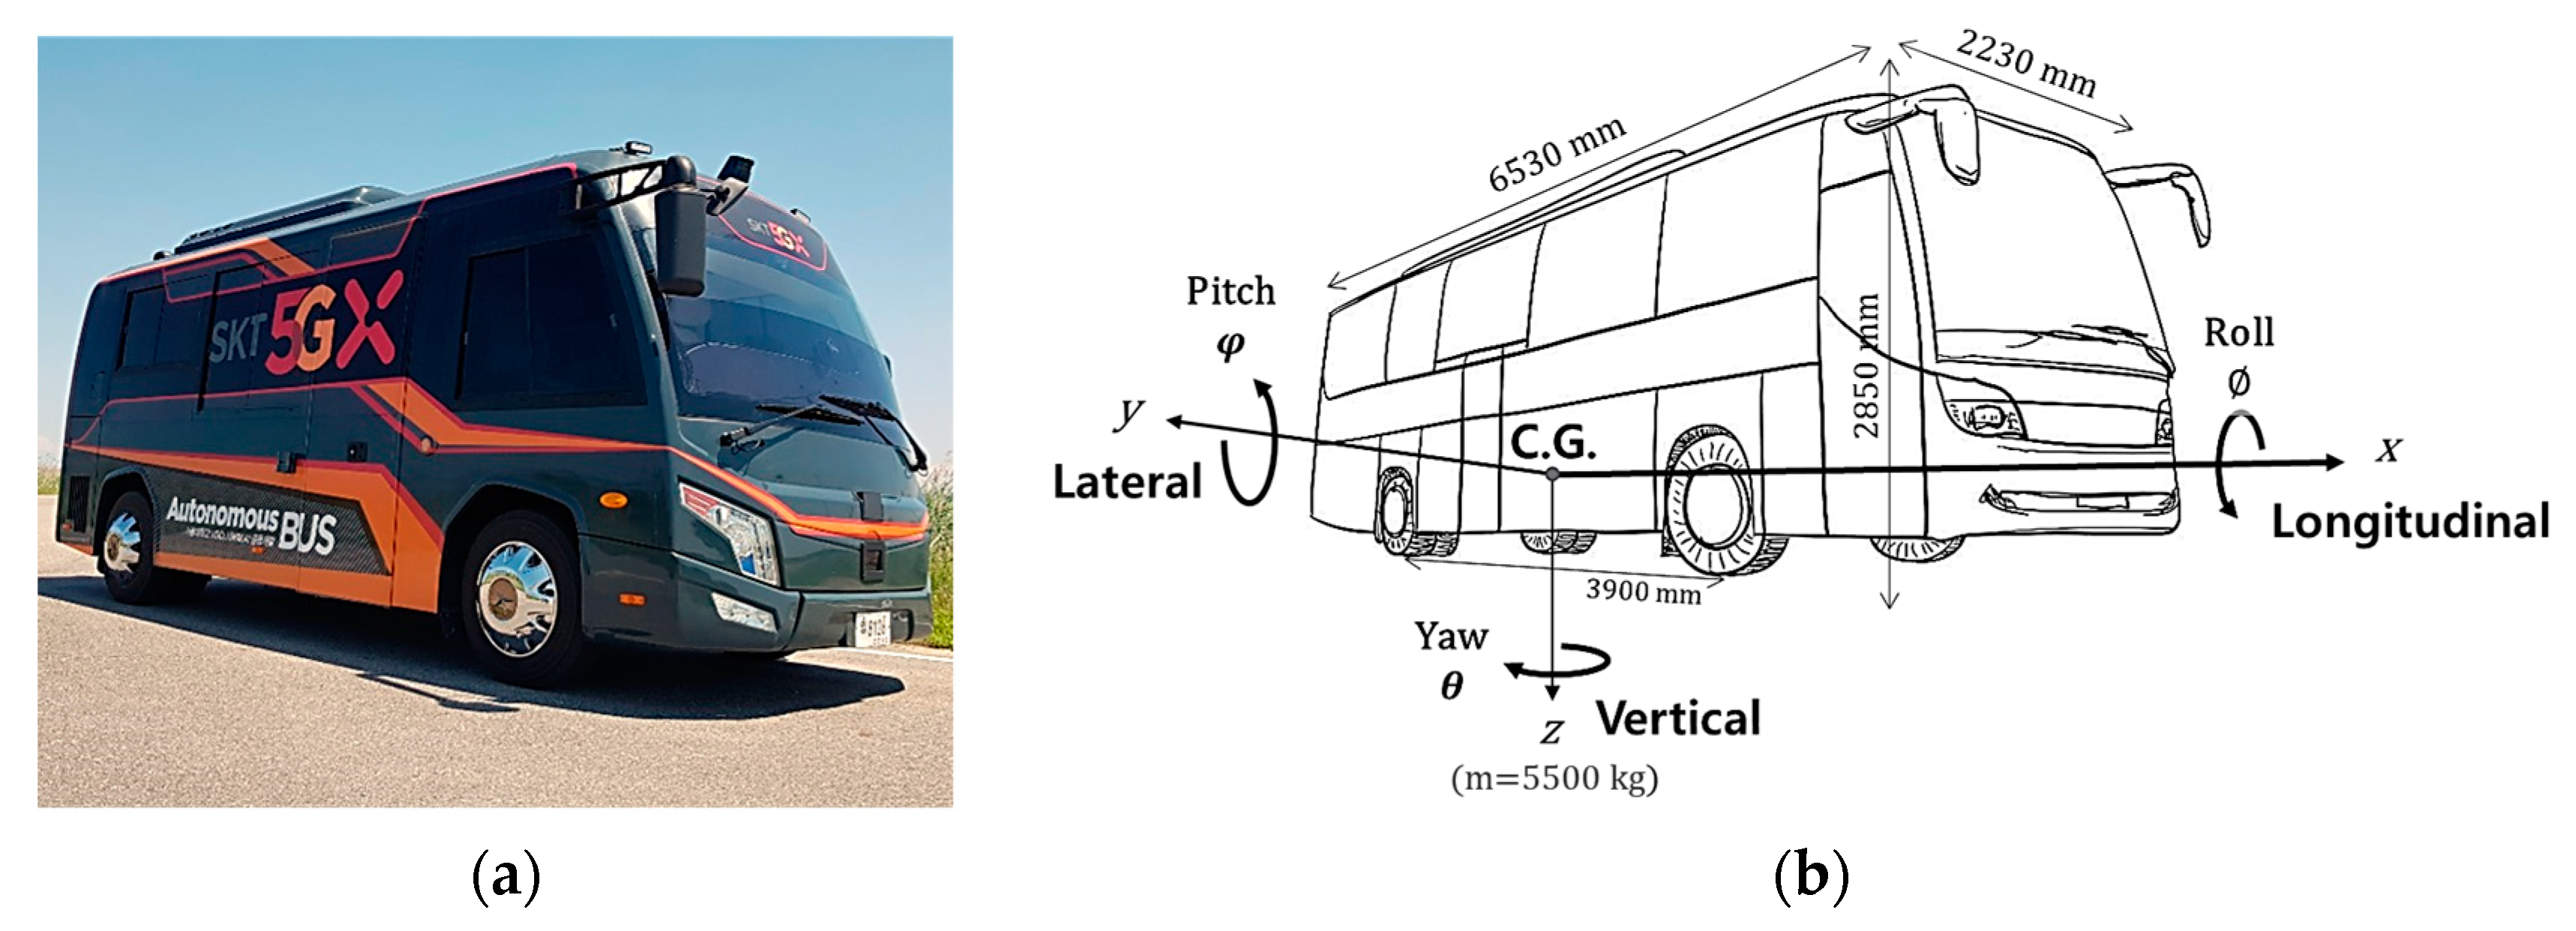
2.1. Vehicle Movements and Forces

Figure 1 shows images of the vehicle, noting movements, forces, and dimensional specifications for the simulation. A lateral acceleration or a cornering power of a vehicle is measured in terms of the gravitational force of the earth, in a unit called ‘g’. Lateral acceleration is a function of applying the highest friction contact patches to the road surface (tire grip), keeping all four tires in contact with the surface, and balancing the forces among the four tires to the point where all lose lateral traction at the same point. Factors influencing this limit include the height and location of the center of gravity, tire design, suspension compliance, and suspension geometry [16].
The longitudinal and lateral acceleration values are the combined results of vehicular dynamics and maneuvers in response to consecutive changes of a driving situation. On a curved road, the vehicle is forced by a lateral acceleration against a centrifugal force, depending on the cornering speed. The lateral acceleration is proportional to the square of the velocity of the vehicle but has an inverse proportion to the radius of the vehicle. The velocity is an important factor because the value of the lateral acceleration largely depends on the cornering speed of the vehicles. These lateral forces of vehicle and the temporal derivative of acceleration, i.e., the jerk, significantly impact the safety of driving and the comfort of the passengers [10,11,12].
The vertical motion and vibration parameters depend on the vehicle’s suspension system, road surface conditions, and the mechanical structure of the vehicle. Jerk, in association with vertical vehicular acceleration and vibration, is an important physical parameter affecting the riding quality and comfort level for passengers. As these mechanical and environmental factors are beyond the scope of this study, this study does not examine the effects associated with the motion of the vertical axis and vibration.
The vertical acceleration and vibration of the vehicle have been strongly correlated to ride quality, but have been weakly correlated to motion sickness experienced by passengers [10,17]. Although all factors influencing the ride quality to the passenger cannot be contemplated a priori, the proposed driving comfort metric was considered as the major factor affecting possible motion sickness for passengers who sit or stand in the cabin of a self-driving vehicle.

2.2. Acceleration and Jerk Criteria for Public Transportation

A good ride quality means a small risk of motion sickness. A large acceleration or jerk causes passenger discomfort even in short periods. For example, in the subway, the average freestanding passengers were measured within a constant acceleration of 0.93 m/s2, and the largest average jerk was approximately 0.6 m/s3 [18]. When those values momentarily get too high for a passenger, it is difficult for the passenger to maintain his/her posture. According to [11], an autonomous passenger car only carries a seated occupant. The recommended limit value of acceleration was 2.0 m/s2, and that of jerk was 0.9 m/s3.
In the case of a human driver, Bossetti [19] reported that 99% of brake maneuvering in human driving test data ranged from approximately −0.5 m/s2 to −2.0 m/s2. Moon and Yi [20] also categorized the comfortable region of braking as within −2 m/s2, based on human manual driving test data from the design of a cruise control deceleration algorithm. In addition, this human driving data showed that the maximum deceleration and the acceleration values in the conducted tests were −5.0 m/s2 and 3.0 m/s2, respectively.
Levison [21] also recommended lateral and the longitudinal acceleration thresholds using statics data of human drivers, such as 0.4 g and 0.2 g, respectively, in both passenger cars and heavy trucks. The maximum longitudinal deceleration of the human driver was measured as at least −5.08 m/s2 to prevent an emergency situation [7]. The air bag deployment values from [22] act as a range from −5.6 m/s2 to −7.6 m/s2, and are measured for a case of a frontal impact of a vehicle with a rigid barrier.
Figure 2 shows the summarized investigation for acceleration and jerk criteria. These accelerations and jerk limit values vary, as seen in [7,10,11,12,13,14,15,16,17,18,19,20,21,22], but they have been revealed within a generally common range. On the basis of prior research, representatively, the acceleration and jerk regions were divided into four categories: cautious, normal, dynamic, and extremely dynamic driving results. When the criteria of public transportation were considered in the context of a cautious passenger preferring soft steering as well as accelerating and braking control for the longitudinal acceleration, the comfort threshold presented at 0.9–1.47 m/s2. The jerk threshold for comfort was approximately 0.3–0.9 m/s3. An autonomous public shuttle carries both seated and standing passengers. To meet the criteria of a comfortable driving experience, the limit value for acceleration might reasonably be set to under 0.9 m/s2, and that of jerk to 0.6 m/s3.
The following sections describe the self-driving vehicle controller and a velocity planning strategy that can meet the proposed comfort driving criteria for self-driving transit vehicles for passengers.

3. Vehicle Kinematic Model and Controller

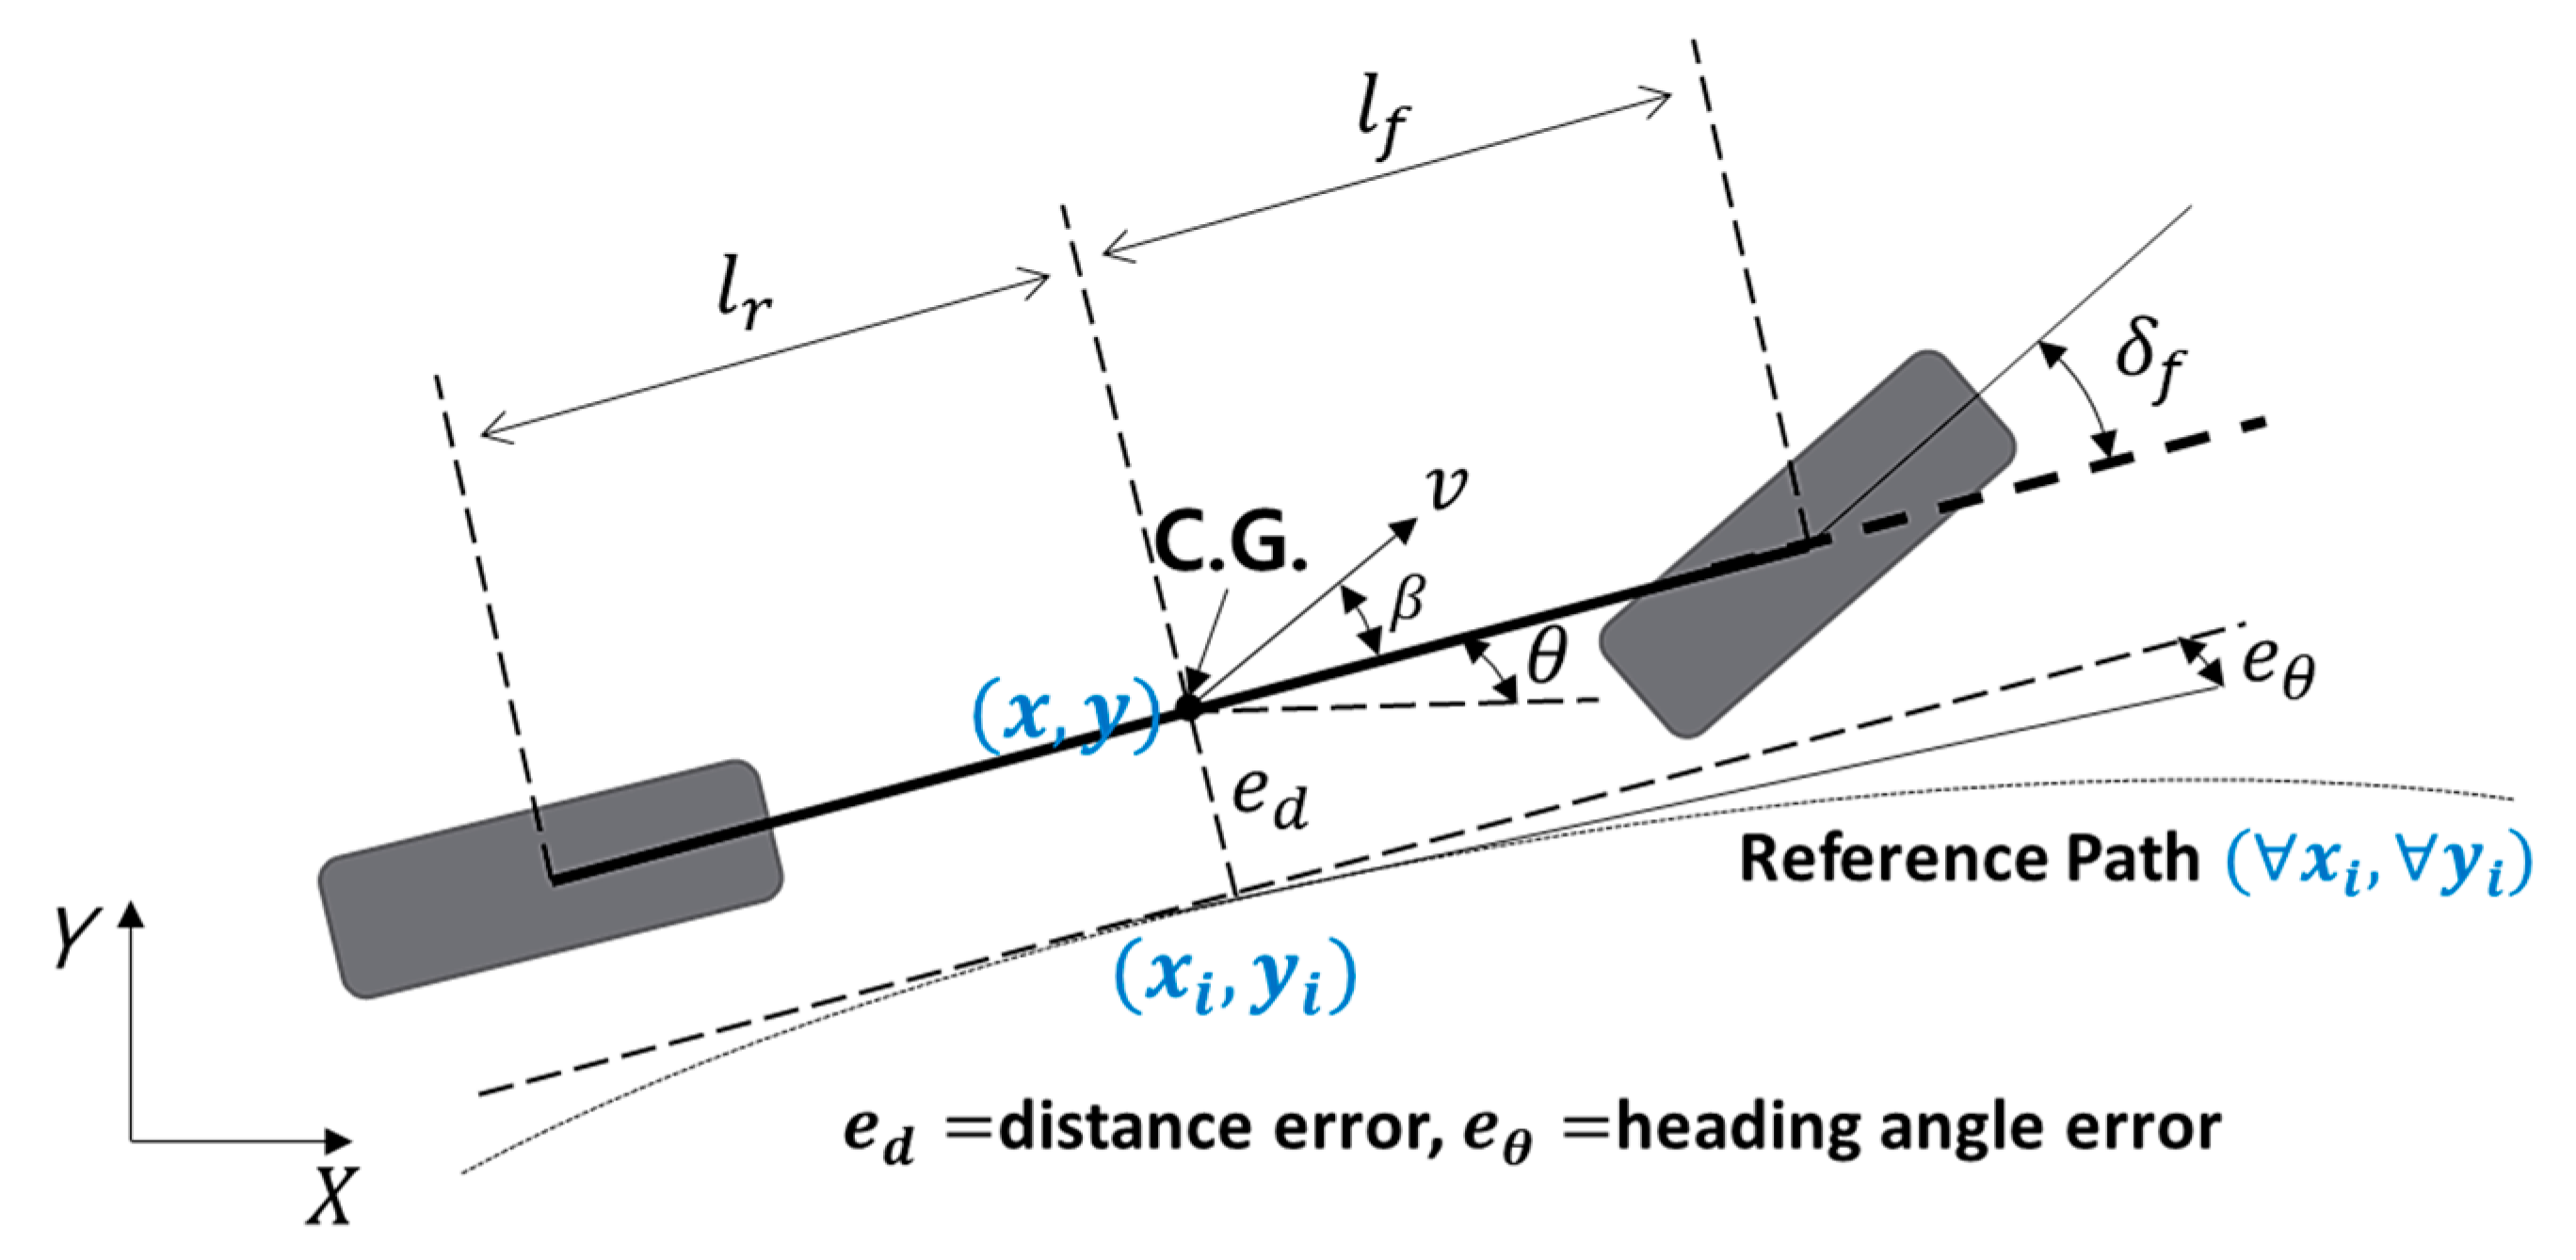
3.1. Bicycle Kinematic Model

Autonomous driving manages a path-following problem. The goal of path-following control is to minimize a lateral distance error or heading angle error with respect to an explicit reference path while guaranteeing safety from the starting point to the destination. It refers to a vehicle following a predefined path by controlling appropriate steering and velocity reference inputs [23,24]. In this study, a steering model of the lateral motion is developed using a two degree-of-freedom (DOF) bicycle kinematic model, as shown in Figure 3. This is achieved by combining the front and rear wheels to form a two-wheeled model [25],
x ˙ = d x d t = v ( t ) × cos ( β ( t ) + θ ( t ) )
y ˙ = d y d t = v ( t ) × sin ( β ( t ) + θ ( t ) )
θ ˙ = d θ d t = v ( t ) × sin β ( t ) l r
where ( x ,   y ) indicates the coordinate of center of gravity of the vehicle. β and θ denote the sideslip angle and heading angle of the vehicle, respectively. Moreover, l f ( l r ) is the length from the center of gravity to the center of the front (rear) axle of the vehicle; v refers to the velocity of the vehicle. The idea is that the vehicle always moves along an Ackerman geometry except for during straight movement.
R = l f + l r tan δ f cos β = l r sin β
θ ˙ = v l f + l r t a n ( δ f )
where δ f denotes the front steering angle of a vehicle. If the slip angle β is small and the vehicle is controlled via front steering only, the average of the front steering angle can be approximated by the following equation [26]:
δ f = t a n 1 l f + l r R l f + l r R   ( where   π 2 < δ f < π 2 )
k = 1 R =   y ( 1 + y 2 ) 3 2   ( y = d y d x ,   y =   d 2 y d x 2 )

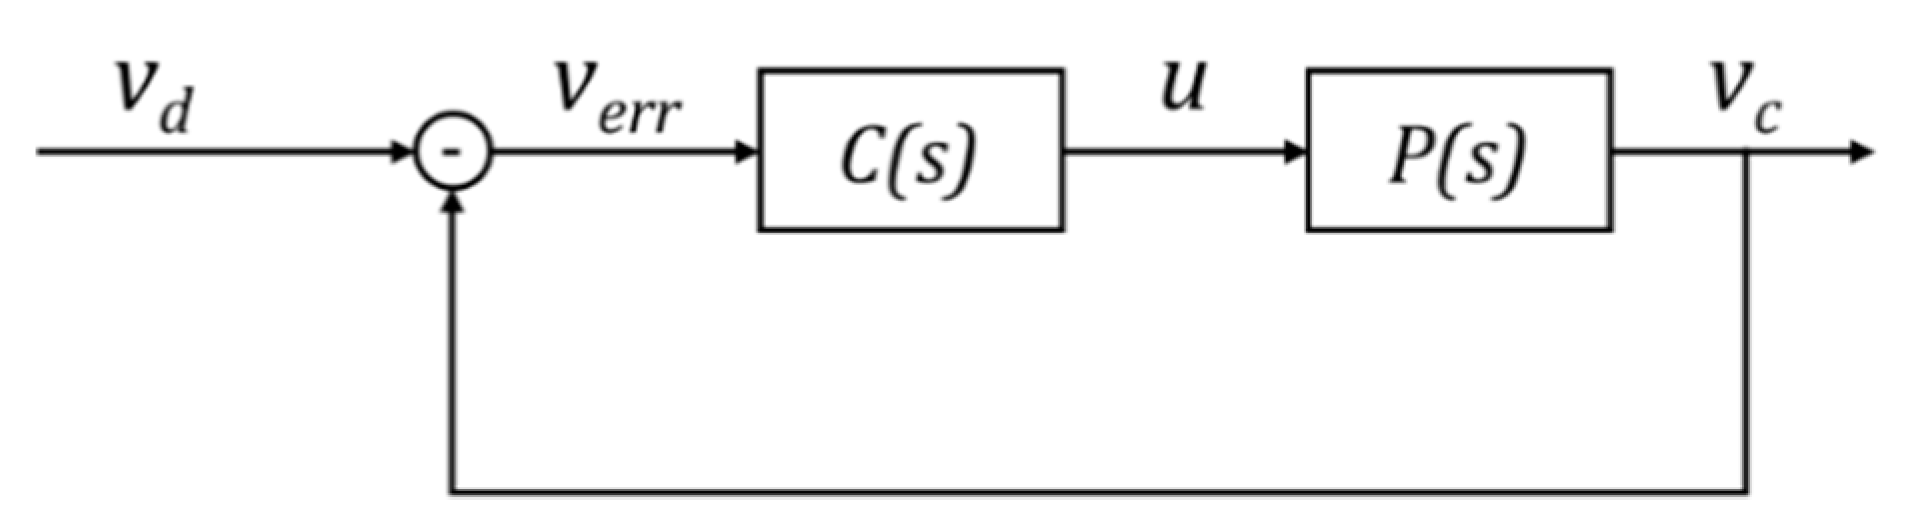
3.2. Lateral and Longitudinal Controller

To implement the simple path tracking function for front steering, a proportional-derivative (PD) controller is implemented, with the lateral distance error e d = ( x i x ) 2 + ( y i y ) 2 as feedback. The steering control law is given by
δ ˇ f ( t ) = [ K p × e d ( t ) + K d × { e d ( t 1 ) e d ( t 2 ) } ]
where δ ˇ f denotes the simultaneous steering angle as a control input, and K p and K d are proportional and derivative gain parameters, respectively, for feedback control with respect to the lateral distance error between the vehicle and reference path. In this study, K p is given as 0.5, and K d = 0.01 .
A velocity control is also implemented based on the PD control, using the velocity error v e r r = v d v c as feedback, as shown in Figure 4. The transfer function of the quadratic model of the vehicle with the PD controller is given by [26]
v c v d = C ( s ) P ( s ) 1 + C ( s ) P ( s ) = K D s + K P τ s 2 + ( 1 + K D ) s + K P
where v d is the desired velocity as a reference input, and v c is the measured velocity of a plant vehicle for K P = 1 , K D = 0.05 , and τ =   0.5 , respectively. Figure 5 describes the simulation results of the proposed longitudinal PD controller. For a comfortable driving experience, appropriate target speeds v d have to be calculated with respect to the reference path information.

4. Time-Optimal Velocity Planning for Comfort Driving

4.1. Conventional Velocity Planning Method

In the case of a straight road, the desired speed can be determined by considering the speed limit ( V m a x ) and the safe braking distance to prevent collisions with obstacles in front of the car. However, on curved roads, the lateral acceleration is proportional to the centrifugal force of the vehicle, which, in turn, is proportional to the square of the speed and the curvature of the road. The equation of ideal lateral acceleration is given by
a y = v 2 R
Reflecting the curvature of the given path, the expected lateral acceleration of the vehicle is:
a y e x p e c t e d = v 2 × k p a t h
If a y e x p e c t e d is a known parameter as a maximum allowable acceleration of the vehicle, then
v d = k p a t h / a y e x p e c t e d   ( where   v d < V m a x )
Using the above equation, we can obtain the desired speed using the curvature of the pre-defined path as a rule-based approach [27,28] and using a simple lateral force constraint for velocity planning. However, because the dynamic motion of the vehicle is not considered to be the whole trajectory when only the above equation is used, it is difficult to maintain the balance and stability of the vehicle in cornering, owing to the curve negotiation problem [29]. Moreover, undesirable lateral forces diminish the driving experience. Therefore, the desired velocity must simultaneously consider the reference path, vehicle dynamics, and comfort.

4.2. Proposed Velocity Optimization Method

The optimization problem is a well-known issue in robotics, i.e., finding an optimal solution that minimizes the user-defined cost of all possible solutions within constraints. It can be applied to various fields depending on how the cost is defined, such as in energy efficiency or time optimization. This study employed the above-mentioned bicycle kinematic model with a front steer. In situations where the automobile is assumed to have a rigid body, the rear wheel steer will be zero. For simplicity purposes, assuming that the center of gravity of the vehicle is located at the center of rear wheel axle, the dynamics of a vehicle coupled with body slip β are omitted.
β = s i n 1 ( l r R ) = 0
Then, the vehicle kinematics for front-steering can be simplified by
d d t ( x ( t ) y ( t ) v ( t ) a ( t ) θ ( t ) ) = ( v ( t ) cos θ ( t ) v ( t ) sin θ ( t ) a ( t ) j ( t ) θ ˙ ( t ) ) t [ 0 ,   t f ]
where t f indicates a terminal moment for the entire process. The symbols x ( t ) and y ( t ) are the respective changes of the vehicle position in the x and y directions. v ( t ) denotes the value of velocity, corresponding to the acceleration a ( t ) . Similarly, j ( t ) is the jerk corresponding to accelerations. θ ( t ) denotes the vehicle heading angle.
The general formulation of simultaneous dynamic optimization was stated in [30]. The minimum time optimization can be obtained by discretizing a continuous time model using an interior-point method (IPM)-based simultaneous approach [31]. This study defined a nonlinear problem (NLP) to minimize the travel time through the summation of the discrete time element duration, as follows:
min i = 0 t f h i   ( i = 0 ,   1 ,   t f )
The above is subject to the principles of the movement, velocity, acceleration, and jerk of vehicle for t [ 0 ,   t f ] :
s i = s i 1 + v d ( i ) h i
v d ( i ) = v d ( i 1 ) + a x i h i
a x i = a x i 1 + j x i h i
a y i = a y i 1 + j y i h i
The lateral acceleration constraint with respect to the curvature of the path and the vehicle velocity for t [ 0 ,   t f ] :
a y i k i × v d ( i ) 2
The comfort driving constraints for t [ 0 ,   t f ] :
a ( + ) x i a ( + ) x c o m f o r t
a ( ) x i a ( ) x c o m f o r t
a y i | a y c o m f o r t |
j x i | j x c o m f o r t |
j y i | j y c o m f o r t |
The linear relationship of the longitudinal–lateral acceleration constraints for t [ 0 ,   t f ] :
a ( + ) x i a ( + ) x c o m f o r t a y c o m f o r t | a y i | + a ( + ) x c o m f o r t   ( a x i 0 )
a ( ) x i a ( ) x c o m f o r t a y c o m f o r t | a y i | + a ( ) x c o m f o r t   ( a x i < 0 )
The initial conditions:
s ( 0 ) = 0 ,     v ( 0 ) = v 0 ,     a ( 0 ) = a 0
The terminal conditions:
s ( t f ) = s T ,     v ( t f ) = v T ,     a ( t f ) = a T
In the above equations, h i is the duration of the time element between t i and t i 1 . t f indicates a terminal moment for the entire optimization process. The symbols s i and v d ( i ) denote the travel distance and the velocity of the vehicle during h i , respectively. a x i and a y i refer to the longitudinal and lateral accelerations equivalently, and j x i and j y i are the longitudinal and lateral jerks corresponding to the vehicle accelerations. s ( 0 ) and s ( t f ) are the initial and terminal states of the travel distance of the vehicle, respectively. v ( 0 ) and v ( t f ) denote the initial and terminal states of the velocity, respectively, whereas a ( 0 ) and a ( t f ) respectively refer to the initial state of the velocity and the terminal condition of the acceleration for the optimization.
The longitudinal–lateral acceleration constraints are the definition of the dependent relationship between the lateral and longitudinal acceleration when they occur at the same time. To simplify, this optimization assumes a piecewise linear relationship between the longitudinal and lateral acceleration, similar to a rhomboid shape, by using Equations (19) and (20).
The goal of this optimization problem is to obtain v d ( i ) that minimizes the summation of time duration h i while satisfying all of the above constraints, including the comfort criteria Equation (18). The proposed discrete time optimization problem was solved with the “A Mathematical Programming Language” (AMPL), using the interior-point-optimizer (IPOPT) solver [31,32]. This study exploited the AMPL package because it is extensively used in nonlinear optimization problems. Additionally, in this study, the discrete velocity solution was linearly interpolated.

5. Software-in-the-Loop (SIL) Simulations

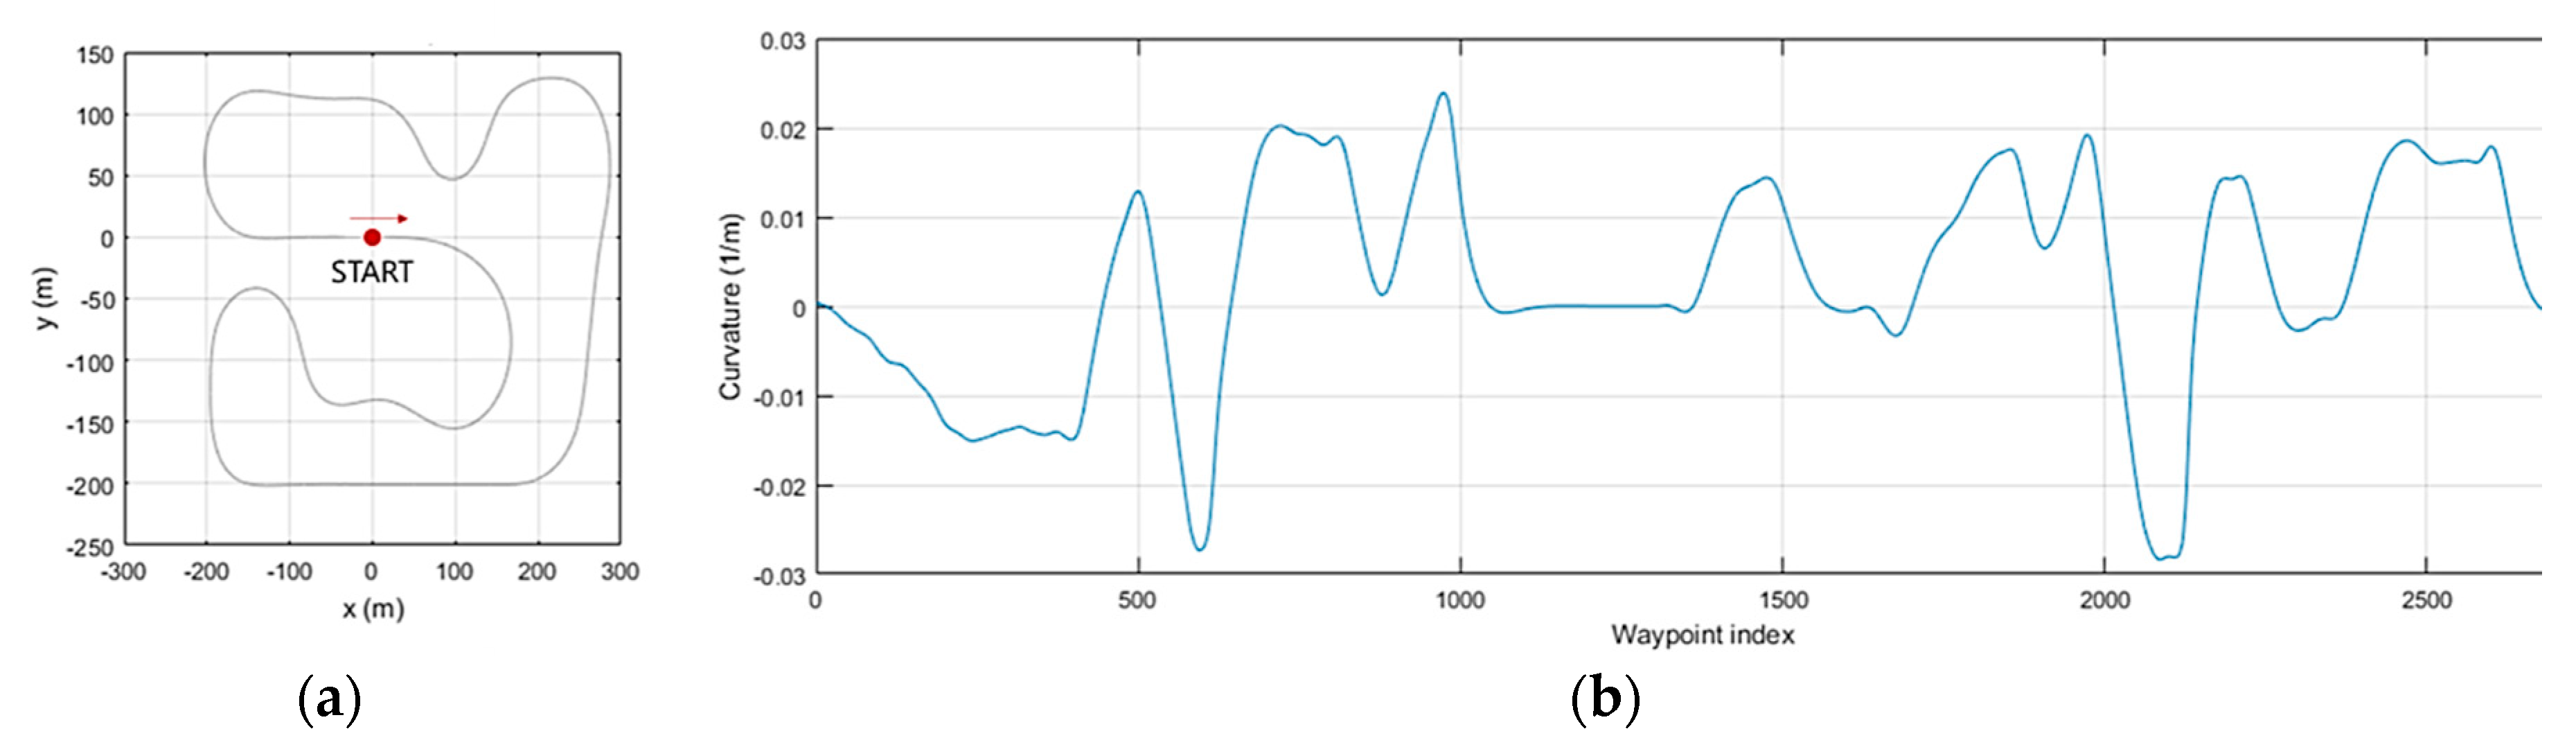
5.1. Simulation Environment

To validate the feasibility of the optimization and controller, SIL environments were developed, as represented by the block diagram of Figure 6.
The reference path block transmits the waypoints and curvature information; next, Matlab block calculates the time-optimal velocity profile as a desired state, with regard to the given comfort, acceleration, and jerk parameters. Lateral and longitudinal controllers were implemented by Simulink, and this module interacts with the car simulator (CarSim) block for the control commands. Moreover, the measured state vector of the vehicle is updated at the Simulink block for feedback control. CarSim is a well-known, real-time software used for simulations of vehicular dynamics [24]. We utilized a typical SIL test framework supported by CarSim to validate the feasibilities for the vehicle control and the planning method [33,34].
Figure 7 shows a test track of 2.4 kilometers provided by the CarSim as a default map. This course is useful for the validation of the path tracking control and a planning strategy on a road with various curvatures. The controllable front steering range in the simulated vehicle was bounded within ±32°, and the maximum steering rate was limited by ±10 deg/s for the non-holonomic constraints. The vehicle model and simulation parameters are presented in Table 1, including the comfortable acceleration and jerk criteria. As the curvature is infinite in the straight section of the given path, the maximum allowed speed is limited to under 80 km/h.
In this study, vehicle simulations were conducted for two cases: (1) a conventional rule-based approach, which considered the curvature of the path constraints as suggested in Section 4.1, and (2) the proposed IPM-based minimum time optimization method regarding vehicle kinematics that is described in Section 4.2. We compared the performances for the comfort criterion through plots of a GG diagram and velocity profiles for the simulated vehicle. The entire optimization process was conducted using an Intel core i5-9400F processor with 16 GB memory. In this case, the computational time spent to obtain the desired velocity profile v d ( i ) was approximately 80 ms.

5.2. Results and Discussions

The GG diagram is the XY plot of the longitudinal and lateral g-forces. It can be used for several practical purposes, one of which is defining the performance envelope of a car. The car envelopes can be used as a basis for comparing the overall performances of the car. In addition, the GG diagram can represent significant information regarding the motion of a car and driving in transitional areas [19,35]. In this study, the axes units are in m/s2 instead of using a normalized acceleration scale that uses gravity units. For both simulations, the performance envelope of the maximum longitudinal acceleration and deceleration of the test vehicle was limited by |1.0 m/s2|.
The public transportation region for a comfortable driving strategy is represented by the blue region on the GG diagrams in Figure 8 and Figure 9; the comfort zone is modeled as a rhombic shape by connecting each interception point with the x- and y-axes with straight lines using Equations (19) and (20). This considers the lower and upper bounds of accelerations within |0.9 m/s2|, i.e., approximately 9.2% of the g-force of the earth. If the trajectory of the GG diagram is in the rhomboid-shaped box, it meets the proposed comfort driving criteria; others are denoted as out of criteria.
Figure 8 displays the autonomous driving simulation results with the conventional rule-based method for global velocity planning when a y e x p e c t e d is set by |0.9 m/s2| as a same lateral acceleration parameter of Table 1. According to the GG diagram of Figure 8, the given acceleration criterion cannot be satisfied in the entire path because the velocity controller and performance envelop of the vehicle does not correspond with the desired velocity to a sufficient slowdown while approaching the curved road. In other words, this desired velocity profile is not a suitable planning strategy for solving the curve negotiation problem.
The proposed optimization method represented in Figure 9 shows a relatively better performance, satisfying the comfort acceleration and jerk criteria in contrast with the results of the conventional method shown in Figure 8. Although most of the simulated longitudinal velocity values did not surpass the boundary value in Figure 9b, some of the lateral acceleration values were located outside the boundaries set by the criterion in Figure 9a. A total of 88.3% of the sampled data was inside the given acceleration criteria, and all sampling points of the g-force and others were close to the given acceleration boundaries. The magnitude of the error was less than 0.1 m/s2, which indicates the acceleration of approximately 1/100 level of the earth gravity. The response delay of the velocity PD controller was the main reason for data points to be outside the borderline, especially for cases when the vehicle approached curvy sections of the test course. To improve the performance of the system, a faster response time for the overall control system is required.
Although the proposed system could not completely ensure vehicle drove in compliance with the set comfort criterion throughout the entire driving path, the values that were outside the border were not far from the set criterion margins. If the delay term between the velocity PD controller and the desired velocity profile is considered and optimized, the performance of comfort driving could be improved.
Although the propulsion system of autonomous vehicles was not mentioned in this work, the authors did not think that propulsion or drive train is significantly related to the comfort of a self-driving shuttle bus operating in urban regions. Complete implementation of a comfortable shuttle bus in consideration of all parameters of vehicle dynamics and influences of drivetrain is a potential further work of the study.

6. Conclusions

This study proposed comfort driving criteria using accelerations and jerks of self-driving public transit vehicles to improve the experience of passengers and to provide sustainable driverless shuttle service. For this purpose, this study not only investigates comfort in terms of vehicle accelerations and jerks but also recommends the proper acceleration and jerk criteria for a self-driving and planning strategy.
The overall controller and planning method were verified based on a real-time SIL test, and the performance was compared with a typical planning approach. The proposed optimized planning shows a relatively better performance and enables a comfortable passenger experience in a self-driving shuttle bus according to the recommended criteria.
As a future study, we will deploy self-driving shuttle service by applying the proposed planning strategy. Furthermore, the proposed method will be verified by a comparative analysis between the operation of a human driver and automated driving in terms of the comfort of the driving experienced by passengers.

Author Contributions

I.B. designed this study, implemented the methodology and drafted the manuscript. J.M. participated in formulating the idea as well as validating the proposed method and results. J.S. supported the overall research and reviewed the manuscript. All authors read and approved the final manuscript.

Funding

This work was supported by Institute of Information & Communications Technology Planning & Evaluation (IITP) grant funded by the Korea government (MSIT) (No. 2019-0-00399, Development of A.I. based recognition, judgement and control solution for autonomous vehicle corresponding to atypical driving environment).

Conflicts of Interest

The authors declare no conflict of interest.

References

  1. Thrun, S.; Montemerlo, M.; Dahlkamp, H.; Stavens, D.; Aron, A.; Diebel, J.; Fong, P.; Gale, J.; Halpenny, M.; Hoffmann, G.; et al. Stanley: The robot that won the DARPA Grand Challenge. J. Field Robot. 2006, 23, 661–692. [Google Scholar] [CrossRef]
  2. Bojarski, M.; Del Testa, D.; Dworakowski, D.; Firner, B.; Flepp, B.; Goyal, P.; Jackel, L.D.; Monfort, M.; Muller, U.; Zhang, J.; et al. End to end learning for self-driving cars. arXiv 2016, arXiv:1604.07316. [Google Scholar]
  3. Spielberg, N.A.; Brown, M.; Kapania, N.R.; Kegelman, J.C.; Gerdes, J.C. Neural network vehicle models for high-performance automated driving. Sci. Robot. 2019, 4, eaaw1975. [Google Scholar] [CrossRef]
  4. Kim, M.S.; Kim, K.W.; Yoo, W.S. Method to objectively evaluate subjective ratings of ride comfort. Int. J. Automot. Technol. 2011, 12, 831–837. [Google Scholar] [CrossRef]
  5. Kyriakidis, M.; de Winter, J.C.; Stanton, N.; Bellet, T.; van Arem, B.; Brookhuis, K.; Martens, M.H.; Bengler, K.; Andersson, J.; Merat, N.; et al. A human factors perspective on automated driving. Theor. Issues Ergon. Sci. 2019, 20, 223–249. [Google Scholar] [CrossRef]
  6. Hartwich, F.; Beggiato, M.; Krems, J.F. Driving comfort, enjoyment and acceptance of automated driving-effects of drivers’ age and driving style familiarity. Ergonomics 2018, 61, 1017–1032. [Google Scholar] [CrossRef]
  7. Elbanhawi, M.; Simic, M.; Jazar, R. In the Passenger Seat: Investigating Ride Comfort Measures in Autonomous Cars. IEEE Intell. Transp. Syst. Mag. 2015, 7, 4–17. [Google Scholar] [CrossRef]
  8. Salonen, A.; Haavisto, N. Towards Autonomous Transportation. Passengers’ Experiences, Perceptions and Feelings in a Driverless Shuttle Bus in Finland. Sustainability 2019, 11, 588. [Google Scholar] [CrossRef]
  9. Salonen, A.O. Passenger’s subjective traffic safety, in-vehicle security and emergency management in the driverless shuttle bus in Finland. Transp. Policy 2018, 61, 106–110. [Google Scholar] [CrossRef]
  10. Turner, M.; Griffin, M.J. Motion sickness in public road transport: The effect of driver, route and vehicle. Ergonomics 1999, 42, 1646–1664. [Google Scholar] [CrossRef]
  11. Svensson, L.; Eriksson, J. Tuning for ride quality in autonomous vehicle: Application to linear quadratic path planning algorithm. Dissertation, Uppsala University, Uppsala, Sweden, 2015. [Google Scholar]
  12. Diels, C. Will autonomous vehicles make us sick? In Contemporary Ergonomics and Human Factors 2014; CRC Press: Boca Raton, FL, USA, 2014; pp. 301–307. [Google Scholar]
  13. Park, Y.; Ha, H.-K. Analysis of the impact of high-speed railroad service on air transport demand. Transp. Res. Part E Logist. Transp. Rev. 2006, 42, 95–104. [Google Scholar] [CrossRef]
  14. Kilinç, A.S.; Baybura, T. Determination of minimum horizontal curve radius used in the design of transportation structures, depending on the limit value of comfort criterion lateral jerk. In Proceedings of the TS06G-Engineering Surveying, Machine Control and Guidance, Rome, Italy, 6–10 May 2012. [Google Scholar]
  15. Martin, D.; Litwhiler, D.H. An Investigation of acceleration and jerk profiles of public transportation vehicles. In Proceedings of the ASEE Annual Conference and Exposition, Pittsburgh, PA, USA, 22–25 June 2008. [Google Scholar]
  16. Fiero 2M4. Available online: http://ironduke7.tripod.com/corneringpower.htm (accessed on 1 July 2019).
  17. Sivak, M.; Schoettle, B. Motion Sickness in Self-Driving Vehicles; UMTRI: Ann Arbor, MI, USA, 2015. [Google Scholar]
  18. De Graaf, B.; Van Weperen, W. The Retention of Blance: An Exploratory Study into the Limits of Acceleration the Human Body Can Withstand without Losing Equilibrium. Hum. Factors J. Hum. Factors Ergon. Soc. 1997, 39, 111–118. [Google Scholar] [CrossRef]
  19. Bosetti, P.; Da Lio, M.; Saroldi, A. On the human control of vehicles: An experimental study of acceleration. Eur. Transp. Res. Rev. 2014, 6, 157–170. [Google Scholar] [CrossRef]
  20. Moon, S.; Yi, K. Human driving data-based design of a vehicle adaptive cruise control algorithm. Veh. Syst. Dyn. 2008, 46, 661–690. [Google Scholar] [CrossRef]
  21. Levison, W.H.; Campbell, J.L.; Kludt, K.; Bittner, A.C.; Potts, I.B.; Harwood, D.W.; Hutton, J.M.; Gilmore, D.K.; Howe, J.G.; Christos, J.P.; et al. Development of a Driver Vehicle Module (DVM) for the Interactive Highway Safety Design Model (IHSDM); United States Federal Highway Administration Office of Research and Technology Services: McLean, VA, USA, 2007.
  22. Kendall, J.; Solomon, K.A. Airbag deployment criteria: Institute of Risk & Safety Analyses. Forensic Exam. 2014. [Google Scholar]
  23. Sotelo, M.A. Lateral control strategy for autonomous steering of Ackerman-like vehicles. Robot. Auton. Syst. 2003, 45, 223–233. [Google Scholar] [CrossRef]
  24. Snider, J.M. Automatic Steering Methods for Autonomous Automobile Path Tracking; Robotics Institute: Pittsburgh, PA, USA, 2009; CMU-RITR-09-08. [Google Scholar]
  25. Bae, I.; Kim, J.H.; Kim, S. Steering rate controller based on curvature of trajectory for autonomous driving vehicles. In Proceedings of the IEEE Intelligent Vehicles Symposium (IV), Gold Coast, Australia, 23–26 June 2013; pp. 1381–1386. [Google Scholar]
  26. Rajamani, R. Vehicle Dynamics and Control; Springer Science & Business Media: Berlin, Germany, 2011. [Google Scholar]
  27. Jo, K.; Lee, M.; Kim, D.; Kim, J.; Jang, C.; Kim, E.; Kim, S.; Lee, D.; Kim, C.; Kim, S.; et al. Overall Reviews of Autonomous Vehicle A1—System Architecture and Algorithms. IFAC Proc. 2013, 46, 114–119. [Google Scholar] [CrossRef]
  28. Bae, I.; Moon, J.; Cha, J.; Kim, S. Integrated lateral and longitudinal control system for autonomous vehicles. In Proceedings of the 17th International IEEE Conference on Intelligent Transportation Systems (ITSC), Qingdao, China, 8–11 October 2014; pp. 406–411. [Google Scholar]
  29. Bosetti, P.; Da Lio, M.; Saroldi, A. On Curve Negotiation: From Driver Support to Automation. IEEE Trans. Intell. Transp. Syst. 2015, 16, 2082–2093. [Google Scholar] [CrossRef]
  30. Heimer, L.R. The Common Optimization Interface for Operations Research: Promoting open-source software in the operations research community. IBM J. Res. Dev. 2003, 47, 57–66. [Google Scholar] [CrossRef]
  31. Wächter, A.; Biegler, L.T. On the implementation of an interior-point filter line-search algorithm for large-scale nonlinear programming. Math. Program. 2006, 106, 25–57. [Google Scholar] [CrossRef]
  32. Fourer, R.; Gay, D.M.; Kernighan, B.W. AMPL. A Modeling Language for Mathematical Programming; Cengage: Boston, MA, USA, 2013. [Google Scholar]
  33. Chen, X.; Salem, M.; Das, T.; Chen, X. Real Time Software-in-the-Loop Simulation for Control Performance Validation. Simulation 2008, 84, 457–471. [Google Scholar] [CrossRef]
  34. Li, S.E.; Deng, K.; Li, K.; Ahn, C. Terminal sliding mode control of automated car-following system without reliance on longitudinal acceleration information. Mechatronics 2015, 30, 327–337. [Google Scholar] [CrossRef]
  35. Eboli, L.; Mazzulla, G.; Pungillo, G. Combining speed and acceleration to define car users’ safe or unsafe driving behaviour. Transp. Res. Part C Emerg. Technol. 2016, 68, 113–125. [Google Scholar] [CrossRef]
Figure 1. (a) Electric shuttle bus (BJ6650EVCA-2) manufactured by Foton Motor Co. used in this study, and (b) sketch of the vehicle with notation of movements, forces, and dimensional specifications.
Electronics 08 00943 g001
Figure 2. Typical acceleration and jerk criteria for public transportation, and typical criteria of normal, aggressive, and extremely aggressive drivers reported in prior studies [7,10,11,12,13,14,15,16,17,18,19,20,21,22].
Electronics 08 00943 g002
Figure 3. Two degree-of-freedom (DOF) bicycle kinematic model and lateral control parameters.
Electronics 08 00943 g003
Figure 4. Closed-loop system for the longitudinal velocity control.
Electronics 08 00943 g004
Figure 5. Simulation of the proposed longitudinal proportional-derivative (PD) control.
Electronics 08 00943 g005
Figure 6. Software-in-the-loop (SIL) environment for a real-time vehicle dynamics simulation.
Electronics 08 00943 g006
Figure 7. (a) Reference path and (b) curvature information which had been calculated with regular intervals by 0.8 m for the SIL test.
Electronics 08 00943 g007
Figure 8. Simulation results of the path following control with the conventional velocity planning set by a y e x p e c t e d = | 0.9   m / s 2 | , (a) GG diagram and (b) velocity profiles during SIL test.
Electronics 08 00943 g008
Figure 9. Simulation results of the path following control with the proposed optimized velocity planning which is set by Table 1 parameters, (a) GG diagram and (b) velocity profiles during SIL test.
Electronics 08 00943 g009
Table 1. Parameters for the software-in-the-loop (SIL) test.
ParametersNotationValue (Unit)
Initial state s ( 0 ) , v ( 0 ) , a ( 0 ) 0 (km), 10 (m/s), 0 (m/s2)
Terminal state s ( t f ) , v ( t f ) , a ( t f ) 2.4 (km), 10 (m/s), 0 (m/s2)
Max. allowed speed of path V m a x 80 (km/h)
Front-C.G. distance l f 2.0 (m)
Rear-C.G. distance l r 1.9 (m)
Longitudinal acc. constraint a ( + ) x c o m f o r t 0.9 (m/s2)
Longitudinal de-acc. constraint a ( ) x c o m f o r t −0.9 (m/s2)
Lateral acc. constraint| a y c o m f o r t |0.9 (m/s2)
Longitudinal jerk constraint| j x c o m f o r t |0.6 (m/s3)
Lateral jerk constraint| j y c o m f o r t |0.6 (m/s3)

