Article

Method for Determining Starting Point of Rolling Bearing Life Prediction Based on Linear Regression

1
School of Electrical Engineering and Automation, Henan Polytechnic University, Jiaozuo 454000, China
2
Sany Truck Lifting Machinery Co., Ltd, Changsha 410600, China
3
College of Electrical Engineering, Zhengzhou University, Zhengzhou 450001, China
4
Department of Electrical Engineering and Electronics, University of Liverpool, Liverpool L69 3BX, UK
*
Author to whom correspondence should be addressed.
Electronics 2019, 8(9), 923; https://doi.org/10.3390/electronics8090923
Submission received: 4 August 2019 / Revised: 21 August 2019 / Accepted: 21 August 2019 / Published: 22 August 2019
(This article belongs to the Section Systems & Control Engineering)

Abstract

:
Aimed at addressing the problem that the subjective selection of start prediction time (SPT) in rolling bearing remaining useful life (RUL) prediction will lead to excessive noise in the prediction signal, a linear-regression-based SPT point determination was proposed. The sliding window linear regression method was used to establish sliding windows in the root mean square (RMS) range to obtain the RMS gradient domain. The threshold for the RMS gradient was set, and the continuous trigger threshold mechanism to determine the SPT point was used. The experimental results show that the linear-regression-based method can adaptively determine the SPT point and improve the accuracy of life prediction.

1. Introduction

Due to their high mechanical efficiency, low friction coefficient, and excellent starting performance, rolling bearings are widely used in rotating machinery, such as wind turbines [1,2]. Affected by the working environment, working load, material aging, and other factors, the performance of rolling bearings will deteriorate with the passage of time and ultimately lead to the failure of rolling bearings. Once the rolling bearing fails, it may cause the failure of the whole machine. The remaining useful life (RUL) prediction of rolling bearings can provide bearing life information for timely maintenance and reduce operation risk. The start prediction time (SPT) point has a great influence on the RUL prediction results of rolling bearings. A prediction in their normal state will lead to low prediction accuracy, and it is meaningless to predict near failure.
There are many methods for predicting the RUL of rolling bearings [3,4,5,6,7,8], but there are few studies on the determination of the SPT point. Generally, the SPT point is determined by subjective factors [9,10]. A few studies have used their own methods to determine the SPT point. N. Li et al. [3] proposed a RUL prediction method for rolling bearings based on an improved exponential model. The method uses kurtosis to set the threshold and determine the SPT point. However, kurtosis is sensitive to random fluctuations in the signal, which makes it possible to determine the time point of the normal stage as the SPT point—the prediction error is large. B.S. Yang et al. [11] proposed an independent data-driven I-CBM platform method as a comprehensive monitoring system for rotating machinery. The platform uses a large number of statistical features to determine the SPT point for the RUL prediction of rotating machinery. However, the interaction between the statistical features makes the SPT point unstable and reduces the prediction accuracy of the RUL. A. Ginart et al. [12] used a large number of statistical features to determine the SPT point. The baselines of acceptance or rejection are created using the maximum time constant of the system based on various features, and then the SPT points are determined by selecting the least baseline. This method solves the problem of interaction between feature quantities. However, the setting of the baseline depends on the maximum time constant proposed by the author, which is related to engineering experience. W. Ahmad et al. [13] proposed a data-driven RUL prediction method for rolling bearings. This method makes use of the residual between the root mean square (RMS) of the rolling bearing vibration signal acquired in real time and the RMS of the rolling bearing vibration signal in the normal state to determine the SPT point. RUL prediction is performed once the RMS residuals are higher than the set threshold. However, random factors can cause RMS residuals to be higher than the threshold value in the normal state, which leads to premature RUL prediction. Therefore, this method is unreliable.
Aimed at addressing the problem of determining the starting point of rolling bearing life prediction, this paper presents an adaptive method for determining the starting point of rolling bearing life prediction based on linear regression. The rest of this paper is organized as follows: the degradation features are selected in Section 2; in Section 3, the starting prediction time (SPT) points are determined; Section 4 explains the simulation analysis of the proposed method; the effectiveness and accuracy of the proposed method is validated by experimental data in Section 5; and, finally, Section 6 draws the conclusions.

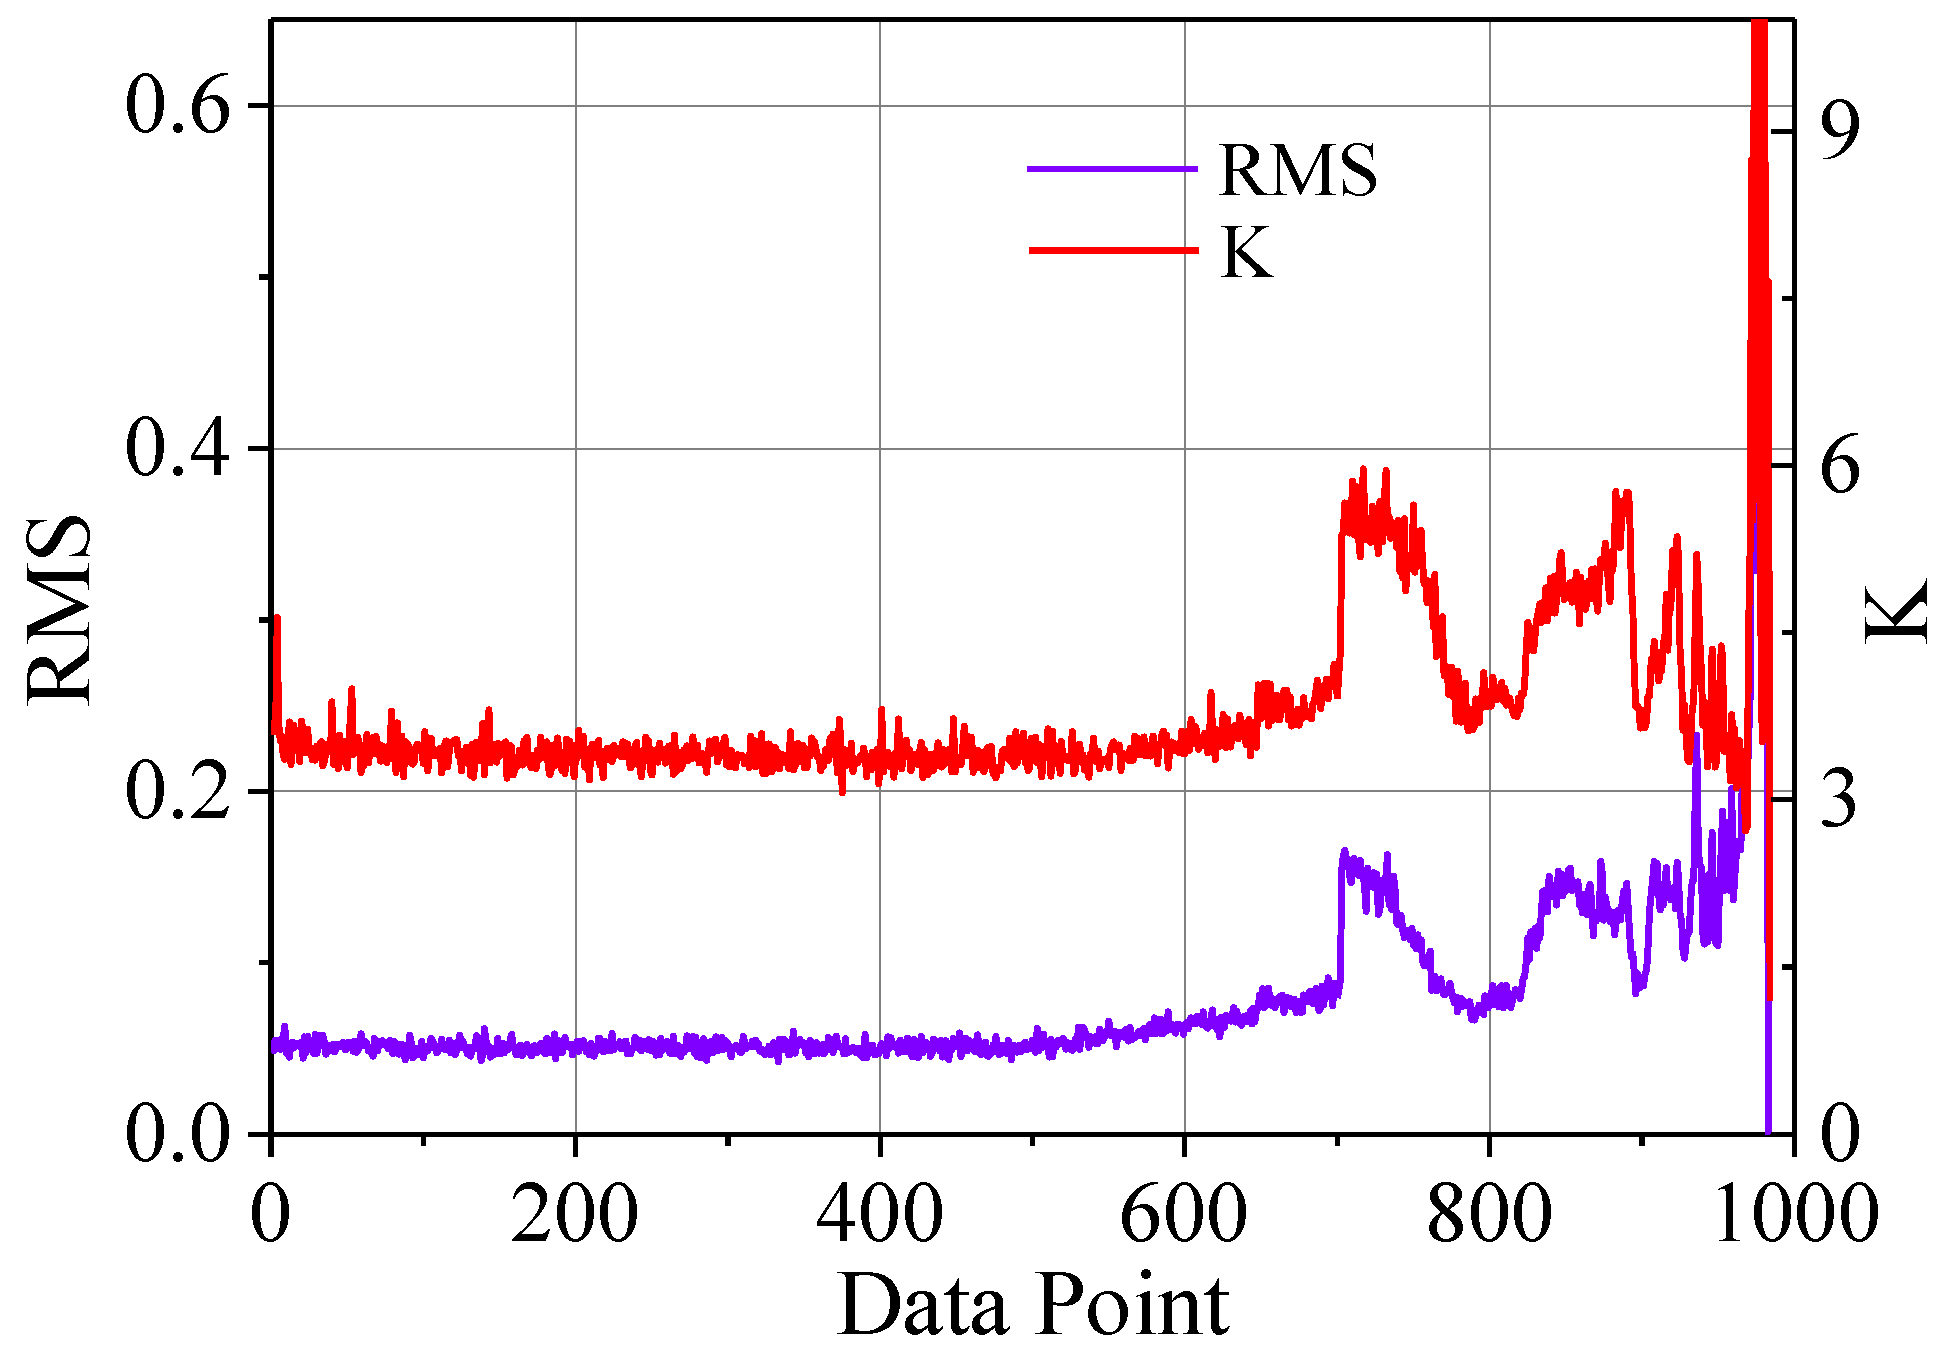
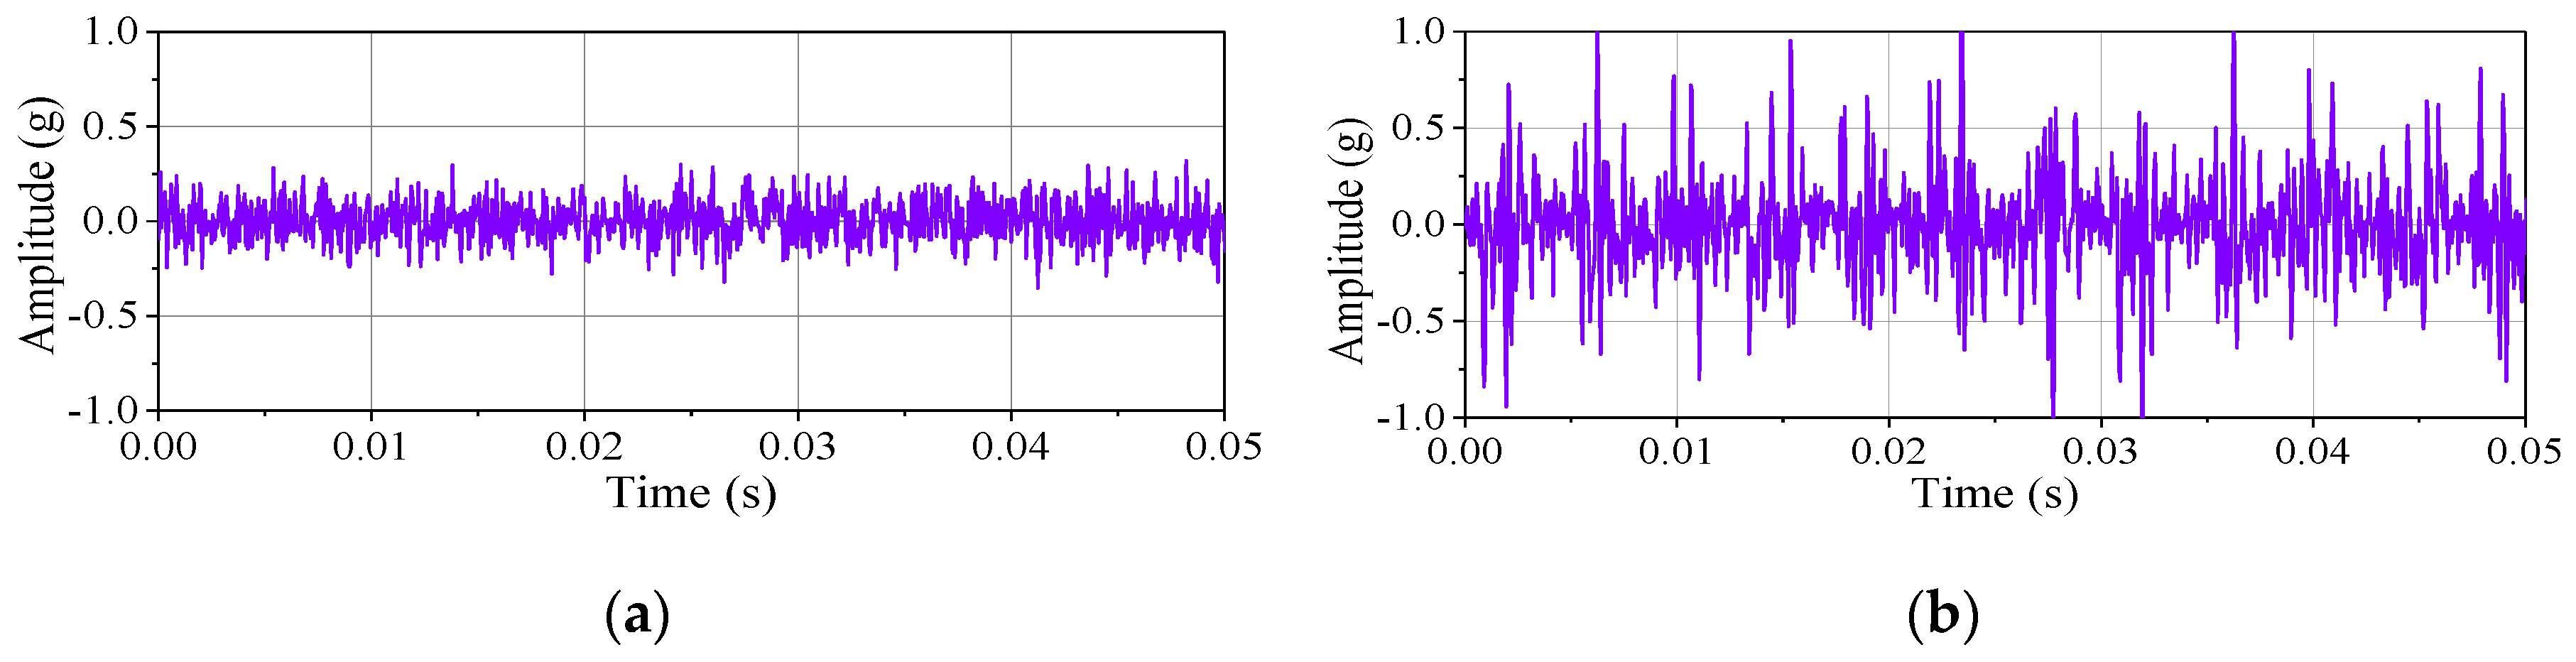
2. Selection of the Degradation Features

Degradation feature selection is a key step in rolling bearing life prediction. RMS and kurtosis were selected as the degradation features in this paper. The RMS reflects the magnitude of vibration energy and is especially suitable for reflecting the slow wear damage of rolling bearings over time. Kurtosis is sensitive to the impact caused by the performance degradation of rolling bearings, which can effectively reflect whether the rolling bearings are in the degradation stage or not. The trends of RMS and kurtosis are shown in Figure 1. The sampling interval of the experimental data used in this paper was 10 min. RMS and kurtosis can be calculated as
RMS = i = 1 n ( x i ) 2 n    
K = i = 1 n ( x i ) 4 n    
where RMS is the root mean square, K is kurtosis, i is the data point, n is the number of sampling points, and x i is the sampling signal.
As shown in Figure 1, the general trend of RMS and kurtosis values is the same. The obvious faults appeared at around 700 data points, indicating that the performance of rolling bearings had obviously degraded here. Kurtosis is sensitive to random fluctuation in the signal. The kurtosis fluctuation of rolling bearings in normal condition is larger than that of the RMS, which is not conducive to the determination of the SPT point. Therefore, RMS was selected as the basis for determining the SPT point in this paper.

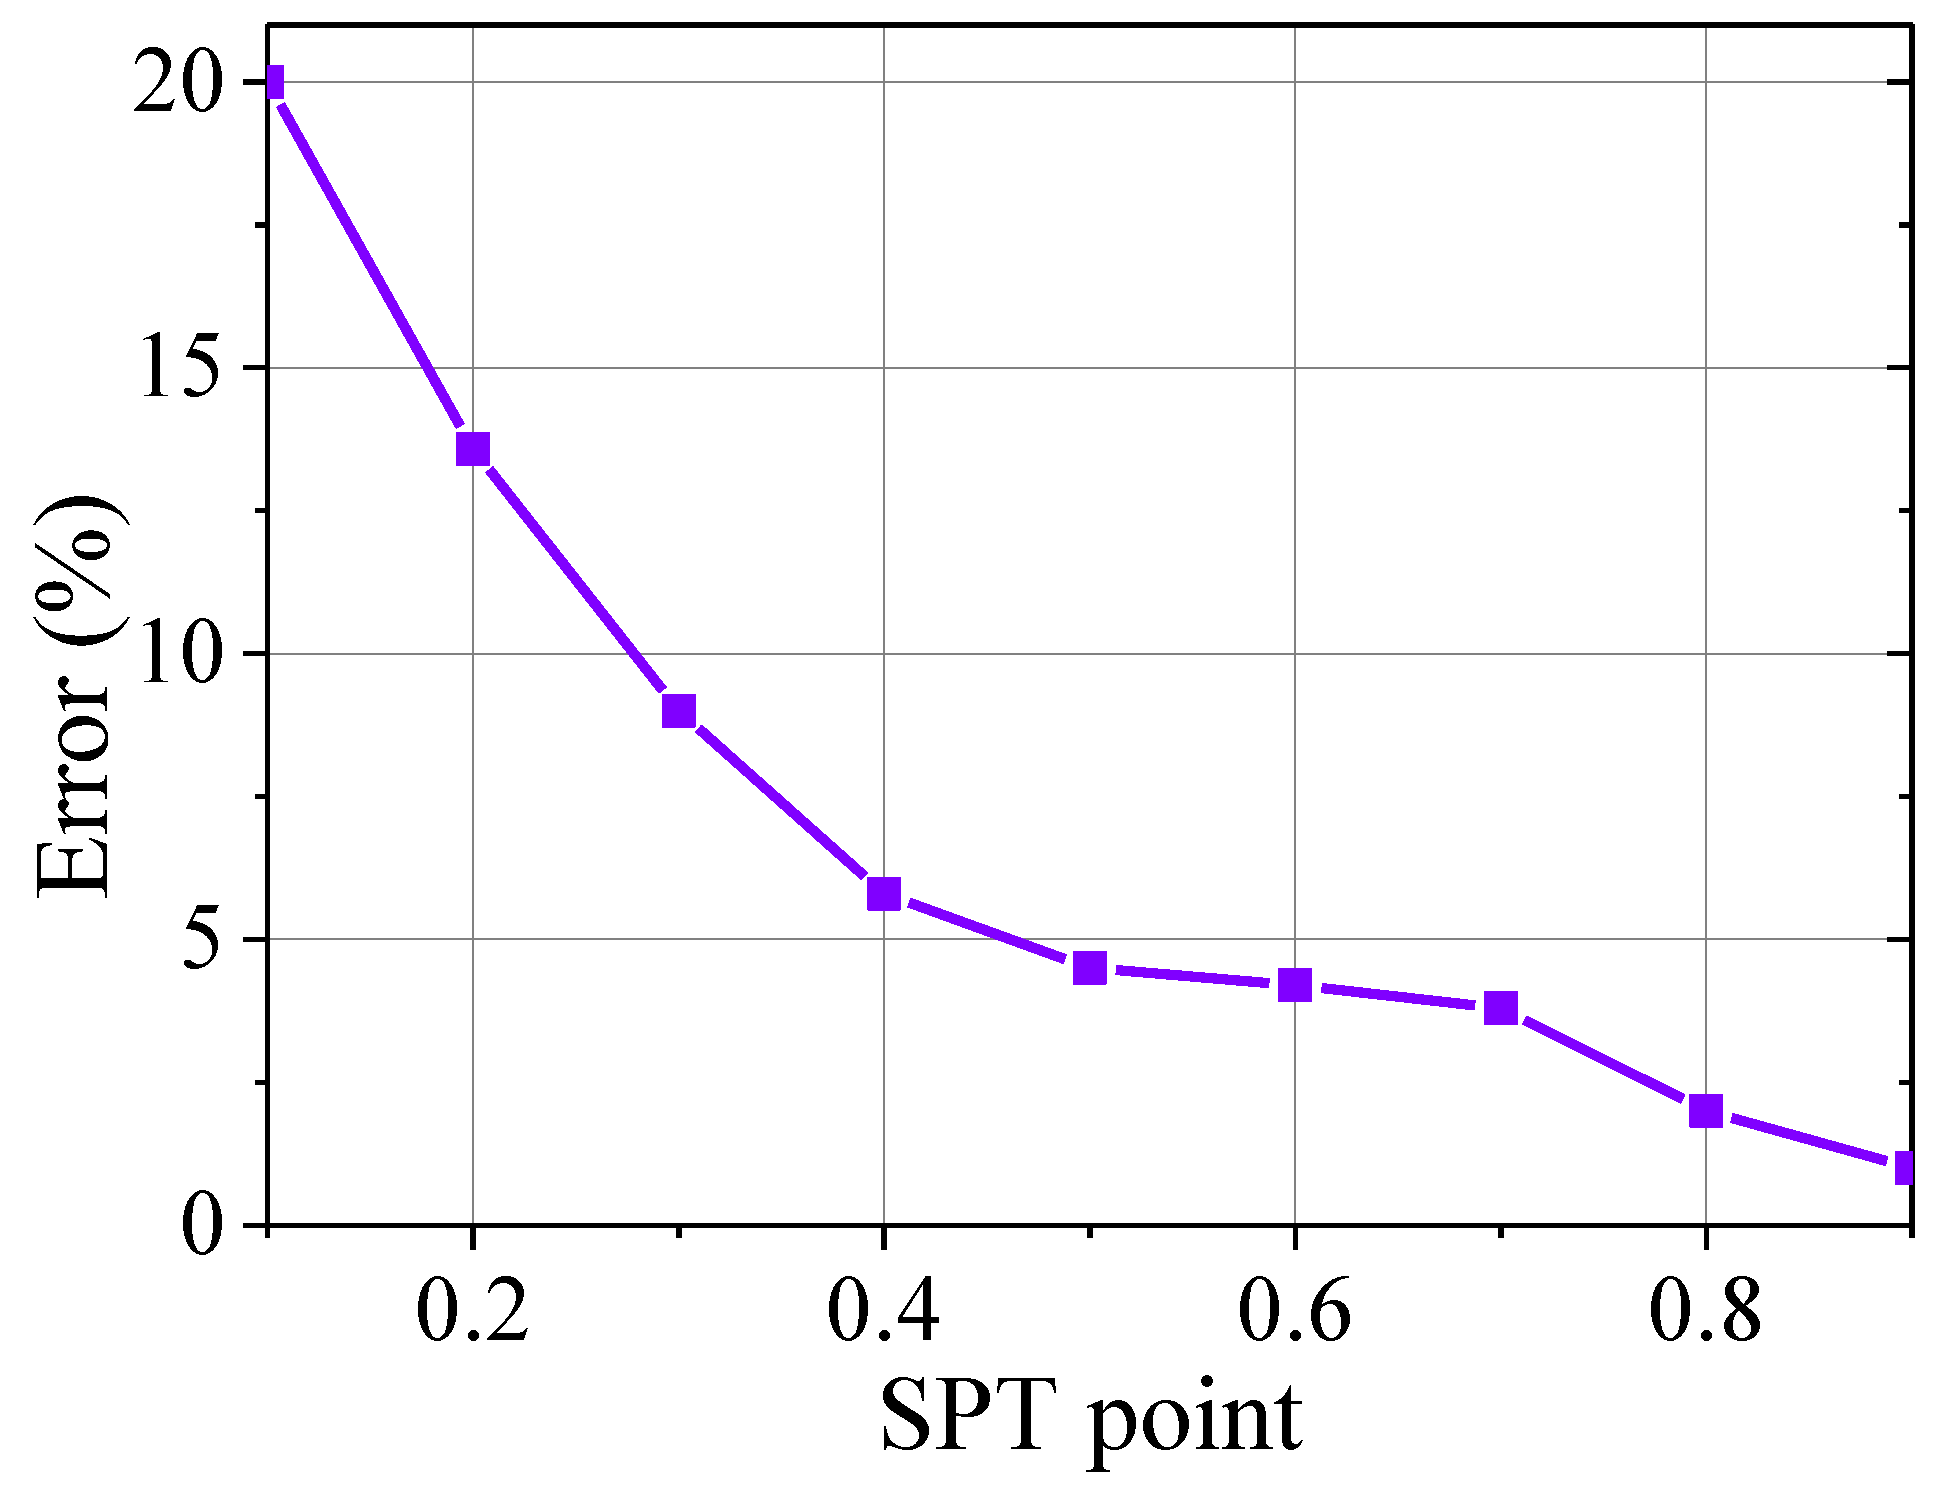
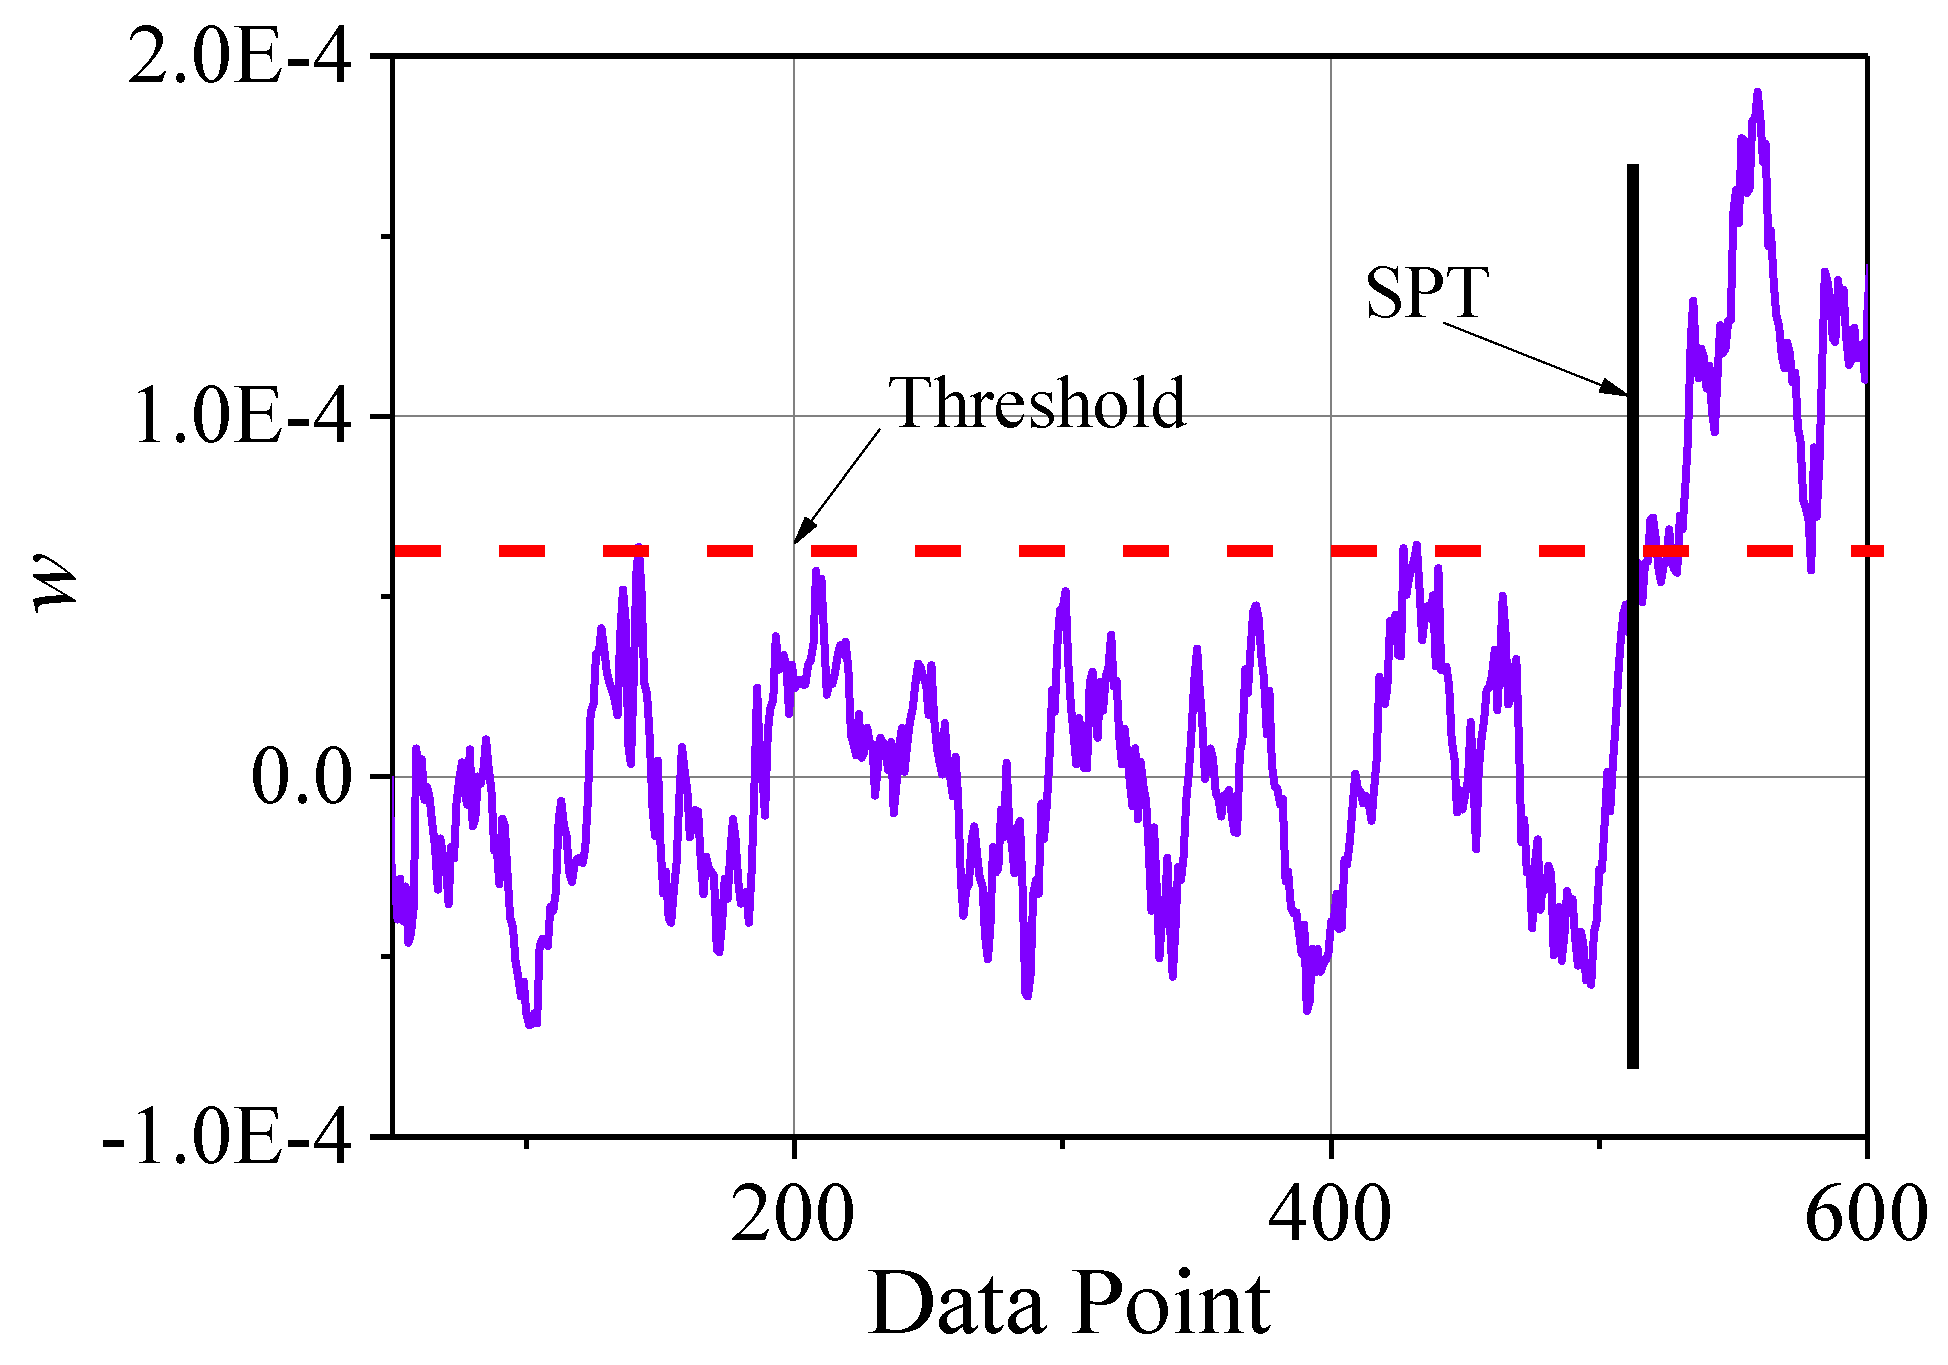
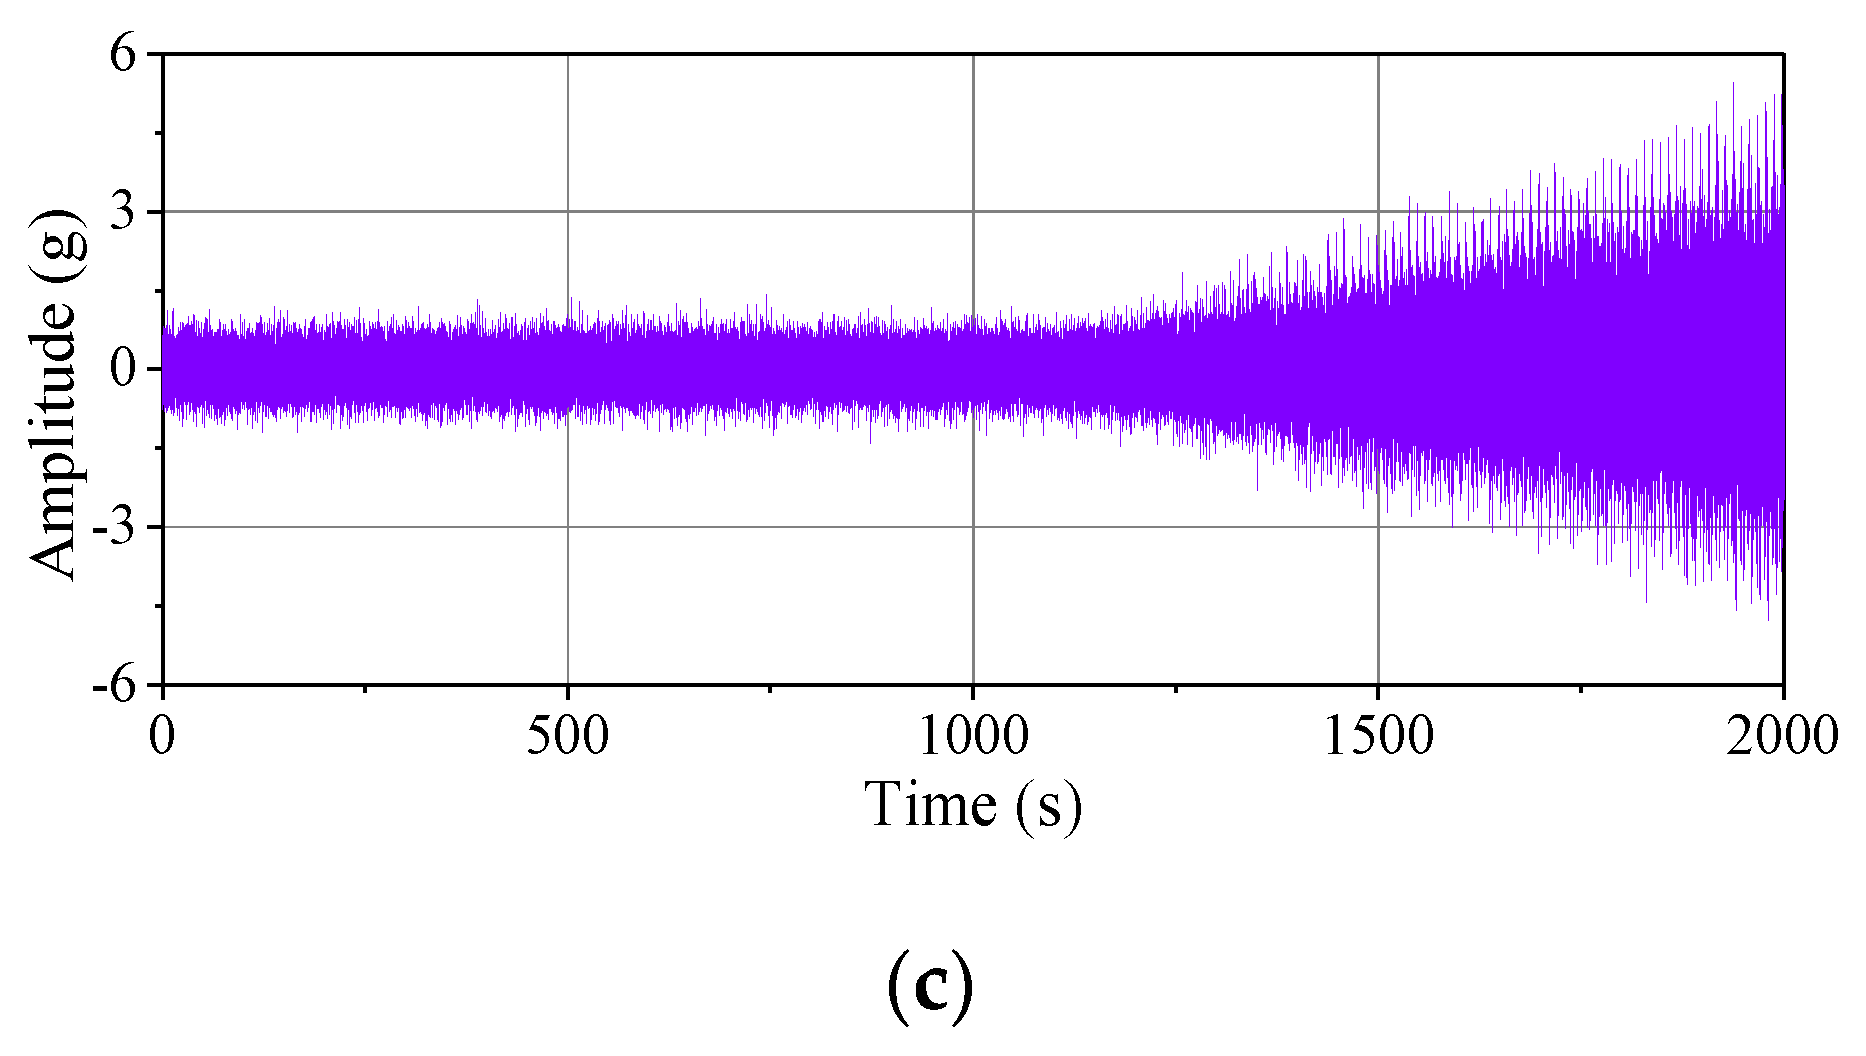
3. Determination of the Starting Prediction Time (SPT) Point

The SPT point is important to rolling bearing RUL prediction. Prediction in normal state will lead to low prediction accuracy, and it is meaningless to predict near failure. Therefore, it is necessary to determine the SPT point to predict the RUL of rolling bearings under certain prediction accuracy. The errors of different SPT point selection under neural network prediction are shown in Figure 2.
Figure 2 shows the full life data of rolling bearings published by the University of Cincinnati’s Intelligent Maintenance System Center [14]. The time span of the experiment was 164 hours. The SPT point represents the proportion of the time point for RUL prediction to the total running time (“SPT point = 0.1” means that the time point for RUL prediction is 16.4 hours). As shown in Figure 2, RUL prediction at an early stage can lead to excessive prediction errors. RUL prediction at a later stage is of high accuracy but of no practical significance. Furthermore, when the “SPT point = 0.5”, the error tends to be stable, indicating that there may be an initial point of performance degradation.

3.1. Mathematical Model of the Proposed Method

To find the initial point of performance degradation adaptively and predict the residual life of rolling bearings effectively, a sliding window linear regression method was proposed in this paper. This method establishes a window with size n in the RMS range (n is 50 in this paper) and fits a linear regression model for n RMS values. A new linear regression model is constructed by sliding a sampling point forward in the window. This method can be expressed as in [13]:
RMS = w t + b
w = t i RMS i t i RMS i n t i 2 ( t i ) 2 n
b = RMS i w t i n
where w denotes the gradient of the RMS relative to time t , b denotes the RMS of the starting time ( t   = 0), RMS i is the RMS corresponding to the data point ( 1 i n ), t i is the time corresponding to the data point ( 1 i n ), and n is the number of sampling points. The new gradient is obtained at each update window, and then the RMS gradient domain (w domain) is obtained.
The threshold method was used to determine the SPT point in this paper. When the rolling bearing is abnormal, the overall trend of the RMS is increased. However, due to the influence of random factors, the RMS leads to positive and negative changes. Therefore, the threshold value is established by the absolute value of w. The average and standard deviation of the absolute value of w are calculated from the normal operation data of the rolling bearing:
μ = | w 1 | + | w 2 | + + | w i | n
σ = 1 n i = 1 n ( w i μ ) 2
where μ and σ are the average and standard deviation of the absolute value of w in the normal running state of the rolling bearing, respectively, n is the number of sampling points, and w i is the value of w corresponding to the sample point ( 1 i n ).
The trigger mechanism of the proposed method can be expressed as
{ w x μ + 2 σ       trigger   warning w x < μ + 2 σ           normal   stage      
where wx is the gradient of the predicted signal RMS. The trigger warning may be caused by noise. A single trigger is not enough to judge whether the rolling bearings are in the stage of degradation. The principle of the SPT point determination method is shown in Figure 3.

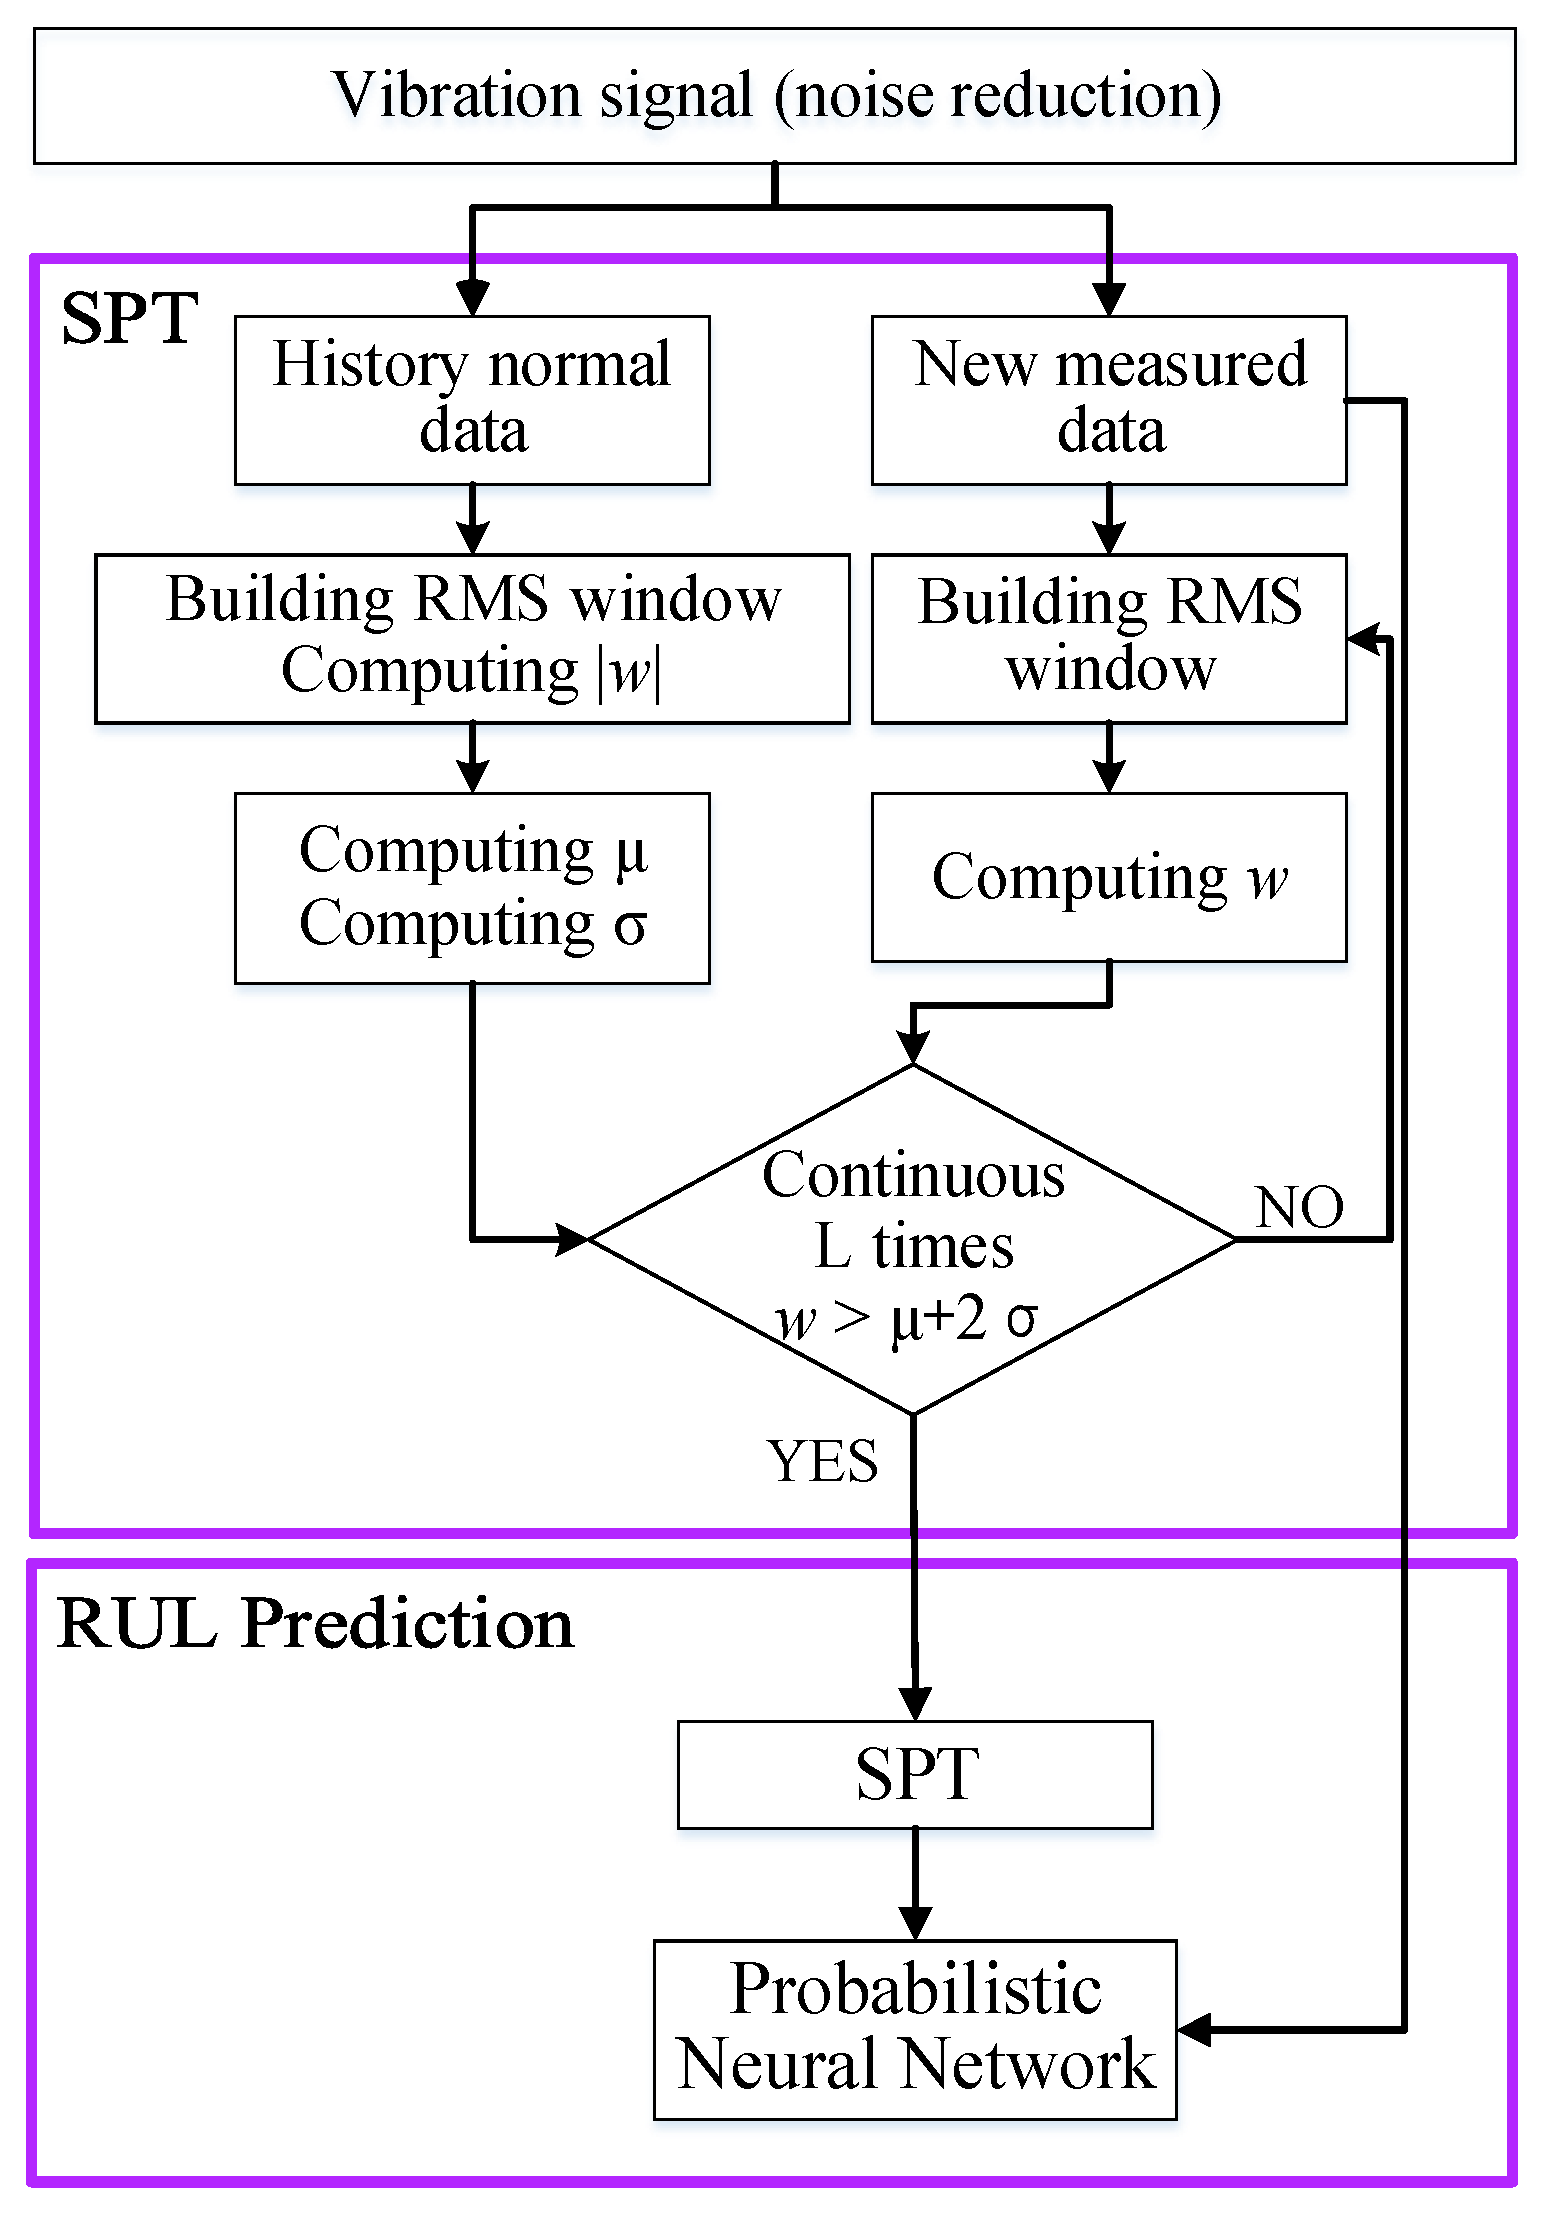
3.2. Prediction Process of RUL

The flowchart of the proposed method for predicting the RUL of rolling element bearings is shown in Figure 4. RUL prediction is divided into two parts—the determination of the SPT point and the prediction. This paper focuses on the determination of the SPT point.
As shown in Figure 4, the RMS domain of the historical normal stage data is calculated to select the appropriate threshold. Then, the gradient domain is computed by the sliding window linear regression method. The mean and standard deviation of the RMS gradient are calculated to obtain the threshold. The RUL prediction of rolling bearings can be carried out after calculating the threshold. The vibration signal of the rolling bearing during operation is collected, the RMS value is calculated, and then the RMS window to obtain w is constructed. If w is greater than the threshold for L consecutive times, the time point is determined to be the SPT point.

4. Simulation Analysis

To verify the validity of the proposed SPT point determination method, the improved rolling bearing degradation model proposed by Y.F. Wang et al. [15] was used for verification.
The parameters of the degraded rolling bearing model were as follows: the pitch diameter was 71.5 mm, the roller diameter was 8.4 mm, the number of rollers was 16, and the contact angle was 15.17°. The speed rolling bearing was 2000 rpm, and the running time was 2000 min. The sampling frequency was 20 kHz, the sampling was repeated every three minutes until the outer ring fault occurred, and the characteristic frequency of the fault was 235.4 Hz. The simulated vibration signal generated by the degradation model is shown in Figure 5.
The normal stage sample and degraded stage sample are shown in Figure 5a,b, respectively. To simulate the whole degradation process of the bearing, the signals were repeated 200 times, and Figure 5c shows the vibration signals of the whole lifetime.
According to the flowchart of Figure 4, the SPT point determination simulation experiment was carried out on the data of the vibration signals of the whole lifetime. The simulation results are shown in Figure 6.
As shown in Figure 6, the method presented in this paper determined the SPT point at the beginning of the degradation. The RMS increased gently at the beginning of the recession, and the RMS gradient increased more than RMS, which indicates that the RMS gradient is more sensitive to the initial degradation stage.

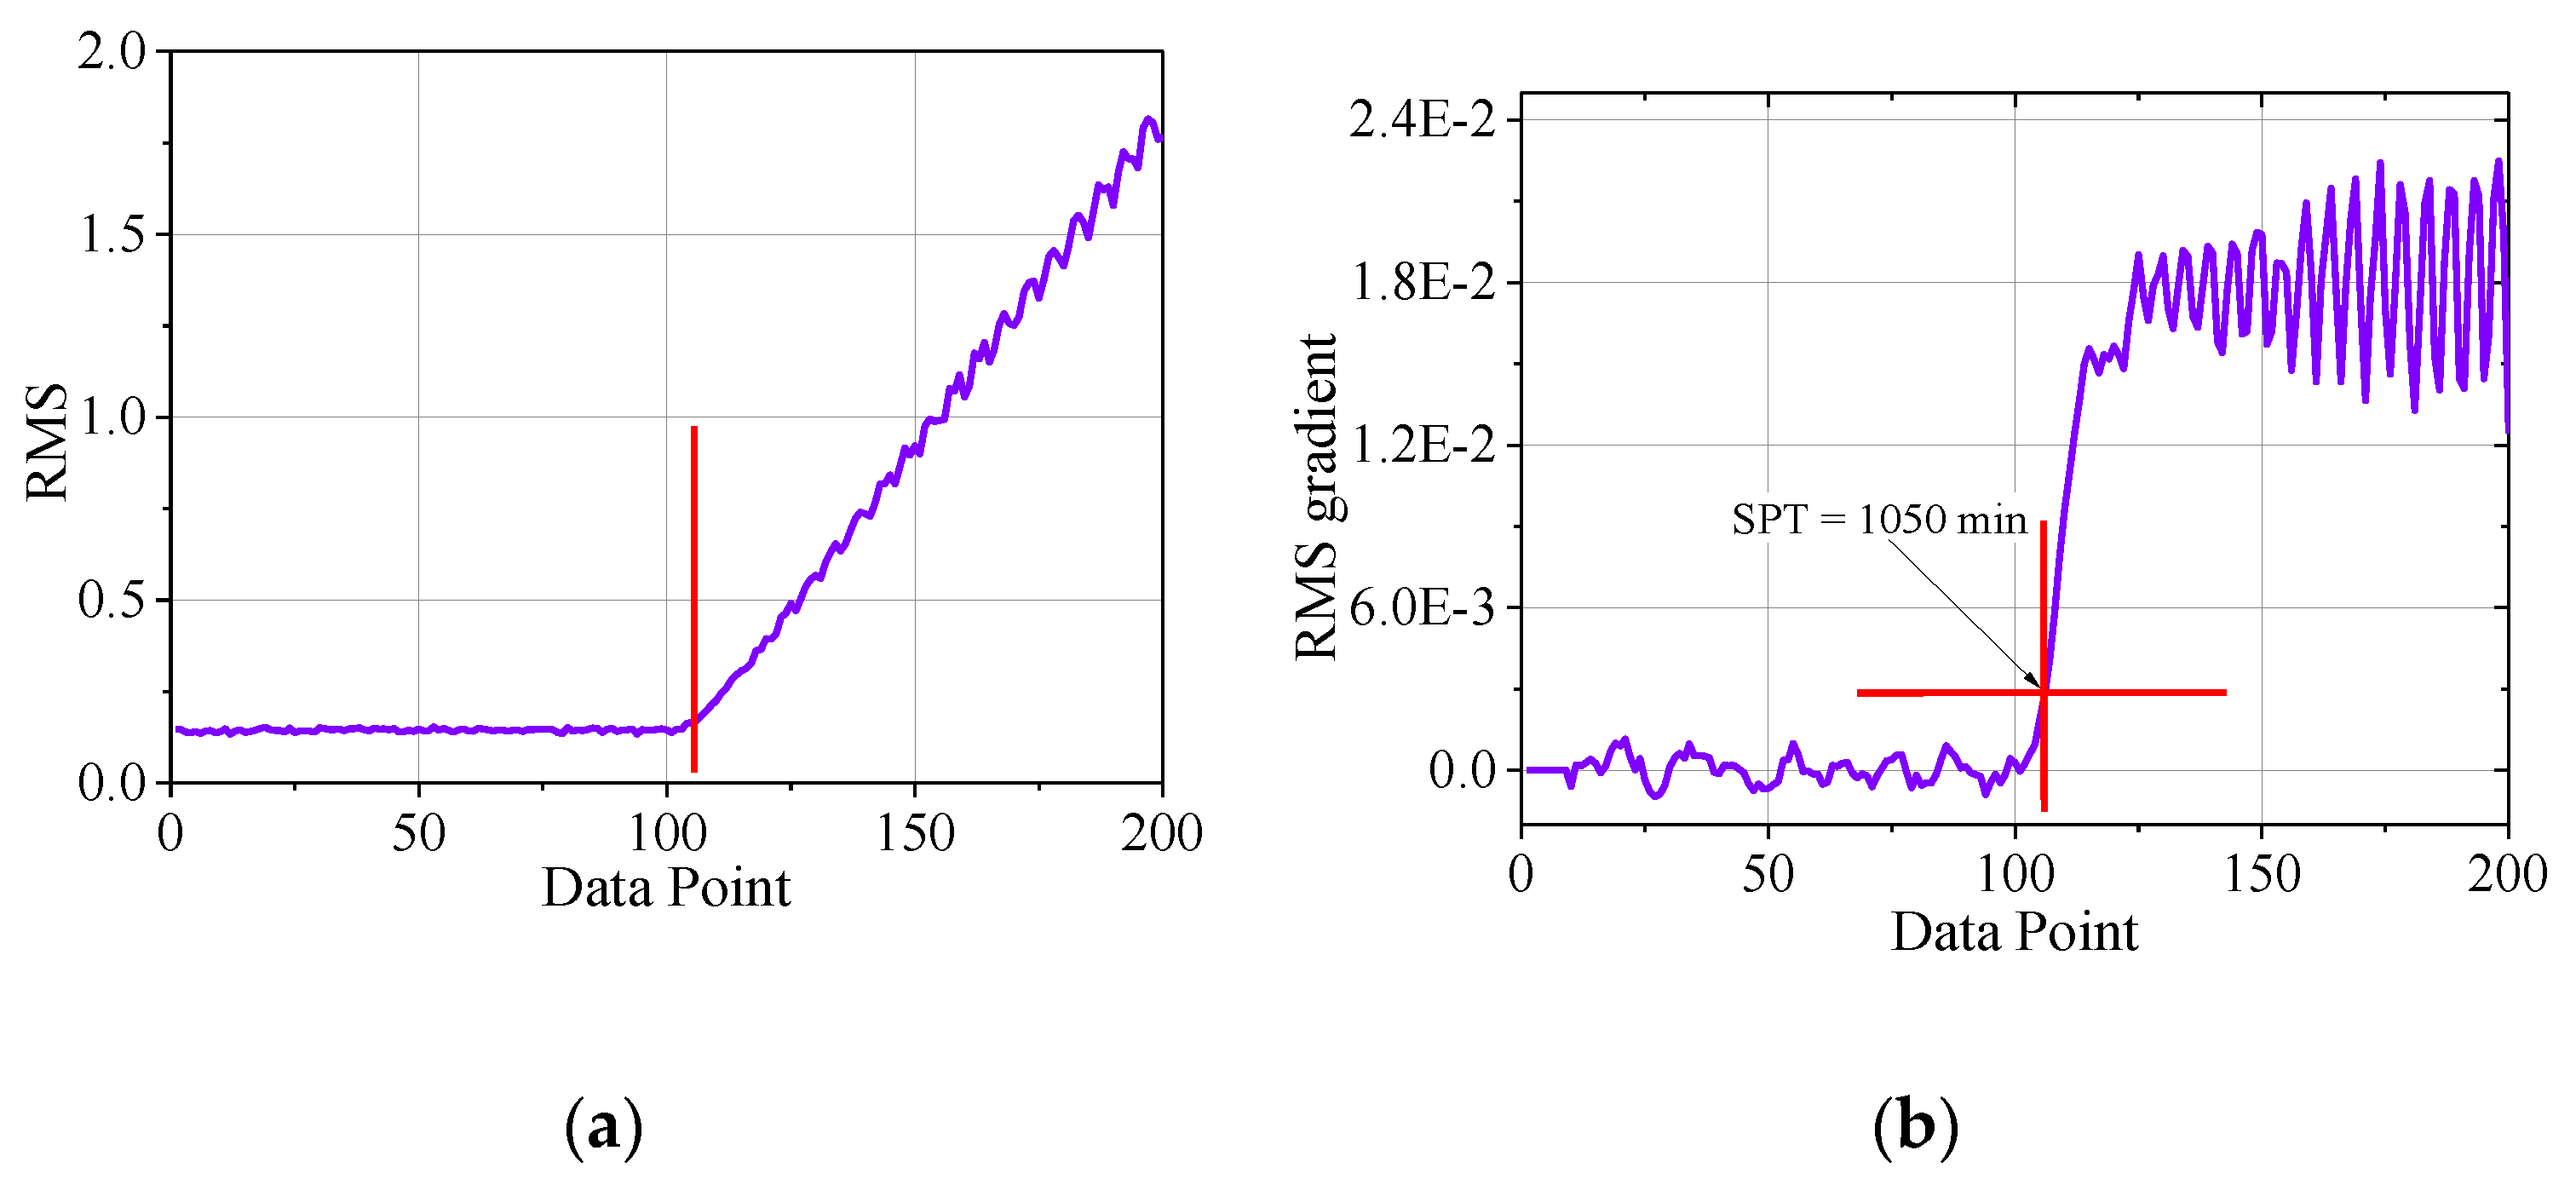
5. Experimental Validation

5.1. Experimental Data

The data used in this section are the data of the rolling bearings running to failure disclosed by the University of Cincinnati’s Intelligent Maintenance System Center. Four Rexnord ZA-2115 bearings were used in the experiment. The rotating speed of the bearing was kept at 2000 rpm. A 6000 lb radial force was applied on the tested bearings. The force was generated by a spring mechanism. The sampling frequency was 20 kHz. The sampling was repeated every 10 min. The Bearing 2 and Bearing 3 data of the first data set and Bearing 1 data of the second data set were used to validate the proposed method. The running times of Bearing 1, Bearing 2, and Bearing 3 were 21,560 min, 21,560 min and 9840 min, respectively. The fault types of Bearing 1, Bearing 2, and Bearing 3 were an inner ring fault, a rolling element fault, and an outer ring fault, respectively. The whole life vibration signals of the experimental bearings are shown in Figure 7.
As shown in Figure 7, the signal of Bearing 2 had greater interference in the period before bearing failure, and the amplitude of interference is obviously larger than that of failure. The maximum amplitude of Bearing 1 and Bearing 3 occurred in the moment of failure.

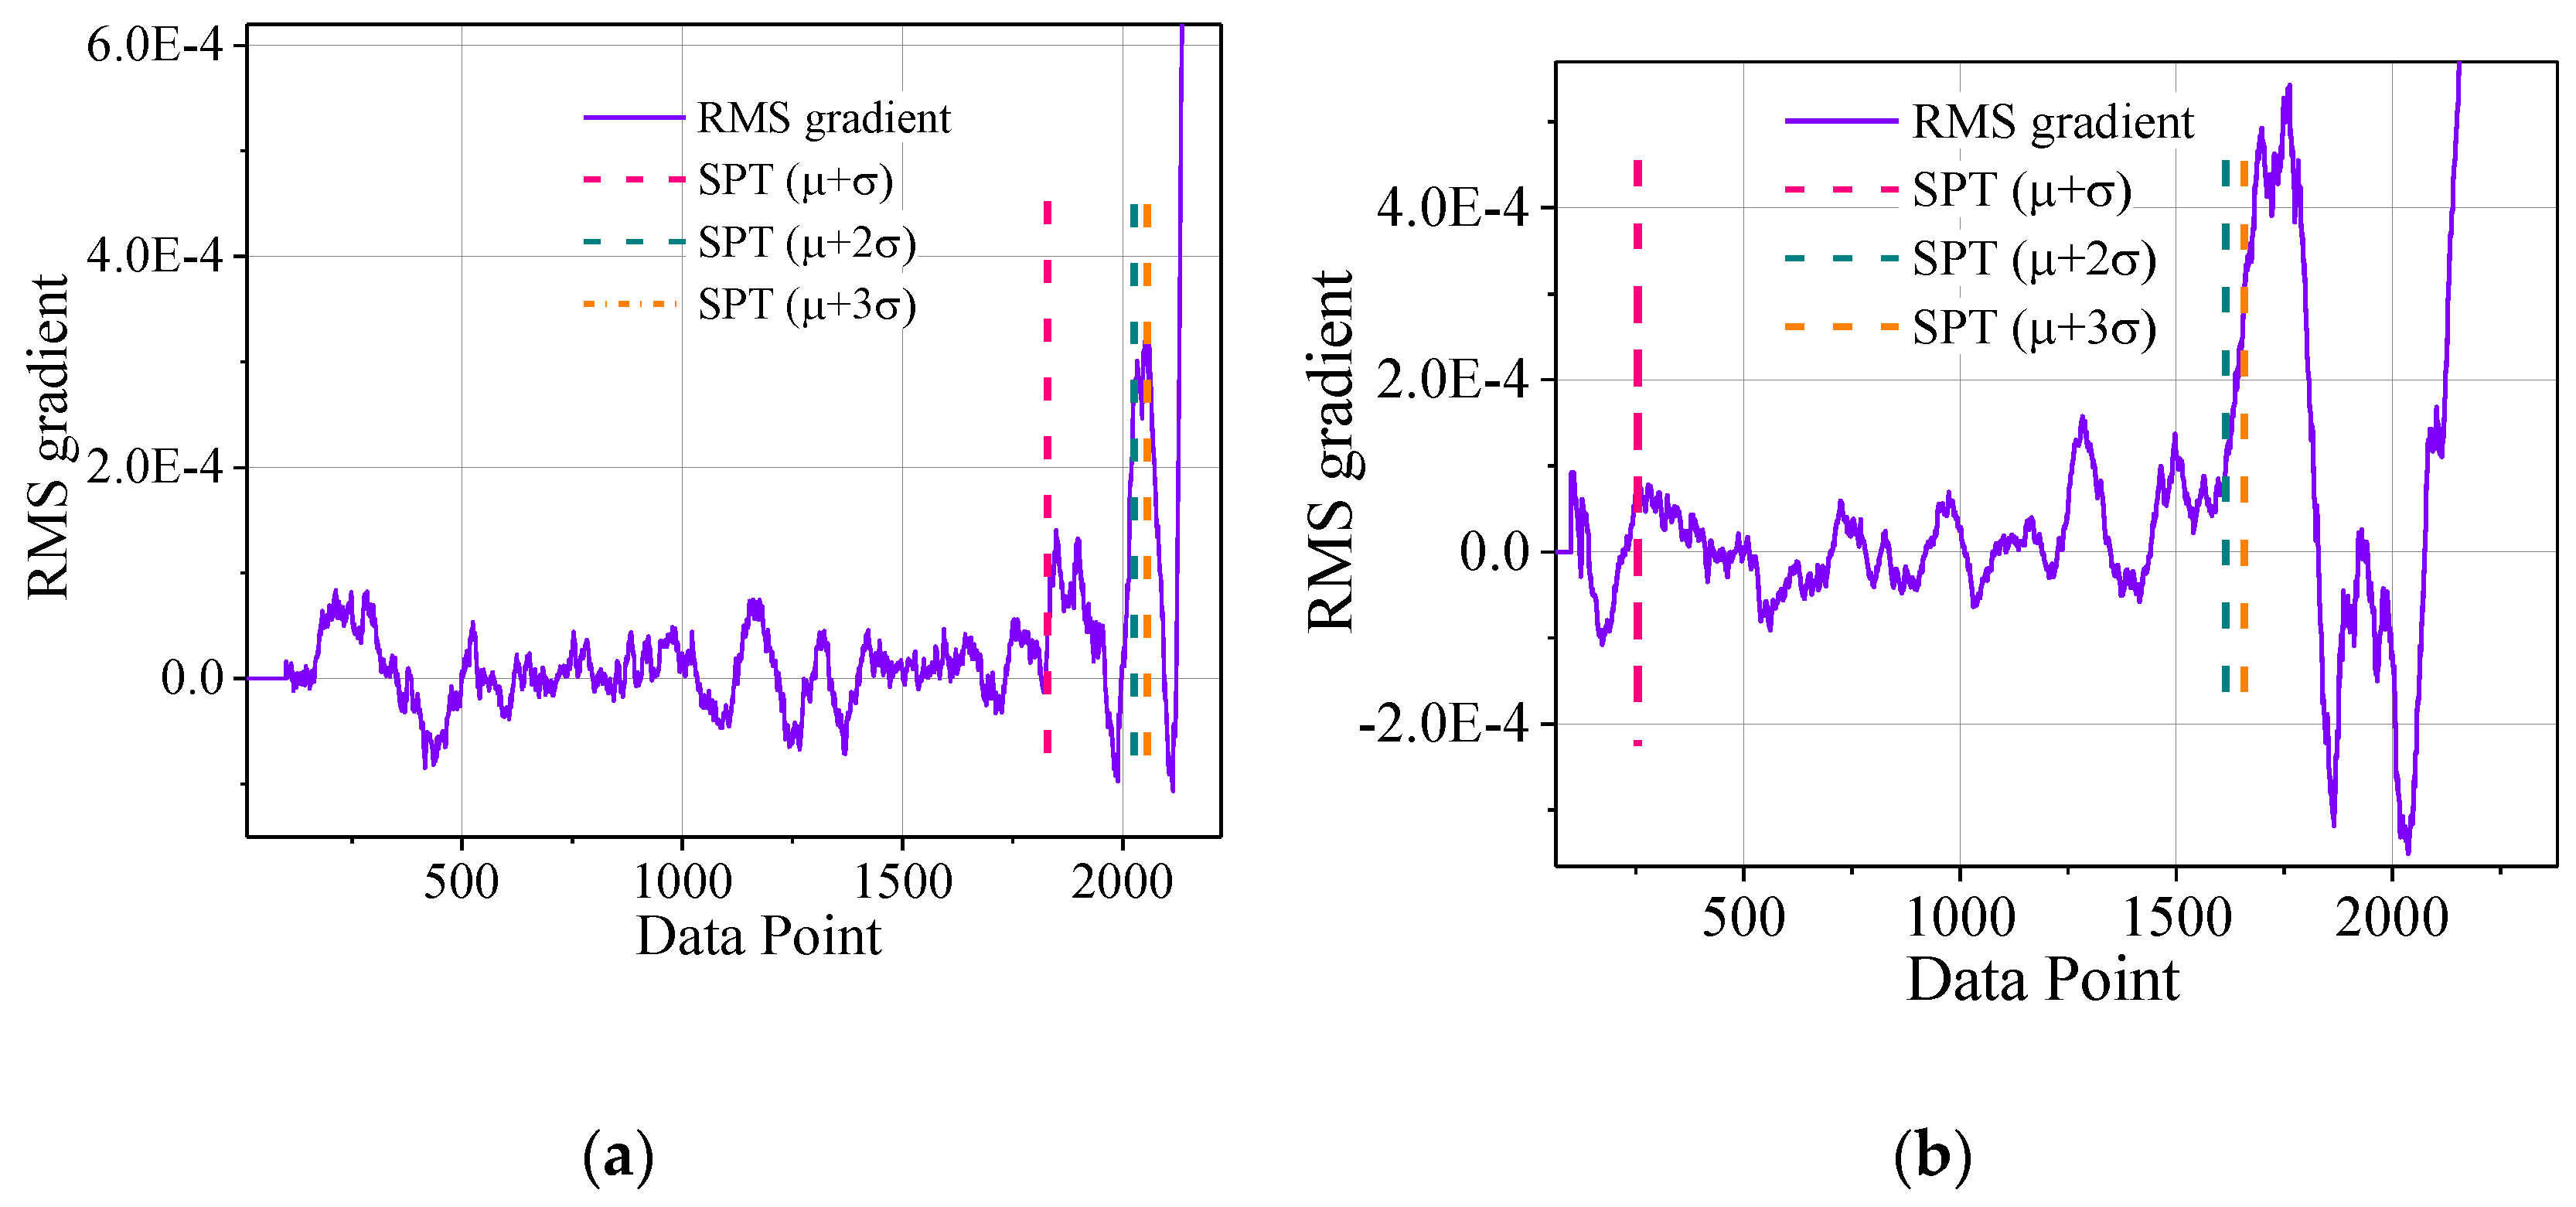
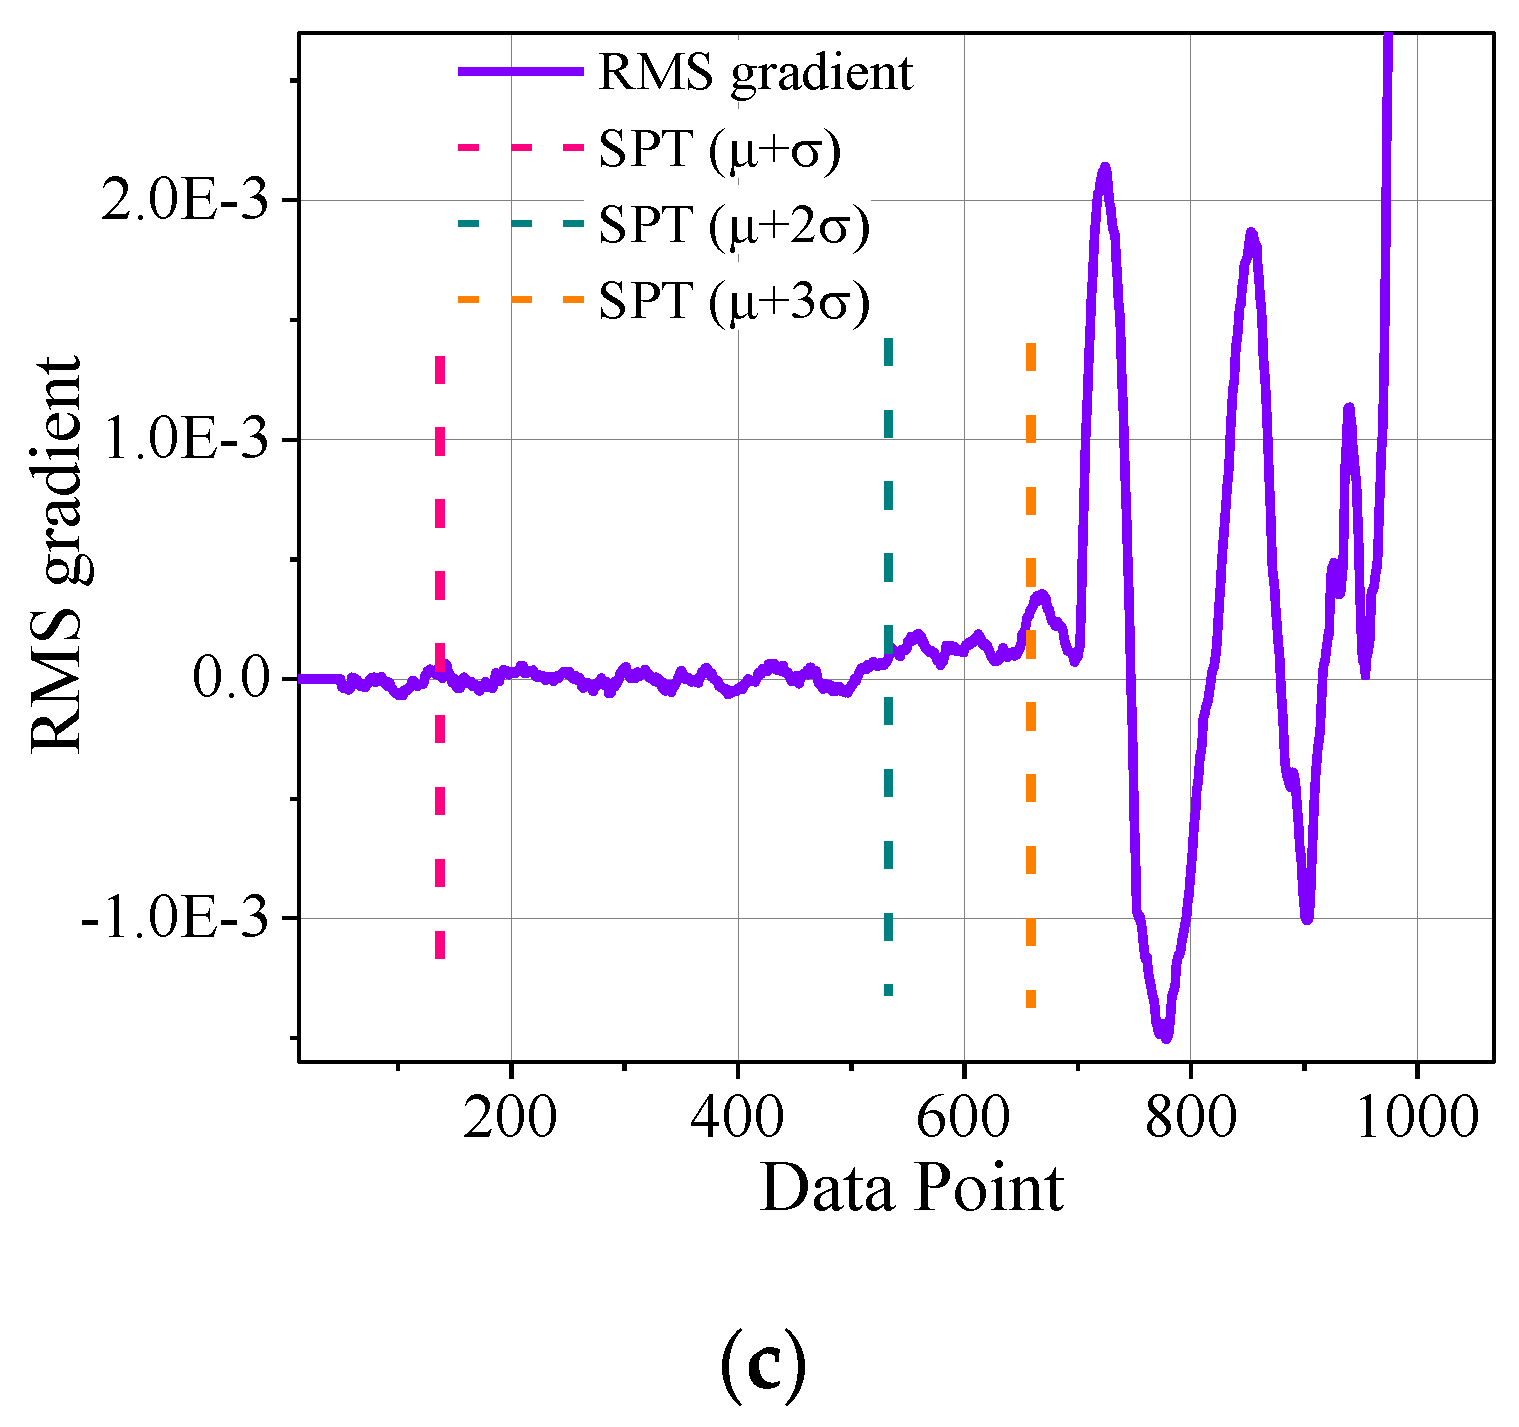
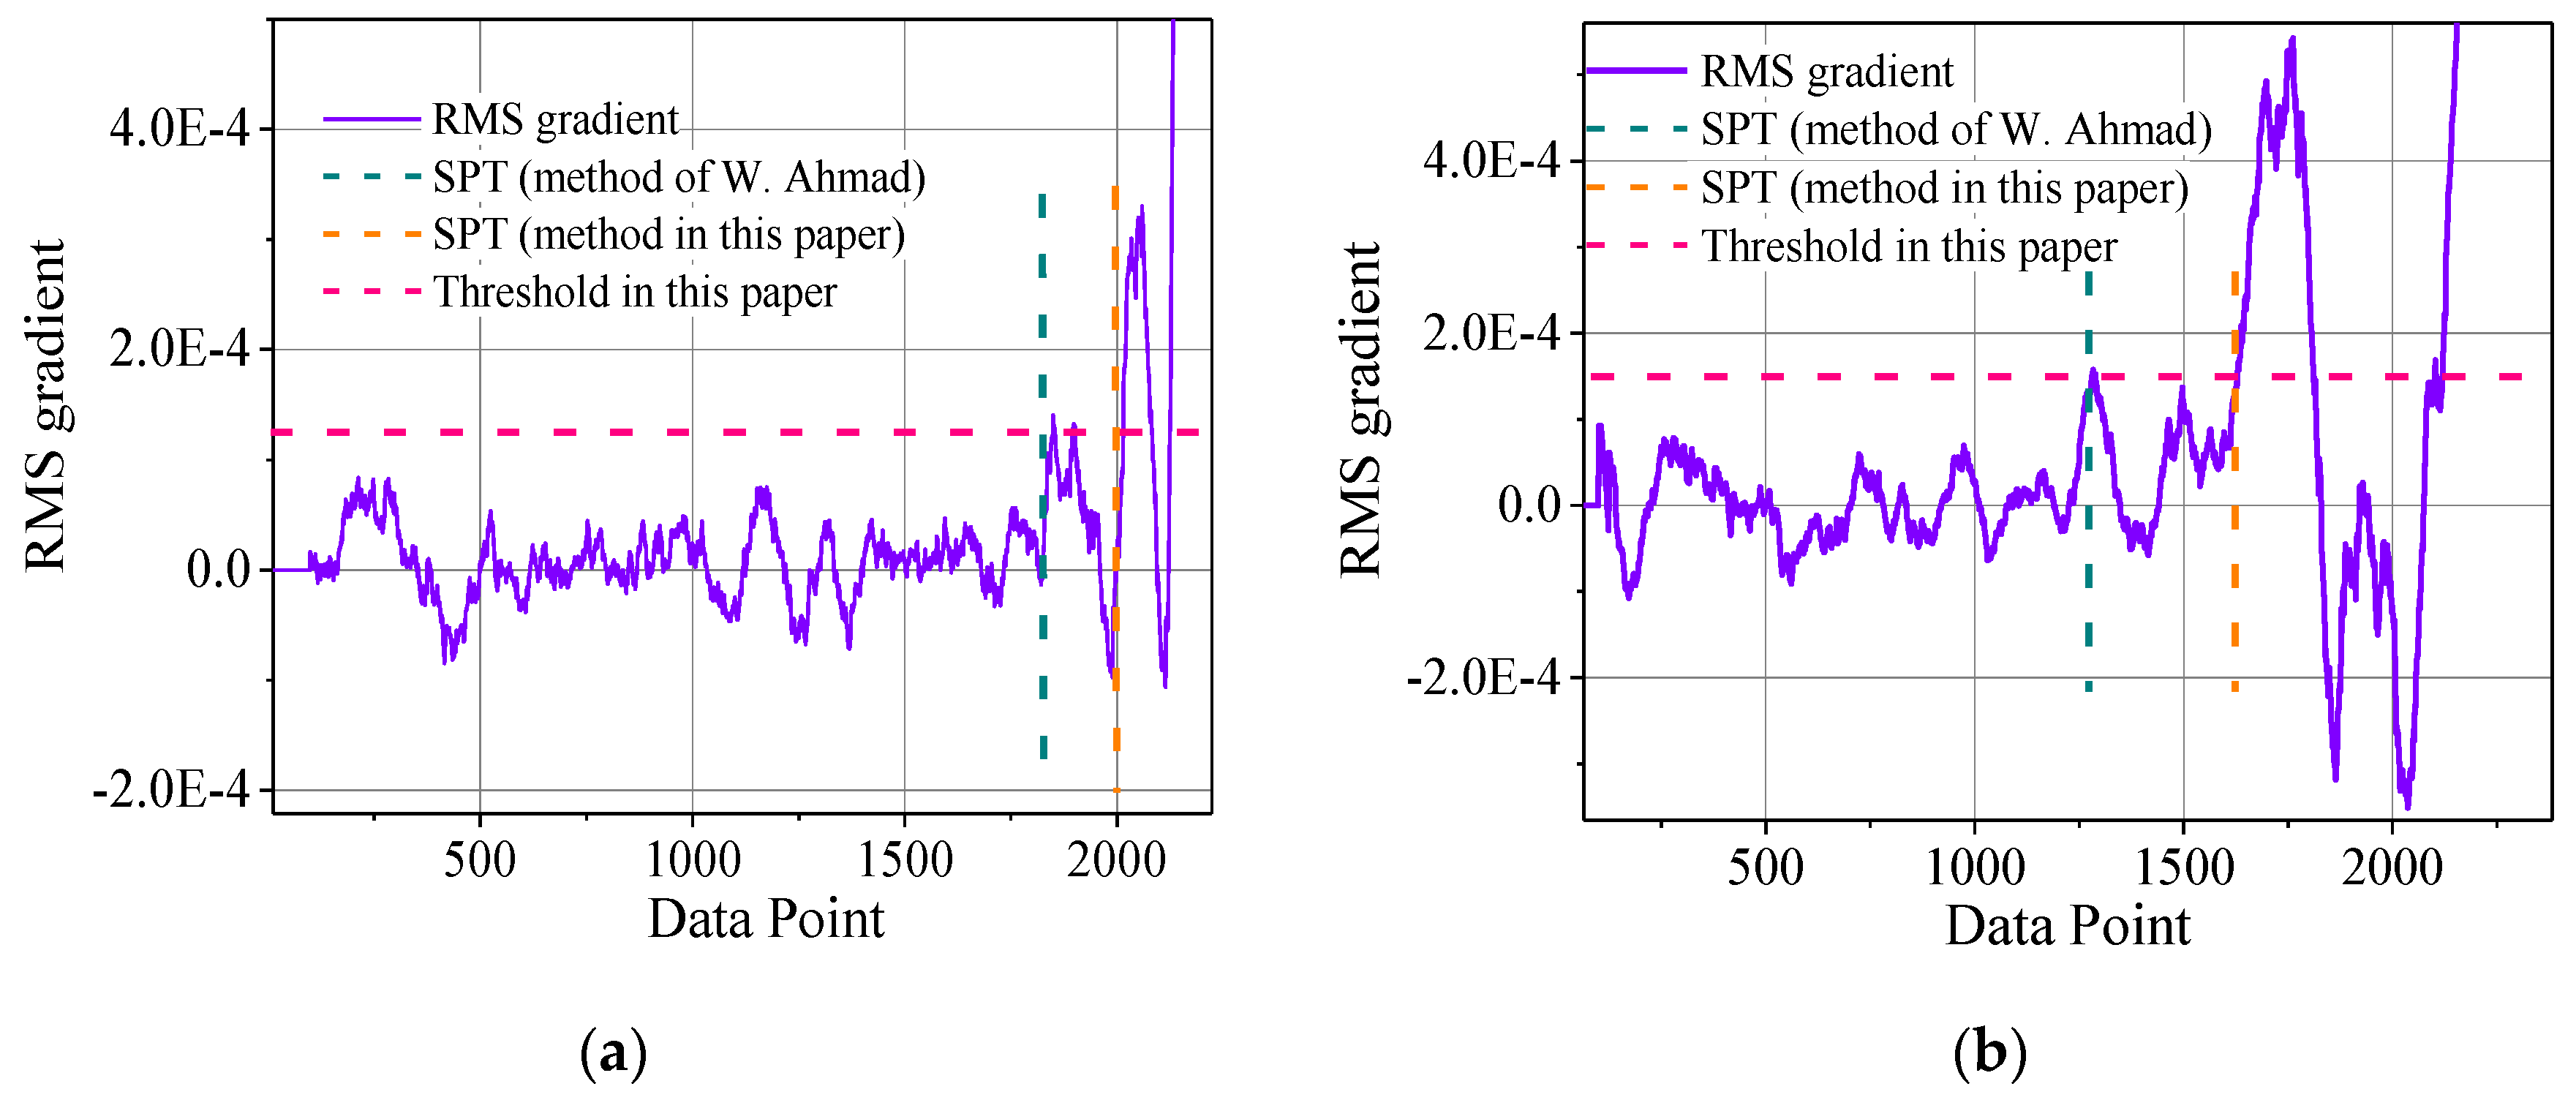
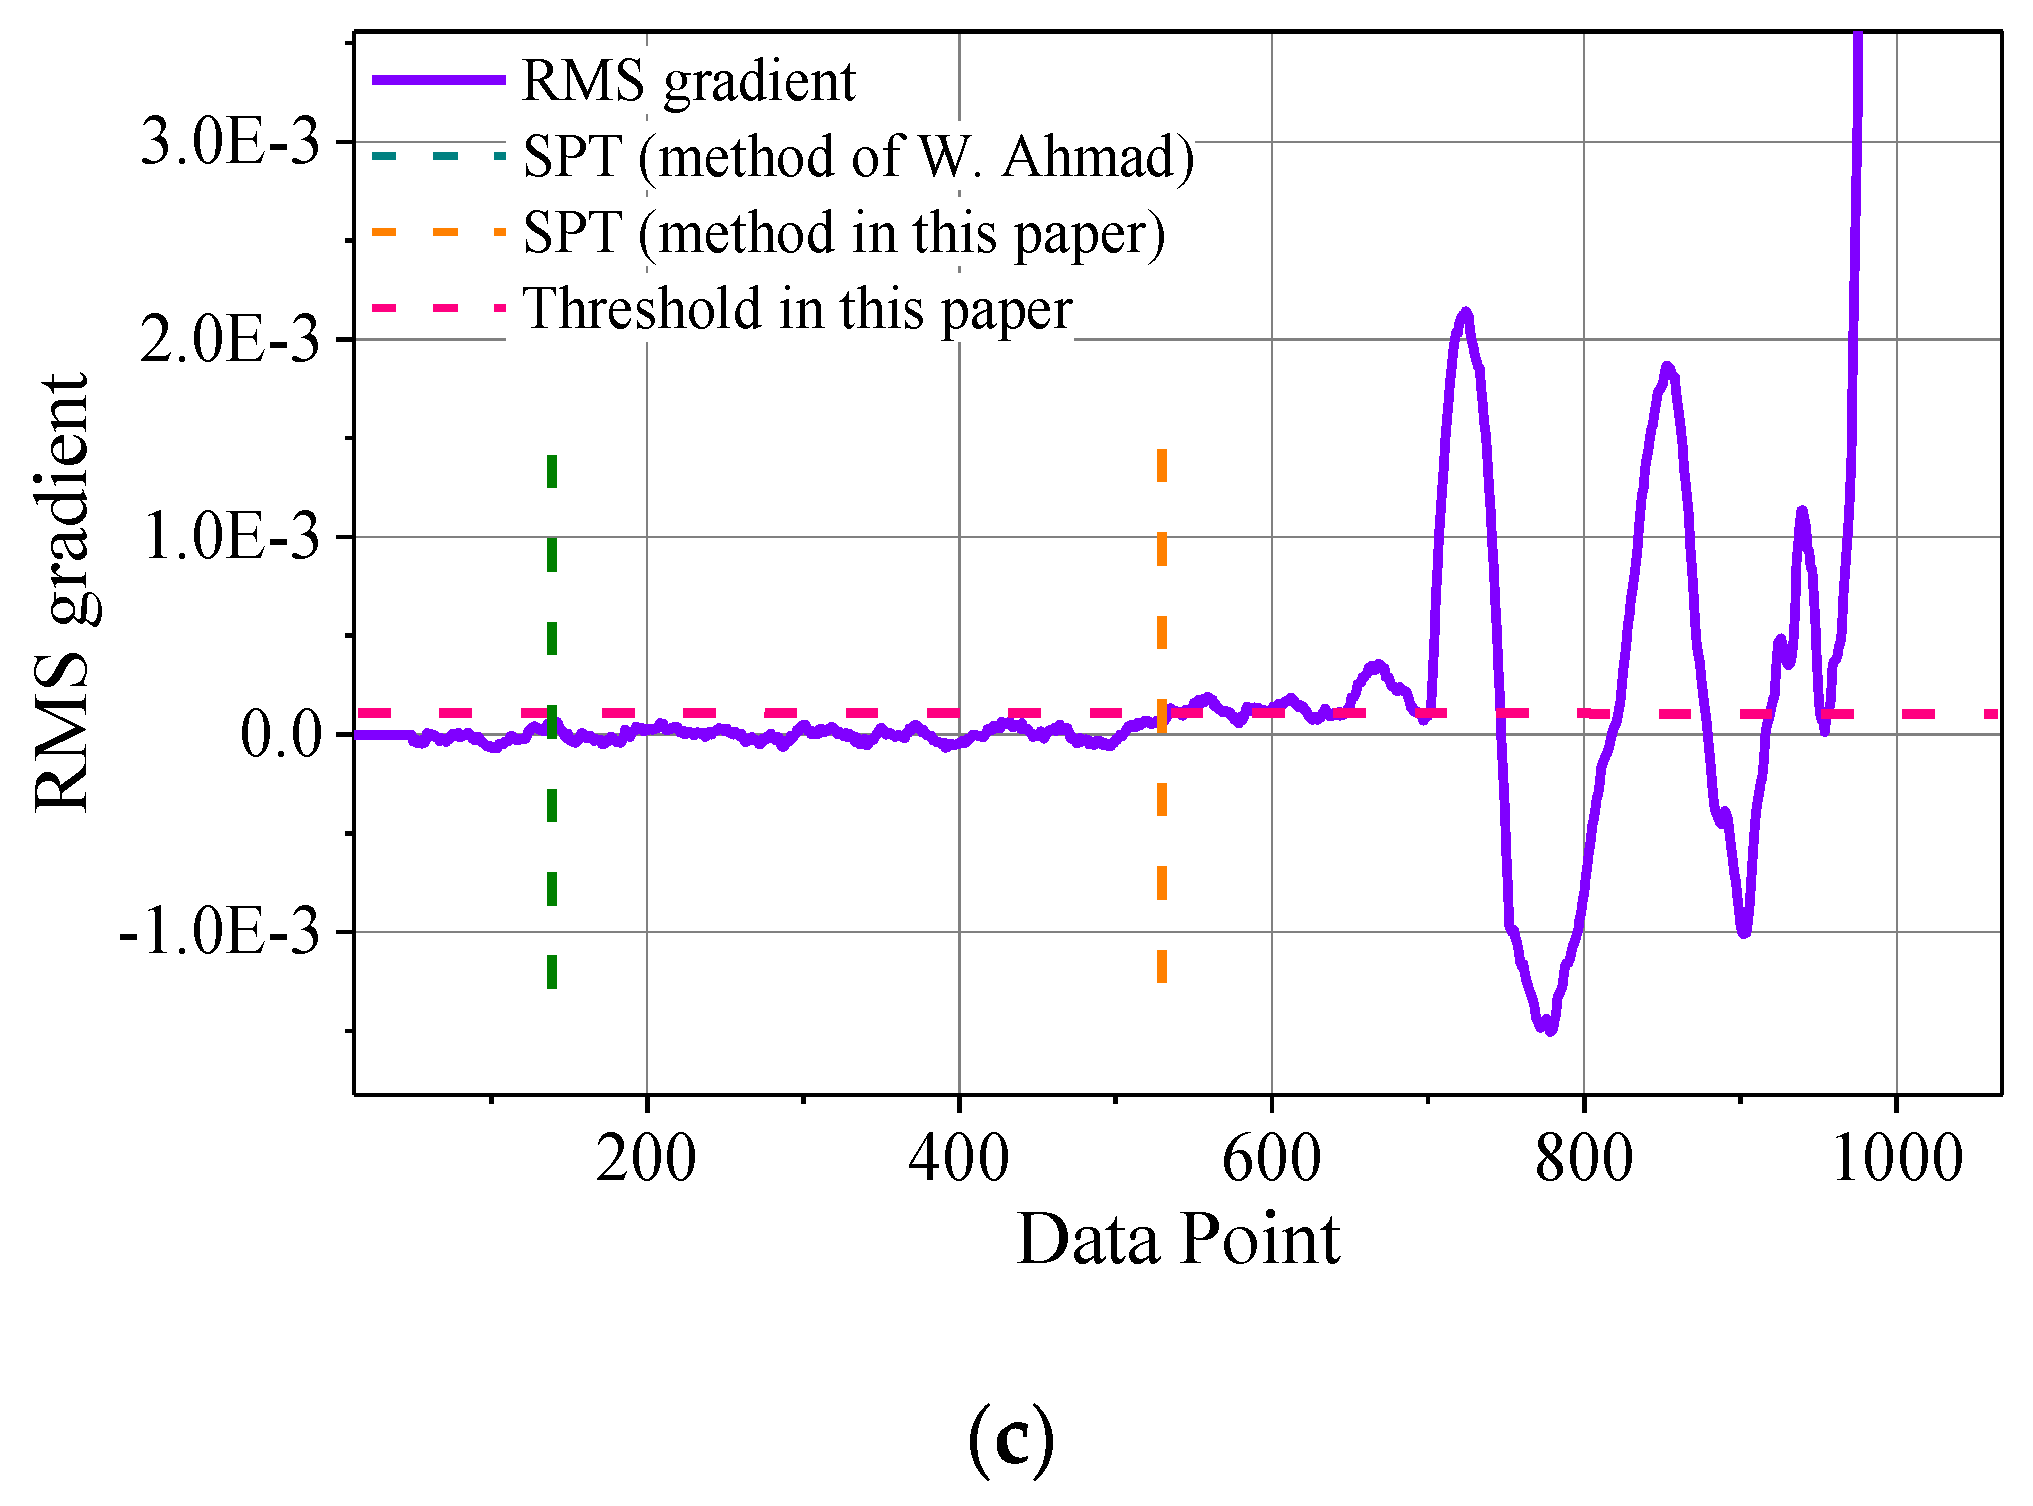
5.2. SPT Point of Experimental Data

According to Equation (4), the RMS gradient of the normal stage vibration signal is calculated. The SPT under different thresholds (μ + σ, μ + 2σ, and μ + 3σ) were compared. The SPT points at different thresholds are shown in Figure 8.
As shown in Figure 8, the μ + 2σ and μ + 3σ SPTs of Bearing 1 are similar. The μ + 2σ and μ + 3σ SPTs of Bearing 2 are similar. The μ + 3σ SPT of Bearing 3 is later. The μ + σ SPT of Bearing 1 is reasonable. The μ + σ SPT of Bearing 2 and Bearing 3 are early. The RUL prediction was carried out for the SPT determined by three thresholds. The standard errors of life prediction under the three thresholds are listed in Table 1.
The data from Table 1 indicate that the standard error of threshold μ + σ is generally greater than that of thresholds μ + 2σ and μ + 3σ. The threshold μ + 2σ was selected as the threshold for SPT selection in this paper after comprehensive consideration.
The SPT selection method proposed in this paper was compared with the method of W. Ahmad et al. [13]. The RMS gradient was also used as a reference. The results of the SPT determination are shown in Figure 9.
As shown in Figure 9, the SPT determined by the method of W. Ahmad et al. [13] is earlier than that determined by the method in this paper. This is because the method of W. Ahmad et al. [13] determines the SPT on the basis of a fixed and single trigger threshold, while the method in this paper chooses the threshold based on the normal stage information of rolling bearings. Therefore, the method of W. Ahmad et al. [13] carries out RUL prediction prematurely. Furthermore, the presented method was compared with the method of N. Li et al. [3]. Kurtosis was used as a reference in the method of N. Li et al. [3]. The SPT determination results of each method (the proposed method and the methods of W. Ahmad et al. [13] and N. Li et al. [3]) and the corresponding prediction errors are listed in Table 2.
The data from Table 2 indicate that the SPT determined by the method of W. Ahmad et al. [13] is earlier than that of the method of N. Li et al. [3] and the method in this paper. The error of the SPT determined by the method of W. Ahmad et al. [13] is large. This is because the threshold in Method 11 is a fixed value. The SPT determined by the method in [3] is later than that of the method in this paper. This is because the method of N. Li et al. [13] is not susceptible to degradation features, so that the determined SPT are in the stage of severe performance degradation. Although the error of this method is small, it may make RUL predictions meaningless. The SPT determined by the method in this paper is moderate, and the prediction error is relatively small.

6. Conclusions

In this paper, a linear-regression-based SPT point determination was proposed to solve the problem of determining the SPT in rolling bearing RUL prediction. In this method, the sliding window linear regression method was used to establish the RMS gradient domain. The RMS gradient was used as a reference to set the threshold. The continuous trigger threshold mechanism was used to determine the SPT. Compared with the method of W. Ahmad et al. [13], the proposed method has a stronger anti-jamming ability and a higher prediction accuracy. Compared with the method of N. Li et al. [3], the proposed method can start RUL prediction when the degradation of rolling bearings is less serious, obtaining more maintenance time.

Author Contributions

Conceptualization, C.G. and J.S.; data curation, K.L. and T.W.; formal analysis, Y.H.; methodology, K.L. and T.W.; software, T.W.; writing–original draft, K.L. and T.W.

Funding

This work was supported in part by the National Natural Science Foundation of China under grant no. 51777060, in part by the National Natural Science Foundation of China under grant no. 51277054, in part by the Key Science and Technology National Program of Henan Province (No. 192102210230), and in part by the Key Scientific Research Projects of Higher Education Institutions in Henan Province (No. 20A470004).

Conflicts of Interest

The authors declare no conflict of interest.

References

  1. Blodt, M.; Granjon, P.; Raison, B.; Rostaing, G. Models for Bearing Damage Detection in Induction Motors Using Stator Current Monitoring. IEEE Trans. Ind. Electron. 2005, 55, 1813–1822. [Google Scholar] [CrossRef]
  2. Hosseinzadeh, M.; Salmasi, F. Analysis and detection of a wind system fauilure in a micro-grid. J. Renew. Sustain. Energy 2016, 8, 043302. [Google Scholar] [CrossRef]
  3. Li, N.; Lei, Y.; Lin, J. An improved exponential model for predicting remaining useful life of rolling element bearings. IEEE Trans. Ind. Electron. 2015, 62, 7762–7773. [Google Scholar] [CrossRef]
  4. Liao, H.T.; Zhao, W.B.; Guo, H.R. Predicting remaining useful life of an individual unit using proportional hazards model and logistic regression model. In Proceedings of the 2006 IEEE RAMS Annual Reliability and Maintainability Symposium, Newport, CA, USA, 23–26 January 2006; pp. 127–132. [Google Scholar]
  5. Tian, Z.G.; Liao, H.T. Condition based maintenance optimization for multi-component systems using proportional hazards model. Reliab. Eng. Syst. Saf. 2011, 96, 13041–13049. [Google Scholar] [CrossRef]
  6. Dong, S.; Wang, J.; Xu, X.; Liu, X. Bearing residual life prediction based on multi-SVM error weighting. Manuf. Technol. Mach. Tools 2017, 12, 103–111. [Google Scholar]
  7. Ren, L.; Sun, Y.; Hao, H.; Zhang, L. Prediction of bearing remaining useful life with Deep convolution neural network. IEEE Trans. Ind. Inform. 2018, 6, 13041–13049. [Google Scholar] [CrossRef]
  8. Gebraeel, N.; Lawley, M.; Parmeshwaran, R.L.V. Residual life predictions from vibration-based degradation signals: A neural network approach. IEEE Trans. Ind. Electron. 2004, 51, 694–700. [Google Scholar] [CrossRef]
  9. Elwany, A.H.; Gebraeel, N.Z. Sensor-driven prognostic models for equipment replacement and spare parts inventory. IIE Trans. 2008, 40, 629–639. [Google Scholar] [CrossRef]
  10. Gebraeel, N. Sensory-updated residual life distributions for components with exponential degradation patterns. IEEE Trans. Autom. Sci. Eng. 2006, 3, 382–393. [Google Scholar] [CrossRef]
  11. Yang, B.S. An intelligent condition-based maintenance platform forrotating machinery. Expert Syst. Appl. 2012, 39, 2977–2988. [Google Scholar]
  12. Ginart, A.; Barlas, I.; Goldin, J.; Dorrity, J.L. Automated features election for embeddable prognostic and health monitoring (PHM) architectures. IEEE Autotestcon 2006, 18, 195–201. [Google Scholar]
  13. Ahmad, W.; Khan, S.A.; Kim, J.M. A hybrid prognostics technique for rolling Element bearings using adaptive predictive models. IEEE Trans. Ind. Electron. 2018, 65, 1577–1584. [Google Scholar] [CrossRef]
  14. Qiu, H.; Lee, J.; Lin, J. Wavelet filter-based weak signature detection method and its application on roller bearing prognostics. J. Sound Vib. 2006, 4–5, 1066–1090. [Google Scholar]
  15. Wang, Y.F.; Kootsookos, P.J. Modeling of low shaft speed bearing faults for condition monitoring. Mech. Syst. Signal Process. 1998, 12, 415–426. [Google Scholar] [CrossRef]
Figure 1. Root mean square (RMS) and kurtosis trend graph.
Electronics 08 00923 g001
Figure 2. Prediction error under different starting prediction time (SPT) selection.
Electronics 08 00923 g002
Figure 3. Schematic diagram of SPT.
Electronics 08 00923 g003
Figure 4. Flowchart of remaining useful life (RUL) prediction.
Electronics 08 00923 g004
Figure 5. Simulation of the bearing: (a) normal stage sample, (b) degraded stage sample, and (c) vibration signals of the whole lifetime.
Electronics 08 00923 g005aElectronics 08 00923 g005b
Figure 6. SPT point determination of simulation data: (a) RMS and (b) RMS gradient.
Electronics 08 00923 g006
Figure 7. Experimental bearing full life vibration signal: (a) Bearing 1, (b) Bearing 2, and (c) Bearing 3.
Electronics 08 00923 g007
Figure 8. SPT under different thresholds: (a) Bearing 1, (b) Bearing 2, and (c) Bearing 3.
Electronics 08 00923 g008aElectronics 08 00923 g008b
Figure 9. SPT under different methods: (a) Bearing 1, (b) Bearing 2, and (c) Bearing 3.
Electronics 08 00923 g009aElectronics 08 00923 g009b
Table 1. The standard error of remaining useful life (RUL) prediction under three thresholds.
ThresholdsBearing 1Bearing 2Bearing 3
μ + σ12.36%60.21%18.62%
μ + 2σ6.09%15.32%4.32%
μ + 3σ6.51%14.82%3.52%
Table 2. SPT determination results and the corresponding prediction errors.
MethodBearing 1Bearing 2Bearing 3
SPT (min)Error (%)SPT (min)Error (%)SPT (min)Error (%)
Method of W. Ahmad et al. [13]18,35013.112,67030.27144019.83
Method of N. Li et al. [3] 19,5105.1318,30010.2470204.05
Proposed in this paper18,6806.0916,28015.3252804.32

