Article

Reliability Evaluation of PV Systems with Integrated Battery Energy Storage Systems: DC-Coupled and AC-Coupled Configurations

Department of Energy Technology, Aalborg University, 9220 Aalborg, Denmark
*
Author to whom correspondence should be addressed.
Electronics 2019, 8(9), 1059; https://doi.org/10.3390/electronics8091059
Submission received: 23 August 2019 / Revised: 16 September 2019 / Accepted: 17 September 2019 / Published: 19 September 2019
(This article belongs to the Special Issue Challenges and New Trends in Power Electronic Devices Reliability)

Abstract

:
Deployment of a battery energy storage system for the photovoltaic (PV) application has been increasing at a fast rate. Depending on the number of power conversion units and their type of connection, the PV-battery system can be classified into DC- and AC-coupled configurations. The number of the components and their electrical loading directly affects the reliability of each of the configurations. Hence, in order to assure high efficiency and lifetime of the PV-battery system, reliability assessment of power conversion units (representing the most reliability-critical system components) is necessary. With respect to that, in this paper, a reliability assessment of the PV-battery system is performed and a comparison of the DC- and AC-coupled configuration reliability is conducted. In the analysis, all parts of the power conversion system, i.e., DC/DC and DC/AC converter units, are taken into consideration and component-, converter- and system-level reliability is assessed. A case study of 6 kW PV system with integrated 3 kW/7.5 kWh battery system has shown that higher reliability is achieved for DC-coupled configuration. The obtained results indicate that the probability of failure for the 15% of the population for DC-coupled configuration occurs 7 years later than that is a case for AC-coupled configuration. Finally, the presented analysis can serve as a benchmark for lifetime and reliability assessment of power conversion units in PV-battery systems for both configuration types. It provides information about differences in electrical and thermal loading of the power conversion units and resulting reliability of the two configurations.

1. Introduction

In recent years, Photovoltaic (PV) power capacity has increased more than any other type of generation technology. In 2018, the addition of PV power installed capacity of 100 GW was higher than all other technology types combined, and now accounts for 505 GW globally [1]. PV power generation is heavily dependable on the environmental conditions—solar irradiation and temperature. In order to increase PV system flexibility and to provide more dispatchable energy, integration of battery systems has been considered as a viable solution. Historically, the high cost of this storage technology has been the main barrier for its deployment. However, the declining cost of battery systems in recent years has enabled its commercialization. Lithium-ion is predominated technology type due to its merits suitable for a PV application—a fast response, scalability and low self-discharge. Its cost has declined for an average of 23% per year from 2010 to 2015, as reported in [2]. It is expected that continuous reduction in cost will further continue, which is then reflected in the expected increase of installed PV-battery systems. Precisely, 55% of annual energy storage deployments are expected to be coupled with PV systems by 2023 [3]. In such a case, system architecture and its impact on overall system performance are becoming an important topic.
In general, PV-battery power processing units consists of the three main components. Those are (1) PV panels representing power generation unit; (2) battery representing a storage unit and; (3) power electronic interface representing power conversion unit. Depending on the number of power electronic components and their type of connection, two main system configurations are available DC- and AC-coupled configurations. The main difference between two lies in the point of connection (POC) for the battery unit which can either be connected in the DC-link or at the point of common coupling (PCC).
System configuration does not only directly influence the operation, but also the cost, efficiency, lifetime and, consequently, reliability of the PV-battery system. In terms of operation, DC-coupled configuration has lower operational flexibility, as the total power delivered to the load is limited by the inverter capacity [4]. In cases of high load demand, PV and battery unit power capacity may be sufficient, but inverter capacity will limit the amount of the delivered power. In AC-coupled configuration, a greater amount of power can be delivered to supply the load, where both the PV and the battery inverter can supply the load at the same time. Cost of AC-coupled configuration is higher due to the additional DC/AC conversion unit which makes higher complexity of the system design and its balance. As reported in [5], DC-coupled configurations yield on average 1% lower total cost than AC-coupled configurations. However, in the case in which battery is integrated into the already existing PV system, the cost of the DC-coupled configuration could be higher. Already existing DC/AC conversion unit may need to be modified to accommodate multiple DC connections as well as a bi-directional DC/AC inverter. This would then additionally increase the installation cost of such a system. On the other hand, the AC-coupled battery system can be easily added to the existing PV system at the PCC, as shown in Figure 1. As a general rule, the efficiency of a system decreases as the number of power conversion units increases. Hence, the AC-coupled configuration has lower efficiency due to the additional DC/AC conversion unit. Nonetheless, as stated in [5], higher efficiency of power electronic units nowadays has caused the difference in system efficiency to become smaller compared to the early stage of development of the PV-battery systems.
In [6], the residential PV-battery systems were studied from a control point of view. A techno-economic analysis of a PV-battery system is investigated for the installation site in Greece [7] with DC-coupled configuration. Similarly, the benefits of connecting battery to a PV system in a DC-coupled configuration are investigated in [8], while AC-coupled configuration is investigated in [9]. Two configurations are compared in [10], where the performance of the PV-system connected in each of the configuration is further analyzed. However, most of the research on comparison of the two configurations is done from the economic point of view. In [11], the installed cost benchmark is proposed and the authors focused on researching potential cost-reduction opportunities of the PV-battery system. Similar research is conducted in [5] where the main focus is also put on the cost-effectiveness of a such system.
However, an important aspect that has not yet been researched is related to the lifetime and reliability of the PV-battery system connected in the two aforementioned configurations. This evaluation is necessary as it gives information on differences in the reliability of the two configurations resulting from the different number of components and their electrical loading. In general, information about the reliability of the system and its components is critical for adequate system operation and related economic profitability. In [12], reliability of the inverter unit for the DC-coupled configuration is analyzed. However, the reliability of the remaining system components, such as the DC/DC converters, have not been investigated. Thus, it is necessary to investigate each of the reliability-critical system components. If such an approach is used, it will yield information on which part of the power electronic interface is prone to failure the most. Moreover, by comparing the reliability of the two systems, additional information on the choice of the adequate configuration type for PV-battery system is obtained. Considering that, a reliability benchmark for PV-battery system connected in DC- and AC-coupled configuration is here presented.
With respect to that, an overview of the PV-battery system configurations is provided in Section 2 along with the implemented energy management strategy. The power converters electrical and thermal loading in the DC- and AC-coupled configurations is investigated in Section 3. The procedure for reliability evaluation is presented in Section 4. Reliability analysis is carried out with a case study of the real on-site measurement data in Section 5 where the reliability of the components and systems in DC- and AC-coupled configuration are compared. The conclusion of the carried work is presented in Section 5.

2. PV-Battery System

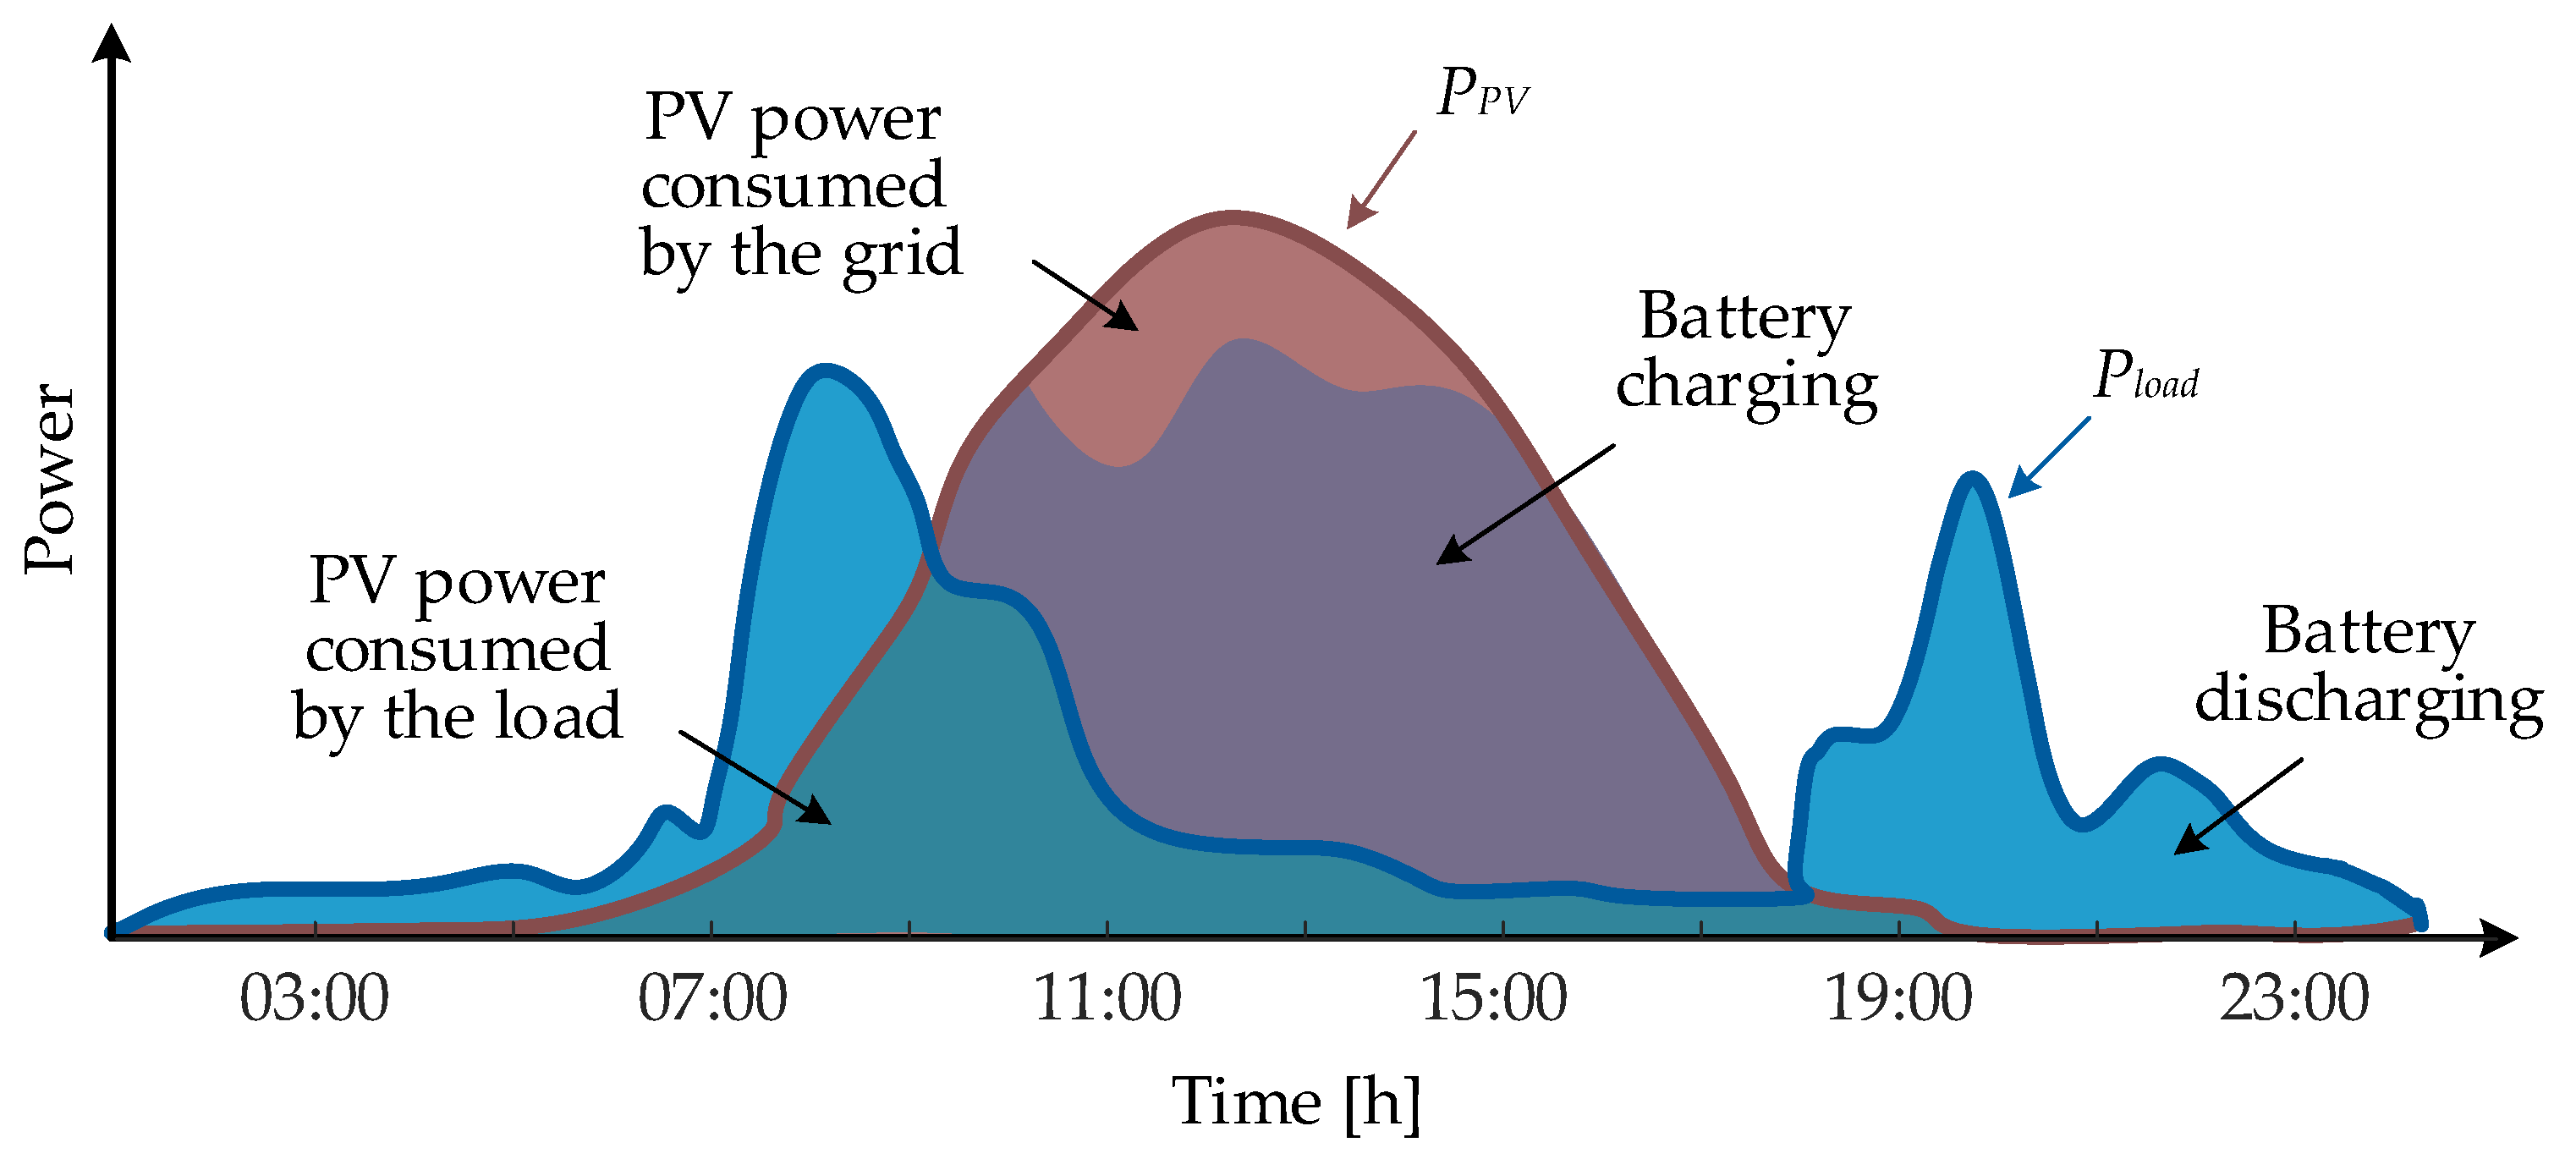
2.1. Self-Consumption Control Strategy

A self-consumption control strategy is the system’s energy management strategy that is defining the power flow among the units. It is also directly influencing the loading of the power conversion units. The key target of this control strategy is to maximize the internal power consumption of the battery and PV power before purchasing power from the grid. The main reasoning for increased implementation of this control strategy is seen in its cost-effectiveness. In the last 8 years, residential electricity prices in the United States and Europe have grown for 17% and 43% respectively [13]. On the other hand, the average cost of electricity produced from PV has shown significant decrease [14]. With respect to that, maximization of the internal consumption is seen as the most favourable option that has been widely adopted in residential level PV-battery systems. Examples of commercially available products can be found in [15,16].
In Figure 2, a typical daily profile of a residential unit with indicated PV generation and load demand during winter month is shown. The profile is characterized by the periods of high PV generation and low load demand in the midday and early afternoon hours. Contrary, low PV power generation and high load demand occur in the evening hours. Due to the misalignment between the PV generation and the load demand, a direct use of self-consumption is limited in the residential PV systems. Thus, the battery storage unit is employed to absorb the excess power during the day and then supply the load in the evening hours. Accordingly, the requested power to be absorbed or delivered by the battery can be defined as:
P b a t _ r e q = P P V P l o a d
where P P V is power generated by the PV unit and P l o a d is power demanded by the residential load at the AC side.
The requested power can be absorbed/delivered by the battery only when the battery is not fully charged/discharged. Hence, the actual power absorbed/delivered by the battery is P b a t . It represents a certain amount of the requested power P b a t _ r e q that can actually be absorbed/delivered based on the battery availability. If excess power cannot be absorbed by the battery, it is delivered to the grid. This situation occurs between 11:00 and 15:00, where the brown area in Figure 2 represents the power that is being sent to the grid. Similarly, in cases in which the combined power of PV and battery units is not sufficient to cover load demand, the power is delivered from the grid. It is worth mentioning that the difference between the requested and available battery power is directly related to the battery capacity and power rating.

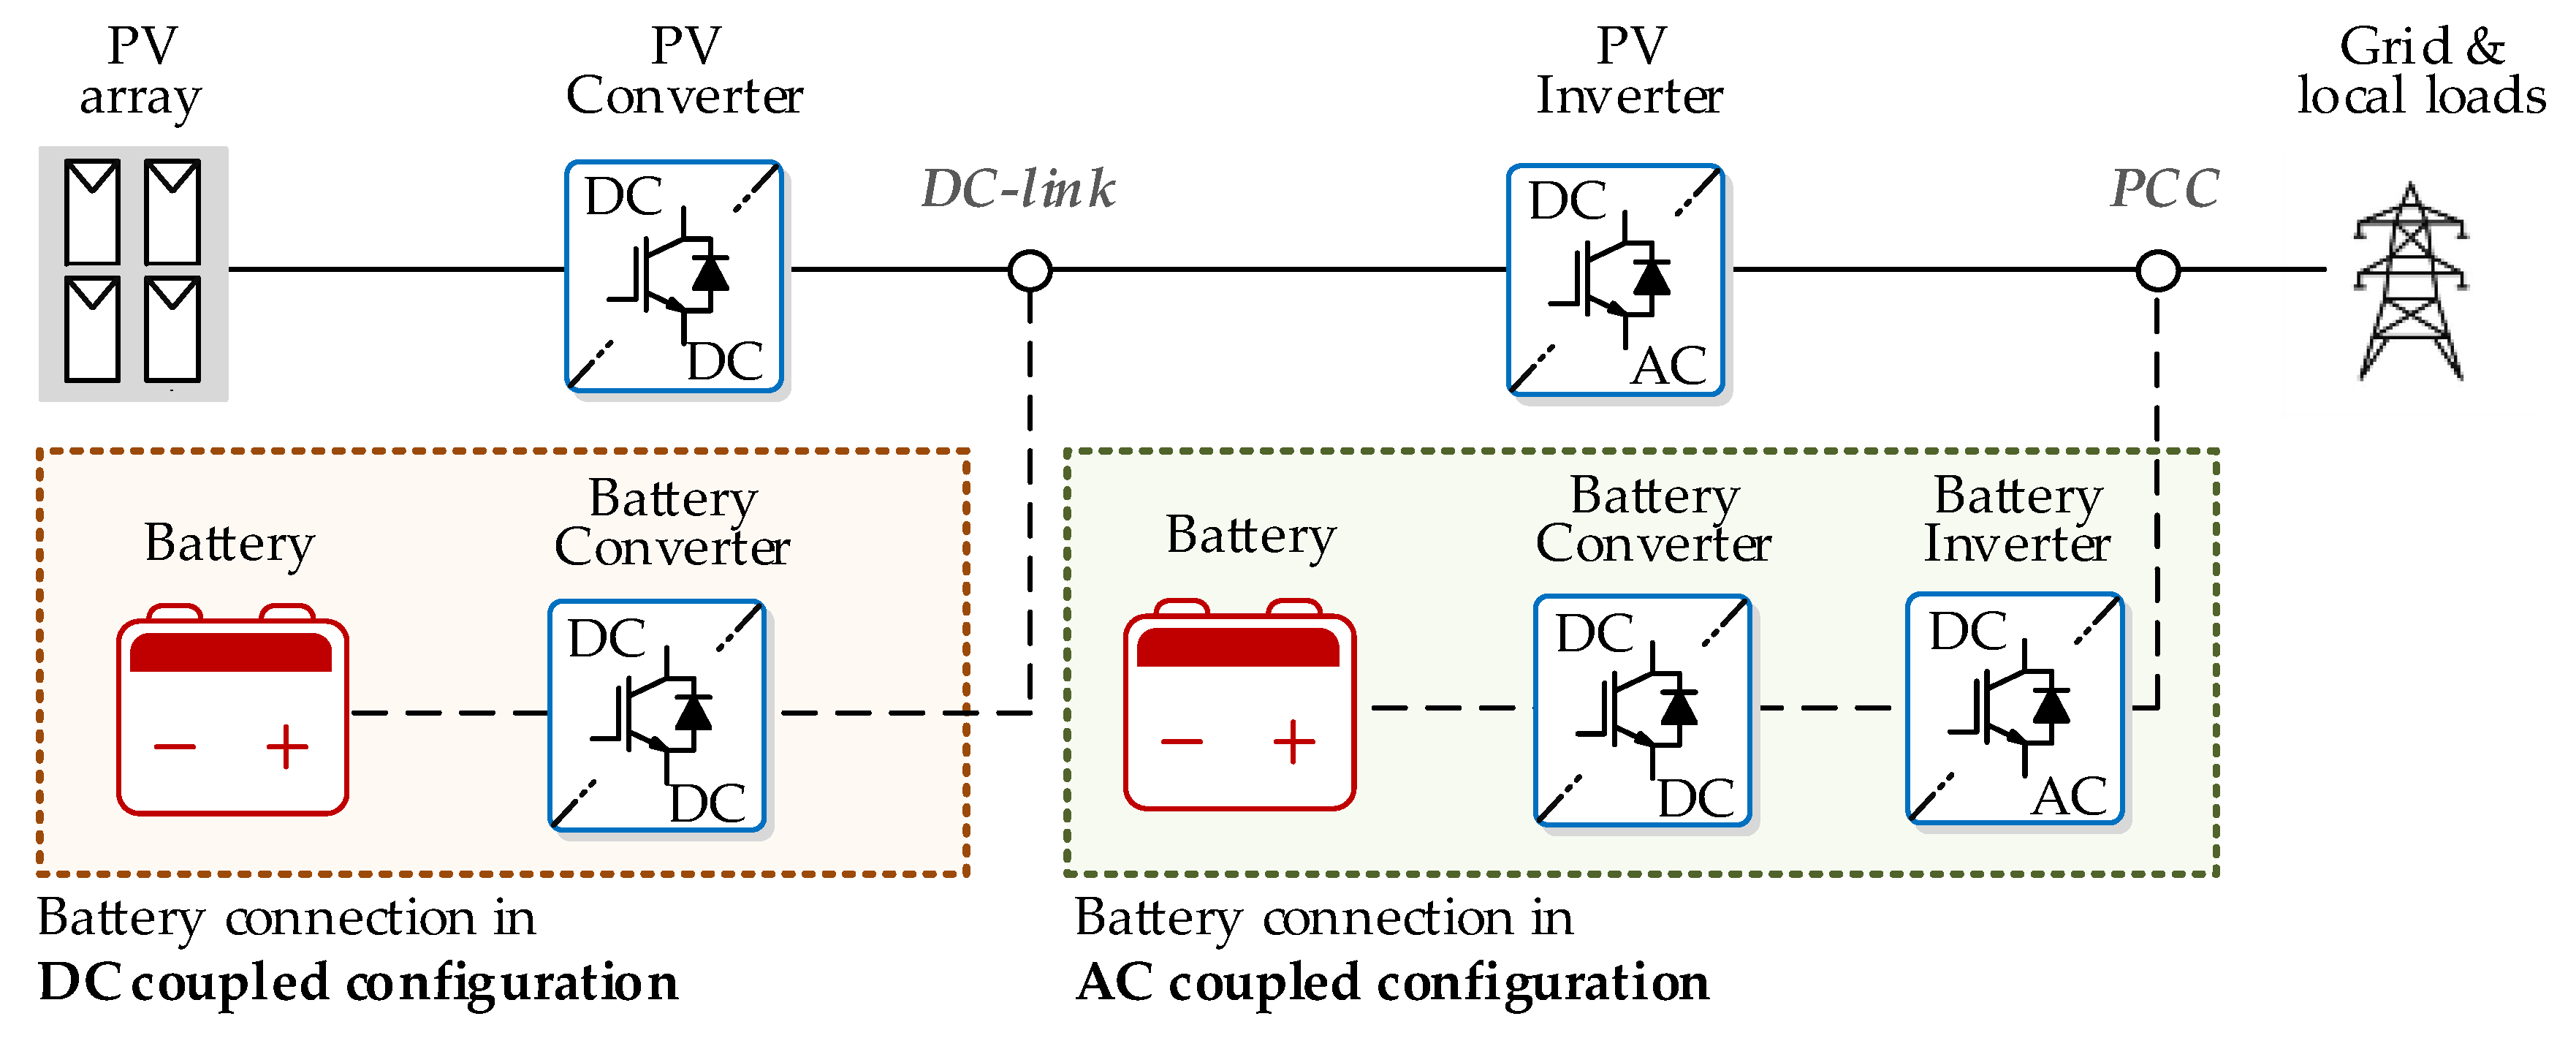
2.2. Characterization of Configuration Types

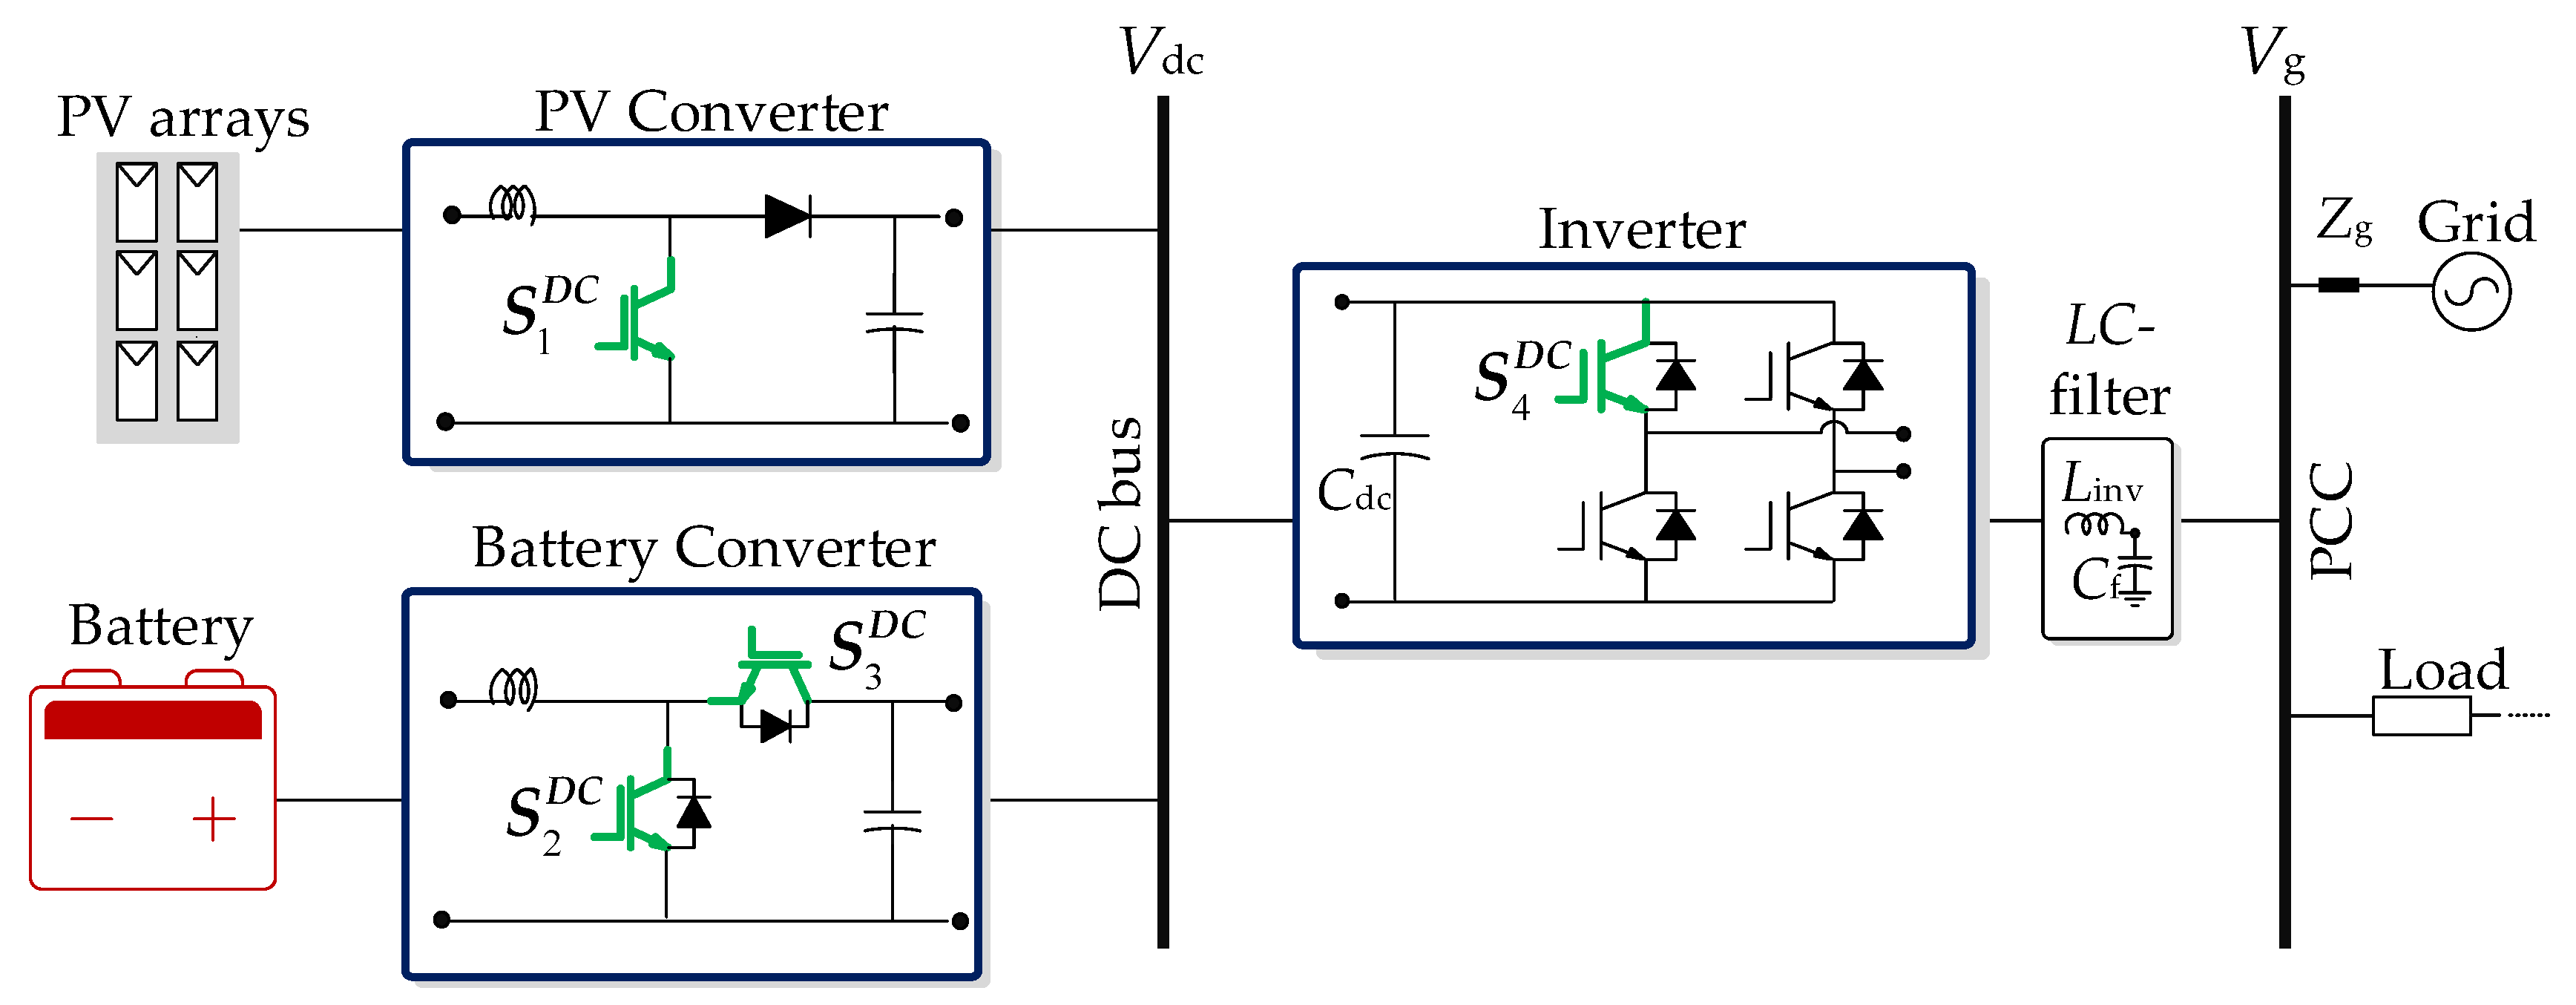
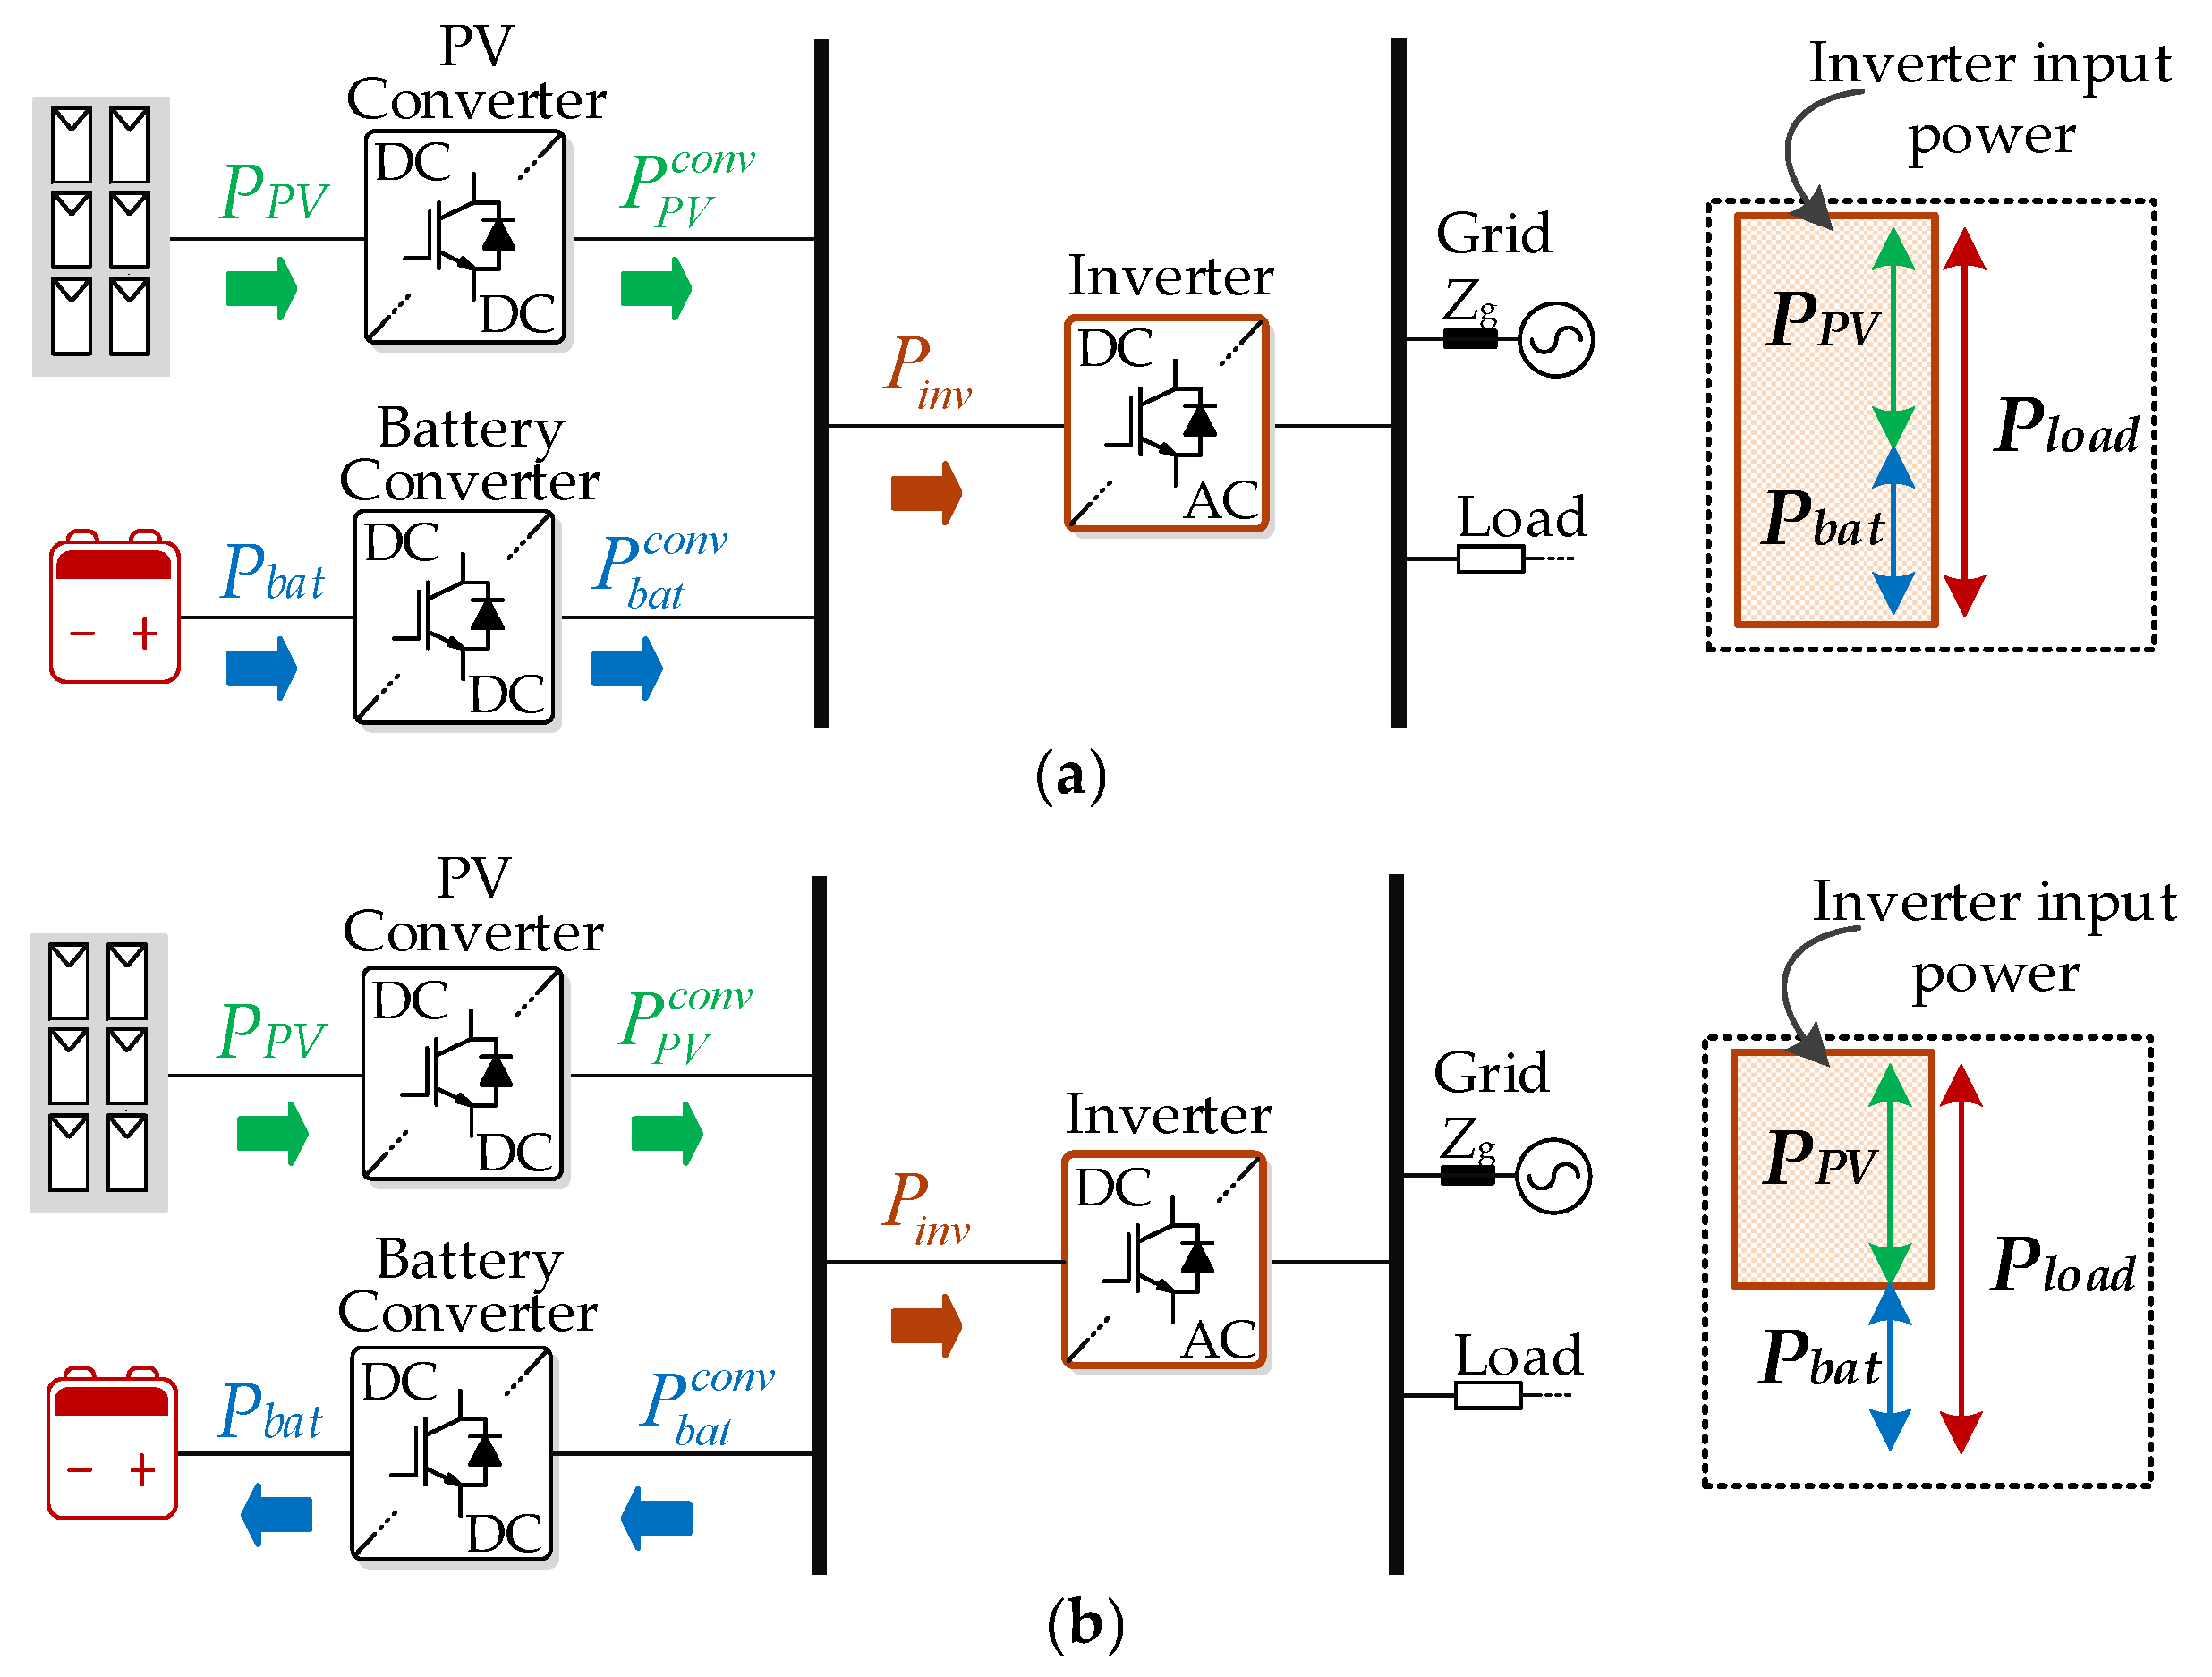
2.2.1. DC-Coupled Configuration

The DC/DC interface in the DC-coupled configuration consists of the PV and battery connected converters. DC/AC interface consists of a single inverter unit. The system diagram is shown in Figure 3.
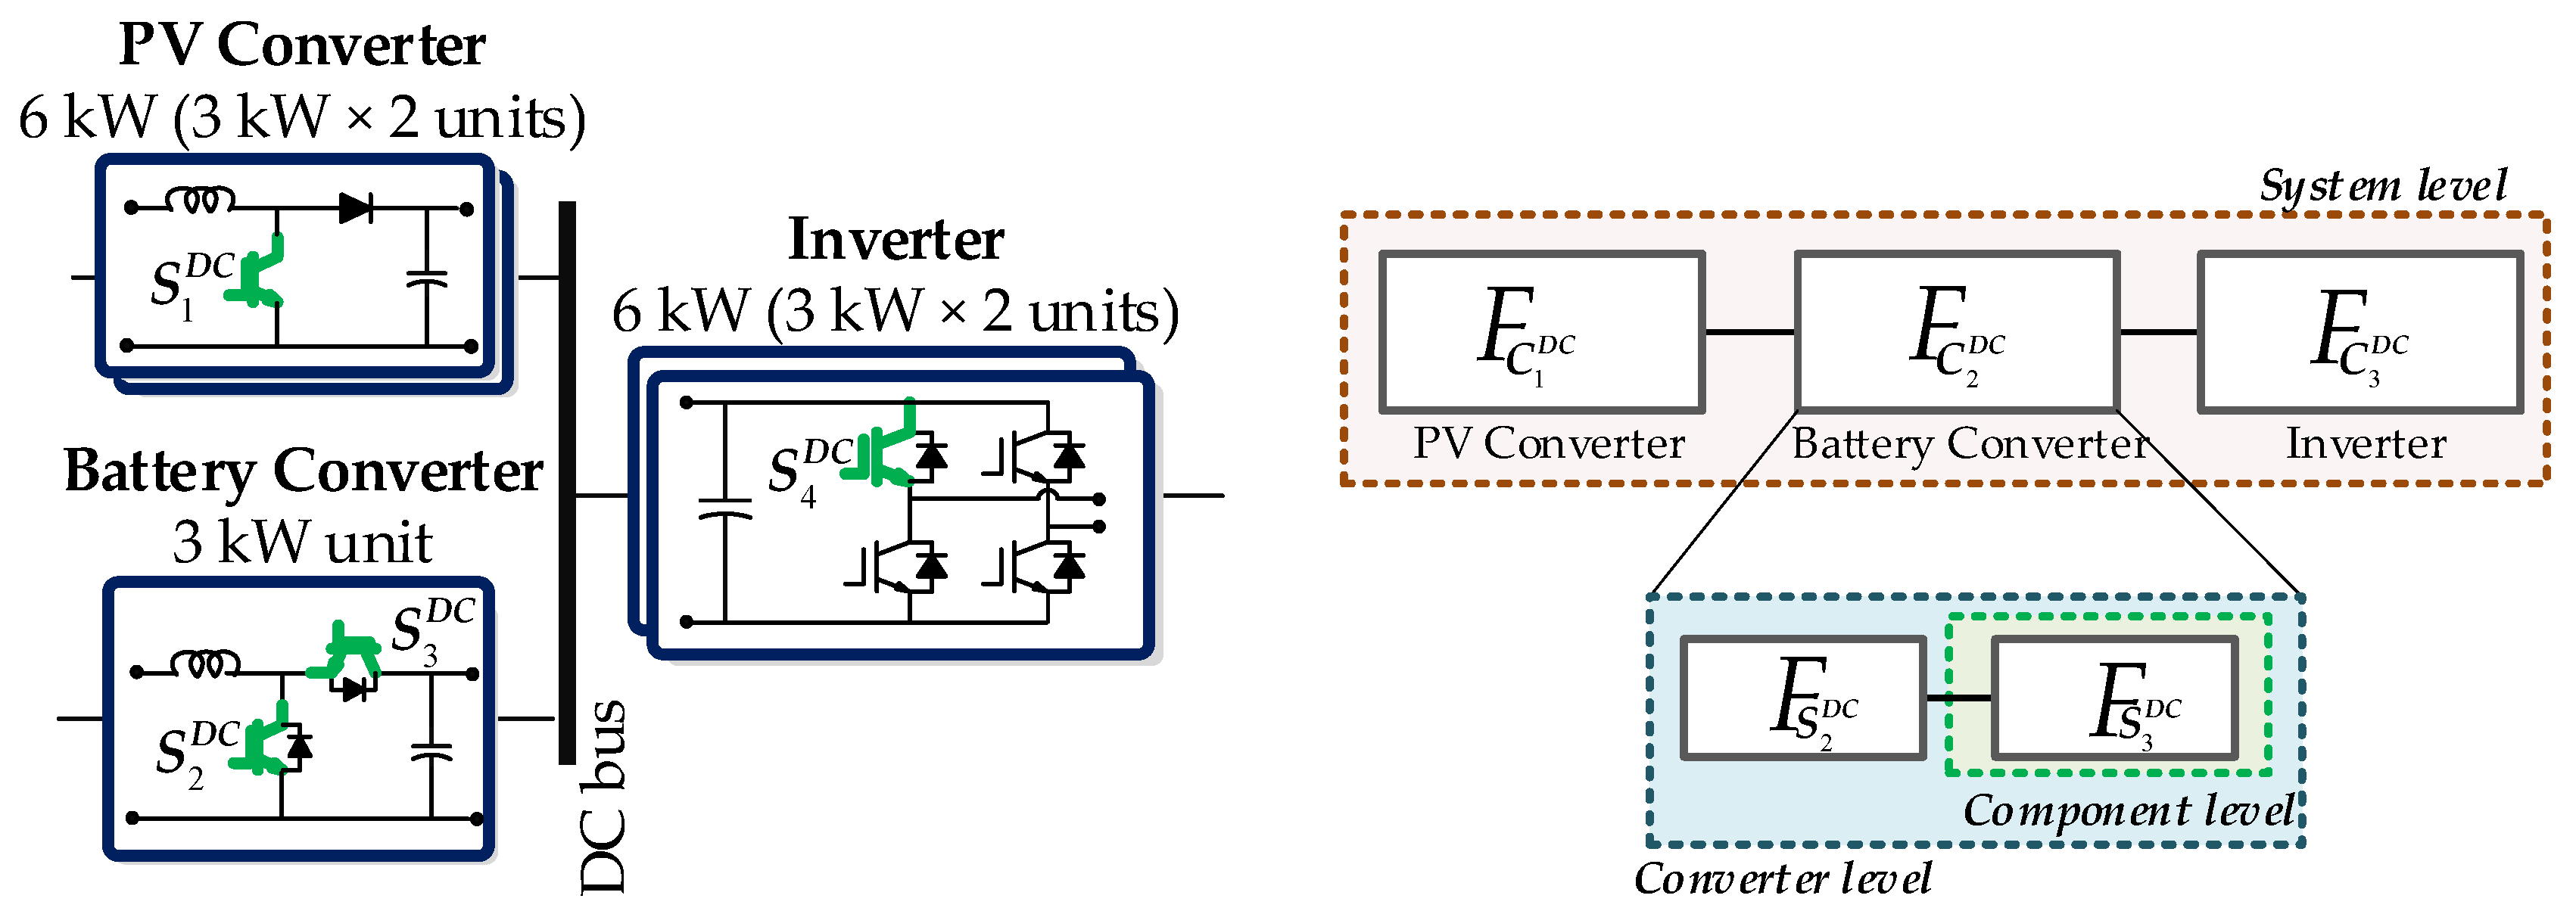
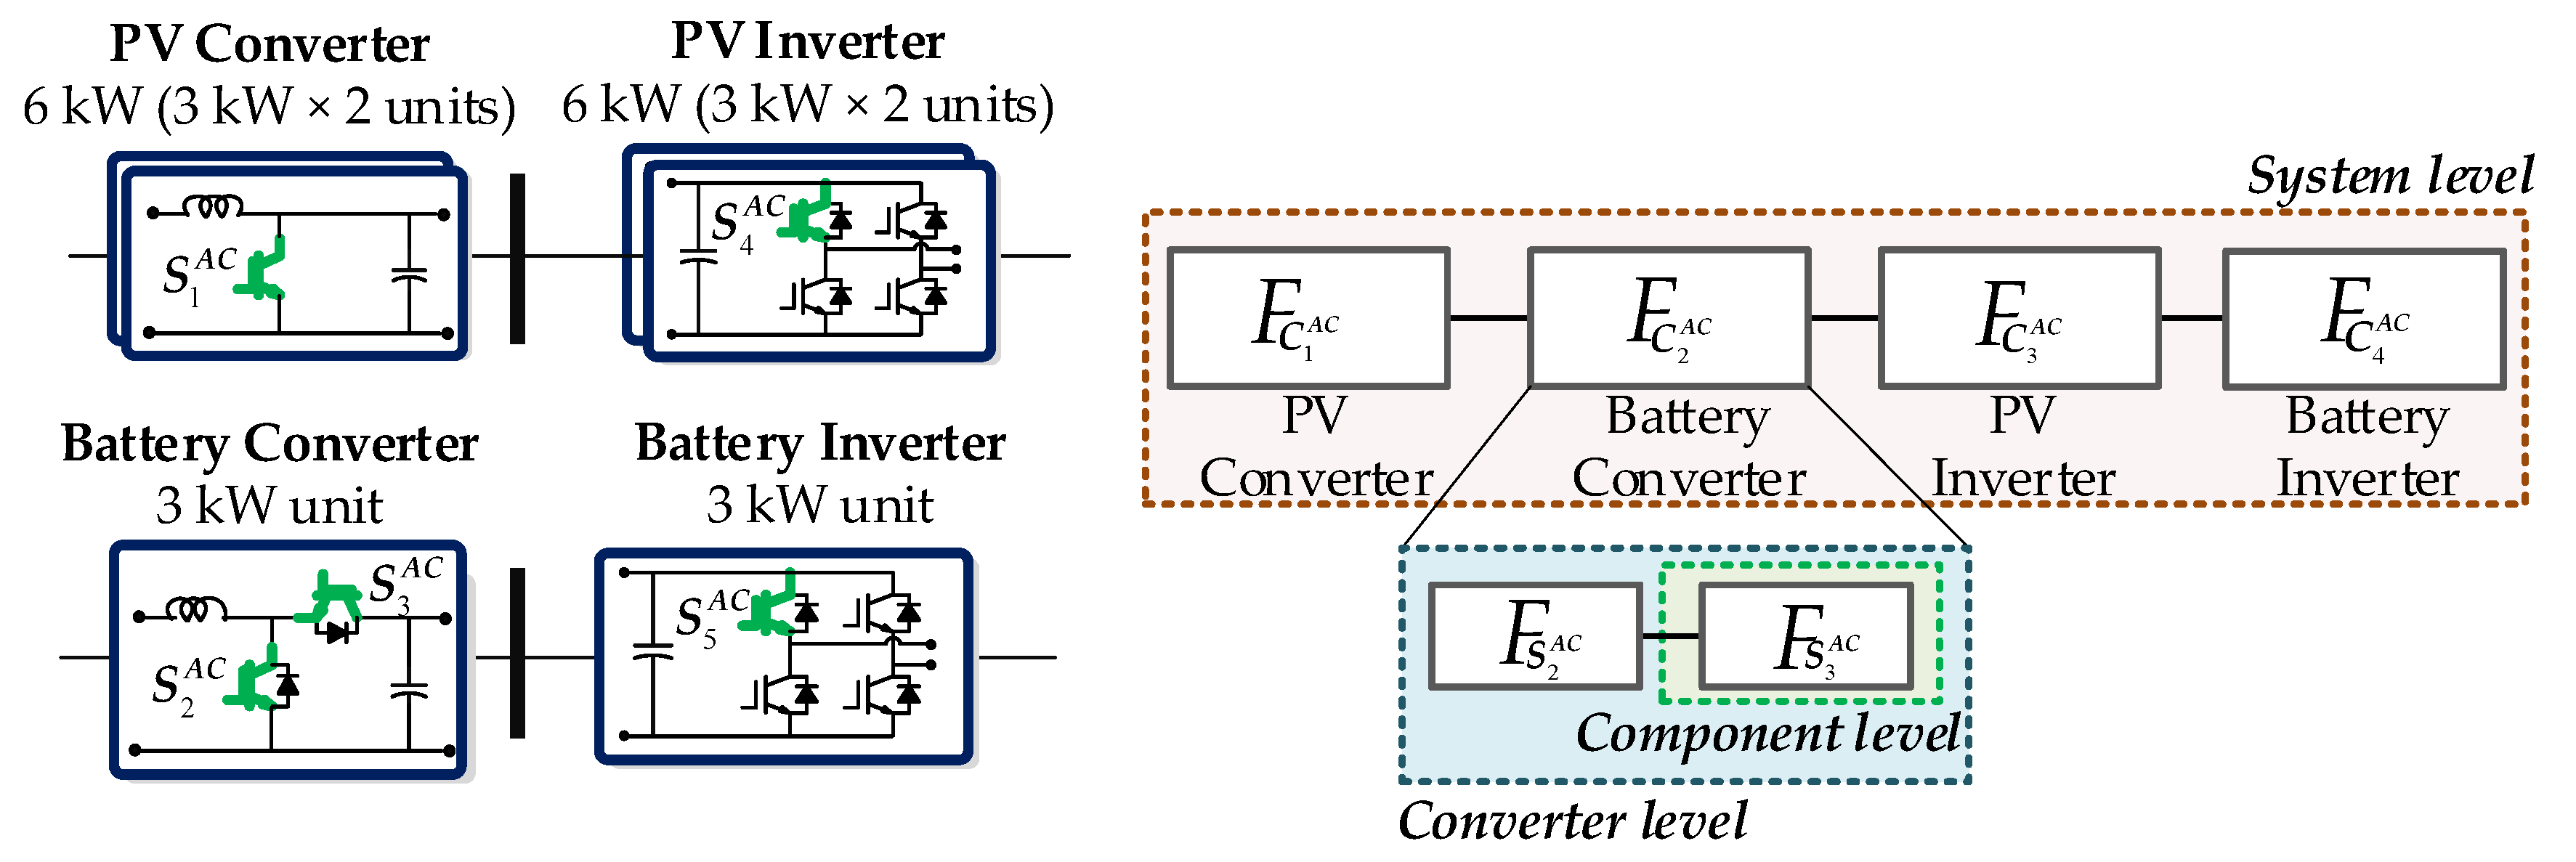
  • PV converter: A uni-directional DC/DC converter connected to the PV panel and is used to step up the voltage at the PV panel terminals to one of the DC bus. Furthermore, by implementing the maximum power point tracking control, the PV panel generation is maximized. Different topologies can be employed to assist this requirement. However, for simplification, a boost converter is implemented in the system under study.
  • Battery converter: A bi-directional DC/DC converter connected to the battery. When the battery is discharging, the DC/DC converter is operating as a step-up converter, e.g., boost converter. In the case in which battery is charging and power is being absorbed by the battery, the DC/DC converter is operating as a step-down converter, e.g., buck converter.
  • Inverter: A DC/AC inverter which main purpose is to transfer power to the AC side, as well as synchronize with the AC grid. Its loading is based on the power being delivered from both the PV and the battery units to the load. In this paper, a full-bridge single-phase inverter with four power devices is used in the system under study.

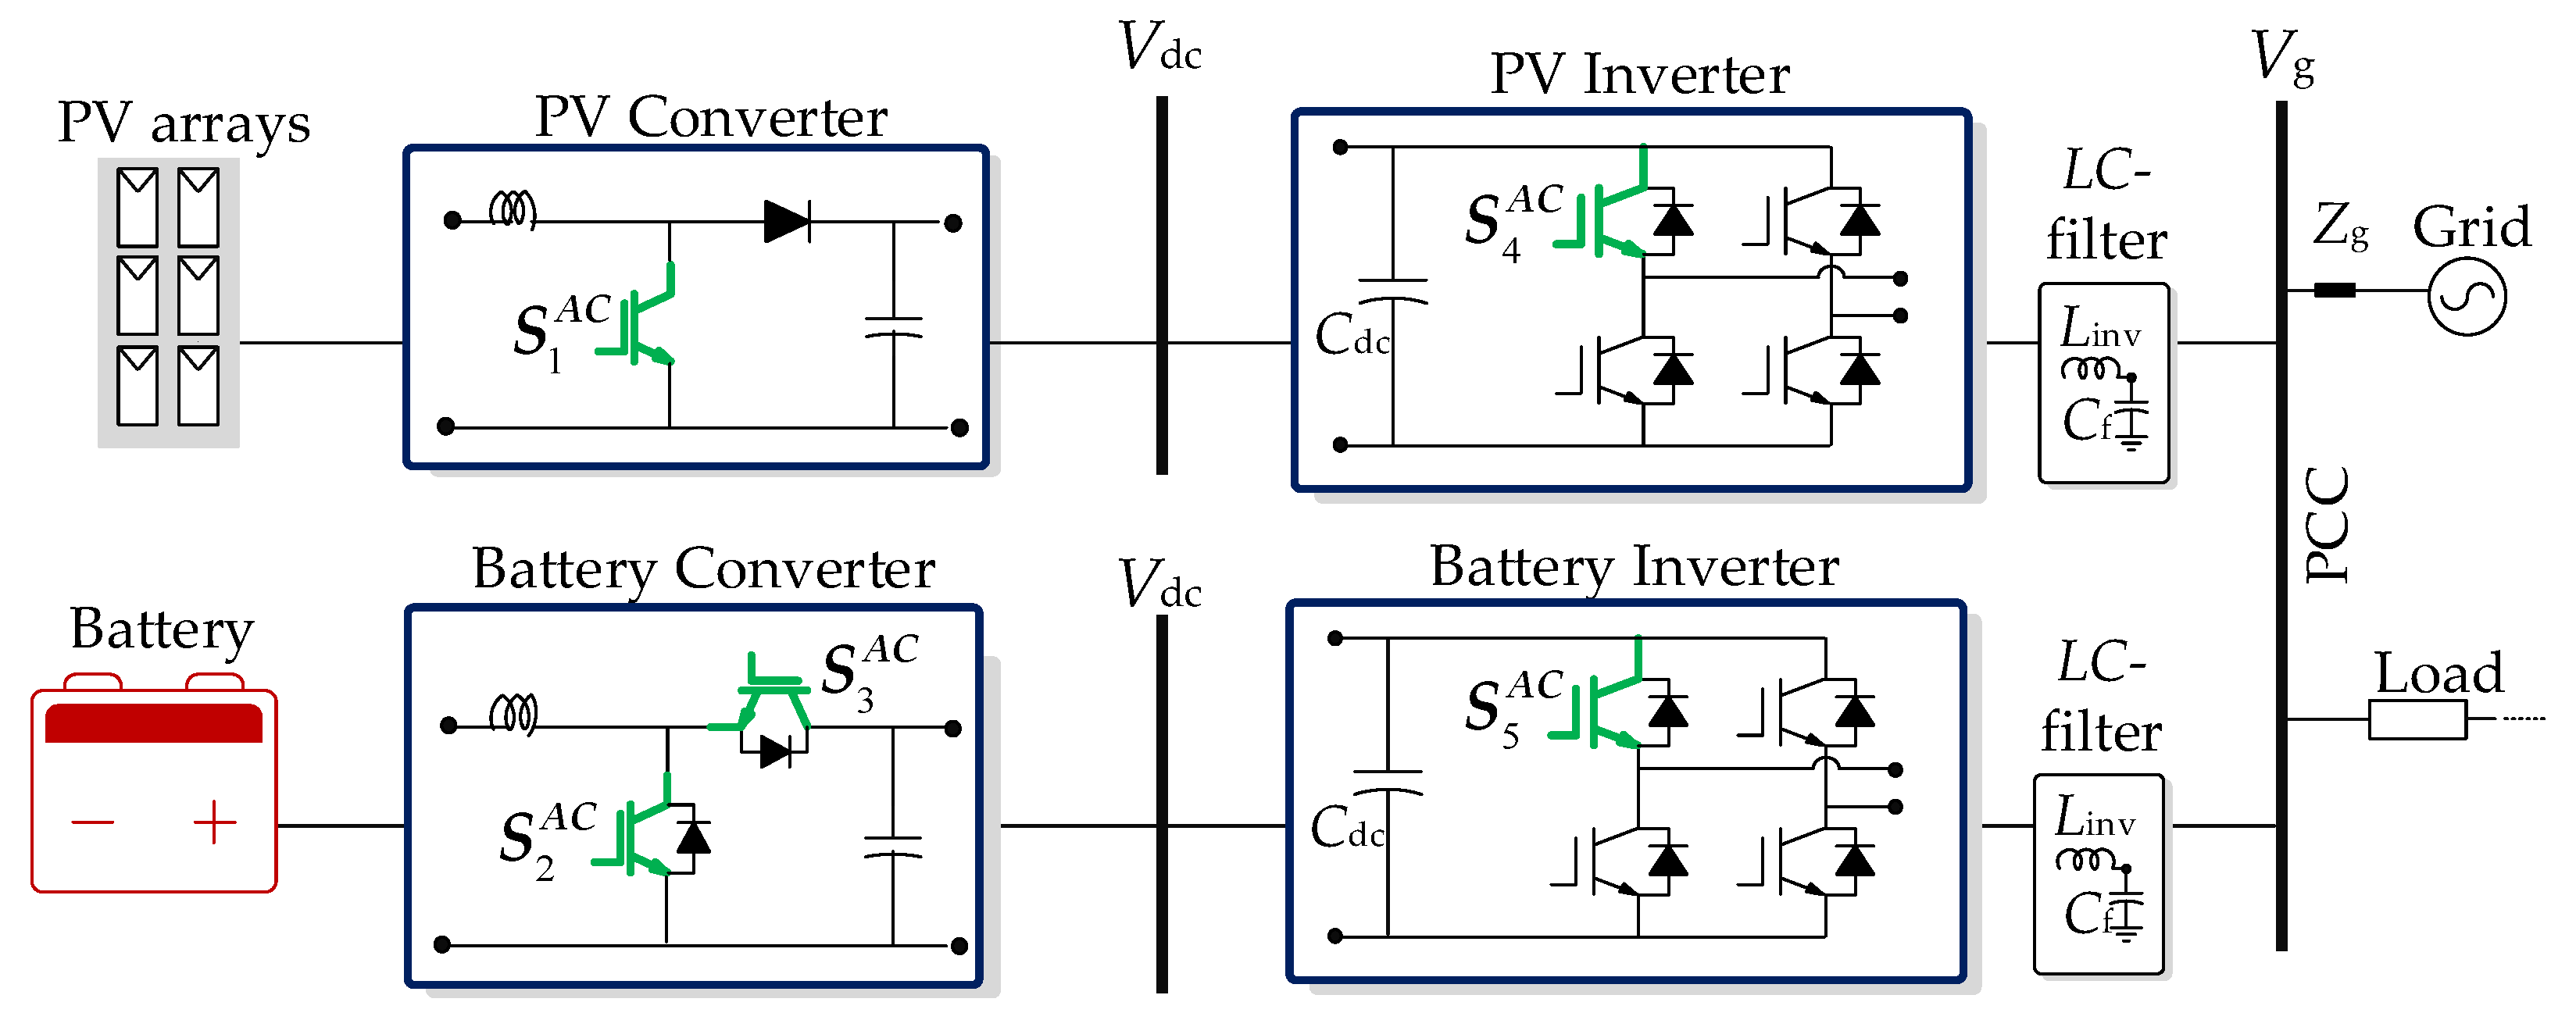
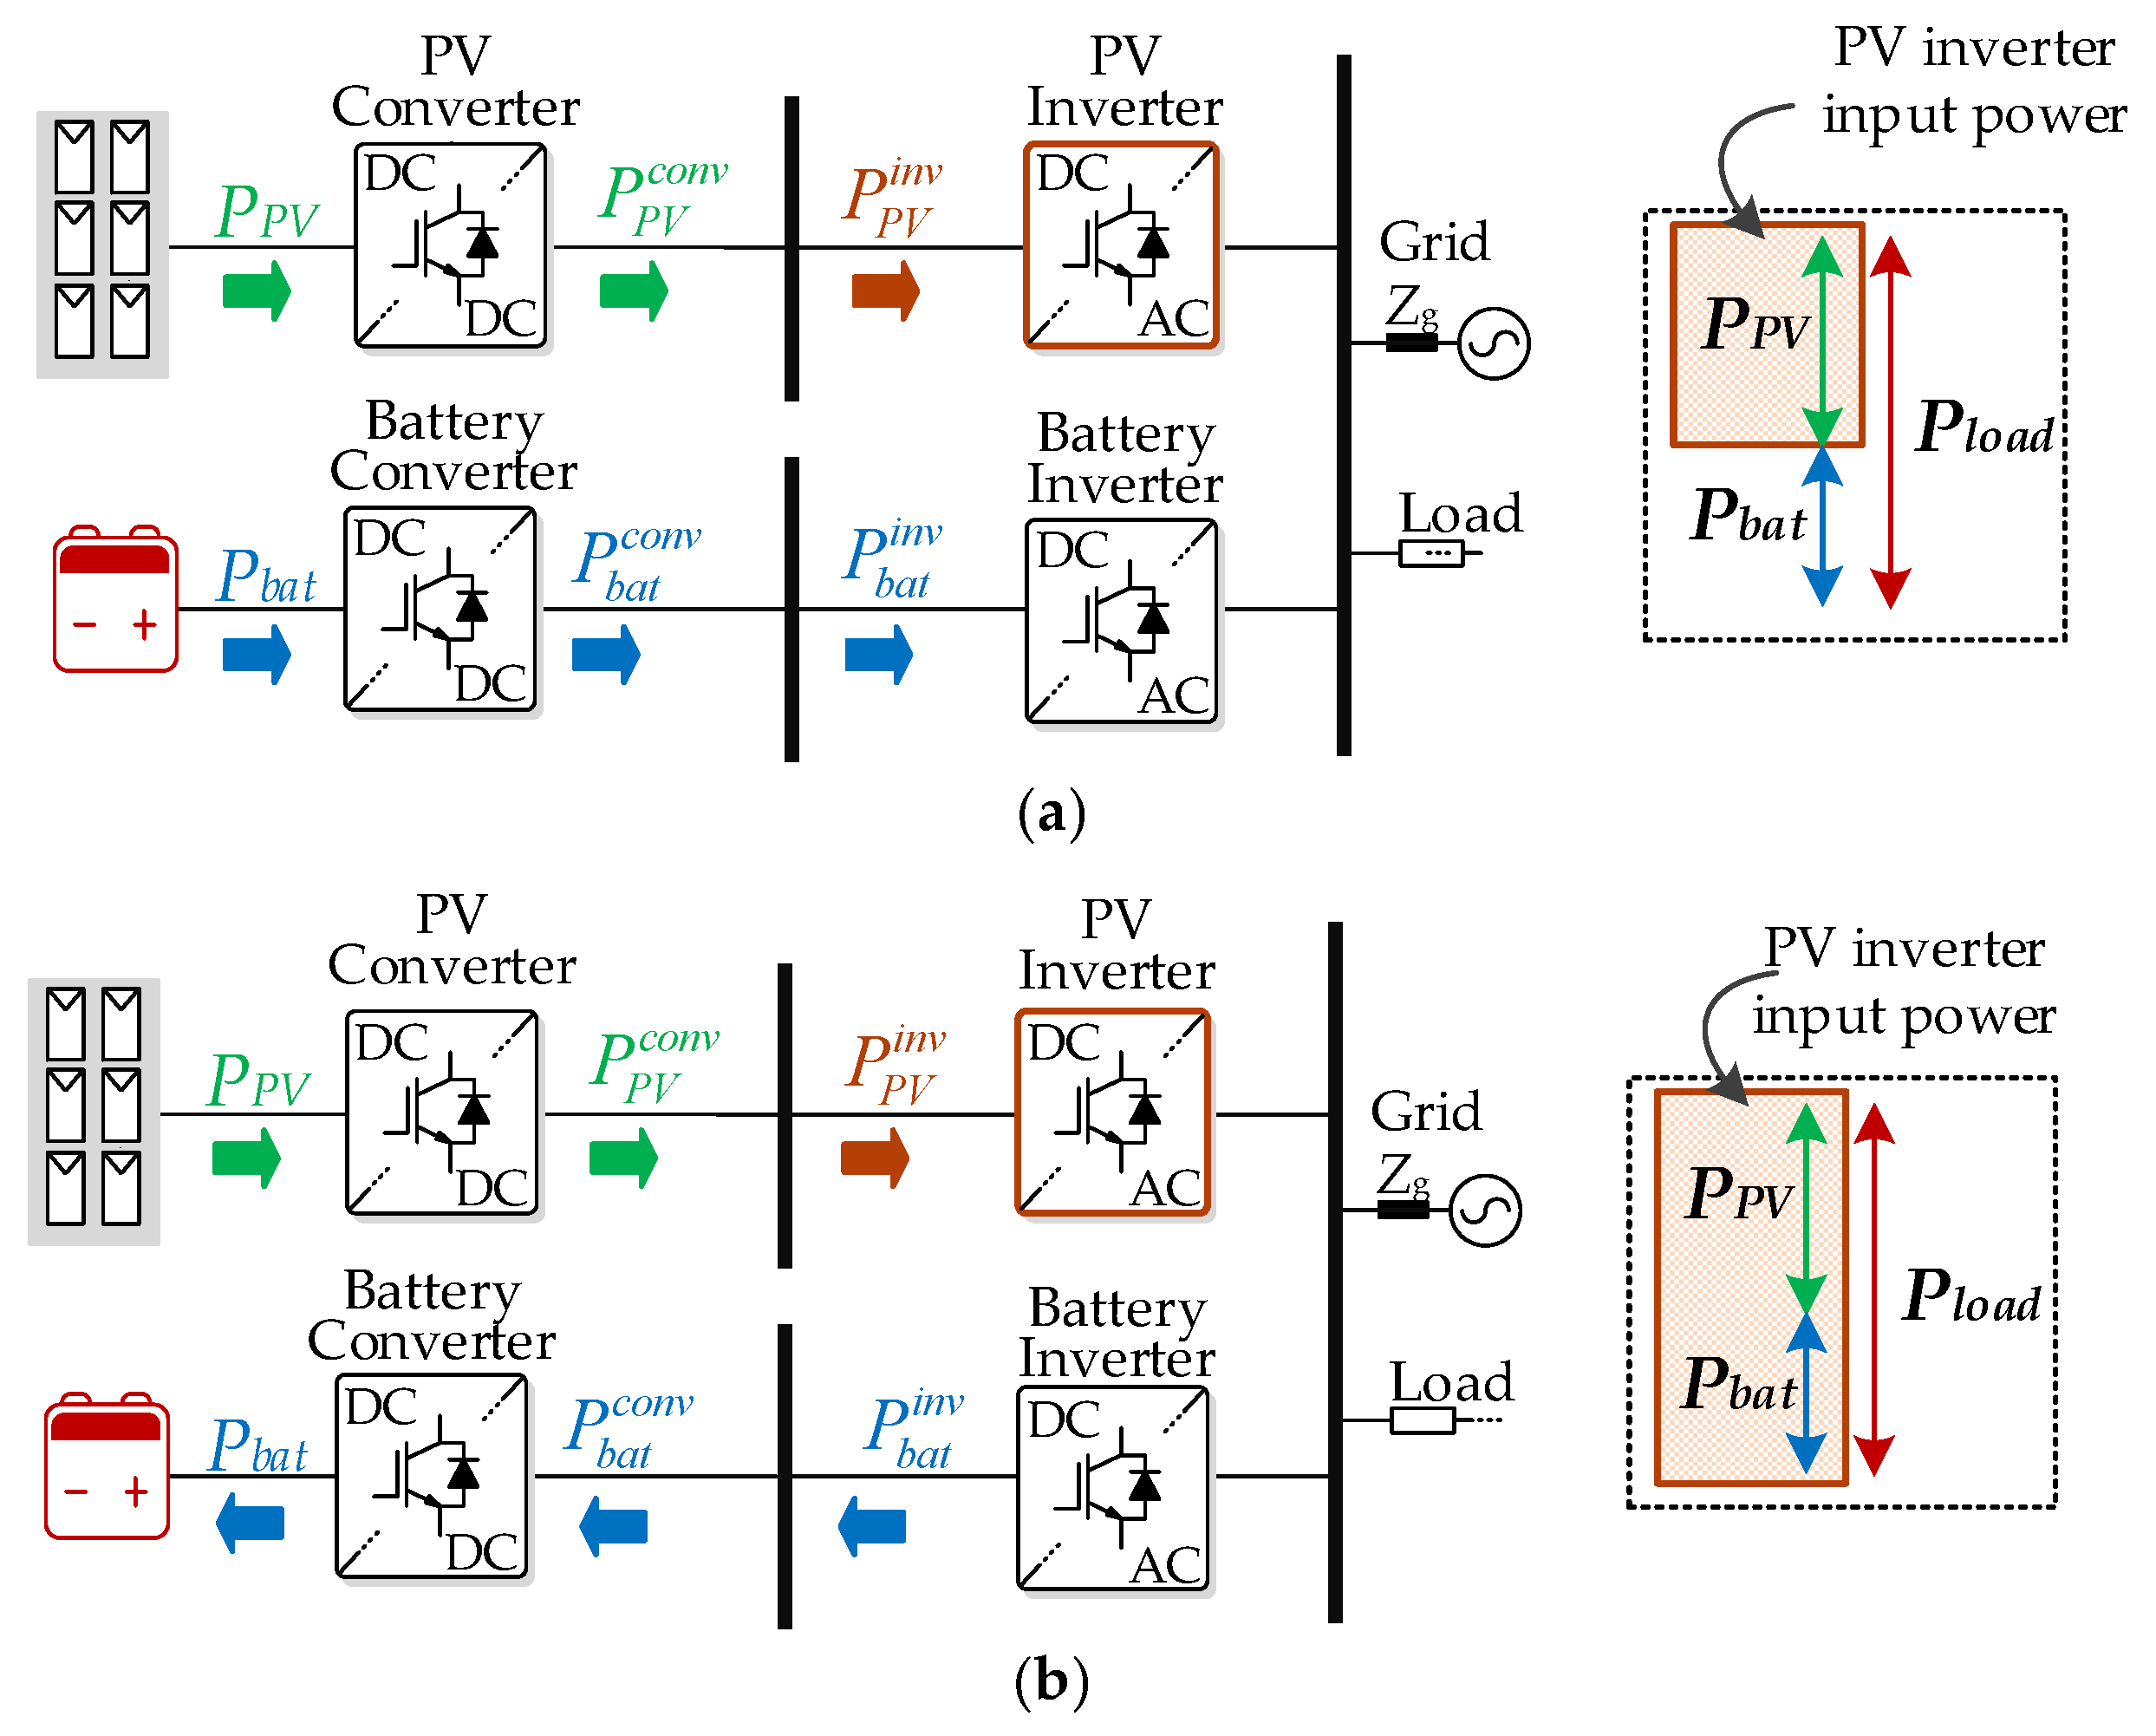
2.2.2. AC-Coupled Configuration

A system diagram of the AC-coupled configuration is shown in Figure 4. Its DC/DC interface configuration is the same as in the case of the DC-coupled configuration. DC/AC interface consists of two units—the PV and the battery inverters.
  • PV inverter: A DC/AC inverter whose main purpose is to transfer the power generated by the PV panel to the AC side, similar to that in the DC-coupled configuration.
  • Battery inverter: A bi-directional DC/AC converter connected to the battery. When the battery is discharging, the battery inverter is operating in the inverter mode. When the battery is charging, the battery inverter is operating in the rectifier mode. Its loading is only determined based on the excess PV power that is being absorbed and delivered by the battery.
The same topology as for the DC-coupled configuration is employed for the AC-coupled configuration for the comparison purposes in the further part of the paper. This refers that DC/DC interface is implemented through the boost convert and bi-directional buck-boost converter for PV and battery converter respectively. Similarly, the DC/AC interface is implemented by means of a full-bridge single-phase inverter with four power devices. In the next section, power converters loading in each configuration is examined more into detail.

3. Power Converters Loading

In order to analyze the operational impact on the component reliability, a power converter loading during a typical one-day operation of the PV-battery system is studied. The key target is to investigate the difference in the electrical and thermal loading of the components in the two configurations. In general, power converter loading is directly related to the thermo-mechanical stress of its components such as power devices, and it is the cause of the component’s failure, reflecting the reliability of the system [17].

3.1. Electrical Loading of Power Converters

Electrical loading of the power converters is investigated by the means of their input power. For DC/DC interface, input power to the PV converter equals the power generated by the PV array, P P V . The electrical loading of the PV converter is only influenced by the environmental conditions at the installation site (solar irradiance and ambient temperature). Contrary, the electrical loading of the battery converter is the result of the input PV power, load demand, implemented energy management strategy and available battery capacity. In the case of the DC/AC interface, input power is defined differently for the two configurations.

3.1.1. DC-Coupled Configuration

In the DC-coupled configuration, the DC/AC interface is represented through the inverter (Figure 3). The input power to this unit is defined as:
P i n v = P P V c o n v P b a t c o n v
where P P V c o n v and P b a t c o n v are output power of the PV and battery converter respectively, and are defined as:
P P V c o n v = P P V P P V l o s s
P b a t c o n v = P b a t P b a t l o s s
where P P V l o s s and P b a t l o s s represent converter losses defined based on the their respective efficiency curves. P P V is power generated by the PV panel and P b a t is power absorbed (positive power) or delivered (negative power) to the battery.
Electrical loading of the DC/AC inverter differs for battery discharging and charging. This is graphically represented in Figure 5, where the inverter input power for two cases is highlighted.
As observed, the electrical loading in case of the battery discharging will be higher, as it will account for the power generated from PV and delivered by the battery.

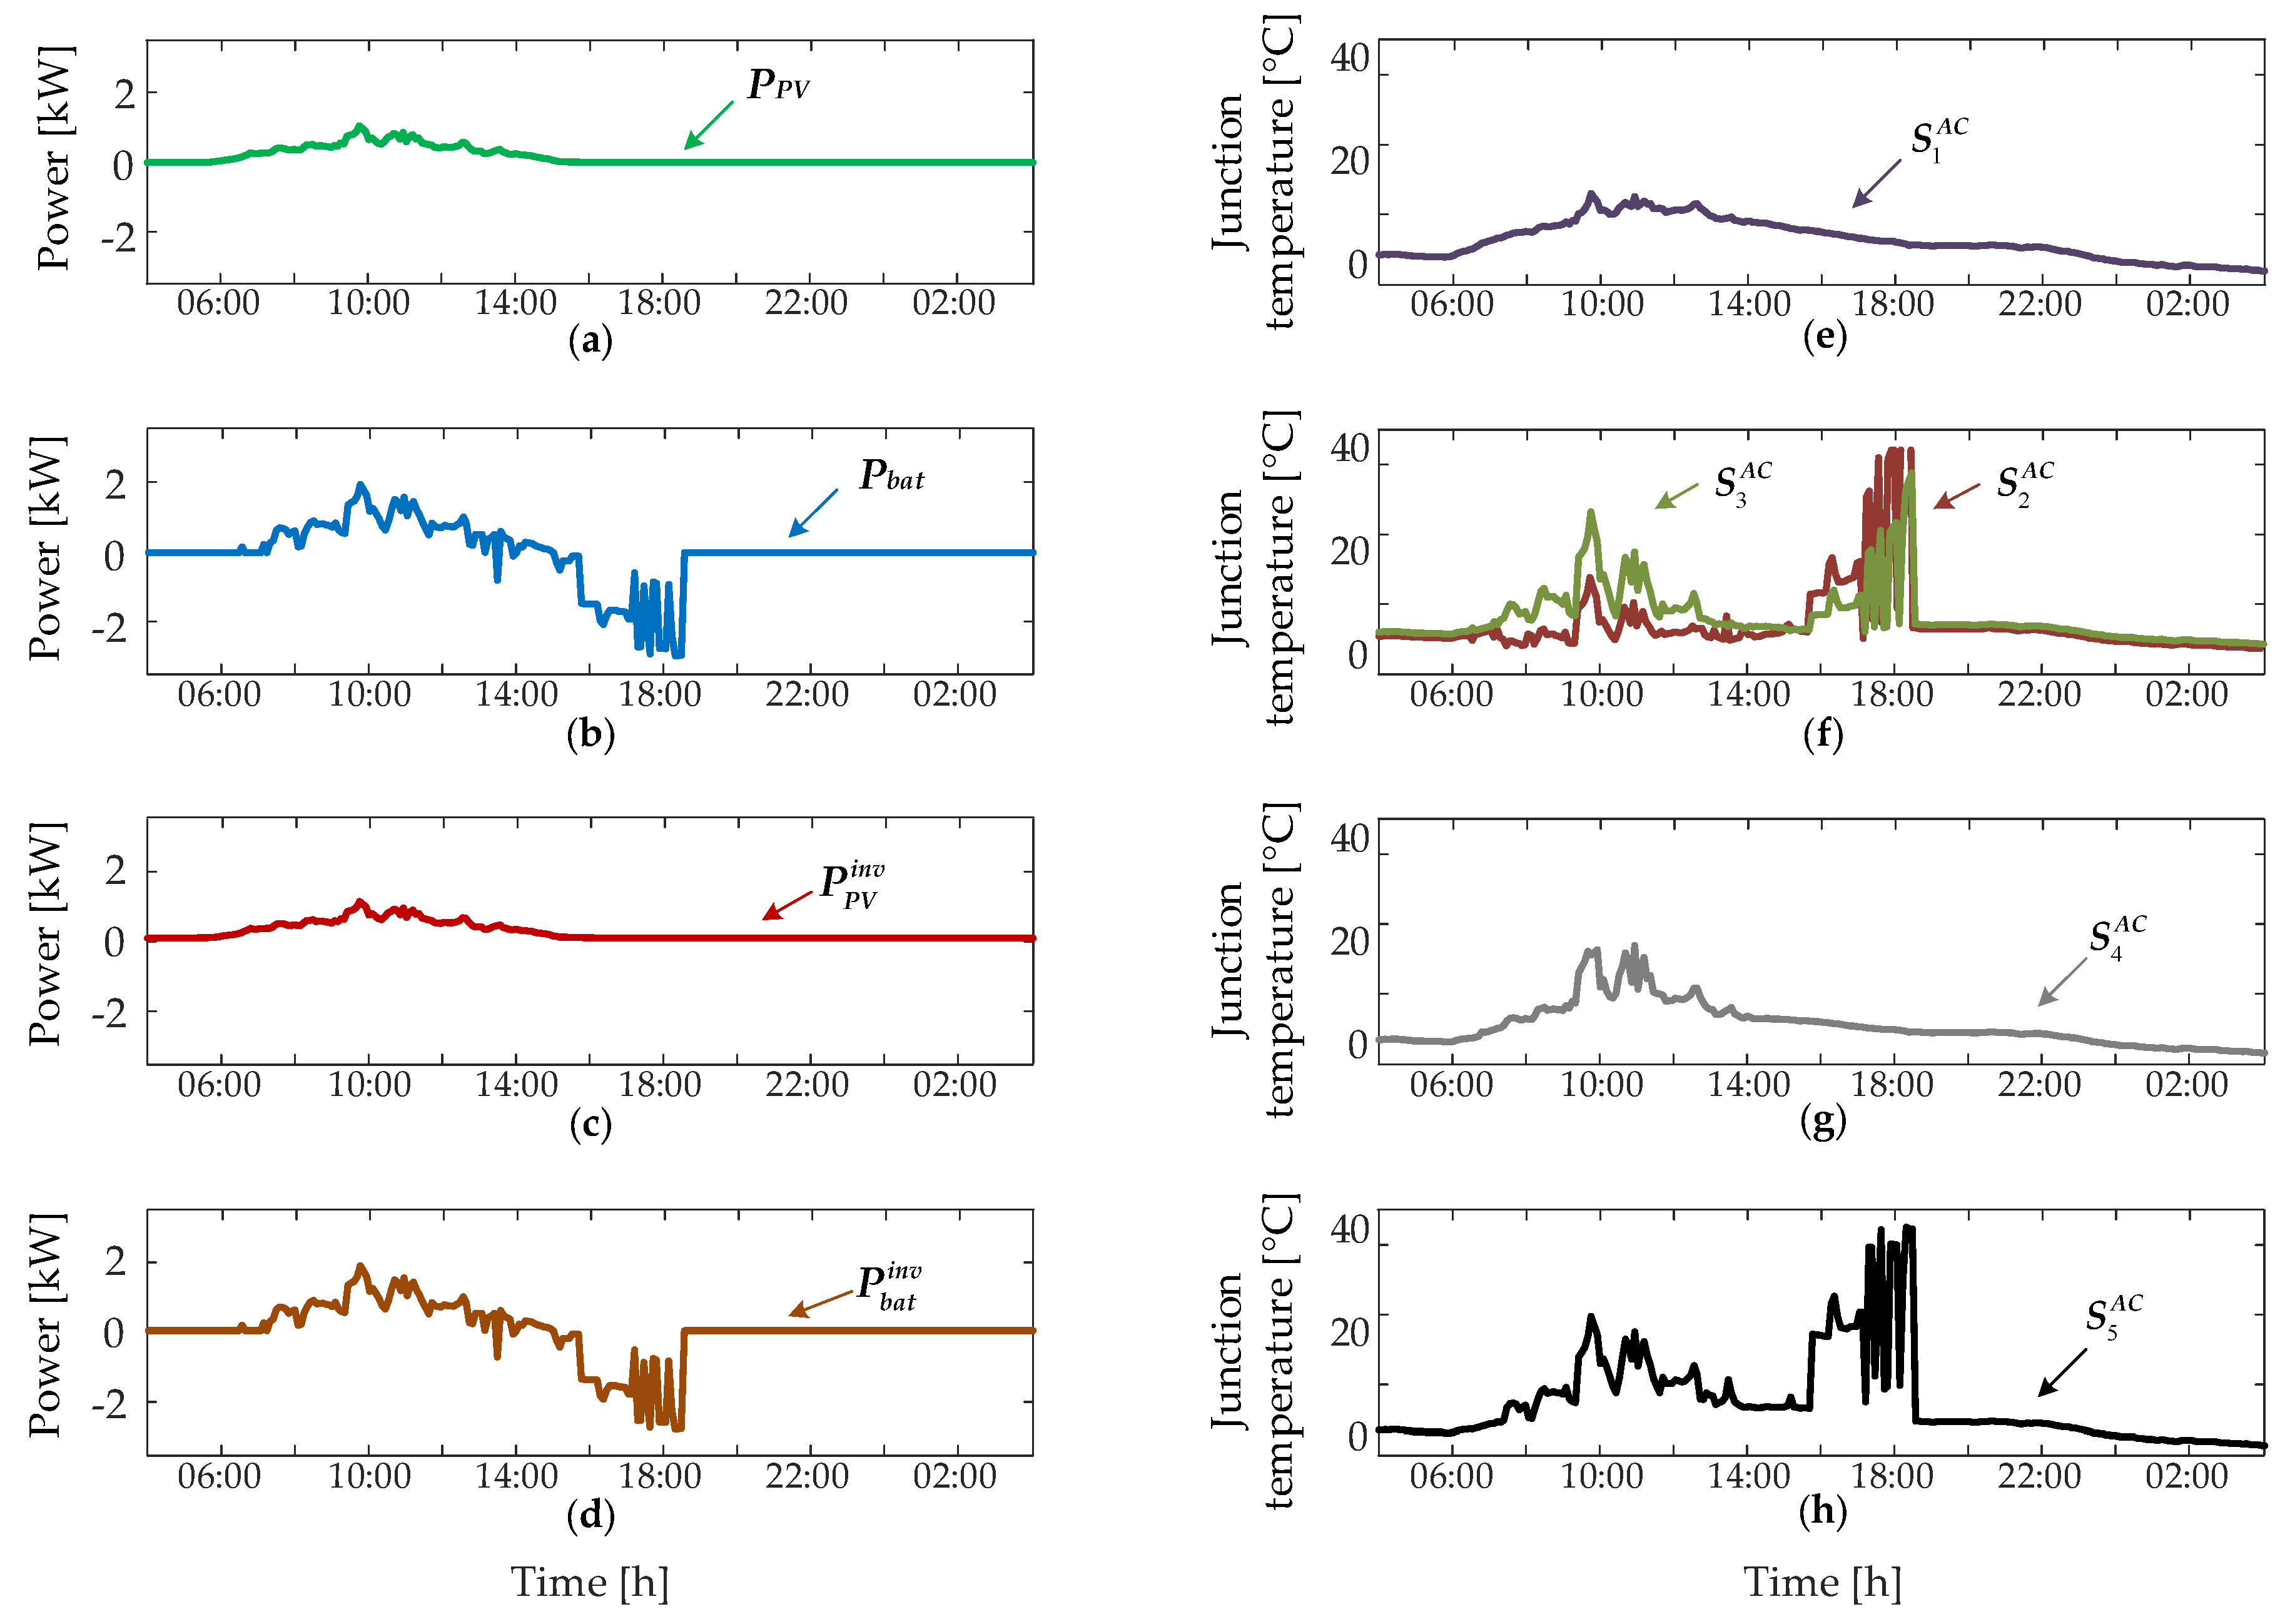
3.1.2. AC-Coupled Configuration

The DC/AC interface for the AC-coupled configuration is represented through the PV and the battery inverters (Figure 4). The input power for each unit is defined as:
P P V i n v = P P V P P V l o s s
P b a t i n v = P b a t P b a t l o s s
where P P V l o s s and P b a t l o s s represent converter losses defined based on the their respective efficiency curves.
The graphical representation of the electrical loading in the case of the battery charging and discharging is shown in Figure 6 with the highlighted PV inverter input power.
As in the case of the DC-coupled configuration, the electrical loading of the PV inverter is examined. In case of the battery charging, the electrical loading will be higher. This is because the excess power generated by the PV is sent to the battery at the AC side.

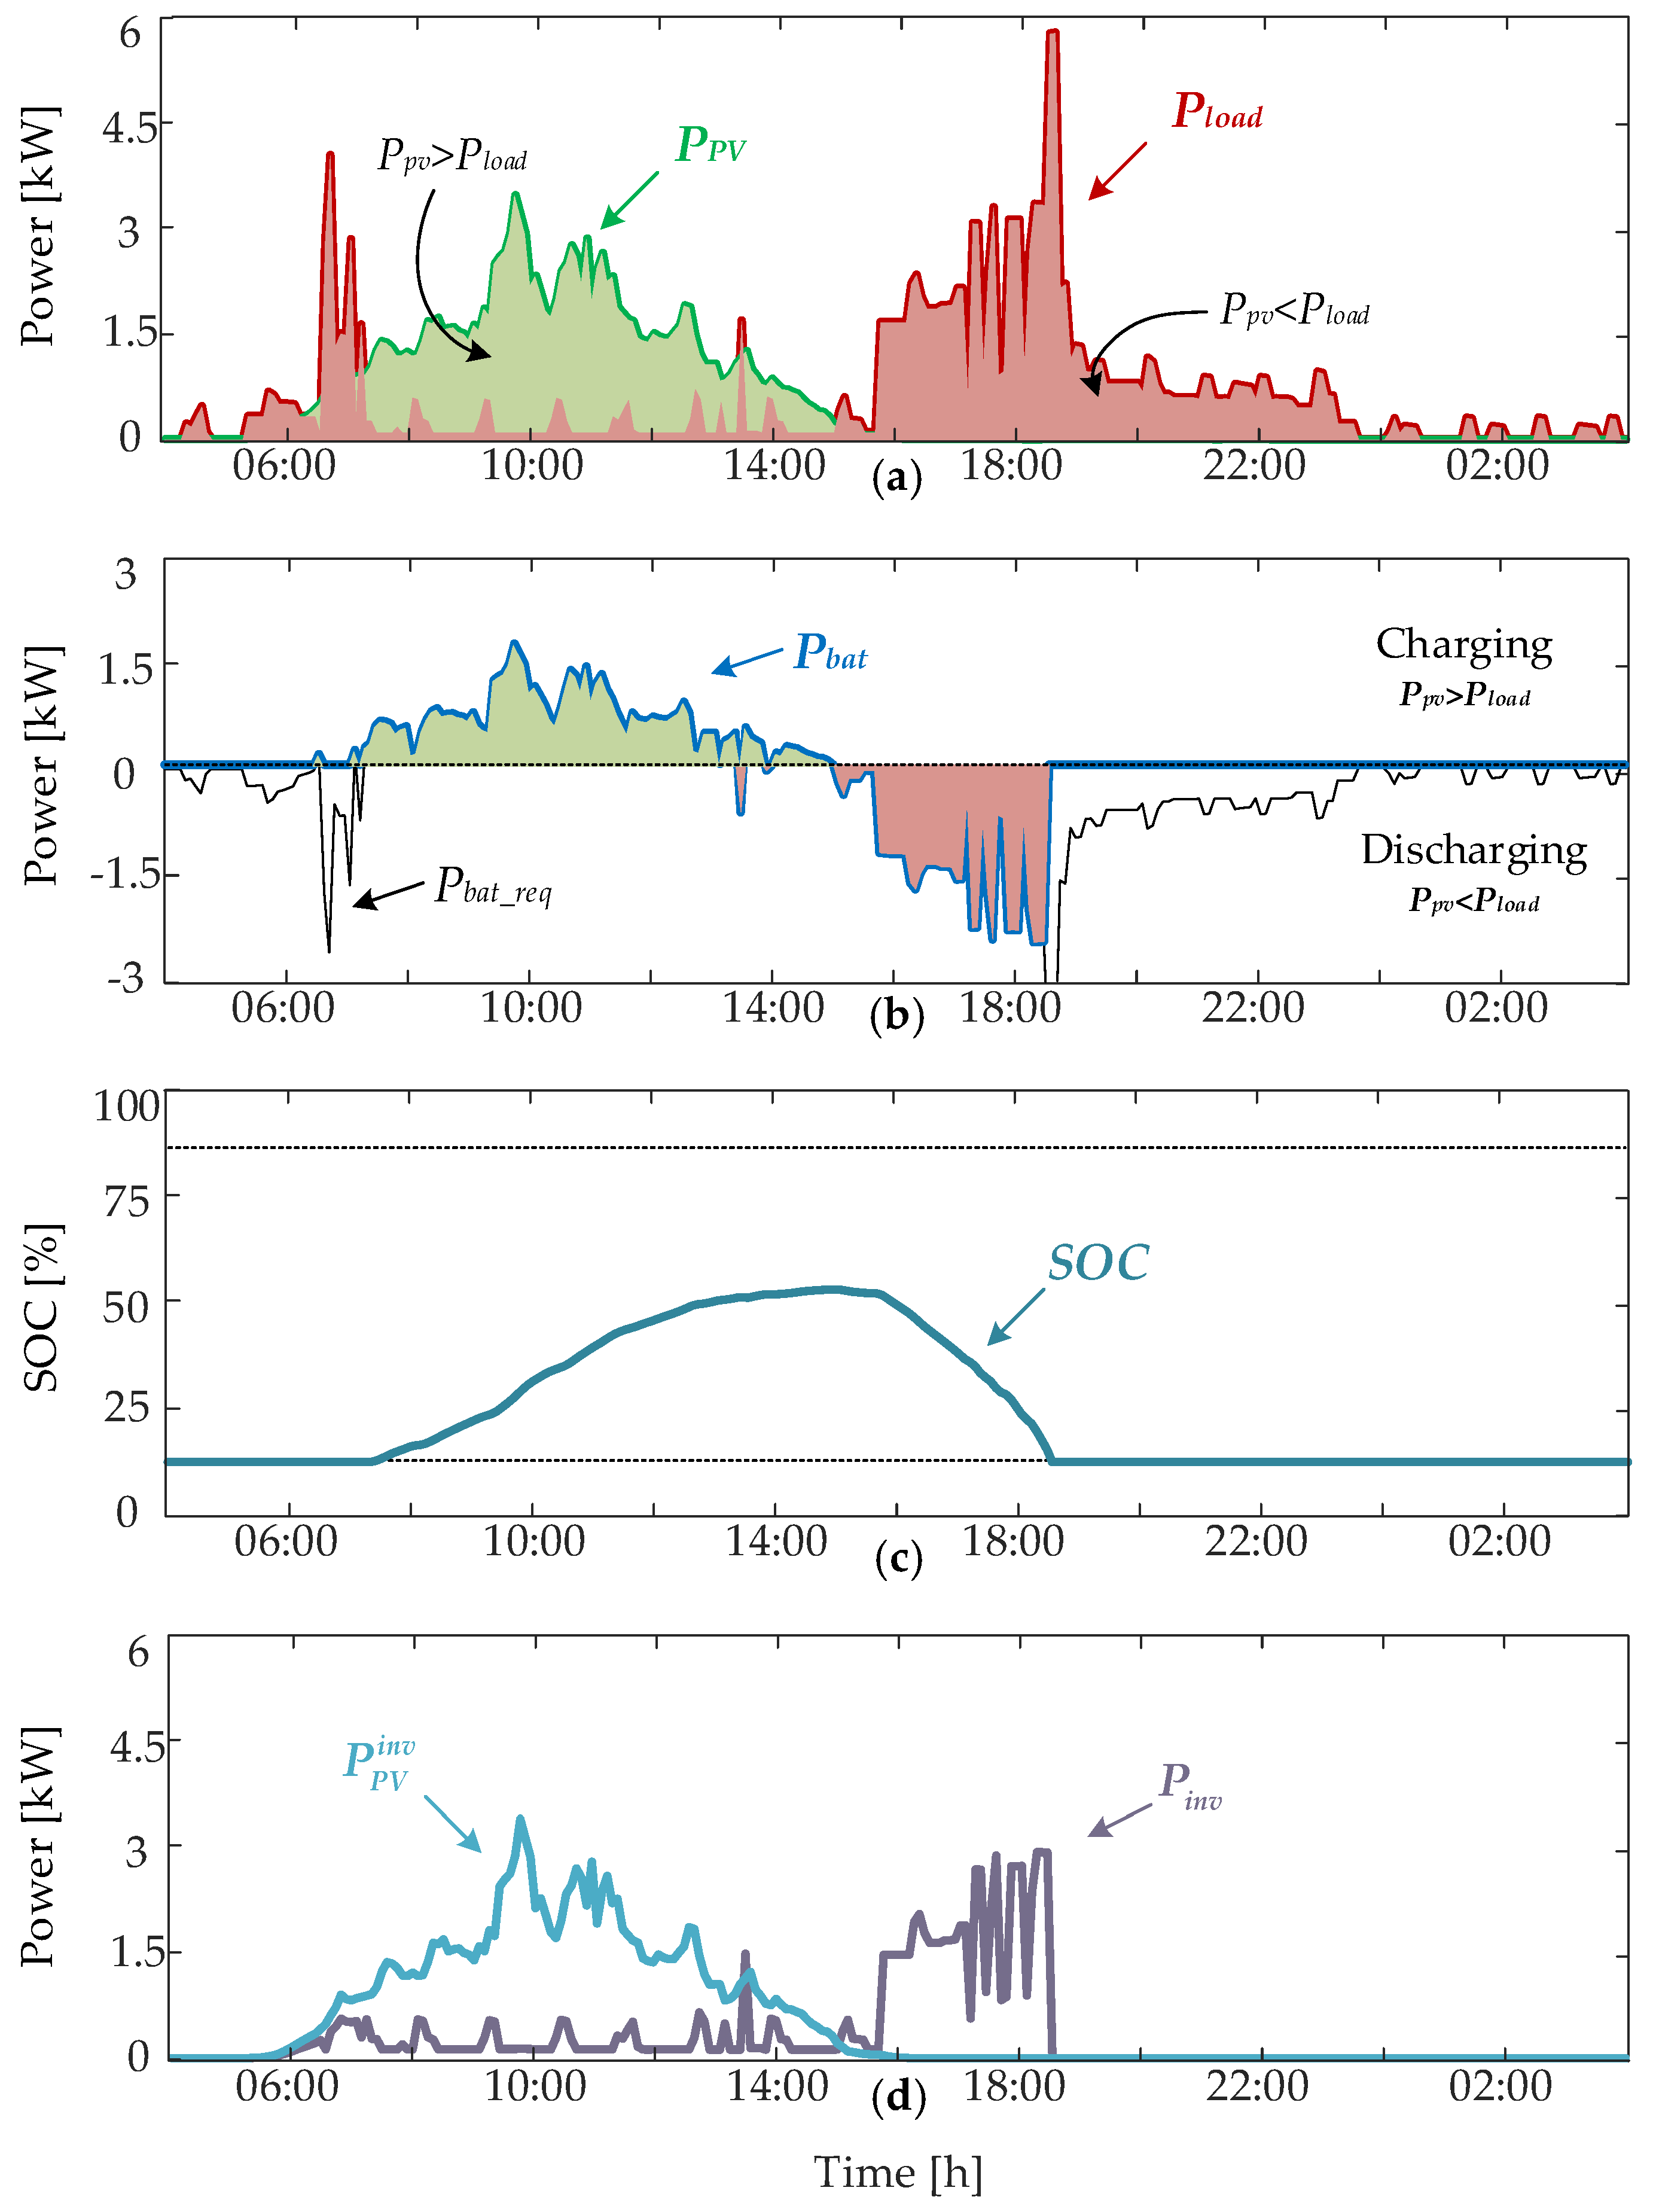
3.1.3. One-Day Operation

An example of the electrical loading of the PV and battery converter during one-day operation is shown in Figure 7, where P P V and P b a t are input to the PV and battery converter respectively. Two time intervals are distinguished. (1) battery charging period marked with the green area under the curve and (2) battery discharging period marked with the red area under the curve. On the example of the two time intervals, the electrical loading of the DC/AC interface is examined and compared for the two configurations in order to exemplify the power flow shown in Figure 5 and Figure 6.
In the case of battery discharge, the input power for the inverter in the DC-coupled configuration equals to the sum of PV and battery power. For the same amount of power that has to be delivered to the load in the AC-coupled configuration, the electrical loading of the PV inverter is the PV power, while power being delivered from the battery is transferred through the battery inverter. During the battery discharge, the electrical loading of the DC-coupled configuration inverter is higher than the one of the PV inverter in AC-coupled configuration.
In case of battery charging, the input power for the inverter in the DC-coupled configuration equals to the amount of PV power that is needed to supply the load demand. The rest of the PV power is transferred to the battery at the DC bus (i.e., the excess PV power is input to the battery converter). In the case of the AC-coupled configuration, the electrical loading of the PV inverter is equal to the total power generated from the PV panels. At the AC side, this power is then divided to supply the load and the excess that is input to the battery inverter. In such a case, the electrical loading of the AC-coupled configuration PV inverter is higher than the one of the inverter in DC-coupled configuration.
By examining the electrical loading of the components in the DC- and AC-coupled configuration, it can be concluded that the DC/AC interface electrical loading is depended on the input power profiles and cannot be universally connected to higher or lower reliability for a certain configuration. The summary of the examined cases for the inverter in DC-coupled configuration and PV inverter in AC-coupled configuration is given in Table 1.

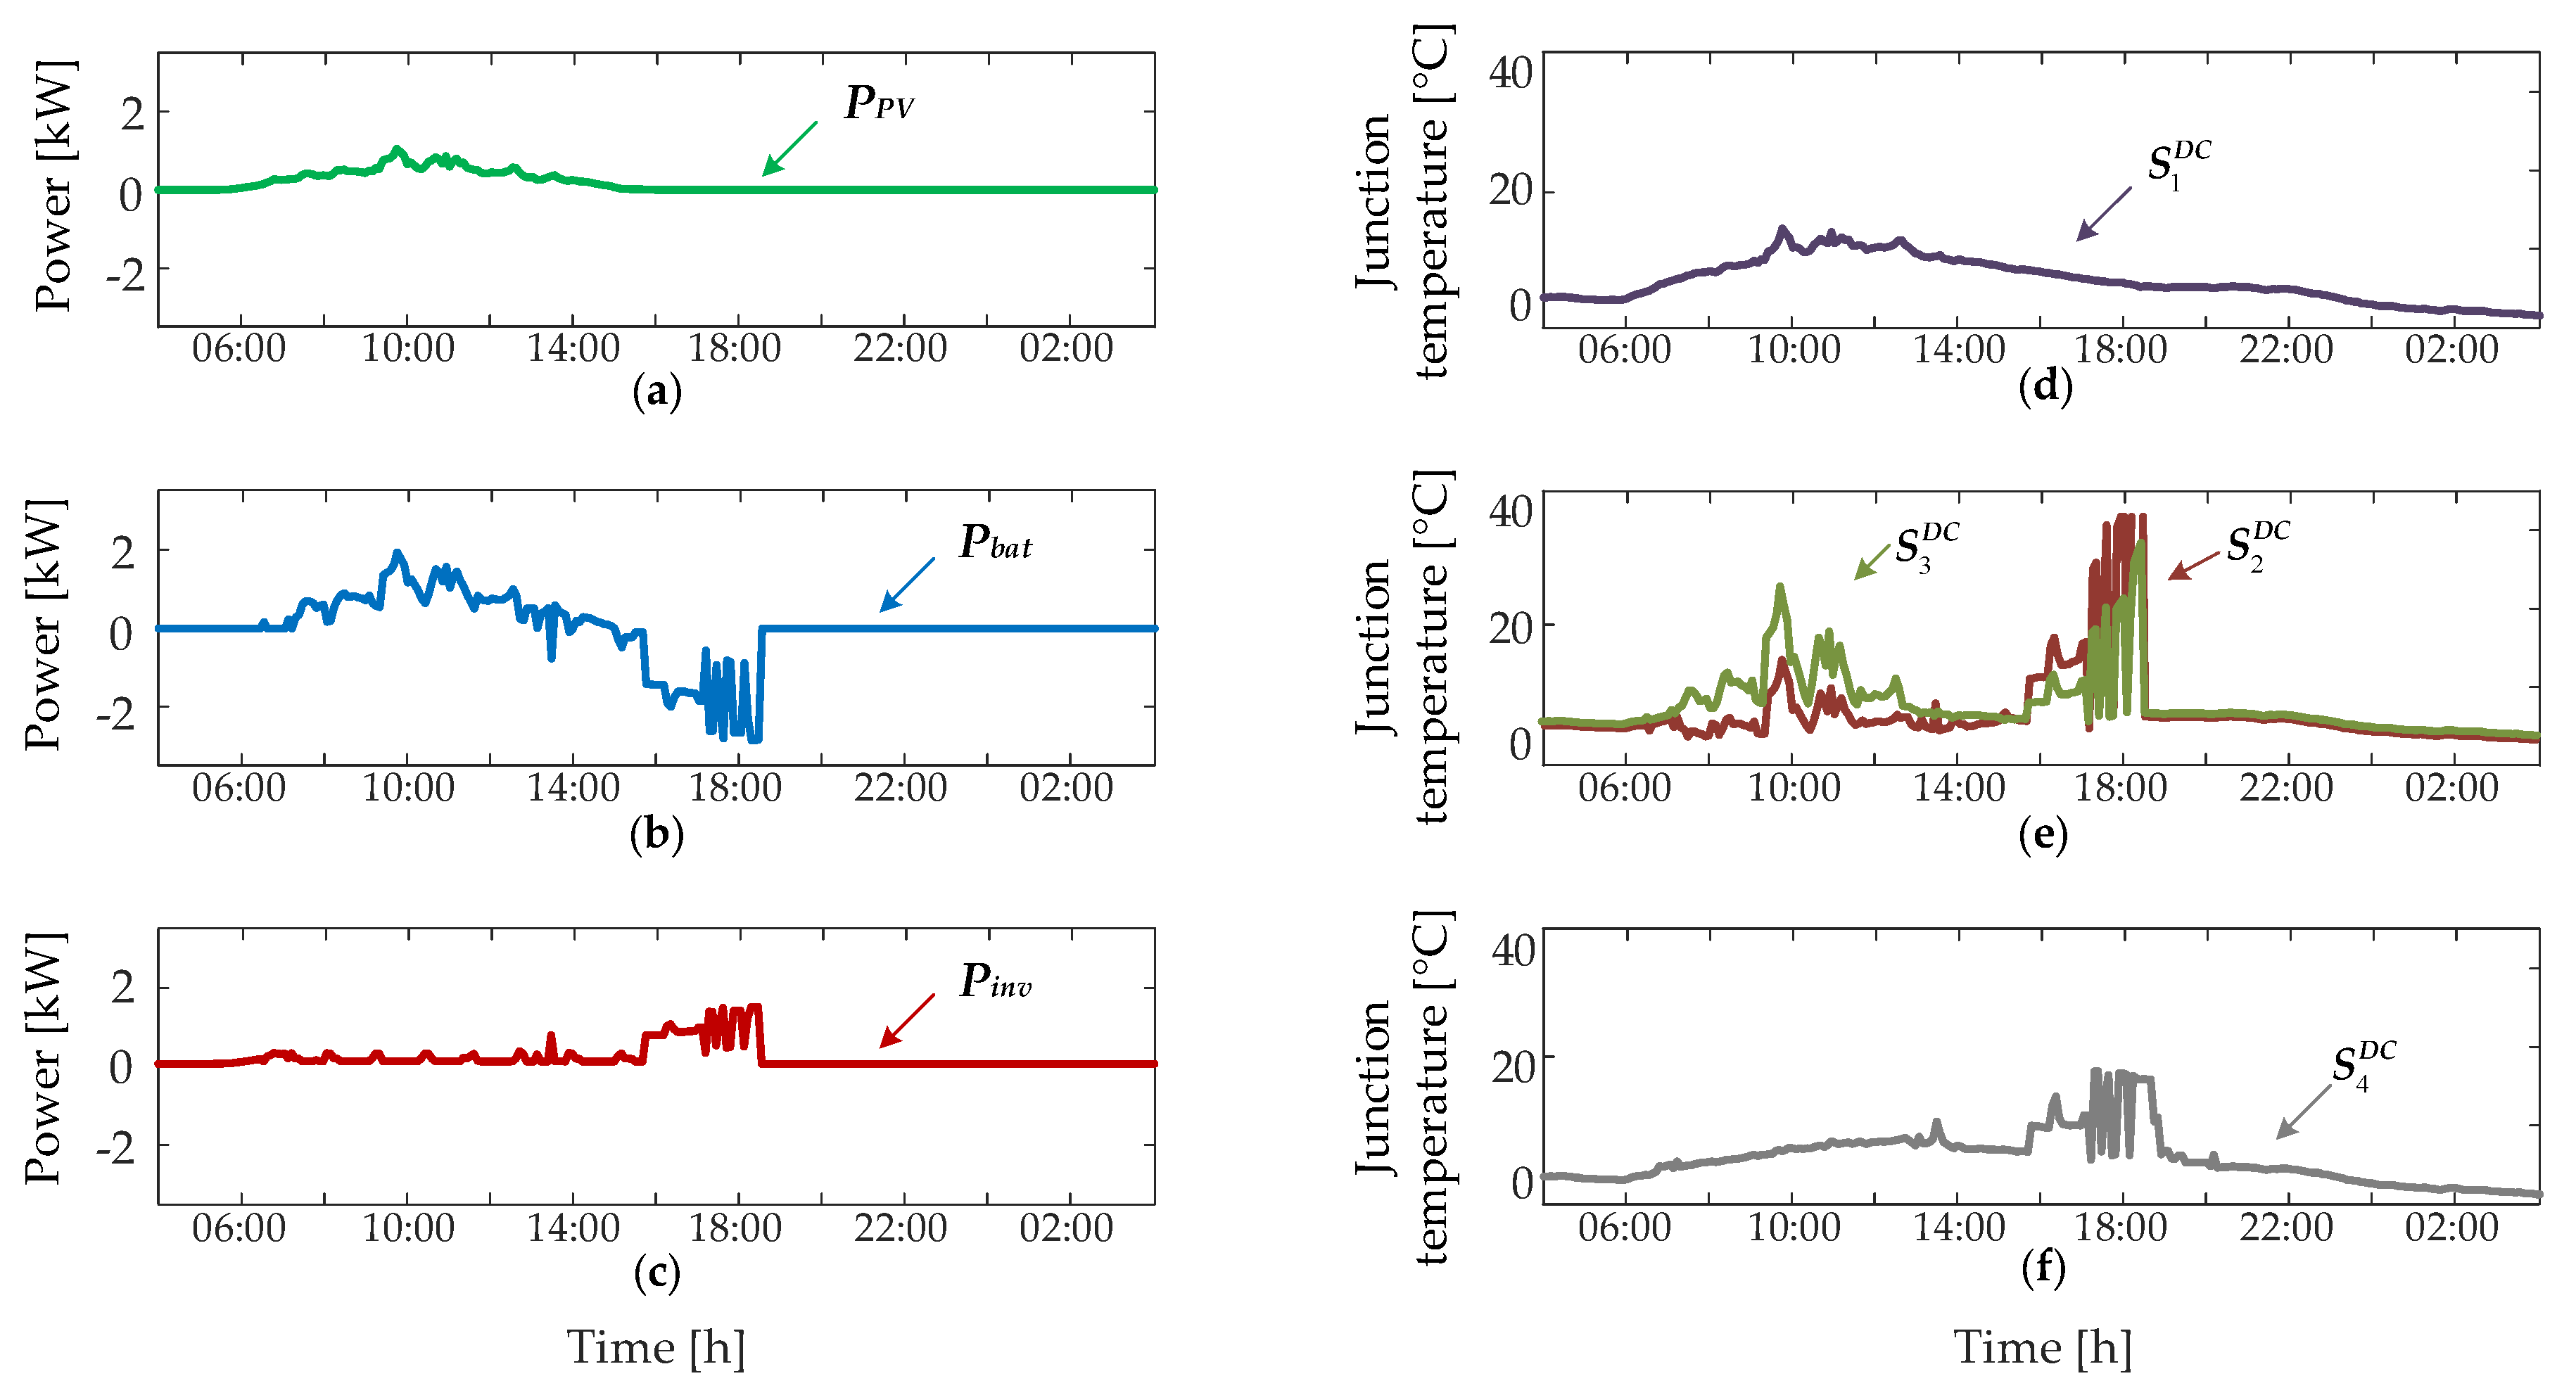
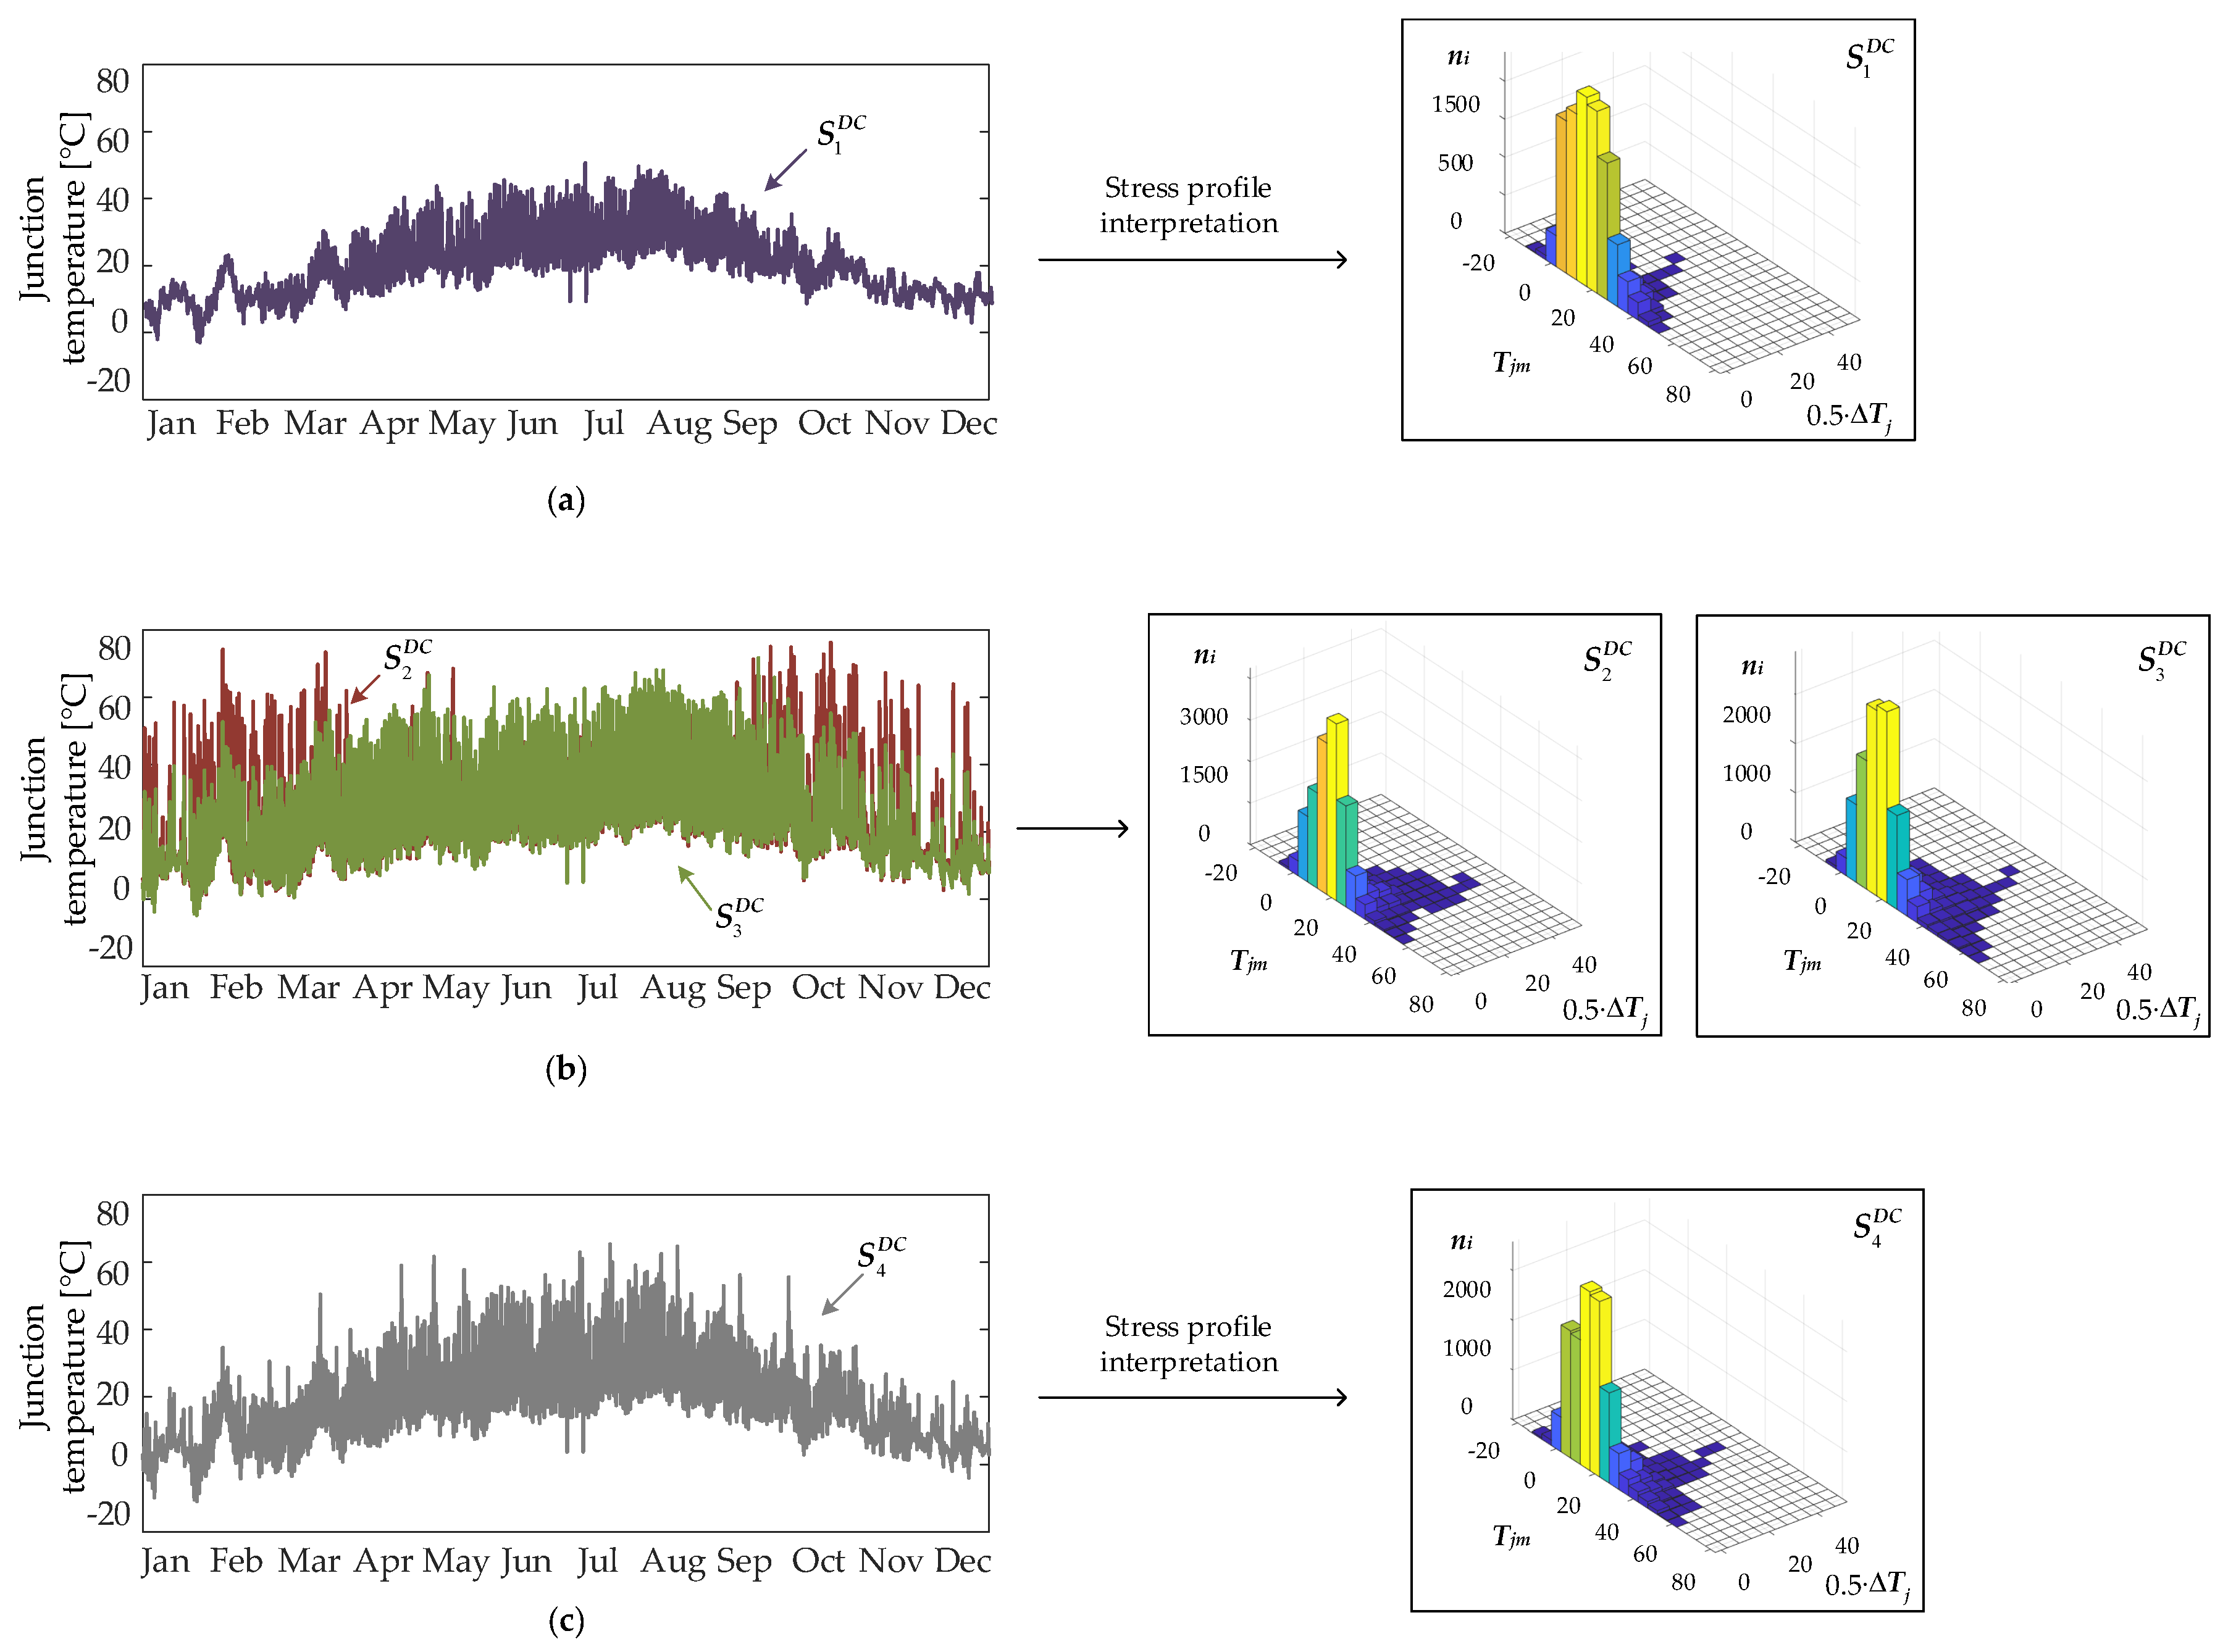
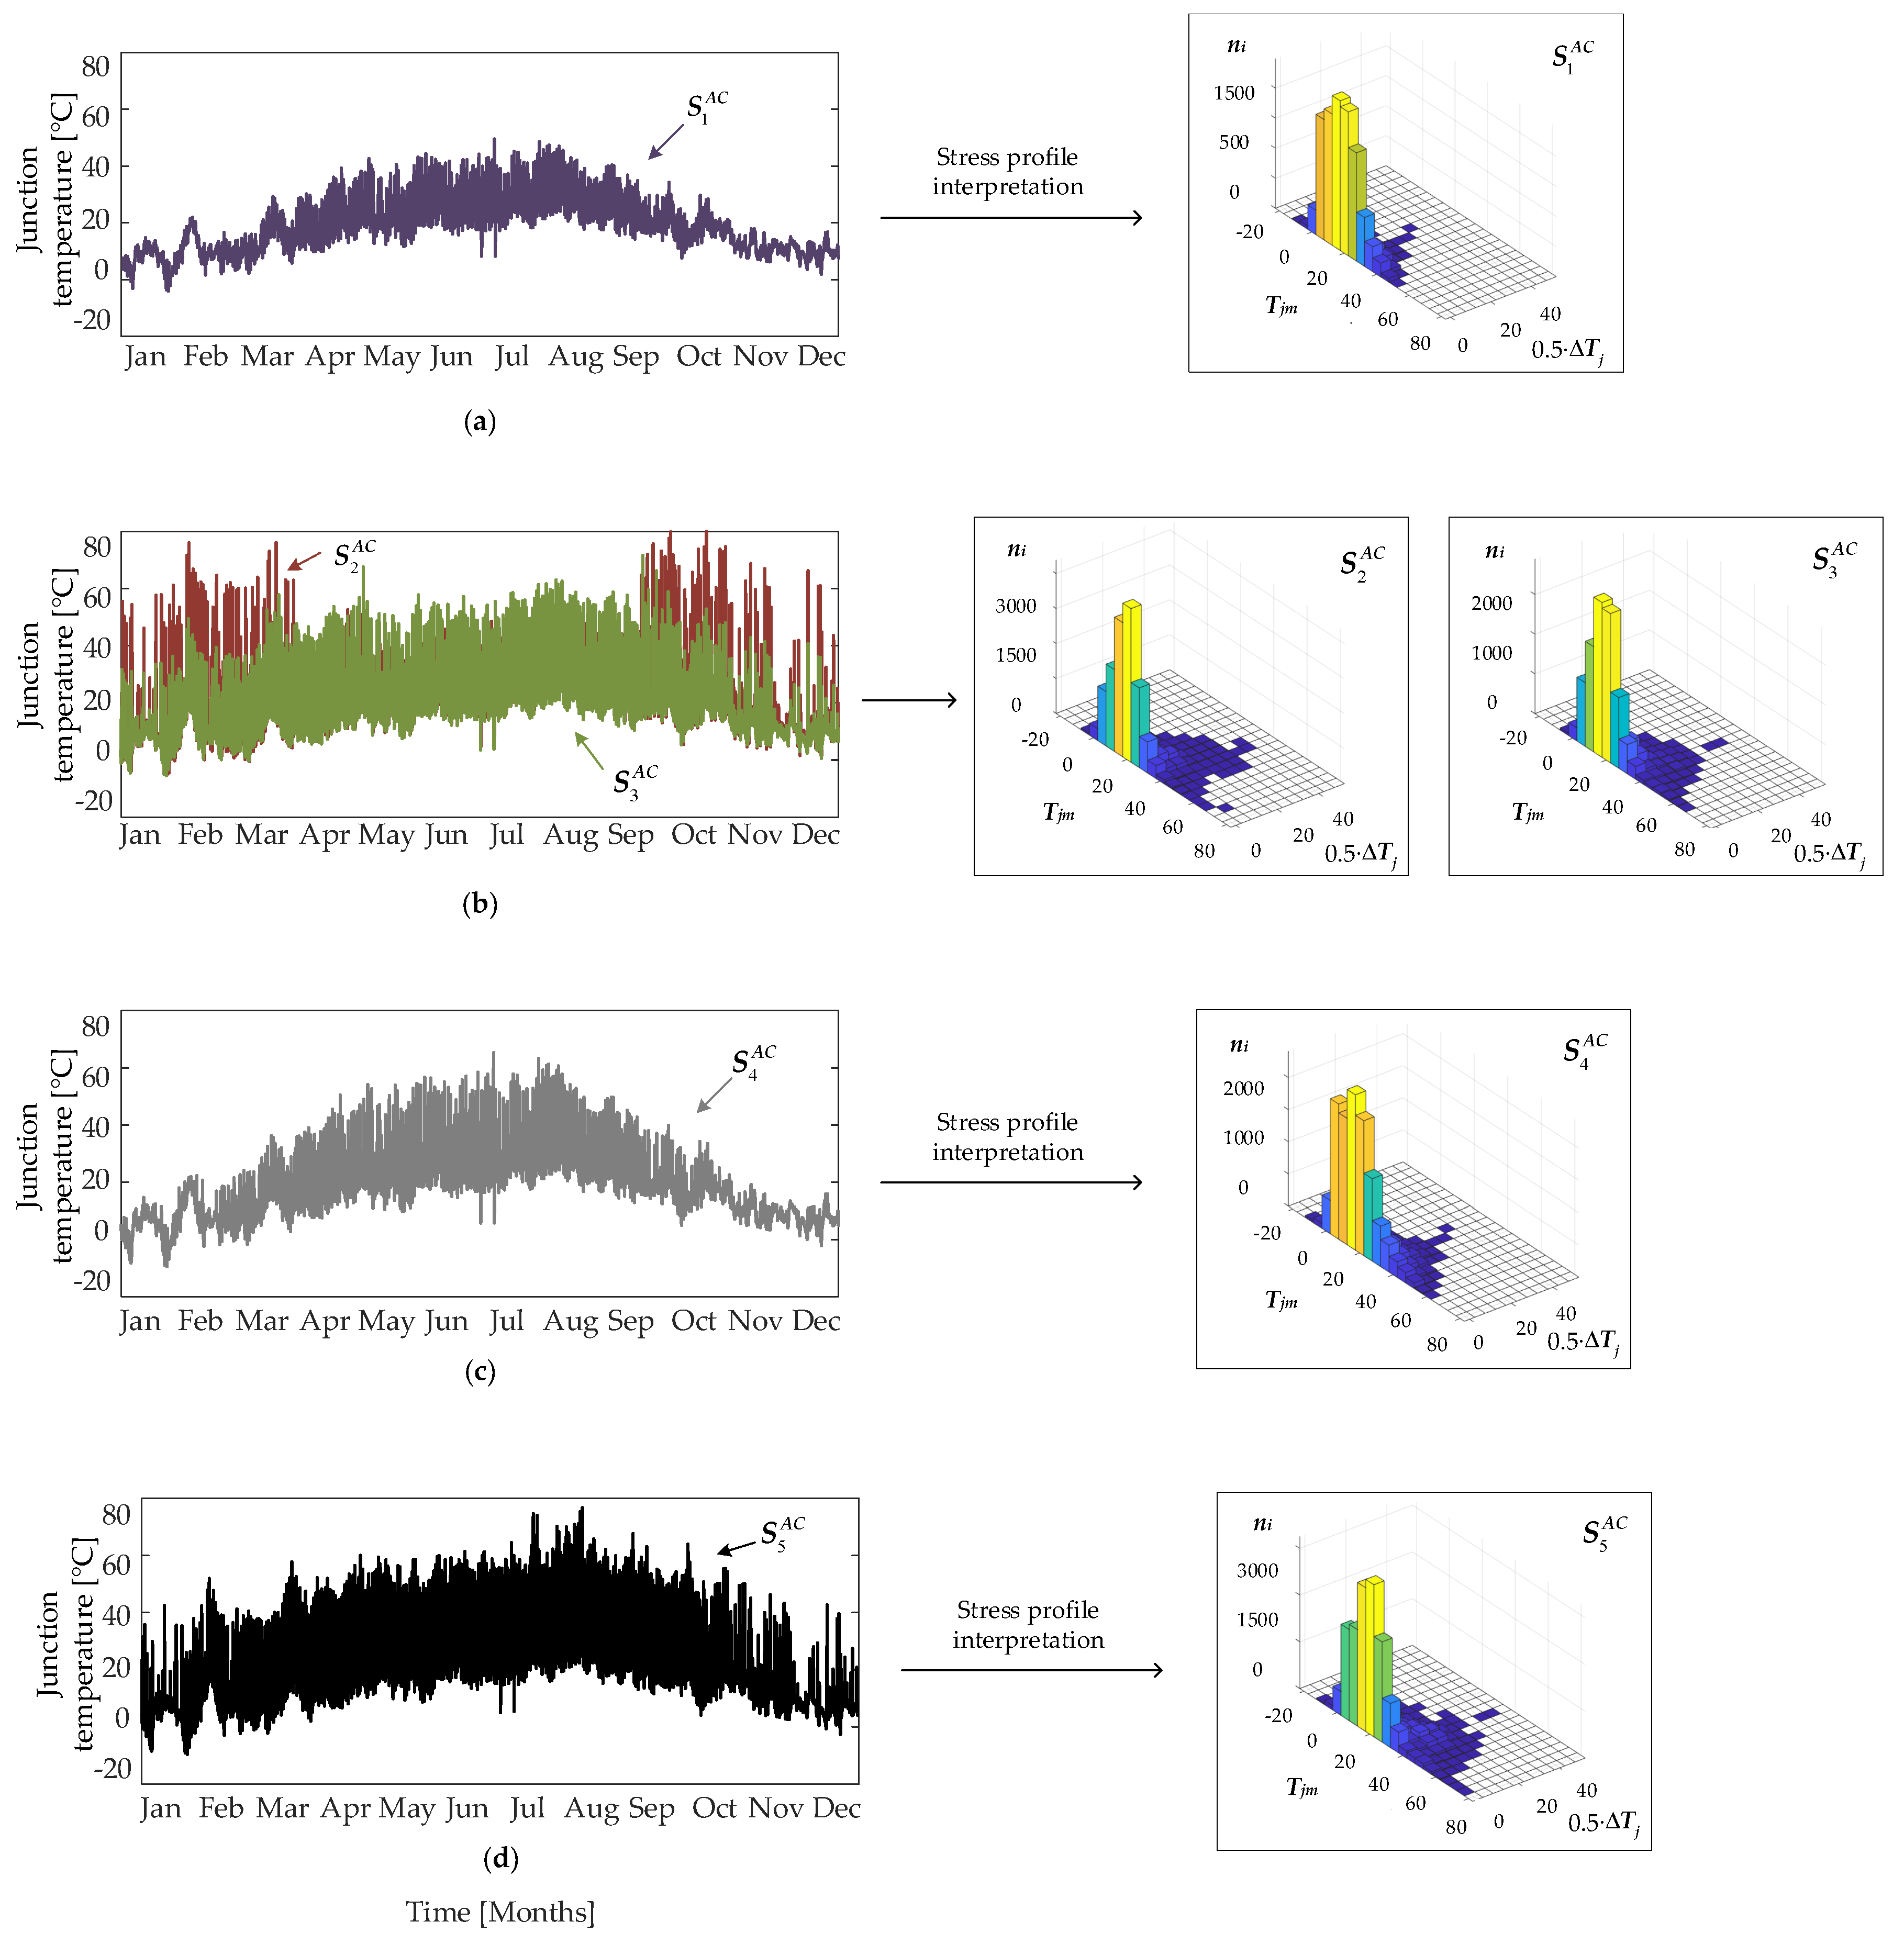
3.2. Thermal Loading of Power Converters

Thermal loading of the power converters can be investigated by means of the thermal stresses of the power devices, i.e., Insulated Gate Bipolar Transistors (IGBT). The thermal stress of the power device can be translated from the electrical loading by the electro-thermal model. The thermal stress is represented by the variations in the junction temperature cycling T j of the power device. Junction temperature is the stress factor which will cause the bond wire lift-off (representing the wear out failure of a power device). The detailed procedure for the electro-thermal modelling is presented in [18,19].
Thermal loading of the IGBT during one-day operation is investigated. Electrical loading profiles of the power converters in the DC-coupled configuration are shown in Figure 8. Furthermore, the associated junction temperature of the IGBTs (indicated in Figure 3) are also presented, where the variations in the junction temperature are correlated with the electrical loading profiles. The highest variations in the junction temperature occur in the power devices of the battery converter. This is aligned with the variations in the electrical lading of the battery converter.
Similarly, the electrical and the thermal loading profiles during one-day operation in the AC-coupled configuration are shown in Figure 9.

4. Reliability Evaluation

In this section, the reliability analysis is conducted by following the procedure presented in [17]. It involves the lifetime modeling of the system components and the (un)reliability analysis where the statistic of the failure rate is considered.

4.1. Lifetime Modelling

It is necessary to choose adequate lifetime model of the power device providing information on the number of cycles to failure for each set in the thermal stress matrix: the average junction temperature T j m , the cycle amplitude Δ T j and the cycle period t o n . An overview of the lifetime models predominately used for this purposes is provided in [18]. In this study, a lifetime model estimating the power cycling capability of IGBTs with junction temperature limitations of 150 °C is used [20]. The number of cycles to failure is then defined as shown in Equation (7). The input to the model is the matrix of n i for T j m and Δ T j and t o n values. The rest of the model parameters is provided in Table 2. Then, the amount of device’s consumed life is evaluated by means of Miner’s rule shown in Equation (8).
N f = K · ( Δ T j ) β 1 · e β 2 T j m + 273 · ( t o n ) β 3 · ( I ) β 4 · ( V ) β 5 · ( D ) β 6
L C = i n i N f i
where N f is the number of cycles to failure under the stress condition of the mean junction temperature T j m , the cycle amplitude Δ T j and the cycle period t o n . L C represents lifetime consumption (LC) which starts from the beginning-of-life. When the LC accumulates to unity, IGBT power device is considered to reach its end-of-life.

4.2. Unreliablity Function

From lifetime evaluation, a B15 lifetime is obtained based on the statistic from the lifetime model. It represents the amount of time during which 15% of the population (of the same IGBT type) will fail. In general, lifetime data of the wear out failure is following Weibull distribution [19], which probability density function is expressed as:
f ( x ) = β η β x β 1 exp x η β
where x represents the operation time, and η and β are the scale and the shape parameter respectively. η parameter represents time instance at which 63.2% of the population will fail. β parameter represents the failure mode, where the same failure mode will have similar β values. From the probability density function, it is, furthermore, possible to obtain cumulative density function by integration over operation time:
F ( x ) = 0 x f ( x ) d x = 1 exp x η β
This cumulative density function is often referred as an unreliability function and it is representing the proportion of the accumulated failure population over time. In order to obtain the Weibull cumulative density function, it is necessary to determine η and β parameter values. For this analysis, the value of β parameter is taken from [21] and accounts for the failure mode related to the IGBT devices. η parameter can be calculated by using Equation (10) and previously obtained B15 lifetime information. Once η and β parameters are determined, it is possible to obtain the unreliability curve of power device under study.
The unreliability curve of each device gives information about the component-level reliability. To investigate system-level reliability, it is necessary to construct the Reliability Block Diagram (RBD) of the overall system. In general, the RBD is a representation of the reliability interaction between the components in the system. Parallel paths in the diagram are redundant i.e., the system fails once when all the parallel paths in the RBD fail. Contrary, if series paths are considered, the system fails when one of the components in a series path fails. With respect to that, in order to move from the component-level reliability (i.e., reliability of a single IGBT) to converter-level reliability (i.e., reliability of a single converter unit consisting of IGBTs), the RBD for each of the components in the system is created. For both configuration types, the series connection of all studied components is considered. The system unreliability is then calculated as:
F system ( x ) = 1 i = 1 n ( 1 F i ( x ) )
where F i is the unreliability function of the i-th component of the system and n is the number of components. The flow chart of the aforementioned process is shown in Figure 10.

5. Case Study

A case study for the PV-battery system with the installation site in Germany is carried out in order to compare the reliability of the DC- and AC-coupled configurations. Firstly, a system description is provided, then a mission profile including real, on-site measurement data is presented. For the given one-year mission profile, reliability evaluation is performed by following the procedure presented in Section 4.

5.1. System Description

The system under study consist of a 6 kW PV system with a 3 kW/7.5 kWh battery system. The system sizes and relevant parameters are provided in Table 3 and correspond to the configurations outlined in Figure 3 and Figure 4. As indicated, all the converter units are rated at 3 kW. A higher power rating is achieved with a modular structure, where e.g., 6 kW can be achieved by a parallel connection of two 3 kW units. The power devices in each of the converters are chosen to be the same, in order to ensure a fair comparison.

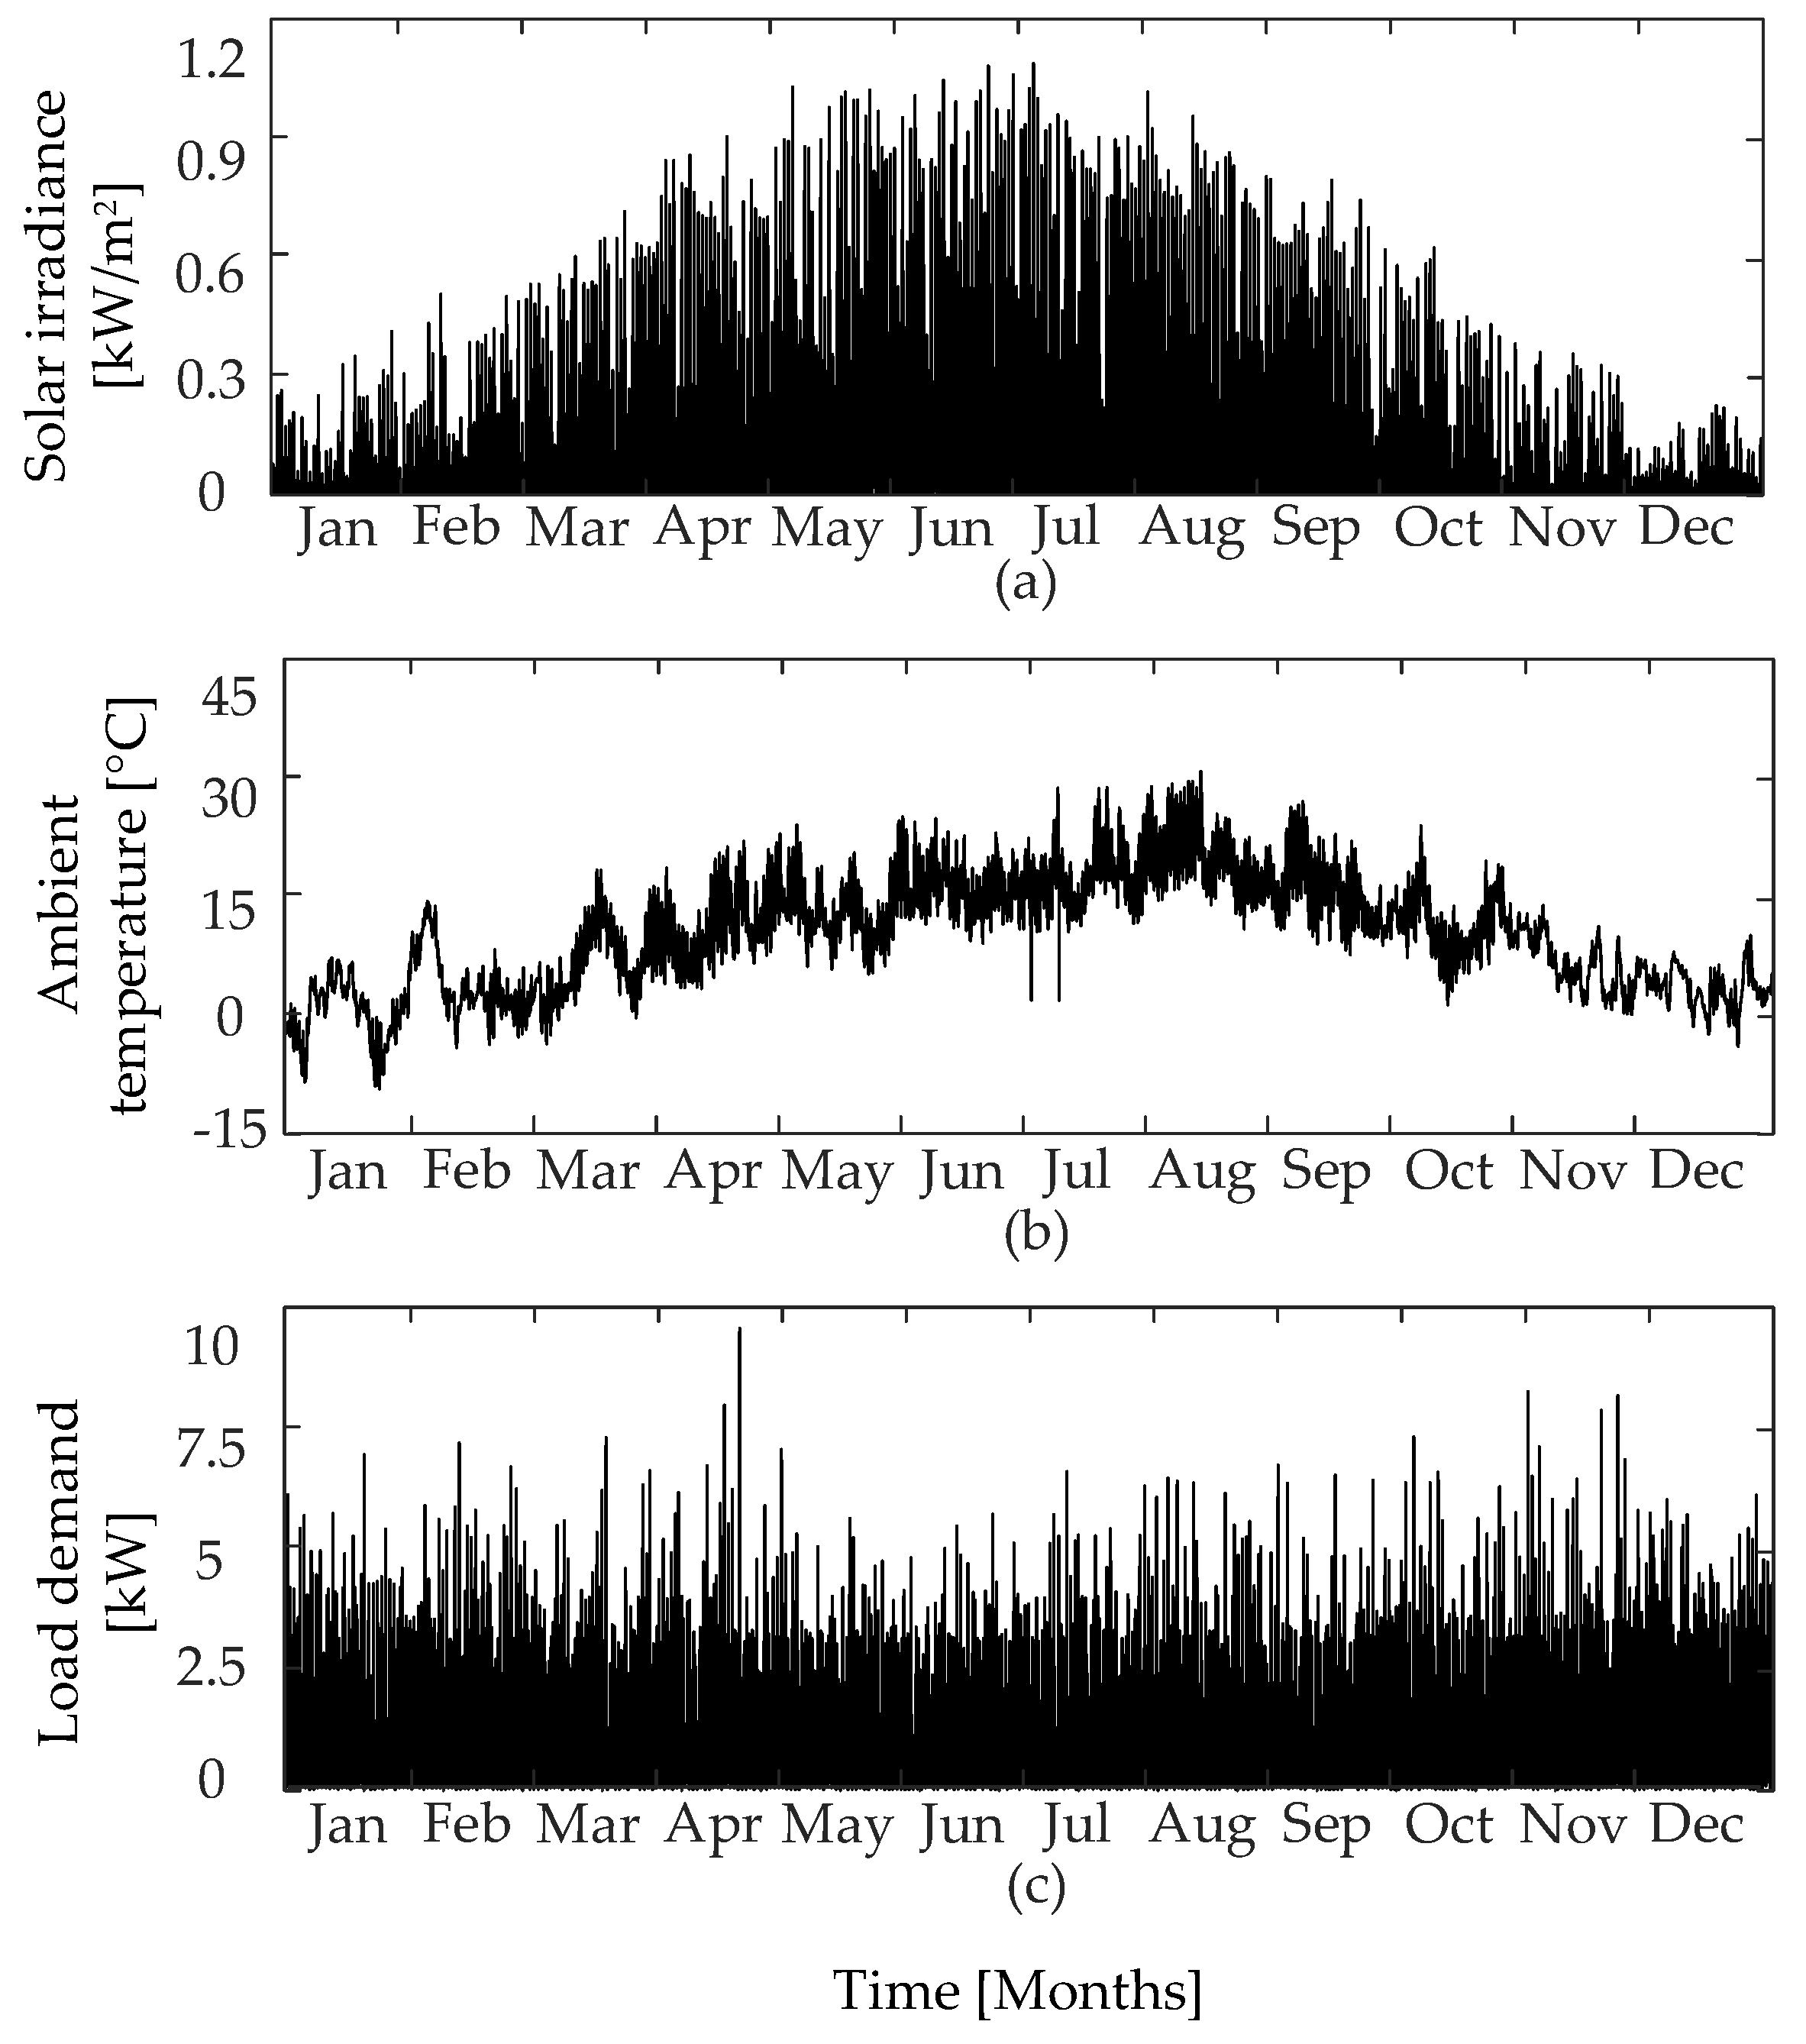
5.2. Mission Profile

A one-year mission profile from the installation site in Germany is chosen for the case study, as it is shown in Figure 11. It consists of a solar irradiance and ambient temperature profiles with a sampling rate of 5 min per sample [12]. The mission profile consists of the strong seasonal variations, e.g., mean solar irradiance during winter months is 34.98 W/m 2 which is 72% lower than the average value during summer months.The load profile is presenting a typical household load with the average of 4.8 kWh/year and without strong variations throughout the year [22].

5.3. Results

Reliability assessment is carried out for the aforementioned mission profile and results are shown for both configurations. Firstly, the one-year stress profiles of the power devices are shown. Then, the unreliability curves of the power devices are given and finally, the reliability of the system and its components is investigated.

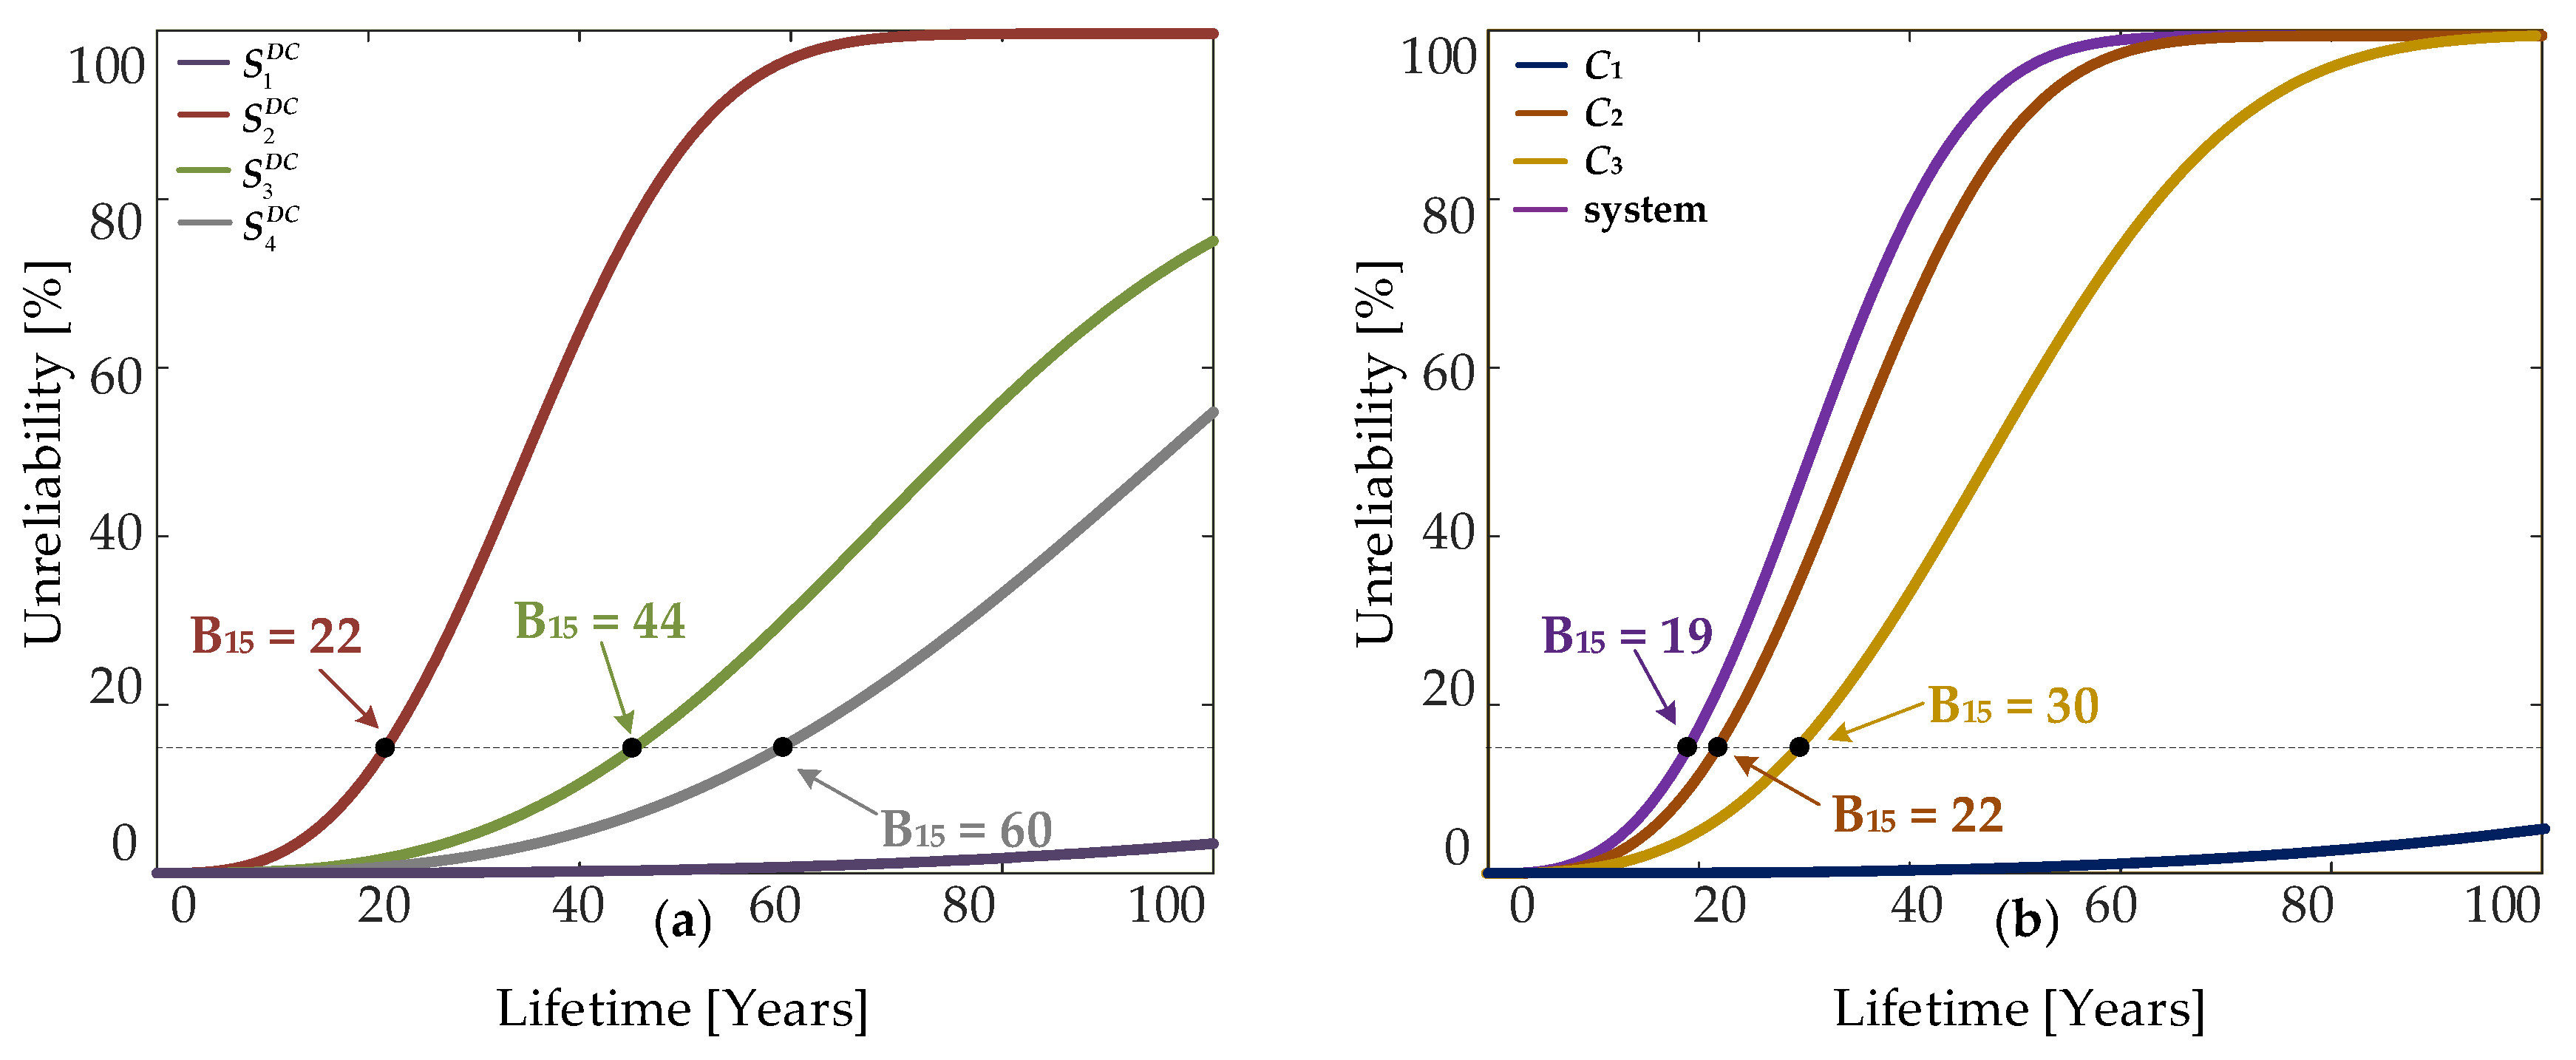
5.3.1. Reliability of the DC-Coupled Configuration

Stress profiles of the power devices are shown in Figure 12. By following the procedure presented in Figure 10, the stress profiles are decomposed to the cycles at different cycle depths and cycle averages, where it is possible to determine the range of T j m and Δ T j from the thermal stress profile.
The highest number of cycles for all IGBTs occurs for the mean junction temperature T j m of 20 °C. However, the exact number of cycles differs for each IGBT based on the stress they are exposed to during the operation. By examining the stress profiles, it can be observed that the smallest cycle amplitude has IGBT S 1 D C of the PV converter. Additionally, this IGBT experiences the smallest number of cycles through out the operation. Hence, IGBT S 1 D C is the least stressed power device of all during one-year operation. This indicates that it will experience the highest lifetime. Stress of the battery converter is examined by means of IGBTs S 2 D C and S 3 D C junction temperature. In general, battery operation is more dynamic than one of the PV panels, meaning that electrical loading of the battery converter changes more often with battery charging and discharging periods. Hence, it is expected that the power devices of the battery converter will be more stressed than the rest of the devices of the system. Considering that, it is shown that IGBT S 2 D C , which is stressed by battery discharging, has the highest number of cycles out of all power devices. IGBT S 3 D C experiences less number of cycles, which is aligned with the fact that battery spent more time discharging during a year. Electrical loading of the inverter is based on power generated by PV and battery operation, as defined in Equation (2). Hence, S 4 D C stress profile is similar to the one of the S 1 D C of PV converter. However, the additional power provided by the battery operation is causing higher stress for the S 4 D C .
In order to examine the reliability of the system and its components, the RBD for the DC-coupled configuration is defined and shown in Figure 13. Corresponding unreliability functions are presented in Table 4 and the results are shown in Figure 14.
On the component-level, the lowest B15 lifetime has IGBT S 2 D C . Contrary, the highest B15 lifetime has IGBT S 1 D C and it accounts for more than 100 years. The obtained reliability results on the component-level correspond to previously analyzed stress profiles of the IGBTs. On the converter-level, battery converter experiences lowest operational time with B15 lifetime of 21 years. Hence, it is the most reliability-critical component of the system. Overall system connected in DC-coupled configuration has B15 lifetime of 19 years.

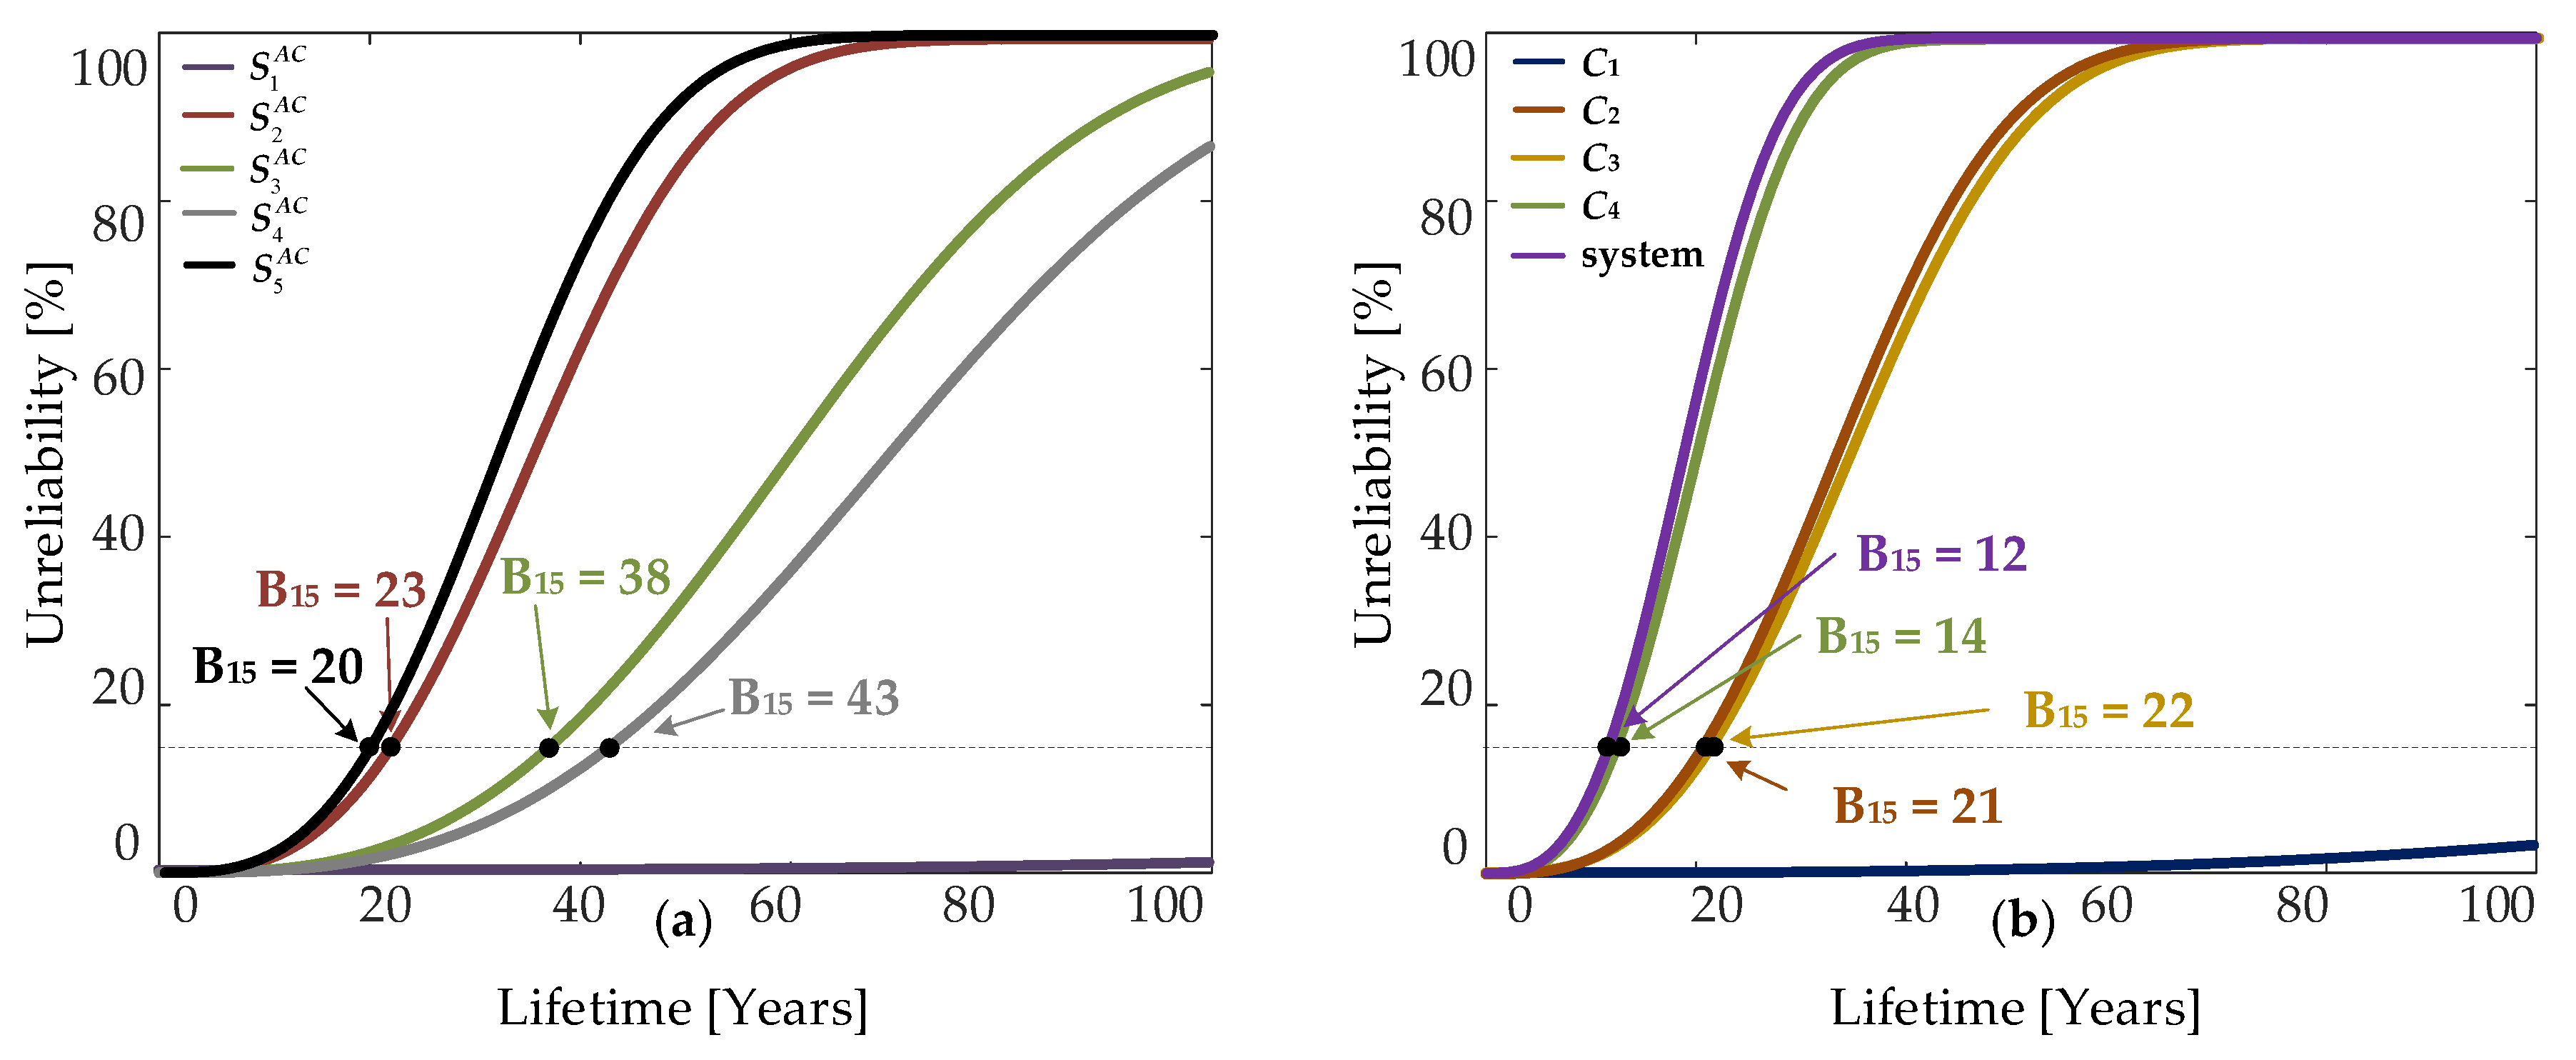
5.3.2. Reliability of the AC-Coupled Configuration

For AC-coupled configuration, the stress profiles of the power devices are shown in Figure 15, together with the associated cycle distribution.
Similarly as for the DC-coupled configuration, the highest number of cycles is present for mean junction temperature of 20 °C for all IGBTs. The lowest cycle amplitude has the IGBT S 1 A C which is experiencing the lowest stress during operation. The highest number of cycles have IGBTs S 4 A C and S 4 A C of battery converter and battery inverter respectively. This is mainly due to the battery dynamics. However, in the case of AC-coupled configuration and its point of connection for the battery unit, two power electronics units are affected (compared to a single unit in DC coupled configuration). This will, consequently, influence the reliability of the system which is assessed by the means of the RBDs shown in Figure 16 and associated unreliability functions given in Table 5.
The component-level unreliability curves are shown in Figure 17a. The highest unreliability has the IGBT S 5 A C of the battery inverter and its B15 lifetime accounts for 20 years. Similarly, B15 lifetime of the IGBT of the battery converter S 2 A C is 23 years. On the converter-level, the most reliability-critical unit is battery inverter. It means that this unit will develop highest rate of failure over time among all the units of the system. The overall B15 lifetime of the system connected in the AC-coupled configuration is 12 years.

5.3.3. Discussion

From the carried analysis, it is concluded that the PV-battery system connected in the DC-coupled configuration has a longer lifetime and a higher reliability. The summary of the B15 lifetime for the components of the both configurations is provided in Table 6. B15 lifetime of the DC-coupled configuration accounts for 19 years, which is 7 years longer than the one of the same system connected in the AC-coupled configuration.
The main reasoning can be found in the fact that AC-coupled configuration has an additional unit—battery inverter. The excess PV power in AC-coupled configuration is transferred at the AC side, imposing thermal stress to the two units in the system. The same amount of power in DC-coupled configuration is transferred to the battery unit on the DC side and it is imposing thermal stress to a single unit. Furthermore, the reliability of the PV inverter in the AC-coupled configuration is not improved, when compared to the one in the DC-coupled configuration.
The benefit of the battery integration to the PV system in each of the configurations can be assessed by means of the self-consumption ratio (SCR). In general, SCR represents the ratio of the self-consumed electricity as a percentage of the total electricity generated by the PV. For the PV-battery system connected in the DC- and AC-coupled configuration, SCR accounts for 68.38% and 70.15% respectively. The minor difference in SCR indicate that both configuration types have a similar rate of the self-consumed power. It can be concluded that the addition of battery unit had the same benefit. Hence, for the presented case study, DC-coupled configuration is a more favorable option.

6. Conclusions

In this paper, a procedure for the reliability assessment of the PV-battery system is presented. Two configuration types are evaluated - DC- and AC-coupled configurations. This is done in order to assess how different point of connection of the battery unit is affecting the electrical loading of the power electronic units and, consequently, their reliability. Hence, by means of the presented reliability evaluation, a comparison on the component-, converter- and system-level reliability of the two configurations is studied. By performing the reliability analysis information on the most reliability-critical components among power electronic units of the each configuration is obtained. A mission profile-based reliability evaluation for a case study with the real measurement data from the installation site in Germany is conducted. The results have shown that the AC-coupled configuration has lower reliability, where the reliability-critical component of the system is battery inverter.

Author Contributions

Conceptualization, M.S. and A.S.; Formal analysis, M.S.; Investigation, M.S.; Methodology, M.S. and A.S.; Software, M.S.; Supervision, A.S. and F.B.; Validation, A.S.; Visualization, M.S.; Writing—original draft, M.S.; Writing—review & editing, A.S. and F.B.

Funding

This research was funded by the APETT grant number from the Innovation Foundation.

Conflicts of Interest

The authors declare no conflict of interest.

References

  1. REN21. Renewables 2018: Global Status Report (GRS); REN21: Paris, France, 2019. [Google Scholar]
  2. Deloitte. Supercharged: Challenges and Opportunities in Global Battery Storage Markets; Deloitte: New York, NY, USA, 2018. [Google Scholar]
  3. GTM. DC-Coupled Solar-Plus-Storage Systems Are Gaining Ground; Greentech Media: Boston, MA, USA, 2018. [Google Scholar]
  4. Mashal, J.; Sloane, I. A Battery for Hire: AC vs. DC Coupling for Solar + Energy Storage Projects. 2018. Available online: https://blog.fluenceenergy.com/energy-storage-ac-dc-coupled-solar (accessed on 15 July 2019).
  5. National Renewable Energy Laboratory (NREL). U.S. Utility-Scale PhotovoltaicsPlus-Energy Storage System Costs Benchmark; Technical Report NREL/TP-6A20-71714; National Renewable Energy Laboratory: Golden, CO, USA, 2018.
  6. Faia, R.; Faria, P.; Vale, Z.; Spinola, J. Demand Response Optimization Using Particle Swarm Algorithm Considering Optimum Battery Energy Storage Schedule in a Residential House. Energies 2019, 12, 1645. [Google Scholar] [CrossRef]
  7. Kosmadakis, I.E.; Elmasides, C.; Eleftheriou, D.; Tsagarakis, K.P. A Techno-Economic Analysis of a PV-Battery System in Greece. Energies 2019, 12, 1357. [Google Scholar] [CrossRef]
  8. Meneghel, D.; da Costa Bortoni, E.; Karimi, A. Boosting DC/AC Ratio of PV Plant for BESS Integration on DC side. In Proceedings of the 2018 IEEE Conference on Technologies for Sustainability (SusTech), Long Beach, CA, USA, 11–13 November 2018; pp. 1–4. [Google Scholar]
  9. Barchi, G.; Pierro, M.; Moser, D. Predictive Energy Control Strategy for Peak Switch and Shifting Using BESS and PV Generation Applied to the Retail Sector. Electronics 2019, 8, 526. [Google Scholar] [CrossRef]
  10. Hofer, J.; Svetozarevic, B.; Schlueter, A. Hybrid AC/DC building microgrid for solar PV and battery storage integration. In Proceedings of the 2017 IEEE Second International Conference on DC Microgrids (ICDCM), Nuremburg, Germany, 27–29 June 2017; pp. 188–191. [Google Scholar]
  11. National Renewable Energy Laboratory (NREL). Installed Cost Benchmarks and Deployment Barriers for Residential Solar Photovoltaics with Energy Storage; Technical Report NREL/TP-7A40-67474; National Renewable Energy Laboratory: Golden, CO, USA, 2016.
  12. Sangwongwanich, A.; Angenendt, G.; Zurmuhlen, S.; Yang, Y.; Sera, D.; Sauer, D.U.; Blaabjerg, F. Enhancing PV inverter reliability with battery system control strategy. CPSS Trans. Power Electron. Appl. 2018, 3, 93–101. [Google Scholar] [CrossRef]
  13. US Energy Information Administration. European Residential Electricity Prices Increasing Faster than Prices in United States; US Energy Information Administration: Washington, DC, USA, 2018.
  14. National Renewable Energy Laboratory (NREL). U.S. Solar Photovoltaic System Cost Benchmark; Technical Report; National Renewable Energy Laboratory: Golden, CO, USA, 2016.
  15. SMA Solar Technology AG. Planning Guidelines—The System Solution for More Independence; SMA Solar Technology AG: Niestetal, Germany, 2013. [Google Scholar]
  16. Schneider-Electric. Rooftop for Self-Consumption with Storage. Available online: https://solar.schneider-electric.com/solution/residential-self-consumption/ (accessed on 15 July 2019).
  17. Yang, Y.; Sangwongwanich, A.; Blaabjerg, F. Design for reliability of power electronics for grid-connected photovoltaic systems. CPSS Trans. Power Electron. Appl. 2016, 1, 92–103. [Google Scholar] [CrossRef]
  18. Reigosa, P.D.; Wang, H.; Yang, Y.; Blaabjerg, F. Prediction of Bond Wire Fatigue of IGBTs in a PV Inverter Under a Long-Term Operation. IEEE Trans. Power Electron. 2016, 31, 7171–7182. [Google Scholar]
  19. Sangwongwanich, A.; Yang, Y.; Sera, D.; Blaabjerg, F.; Zhou, D. On the Impacts of PV Array Sizing on the Inverter Reliability and Lifetime. IEEE Trans. Ind. Appl. 2018, 54, 3656–3667. [Google Scholar] [CrossRef] [Green Version]
  20. Bayerer, R.; Herrmann, T.; Licht, T.; Lutz, J.; Feller, M. Model for Power Cycling lifetime of IGBT Modules—Various Factors Influencing Lifetime. In Proceedings of the 5th International Conference on Integrated Power Electronics Systems, Nuremberg, Germany, 11–13 March 2008; pp. 1–6. [Google Scholar]
  21. Sandia National Laboratories. PV System Component Fault and Failure Compilation and Analysis; Technical Report; Sandia National Laboratories: Albuquerque, NM, USA, 2018.
  22. Bost, M.; Hirschl, B.; Aretz, A. Effekte von Eigenverbrauch und Netzparität bei der Photovoltaik; IOW GmbH: Berlin, Germany, 2011. [Google Scholar]
Figure 1. System diagram of the photovoltaic (PV) system with integrated battery energy storage system. Point of connection (POC) for the battery can either be at the DC-link for DC-coupled configuration or point of common coupling (PCC) for AC-coupled configuration.
Electronics 08 01059 g001
Figure 2. A typical daily profile of the PV power generation and load demand and battery (dis)charge periods defined based on the self-consumption strategy.
Electronics 08 01059 g002
Figure 3. A system diagram of the PV-battery connected in the DC-coupled configuration with the detailed converter topology.
Electronics 08 01059 g003
Figure 4. A system diagram of the PV-battery system connected in the AC-coupled configuration with the detailed converter topology.
Electronics 08 01059 g004
Figure 5. Electrical loading of the power electronic converters for the DC-coupled configuration with the indicated power flow: (a) battery discharging; and (b) battery charging.
Electronics 08 01059 g005
Figure 6. Electrical loading of the power electronic converters for the AC-coupled configuration with the indicated power flow: (a) battery discharging; and (b) battery charging.
Electronics 08 01059 g006
Figure 7. One-day power profile: (a) PV power P P V and load demand P l o a d ; (b) battery power P b a t , where positive power is absorbed power (charging periods) and negative power is delivered power (discharging periods); (c) battery SOC; and (d) input power of inverter of the DC-coupled configuration P i n v and PV inverter of the AC-coupled configuration P i n v P V .
Electronics 08 01059 g007
Figure 8. Electrical and thermal loading of the power electronic components in the DC-coupled configuration: (a) PV converter P P V ; (b) battery converter P b a t ; (c) inverter P i n v ; (d) junction temperature of S 1 D C in PV converter; (e) junction temperature of S 2 D C and S 3 D C in battery converter; and (f) junction temperature of S 4 D C in inverter.
Electronics 08 01059 g008
Figure 9. Electrical and thermal loading of the power electronic components in the AC-coupled configuration: (a) PV converter P P V ; (b) battery converter P b a t ; (c) PV inverter P P V i n v ; (d) battery inverter P b a t i n v ; (e) junction temperature of S 1 A C in PV converter; (f) junction temperature of S 2 A C and S 3 A C in battery converter; (g) junction temperature of S 4 A C in PV inverter; and (h) junction temperature of S 5 A C in battery inverter.
Electronics 08 01059 g009
Figure 10. Flow diagram of the mission profile-based reliability evaluation of PV-battery system.
Electronics 08 01059 g010
Figure 11. A one-year mission profile of the installation site in Germany (sampling rate of 5 min per sample): (a) solar irradiance; (b) ambient temperature; and (c) household load.
Electronics 08 01059 g011
Figure 12. The resulting stress profiles and their cycling decomposition in the DC-coupled configuration for the input mission profile: (a) IGBT of PV converter S 1 D C ; (b) IGBTs of battery converter S 2 D C and S 3 D C (c) IGBT of inverter S 4 D C .
Electronics 08 01059 g012
Figure 13. DC-coupled configuration: Power electronic interface and its reliability block diagram.
Electronics 08 01059 g013
Figure 14. Unreliability curves of the DC-coupled configuration at the: (a) component-level; (b) converter-level.
Electronics 08 01059 g014
Figure 15. The resulting stress profiles and their cycling decomposition in the AC-coupled configuration for the input mission profile: (a) IGBT of PV converter S 1 A C ; (b) IGBTs of battery converter S 2 A C and S 3 A C ; (c) IGBT of pv inverter S 4 A C ; (d) IGBT of inverter S 5 A C .
Electronics 08 01059 g015
Figure 16. AC-coupled configuration: Power electronic interface and its reliability block diagram.
Electronics 08 01059 g016
Figure 17. Unreliability curves of the AC-coupled configuration at the: (a) component-level; (b) converter-level.
Electronics 08 01059 g017
Table 1. Summary of The Inverter Loading.
(PV) Inverter Loading
Battery ChargingBattery Discharging
DC coupled configuration P P V P P V + P b a t
AC coupled configuration P P V + P b a t P P V
Table 2. Parameters of Insulated Gate Bipolar Transistors (IGBT) Lifetime Model.
ParameterValueDescription
I10 ACurrent per wire bond
V6 V/100Blocking voltage
D300 μ mDiameter of bonding wire
K 2.03 × 10 14 Technology factor
β 1 4.416 Contribution of Coffin-Manson law
β 2 1285Contribution of Arrhenius law
β 3 0.463 Influence of transient thermal response on the chip
β 4 0.716 Contribution of accelerated wire bonds failure close to end of life
β 5 0.761 Accounted correlation between blocking voltage and chip thickness
β 6 0.5 Considered impact of wire diameter on bond interface and thermal expansion
Table 3. Parameters of the Single-Phase PV-Battery System.
ParameterValue
DC Coupled ConfigurationAC Coupled Configuration
PV array rated power (at STC)6 kW
Battery energy capacity7.5 kWh
PV converter rated power6 kW (3 kW × 2 units)
Battery converter rated power3 kW
Inverter rated power6 kW (3 kW × 2 units)-
PV inverter rated power-6 kW (3 kW × 2 units)
Battery inverter rated power-3 kW
DC-link capacitor C dc = 1100 μ F
L C -filter L inv = 4.8 mH, C f = 4.3 μ F
Switching frequencyDC/DC Converters: f sw = 20 kHz
Switching frequencyDC/AC Converters: f sw = 10 kHz
DC-link voltage V dc = 450 V
Grid nominal voltage (RMS) V g = 230 V
Grid nominal frequency ω 0 = 2 π × 50 rad/s
Table 4. DC-Coupled Configuration: Unreliability Functions of the System Components.
ComponentDevicesUnreliability Function
C 1 : PV converter2 × S 1 D C F C 1 D C = 1 ( 1 F S 1 D C ) 2
C 2 : Battery converter S 2 D C , S 3 D C F C 2 D C = 1 ( 1 F S 2 D C ) ( 1 F S 3 D C )
C 3 : Inverter2 × 4 × S 4 D C F C 3 D C = 1 ( 1 F S 4 D C ) 8
DC configuration C 1 , C 2 , C 3 F D C = 1 ( 1 F C 1 D C ) ( 1 F C 2 D C ) ( 1 F C 3 D C )
Table 5. AC-Coupled Configuration: Unreliability Functions of the System Components.
ComponentDevicesUnreliability Function
C 1 : PV converter2 × S 1 A C F C 1 A C = 1 ( 1 F S 1 A C ) 2
C 2 : Battery converter S 2 A C , S 3 A C F C 2 A C = 1 ( 1 F S 2 A C ) ( 1 F S 3 A C )
C 3 : PV Inverter2 × 4 × S 4 A C F C 3 A C = 1 ( 1 F S 4 A C ) 8
C 4 : Battery Inverter4 × S 5 A C F C 4 A C = 1 ( 1 F S 5 A C ) 4
AC configuration C 1 , C 2 , C 3 , C 4 F A C = 1 ( 1 F C 1 A C ) ( 1 F C 2 A C ) ( 1 F C 3 A C ) ( 1 F C 4 A C )
Table 6. Summary of the Reliability Study Results—B15 Lifetime for the Components of the DC- and AC-Coupled Configurations.
DC-Coupled ConfigurationAC-Coupled Configuration
PV converter>100>100
Battery converter2221
(PV) inverter3022
Battery inverter-14
System1912

