Article

Wideband Noise Interference Suppression for Sparsity-Based SAR Imaging Based on Dechirping and Double Subspace Extraction

1
Graduate School, Space Engineering University, Beijing 101416, China
2
The 96901 Unit of PLA, Beijing 100094, China
3
Space Engineering University, Beijing 101416, China
*
Author to whom correspondence should be addressed.
Electronics 2019, 8(9), 1019; https://doi.org/10.3390/electronics8091019
Submission received: 23 August 2019 / Revised: 8 September 2019 / Accepted: 9 September 2019 / Published: 11 September 2019

Abstract

:
Sparsity-based synthetic aperture radar (SAR) imaging has attracted much attention since it has potential advantages in improving the image quality and reducing the sampling rate. However, it is vulnerable to deliberate blanket disturbance, especially wideband noise interference (WBNI), which severely damages the imaging quality. This paper mainly focuses on WBNI suppression for SAR imaging from a new perspective—sparse recovery. We first analyze the impact of WBNI on signal reconstruction by deducing the interference energy projected on the real support set of the signal under different observation parameters. Based on the derived results, we propose a novel WBNI suppression algorithm based on dechirping and double subspace extraction (DDSE), where the signal of interest (SOI) is reconstructed by exploiting the known geometric prior and waveform prior, respectively. The experimental results illustrate that the DDSE-based WBNI suppression algorithm for sparsity-based SAR imaging is effective and outperforms the other algorithms.

1. Introduction

Synthetic aperture radar (SAR) is an active remote sensing modality for real-time information acquisition. It plays a significant role in the fields of civil exploration and military reconnaissance, owing to its capabilities of all-weather, all-time, and high-resolution imaging. Traditional SAR imaging technology is based on matched filtering in the Nyquist sampling framework, which is by far the most common but performs with some limitations. On the one hand, the increasing system bandwidth proportional to the radar resolution poses a great challenge in signal acquisition and data storage. On the other hand, the side lobe effect, which is caused by window functions in the process of pulse compression, affects the visual quality of SAR images. Sparsity-based SAR imaging [1,2], as a new radar imaging mechanism, has potential advantages in improving the image quality by introducing sparse signal processing into the SAR system. Since the concept of compressed sensing [3] has been proposed, radar imaging with incomplete data has become realizable by exploiting prior information. This kind of imaging method is also known as compressed sensing radar imaging [4,5].
Most SAR systems operate in the microwave band, and they are inevitably subject to various types of electromagnetic interference, including natural radiation and man-made interference, the latter of which is used for deliberately protecting important targets or scenes by damaging the image quality. Man-made SAR interference is divided into various categories based on different criteria. For example, the narrowband interference (NBI) and the wideband interference (WBI) are discriminated in terms of the range of frequency band occupied, while incoherent and coherent interference can be measured by structural similarity with the signal of interest (SOI). Generally speaking, coherent interference, usually generated by digital radio frequency memory (DRFM) [6], theoretically performs with higher efficiency, since the processing gain can be obtained after pulse compression. However, this coherence is difficult to guarantee strictly in practical applications due to the estimation error of motion and other signal parameters. Moreover, under the conditions of a large scene, echoes of scattering points within the observation area overlap in the time domain, increasing the coherent interference power required [7]. By contrast, incoherent interference is easier to implement by a universal jammer with a simple structure, which directly sends disturbance waveforms to the SAR system instead of intercepting, modulating, and repeating.
Wideband noise interference (WBNI) is one of the most typical incoherent interference types, which blankets a specific area in an SAR image by enhancing the background noise level [8]. Intuitively, this kind of interference is inefficient, since it has a wide spectrum characteristic compared to narrowband types, provided that the total power is constant. However, once the power is no longer limited, which is actually possible because of current high-power microwave technology, it becomes extremely difficult to deal with. For the sparsity-based SAR imaging system, this type of interference is particularly destructive to signal reconstruction. There are three main reasons for this statement. First, WBNI is characterized as the receiving noise [9] and is widely considered as the optimal choice used for raising the false-alarm threshold and disrupting the potential attributes of SOI, such as the sparsity, according to the information theory. Second, given that the scheme based on matched filtering and a high analog-to-digital converter (ADC) rate is replaced by that based on nonlinear optimization (and low ADC rate if compressed observation is considered [10]) in the sparsity-based system, the original coherent accumulation for improving the signal-to-noise ratio (SNR) in the process of pulse compression may no longer exist, or it may be transformed into other agnostic forms. Besides, when the observation dimension is less than the Nyquist requirement, the noise folding effect [11,12] occurs, making the signal recovery more sensitive to the change of SNR.
Compared to narrowband interference, there is less literature on wideband interference suppression for SAR, especially for sparsity-based imaging. Judging from the existing research results, they can be grouped into parametric, non-parametric, and semi-parametric methods. Parametric methods such as high-order ambiguity function (HAF) [13,14], fractional Fourier transform (FrFT) [15], empirical mode decomposition (EMD) [16], and time-frequency analysis (TFA) [17] are based on polynomial signal modeling, the performances of which are heavily dependent on the order of the model. Non-parametric methods such as the time–frequency filtering (TFF) [18,19] and the iteration-adaptive approach (IAA) [20] separate the signal and the interference by utilizing their respective concentrations in the time–frequency domain, where the TFF method simplifies the WBI to a series of instantaneous NBIs by short time Fourier transform (STFT). Sparse recovery, as a kind of semi-parametric method, is state-of-the-art, especially in terms of reducing signal distortion. It can be considered as an optimization problem of reconstructing a few coefficients with a given dictionary. This kind of method is mainly used for suppressing structured WBI that can be sparsely represented on a specified domain. For example, WBI based on sinusoidal-modulated or chirp-modulated models is sparse on an inverse STFT basis, and it can be separated from SOI by time-varying filtering [21] or alternative optimization algorithms [22,23].
Unfortunately, the methods mentioned above are not competent to suppress the blanket WBI modulated by noise, i.e., WBNI, since it is difficult to find a suitable domain to effectively separate the WBNI from the SOI. For the suppression of noise-like interference from the sparse perspective, there are two alternative approaches. From the aspect of sensing recovery, basis pursuit denoising (BPDN) [24] takes the disturbance component into account in the reconstruction model and weakens the noise by decomposing the observed data into signal and residual components. It is a common method, provided that the signal has been contaminated but the SNR is not quite low. The other way is to filter the interference directly in the process of compressed observation, in which a feedback loop composed of interference detection and adaptive selective sampling is introduced into the entire echo acquisition and processing procedures. The advantage of this adaptive compressed sampling (ACS) method [25] is that the interference entrance is cut off from the source. Nevertheless, the signal distortion and the high system complexity are the main limitations, since the prior is not fully utilized.
In this paper, we focus on the suppression of incoherent wideband noise interference for SAR imaging from the perspective of sparse signal processing. Given that WBNI is hardly sparse on any known domain, existing methods based on interference reconstruction and elimination are no longer applicable. Fortunately, there is an incoherent relation between the WBNI and the SOI, making it possible to extract useful components by exploiting the prior information of observation geometry and transmitted signal, respectively. The geometric prior can be used to obtain a more compact subspace from the Fourier basis that minimizes the projected energy of interference. The waveform prior can be used to perform denoising detection and then extract possible atoms corresponding to SOI, making the reconstruction more accurate and efficient. Based on the above considerations, we propose a novel WBNI suppression approach based on dechirping and double subspace extraction (DDSE) algorithms that can be applied to sparsity-based SAR imaging.
The main contents of this paper are divided into four parts. In Section 2, we provide a brief review of sparsity-based SAR imaging. In Section 3, we analyze the impact of WBNI on sparse recovery by theoretical derivation. In Section 4, we propose the DDSE algorithm for WBNI suppression and present the detailed procedure. In Section 5, we carry out numerical experiments to investigate the performance of the proposed algorithm.

2. A Brief Review of Sparsity-Based SAR Imaging

The raw echo of SAR is usually considered as the convolution of the scattering points and the transmitted signal. The linear frequency-modulated (LFM) pulse is the most commonly used signal type, since it has a larger time-bandwidth product to ensure resolution. The ideal receiving signal in the analogy domain can be expressed as [26]:
s r ( t , τ ) = l = 1 L σ l w r ( t 2 R l ( τ ) c ) w a ( τ τ c ) exp [ j 2 π f c ( t 2 R l ( τ ) c ) + j π K r ( t 2 R l ( τ ) c ) 2 ]
where t is the fast time in the range direction; τ is the slow time in the azimuth direction; τ c is the zero-Doppler time; L is the number of scattering points in observed scene; σ l is the backscatter coefficient of the l-th point; f c is the carrier frequency; c is the speed of light; R l is the oblique distance between scattering point and SAR platform; K r is the frequency modulation slope; and w r ( ) and w a ( ) denote the rectangular window function in range and azimuth, respectively.
In sparsity-based SAR imaging models, the observed scene is assumed to be uniformly divided into grids and composed of discrete scattering points, as shown in Figure 1. If the number of points with large scattering coefficients is much smaller than that of grids, the scene can be considered sparse in the space domain. Thus, the ergodic scattering matrix can be expressed as:
A = [ σ ( 1 , 1 ) σ ( X , 1 ) σ ( 1 , Y ) σ ( X , Y ) ]
In order to intuitively analyze the mechanism of sparse imaging, the observed data matrix is usually vectorized into a one-dimensional vector with a length of XY in the following model:
s = Ψ α + ε
where α = vec(AT) is the coefficient column vector obtained by cascading rows of A; ε is the additive noise; and Ψ is the PQ × XY mapping matrix expressed as:
Ψ = [ Ψ ( 1 , 1 , 1 ) Ψ ( 1 , 1 , X Y ) Ψ ( P , Q , 1 ) Ψ ( P , Q , X Y ) ]
where P and Q are the number of samples in range and azimuth, respectively, and each row of Ψ can be considered as the discrete form of Equation (1). To simplify the description, we now consider a simple but representative case where the azimuth dimension is assumed to be one, i.e., Q = 1. Then, the corresponding coefficient vector is reduced to α = [σ(1),…, σ(X)]T. Each column in Ψ is the transmitted signal with a specific delay determined by the oblique range of the scattering point from the SAR platform, reflecting the weight information of the backscattering coefficient of a specific target to each echo sample in the scene. Sometimes, we prefer to call the mapping matrix an echo dictionary or a basis, in which each column is called an atom.
The process of sparsity-based radar imaging is essentially a kind of parameter estimation, based on which regularization introduces prior information to improve the estimation performance. Therefore, imaging is realized by solving a constrained optimization problem, i.e.:
α ^ = min α s Ψ α 2 + λ α p
where λ is the regularization parameter; and ‖·‖p denotes the Euclid norm (0 ≤ p ≤ 1). When p = 0, Equation (5) is specialized to the compressed sensing radar imaging problem, i.e.:
α ^ = min α α 0 s . t . y Φ Ψ α 2 < δ
where δ > 0; Φ is an underdetermined observation matrix; and y is the compressed measurement vector. In compressed sensing, the problem of solving the ill-conditioned l0-norm is usually relaxed to convex optimization or greedy pursuit as long as the sensing matrix Θ = ΦΨ satisfies the restricted isometry property (RIP) [3,27].

3. Impact of WBNI on Sparse Recovery

3.1. Sparse Models for Interference

The bandwidth of WBNI is generally not less than that of SAR for the purpose of blanketing the entire spectrum of signal. The unified mathematical model in the analog time domain can be expressed as:
n ( t ) = [ U 0 + K A M U n ( t ) ] exp [ j 2 π f c t + j 2 π K F M 0 t U n ( η ) d η + φ ( t ) ]
where U0 is a constant; Un(t) is the time-varying and band-limited noise; KAM and KFM are the amplitude-modulated and the frequency-modulated coefficients, respectively; and φ(t) is the random phase uniformly distributed in [0, 2π]. Notably, when KFM = 0 and U0 = 0, n(t) represents the radio frequency interference; when KFM = 0, n(t) represents the amplitude-modulated noise interference; and when KAM = 0, n(t) represents the frequency-modulated noise interference.
From sparse point of view, WBNI cannot be sparsely represented in any known signal dictionary. We recall Equation (3) and express the echo signal x in the presence of interference as:
x = Ψ α + F ν + ε
where F and ν are the interference dictionary and the coefficient vector, respectively. The Fourier basis, as shown in Figure 2a, is commonly used for sparsely representing the narrowband interference. It can be expressed as the following N × N normalized orthogonal basis:
Ω = 1 N [ 1 1 1 1 W N 1 1 W N 1 ( N 1 ) 1 W N ( N 1 ) 1 W N ( N 1 ) ( N 1 ) ]
where WN = exp(-j2π/N). For radio frequency interference (RFI) or narrowband noise interference, their coefficients are sparsely or block-sparsely distributed in terms of both location and energy, as shown in Figure 2b,c. For WBNI, however, its coefficients present a compact distribution throughout the entire dictionary, as shown in Figure 2d.
We assume that the signal of interest (SOI) is on a K-dimensional subspace Ψ𝒜 composed of columns corresponding to nonzero coefficients in Ψ, and the WBNI is approximately modeled as a zero-mean Gaussian random vector, i.e., v ~ N ( 0 , σ v 2 I N ) . These nonzero coefficients containing location and value information are also called a support set, denoted by α𝒜 and indexed by 𝒜. Therefore, the process of SAR image reconstruction can be transformed into a support estimation problem. If Ψ satisfies the K-RIP property with a constant 0 < δK < 1 for any K-sparse vector α, i.e.:
( 1 δ K ) α 2 2 Ψ α 2 2 ( 1 + δ K ) α 2 2
and Ψ𝒜 is full-rank, then the support set can be estimated by:
α ^ A = α A + Ψ A Ω v
where (·) denotes the pseudo-inverse operation with the property of Ψ A Ψ A = I K ; and Ψ A Ω v is the interference component projected on the real support.

3.2. Impact of WBNI on Signal Recovery

From Equation (11), the estimated support vector contains a real component and the projected WBNI component, the latter of which depends on the structure of the observation matrix and the support index. We next discuss the following cases for the observation matrix by introducing the coherent measure, defined as [28]:
μ Ψ = max i , j i | ψ i H ψ j | ψ i 2 ψ j 2
where ψi is the i-th column of Ψ; and | | | | 2 denotes the l2-norm.

3.2.1. Case 1: μΨ = 0

When x is sparse on an orthogonal basis, such as the Fourier basis shown in Figure 2a, the estimated support set in Equation (11) can be rewritten as:
α ^ A = α A + v ^ A
where v ^ A = Ω A Ω v . Then, we have the following proposition.
Proposition 1.
If the observation matrixΨis an orthogonal Fourier basis Ω, i.e., μΨ = 0, the interference energy projected on the signal support holds after estimation.
Proof.
Based on the property of Gaussian distribution and Fourier basis, we have:
E ( Ω v ) = 0 , E [ ( Ω v ) ( Ω v ) H ] σ v 2 I N
and the interference energy on the support set of K-sparse signal ν𝒜 is:
E ( v A 2 2 ) = tr [ E ( v A v A H ) ] = K σ v 2
where tr(·) denotes the trace. Drawing support from the equivalent relation [29], we have:
tr ( C C H )   = C F 2
where ‖·‖F denotes the Frobenius norm. The projected energy of interference component in Equation (13) after estimation can be calculated by:
E ( v ^ A 2 2 ) = E ( Ω A Ω v 2 2 ) = tr { Ω A E [ Ω v ( Ω v ) H ] ( Ω A ) H } = σ v 2 tr { Ω A ( Ω A ) H } = σ v 2 Ω A F 2 = K σ v 2
Therefore, the projected energy of interference remains the same before and after estimation. On this basis, we can also obtain the following corollary.
Corollary 1.
When the observation matrixΨis orthogonal, i.e., the coherence measure is zero, the interference energy projected on the signal support will be minimum.
The proof of this corollary is given in the following Case 2.

3.2.2. Case 2: μΨ ≠ 0

Considering that the WBNI presents a Gaussian distribution on any basis, when Ψ is not an orthogonal basis, i.e., μΨ ≠ 0, Equation (11) can be rewritten as:
α ^ A = α A + Ψ A Ψ u
where u ~ N ( 0 , σ u 2 I N ) is a zero-mean Gaussian random vector. Then, the interference energy on the support set of K-sparse signal u𝒜 is:
E ( u A 2 2 ) = tr [ E ( u A u A H ) ] = K σ u 2
The projected energy of interference in Equation (18) after estimation can be calculated by:
E ( u ^ A 2 2 ) = E ( Ψ A Ψ u 2 2 ) = tr { Ψ A E [ Ψ u ( Ψ u ) H ] ( Ψ A ) H } = σ u 2 tr { Ψ A Ψ ( Ψ A Ψ ) H } = σ u 2 Ψ A Ψ F 2
We define Ψ A C as the complement to Ψ A . Equation (20) can be further calculated by dividing the observation matrix into two parts, i.e.:
E ( u ^ A 2 2 ) = σ u 2 Ψ A Ψ F 2 = σ u 2 Ψ A Ψ A | Ψ A C F 2 = σ u 2 ( K + Ψ A Ψ A C F 2 )
where | denotes the operation that divides a matrix into a submatrix and its complementary.
Since the coherence measure μΨ ≠ 0, the elements on non-diagonal lines of Ψ A Ψ A C are not all zero. Then, we have the following inequality:
E ( u ^ A 2 2 ) > σ u 2 I K F 2 = K σ u 2
Therefore, when Ψ is orthogonal, the interference energy projected on the signal support is minimal.
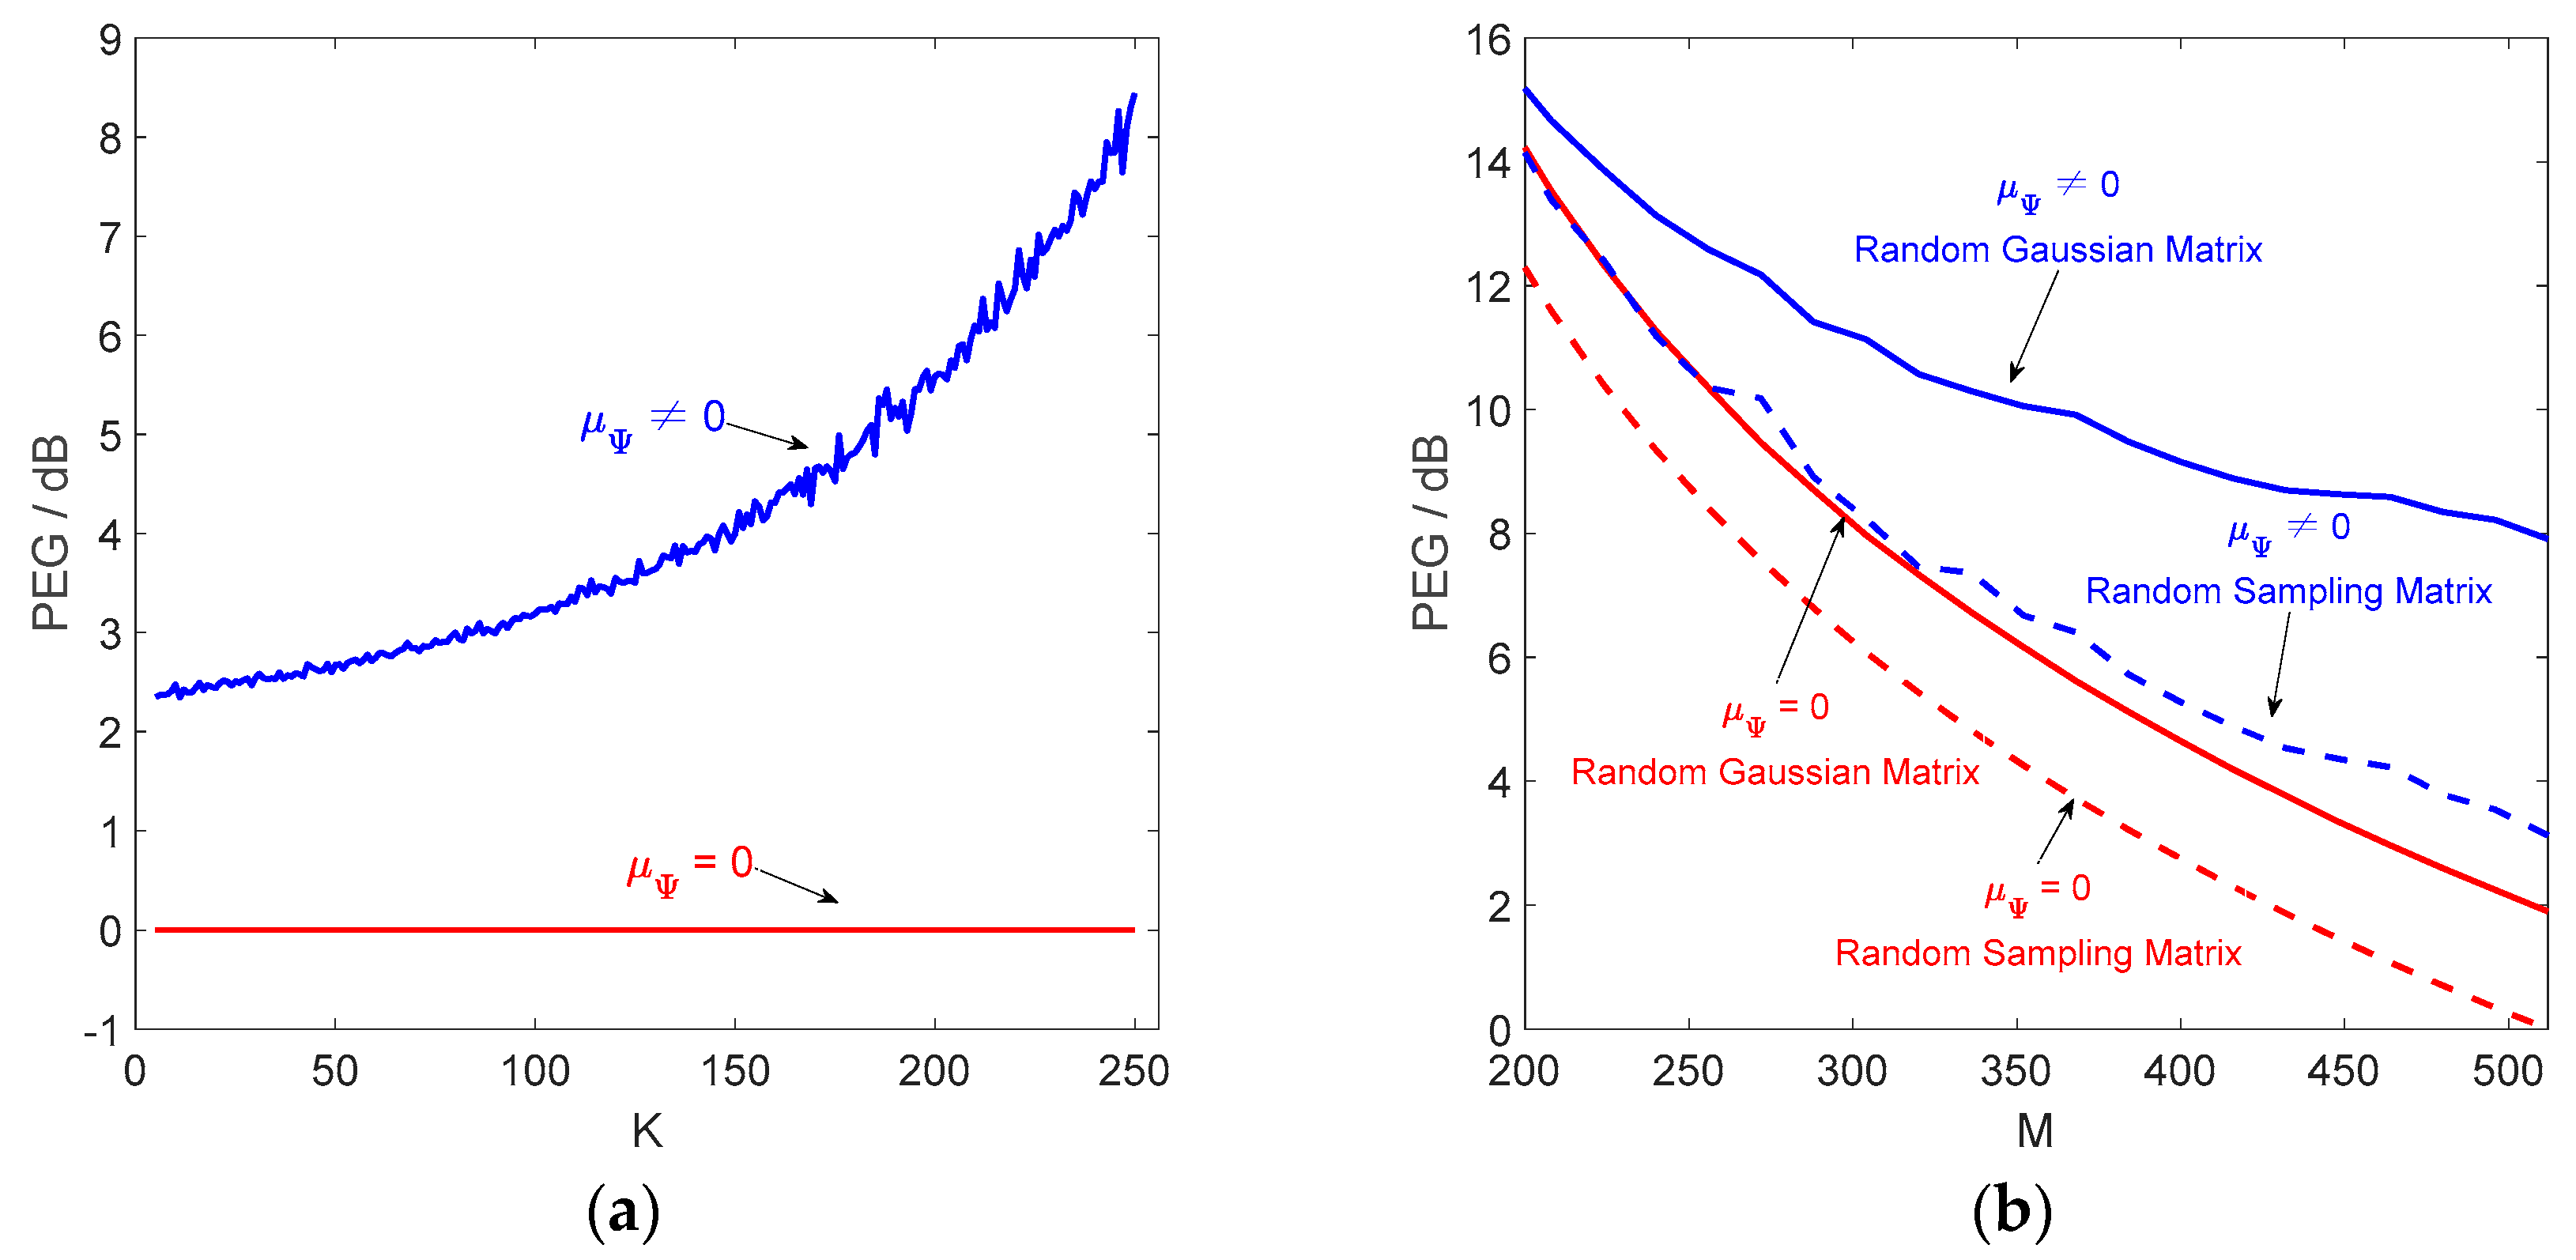
To further investigate the projected energy gain (PEG) of interference after signal recovery under different parameters, including the sparsity level, the measurement dimension, and the sampling mode, we performed numerical simulations using the LFM reference signal with delays and the Fourier matrix as their respective basis. The signal length N was set to 512, and the Monte-Carlo time was set to 1000.
Figure 3a shows the simulation results of PEG under different values of sparsity level K, where the measurement dimension M is equal to N. It can be seen that the PEG presented nonlinear growth when the coherence measure was nonzero, while it remained zero when an orthogonal basis was adopted. Figure 3b illustrates variations of PEG with the measurement dimension M and the sampling mode, where the sparsity level K was set to 100. In this simulation, we set up two sampling modes; one was to directly observe the echo data using a randomly generated Gaussian matrix, and the other was to extract the echo data with a random sampling matrix. The latter has the smallest PEG with the change of the measurement dimension when the coherence measure is zero.
According to the above analysis, we can infer that, when the SAR echo signal is contaminated with WBNI, the coherence measure of the basis matrix for sparse recovery should be minimized as much as possible, and the random sampling matrix is a better choice for the compressed observation (if reducing the data rate is necessary). In the next section, we develop an effective WBNI suppression algorithm based on these results.

4. WBNI Suppression Based on Dechirping and Double Subspace Extraction

4.1. Dechirping Observation

From the derived results in Section 3.2, the projected energy of WBNI on signal support depends on the sparsity level and the observation parameters. It reaches a minimum when the basis satisfies the orthogonality. As is known, however, most SAR systems usually observe targets by transmitting wideband linear frequency-modulated (LFM) waveforms that are non-sparse on an orthogonal basis. Therefore, we first need to find a linear transformation that meets both sparsity and orthogonality requirements.
Dechirping, also called stretch, is a specific approach for processing LFM signals [30]. It utilizes a time-fixed reference waveform with the same frequency-modulated slope as the transmitted signal and performs the mixing with the raw echo. For sparsity-based SAR, the basis is generally composed of reference sequences with specific delays determined by the distance from scattering points to the radar platform. Assuming that the range in an azimuth is divided into N grids, then the observation model in Equation (4) can be specified to the following expression after demodulation, i.e.:
Ψ = [ s r , 1 T ( n ) s r , 2 T ( n ) s r , N T ( n ) ] , n = 1 , , N
where s r , l ( n ) = w r ( n T s 2 R l c ) exp [ j 4 π R l λ + j π K r ( n T s 2 R l c ) 2 ] , l = 1 , , N is the echo atom of the l-th grid; λ is the radar wavelength; and Ts is the sampling interval.
The N × N dechirping observation matrix ΦD is composed of reference signals, each column of which can be expressed as:
s r e f ( n ) = w r e f ( n T s 2 R r e f c ) exp [ j 4 π R r e f λ + j π K r e f ( n T s 2 R r e f c ) 2 ] , n = 1 , , N
where Kref is the frequency modulation slope; Rref is the reference distance referring to the nearest oblique distance from the scene center to the SAR platform; and wref(·) denotes the reference rectangular window function, the length of which is not less than that of wr(·).
Then, the dechirped sensing matrix is:
Ψ D = Φ D Ψ = [ s d e , 1 T ( n ) s d e , 2 T ( n ) s d e , L T ( n ) ] , n = 1 , , N
where ◦ denotes the Hadamard product. The l-th dechirped atom is:
s d e , l ( n ) = w r ( n T s 2 R l c ) exp ( j 4 π K r Δ R l c n T s ) C ( l ) , l = 1 , , N
where C ( l ) = exp [ j 4 π ( Δ R l λ K r Δ R l 2 + 2 Δ R l R r e f c 2 ) ] is a constant term determined by Δ R l = R l R r e f .

4.2. Double Subspace Extraction

Given that the dechirped measurement can be considered as a series of single frequency signals, we employ the orthogonal Fourier basis as the initial dictionary for signal reconstruction. To further reduce the proportion of WBNI projection as much as possible, we propose the double subspace extraction algorithm, the diagram of which is shown in Figure 4.
For small observed scenes, the dechirped echo of SAR occupies a smaller part of the frequency spectrum than the raw. Meanwhile, WBNI is still distributed throughout the entire spectrum after dechirping because of its incoherence. Since most SAR systems are cooperative, the geometric prior known in advance can be exploited to eliminate redundant information. That is, the relationship between target position and frequency spectrum makes it possible to extract the subspace spanned by effective columns in the basis. The others that contribute little to signal reconstruction and aggravate the interference projection are pruned out.
According to the observation geometry, the spectrum of the dechirped signal is within the range of:
Δ B d e = 2 ( R max R min ) c T r B
where B is the signal bandwidth; Tr is the time width; and Rmax and Rmin are, respectively, the maximum and the minimum oblique distances depending on the range of the observed scene. Assuming that the geometric and the signal parameters satisfy the condition of ΔBde < 0.5B, we first extract the subspace matrix ΩI composed of columns indexed by the set I (blue dashed box in Figure 4) according to Equation (27).
Moreover, there still exist redundant atoms in the preliminarily extracted subspace, since the observed scene is sparse. We adopt constant false-alarm ratio (CFAR) detection [31] to extract the candidate index set composed of possible atoms (red solid box in Figure 4). This process can be considered as the subspace extraction by exploiting the waveform prior.
Assuming that the raw echo contains only the SOI and the WBNI, then the contaminated signal can be modeled as:
x = s + n = Ψ α + n
where α is a K-sparse vector; and n is a non-sparse vector, which increases the decision threshold and reduces the detection performance.
The waveform prior can be utilized to project the raw echo to K sparse coefficients. More advantageously, this projection has little effect on changing the distribution of WBNI, making it possible to further suppress most of the interference component by designing an observation matrix with a specific structure.
We model the following detection problem based on a binary hypothesis test:
0 : 1 : z = Γ n z = Γ ( s + n )
where Γ denotes the denoising detection operator expressed as:
Γ = Φ 0 Ψ proj
where Ψ proj = ( Ψ H Ψ ) 1 Ψ H is the projection matrix. To suppress the projection of the interference component as much as possible, the structural observation matrix Φ0 is designed in the following form:
Φ 0 = [ 1 1 1 1 1 1 ] M 0 × N
where η = N/M0 is an integer. A greater value of M0 is better for reducing the interference projection, since there are more zero-valued elements in each row of Φ0. Moreover, the cell-averaging constant false-alarm rate (CA-CFAR) structure [32] is utilized to determine the decision threshold, i.e.:
γ T = ( P f a 1 / N c 1 ) j = 1 N c | z j | 2
where Nc is the number of detection cells; and Pfa is the false-alarm rate.
There are some points that need to be specified in the above detection model. First, when the structural observation matrix is underdetermined, i.e., M0 < N, one detection result corresponds to η candidate atoms (purple dashes in Figure 4). Second, we also include a certain number of atoms adjacent to the precise candidate in the index set to reduce signal distortion as much as possible, since offset may exist or detection is missed under low signal-to-interference ratio conditions. We denote the extracted subspace indexed by candidate set 𝒥 as Ω𝒥. Therefore, the final subspace matrix can be expressed as the intersection of these two extraction results, i.e.:
Ω S = Ω I Ω J

4.3. Algorithm and Procedure Details

Based on the above derivation, we designed the following compressed dechirping matrix (CDM) to perform the echo observation:
Φ D c = Ξ Φ D
where Ξ is the random observation matrix; and (·)T denotes the transposition. Then, the measurement vector can be expressed as:
y = Φ D c x = s D c + n D c
where sDc is the dechirped SOI; and nDc denotes the WBNI. Hence, the target reconstruction has been transformed into a sparse recovery problem in Equation (6) that can be solved by the classical orthogonal matching pursuit (OMP) algorithm [27].
It is worth noting that three phase terms exist and cannot be ignored in the dechirped echo, since they introduce doppler and make the subsequent azimuth processing more complex. Hence, the reconstructed signal should be further compensated with the de-oblique factor C*(n), n = 1, …, N, i.e., the complex conjugate form of C(n) in Equation (26).
Based on the above analysis and derivation, we present the detailed steps of DDSE in Algorithm 1 and the flowchart of the WBNI suppression procedure in Figure 5.
Algorithm 1 Dechirping and double subspace extraction (DDSE)
Inputs: raw echo x with WBNI, random sampling matrix Ξ, Fourier basis Ω;
Outputs: WBNI-free signal x*;
  • Construct the compressed dechirping matrix ΦDc by Equations (25) and (34);
  • Construct the sensing matrix by Θ = ΦDcΩ;
  • Obtain the measurements y by Equation (35);
  • Extract the subspace Ω based on Equation (27);
  • Construct the denoising detection operator Γ by Equations (30)–(31);
  • Extract the subspace Ω𝒥 by denoising CFAR detection based on Equation (32);
  • Determine the final subspace matrix Ω𝒮 by Equation (33);
  • Repeat from t = 1 until Niter;
    (1)
    Initialize the residual r0 = y, index set Λ0 = ∅, and augment matrix A0 = ∅;
    (2)
    Find the index Λt that maximizes the inner product Λ*t = max〈rt−1,θn〉, n = 1,…,N, where is the n-th column of Θ, and rt is the current residual vector;
    (3)
    If Λ*t𝒮, continue; else, set θn = 0 and return to (2);
    (4)
    Update the augment matrix by At = At−1θn;
    (5)
    Estimate the least square solution by αt* = argmin ‖y-Atαt2;
    (6)
    Update the residual by rt = yAtαt*;
    (7)
    t = t + 1;
  • Obtain the compensation operator C with the de-oblique factor in Equation (26);
  • Reconstruct the WBNI-free signal by x* = CΩαt*.

5. Experiments

5.1. Experiment Specifications

To verify the performance of WBNI suppression for sparsity-based SAR imaging based on the proposed algorithm in this paper, we carried out multiple experiments with simulated data. First, we adopted the DDSE algorithm to range profile reconstruction of a multi-point target, where the interference suppression performance was mainly investigated from the perspective of signal reconstruction. Then, we extended the case to range-azimuth imaging of an aircraft target, where the interference suppression effect was mainly evaluated by visual quality and statistical characteristics of reconstructed SAR images. Moreover, we also compared the proposed algorithm to other advanced ones to analyze its superiority. Simulations were implemented with Matlab R2018b on a computer running Windows 7 with 3.4GHz Intel Core i7-4770 CPU and 16 GB RAM.

5.2. Simulation and Analysis

5.2.1. Range Profile Reconstruction

In this part, we first set up a simulation environment for range profile imaging of point targets, where geometric and waveform parameters for SAR observations are listed in Table 1 [33,34]. Given that the distribution of the dechirped signal in the frequency domain depends on time width and distance differences according to Equation (27), the theoretical bandwidth ratio after dechirping observations is about 0.3 of the original. This means that a large amount of redundant information can be reduced in the frequency domain after coherent processing with the signal prior.
For the simulation, a five-point target with normalized amplitudes and fixed locations within the scene range was modeled. The WBNI data were generated by modulating a band-limited noise to the carrier frequency and aligning them with the center of the signal spectrum, the bandwidth of which was set as equal to that of SAR. The interference-to-signal ratio (ISR) was set to 15 dB, and the additive signal-to-noise ratio (SNR) was set to 30 dB. We added the generated WBNI to the raw echo of SAR, and the signal characteristics in time, frequency, and range domain are respectively shown in Figure 6. It was apparent that the WBNI covered the entire pulse and spectrum of the SOI, making it impossible to obtain accurate range information by sparse reconstruction. Hence, it was necessary to introduce some suppression approaches into the process of signal acquisition and reconstruction to reduce the impact of interference as much as possible.
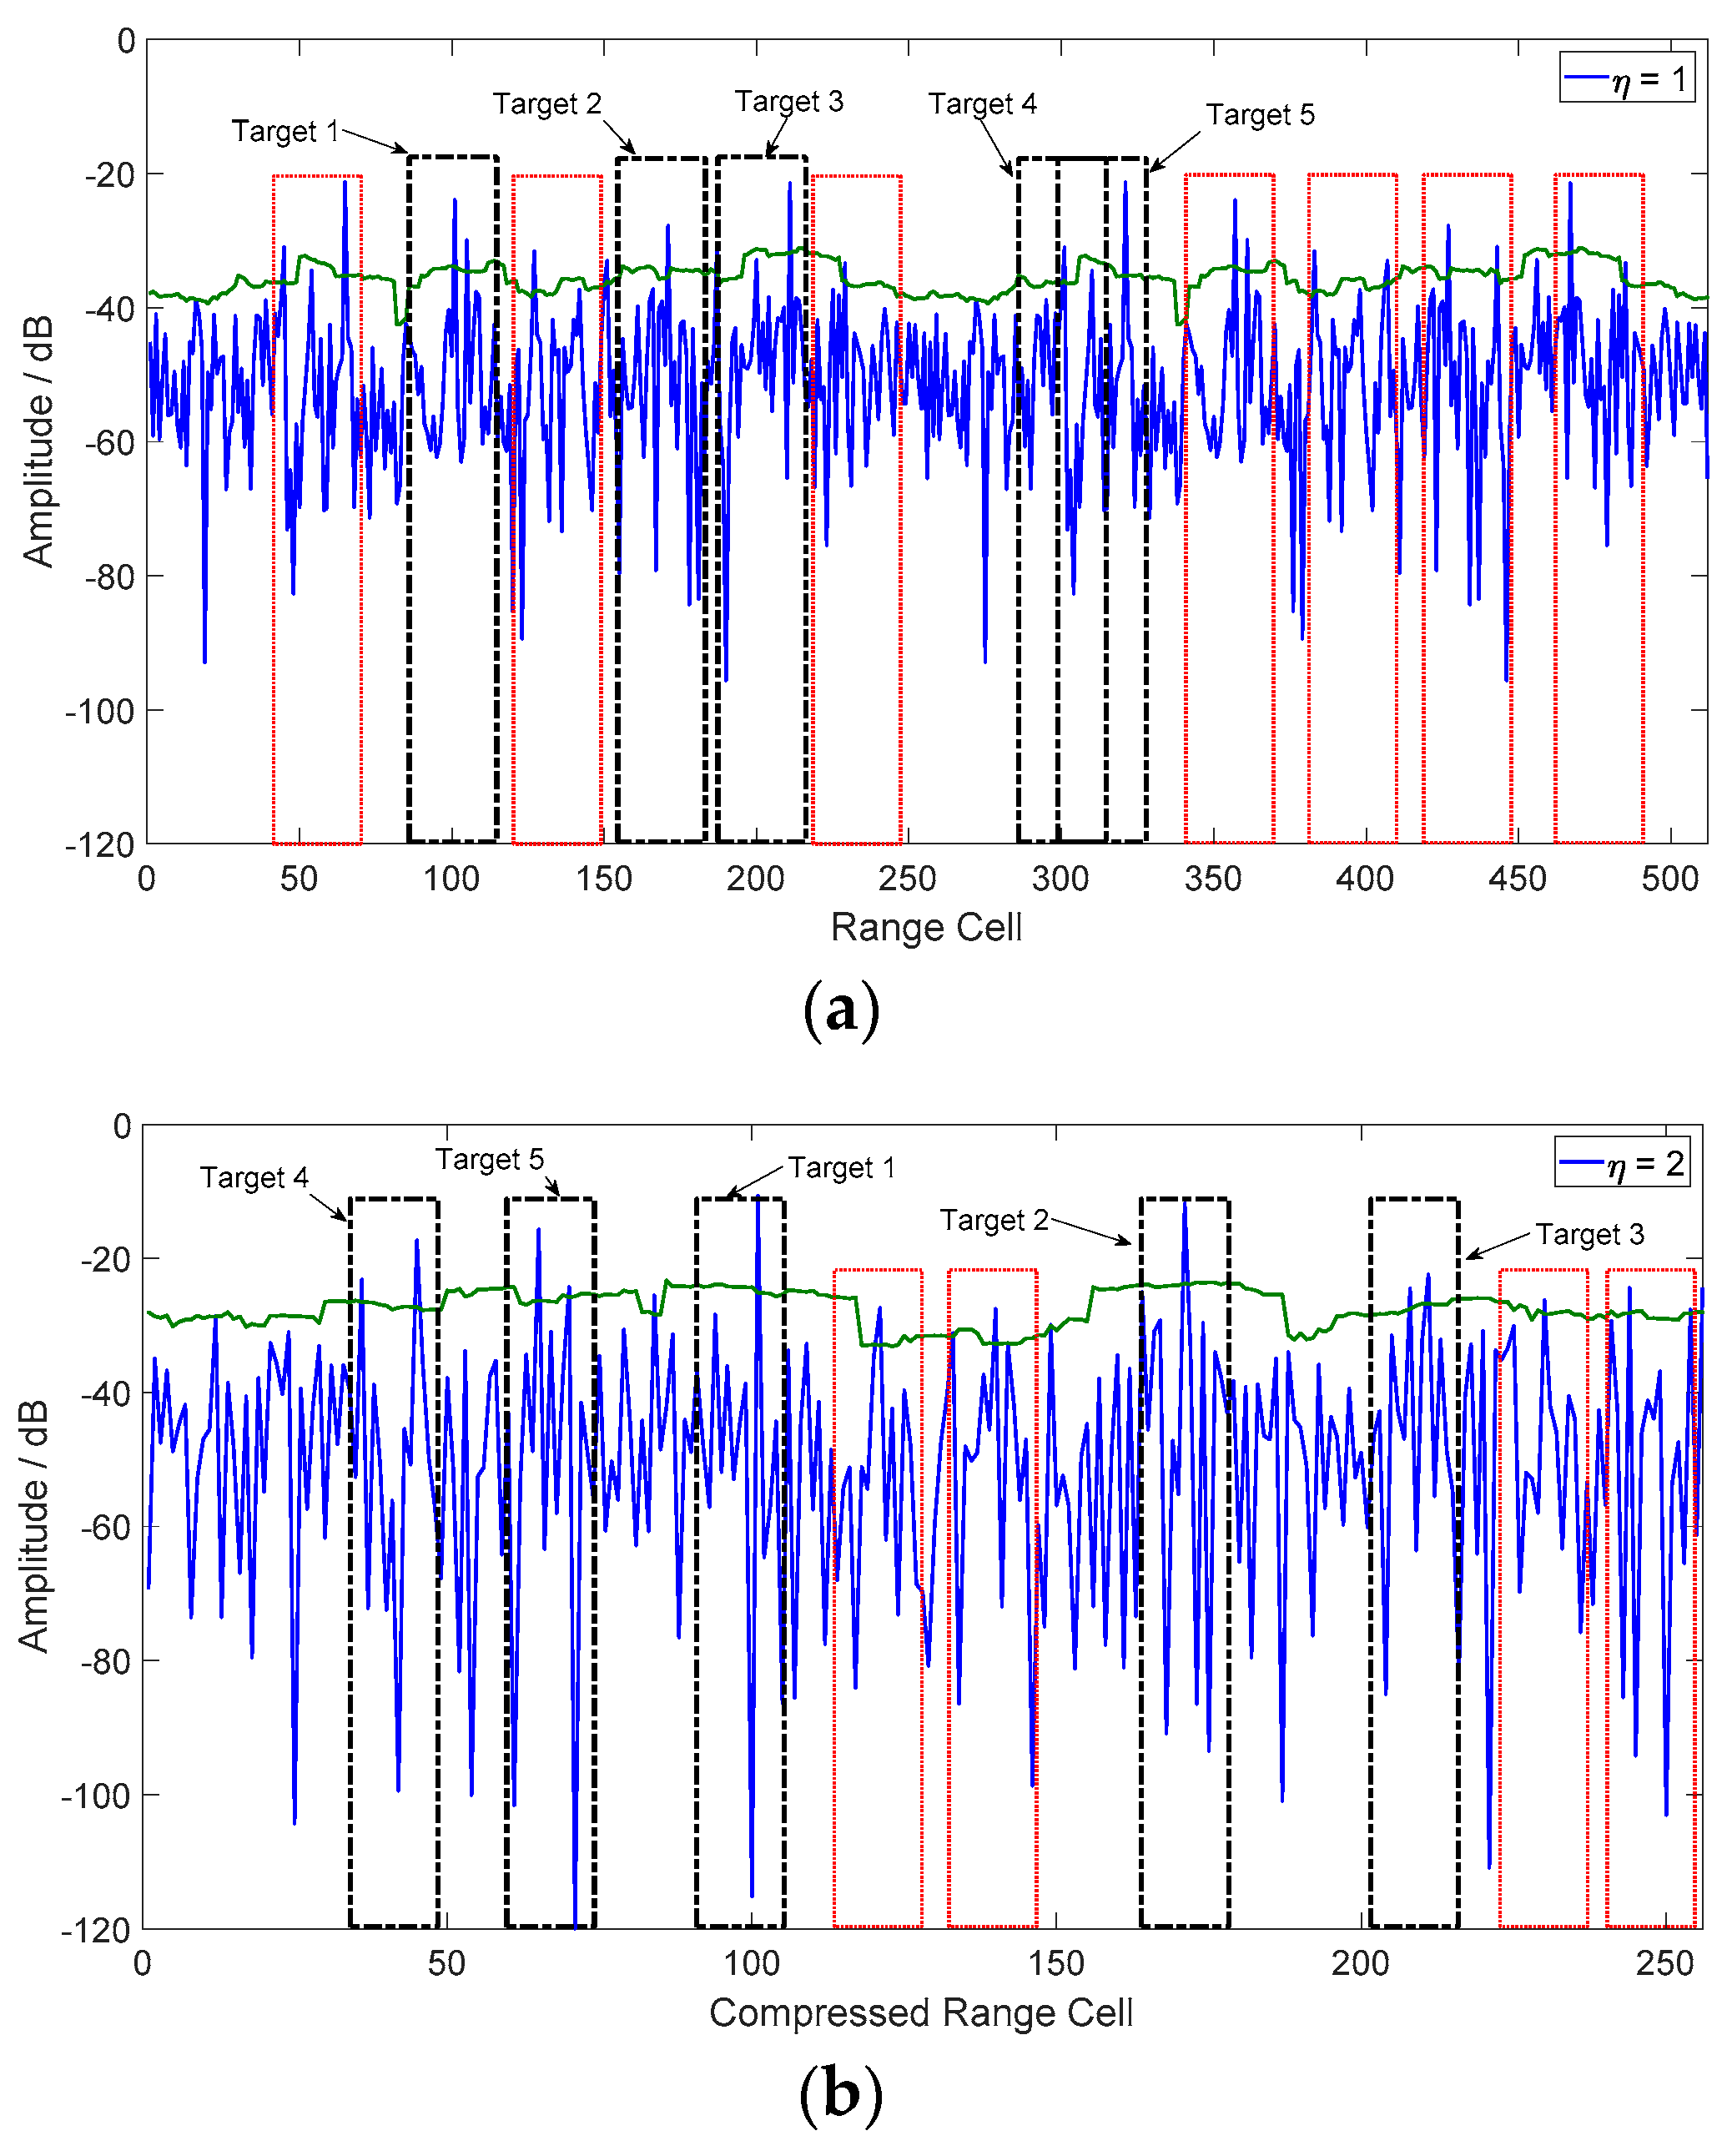
We adopted the proposed DDSE-based WBNI suppression algorithm to the process of range profile reconstruction. As mentioned above, to avoid signal distortion resulting from missing detections, we also added the atoms adjacent to the detected position to the subspace matrix. Figure 7 shows the detection results under different η, where the probability of false-alarm was set to 10−3. As can be seen, the WBNI introduced false alert into the process of detection and added more undesired atoms in the subspace matrix. When η > 1, the subspace dimension increases, since one compressed range cell corresponds to η atoms.
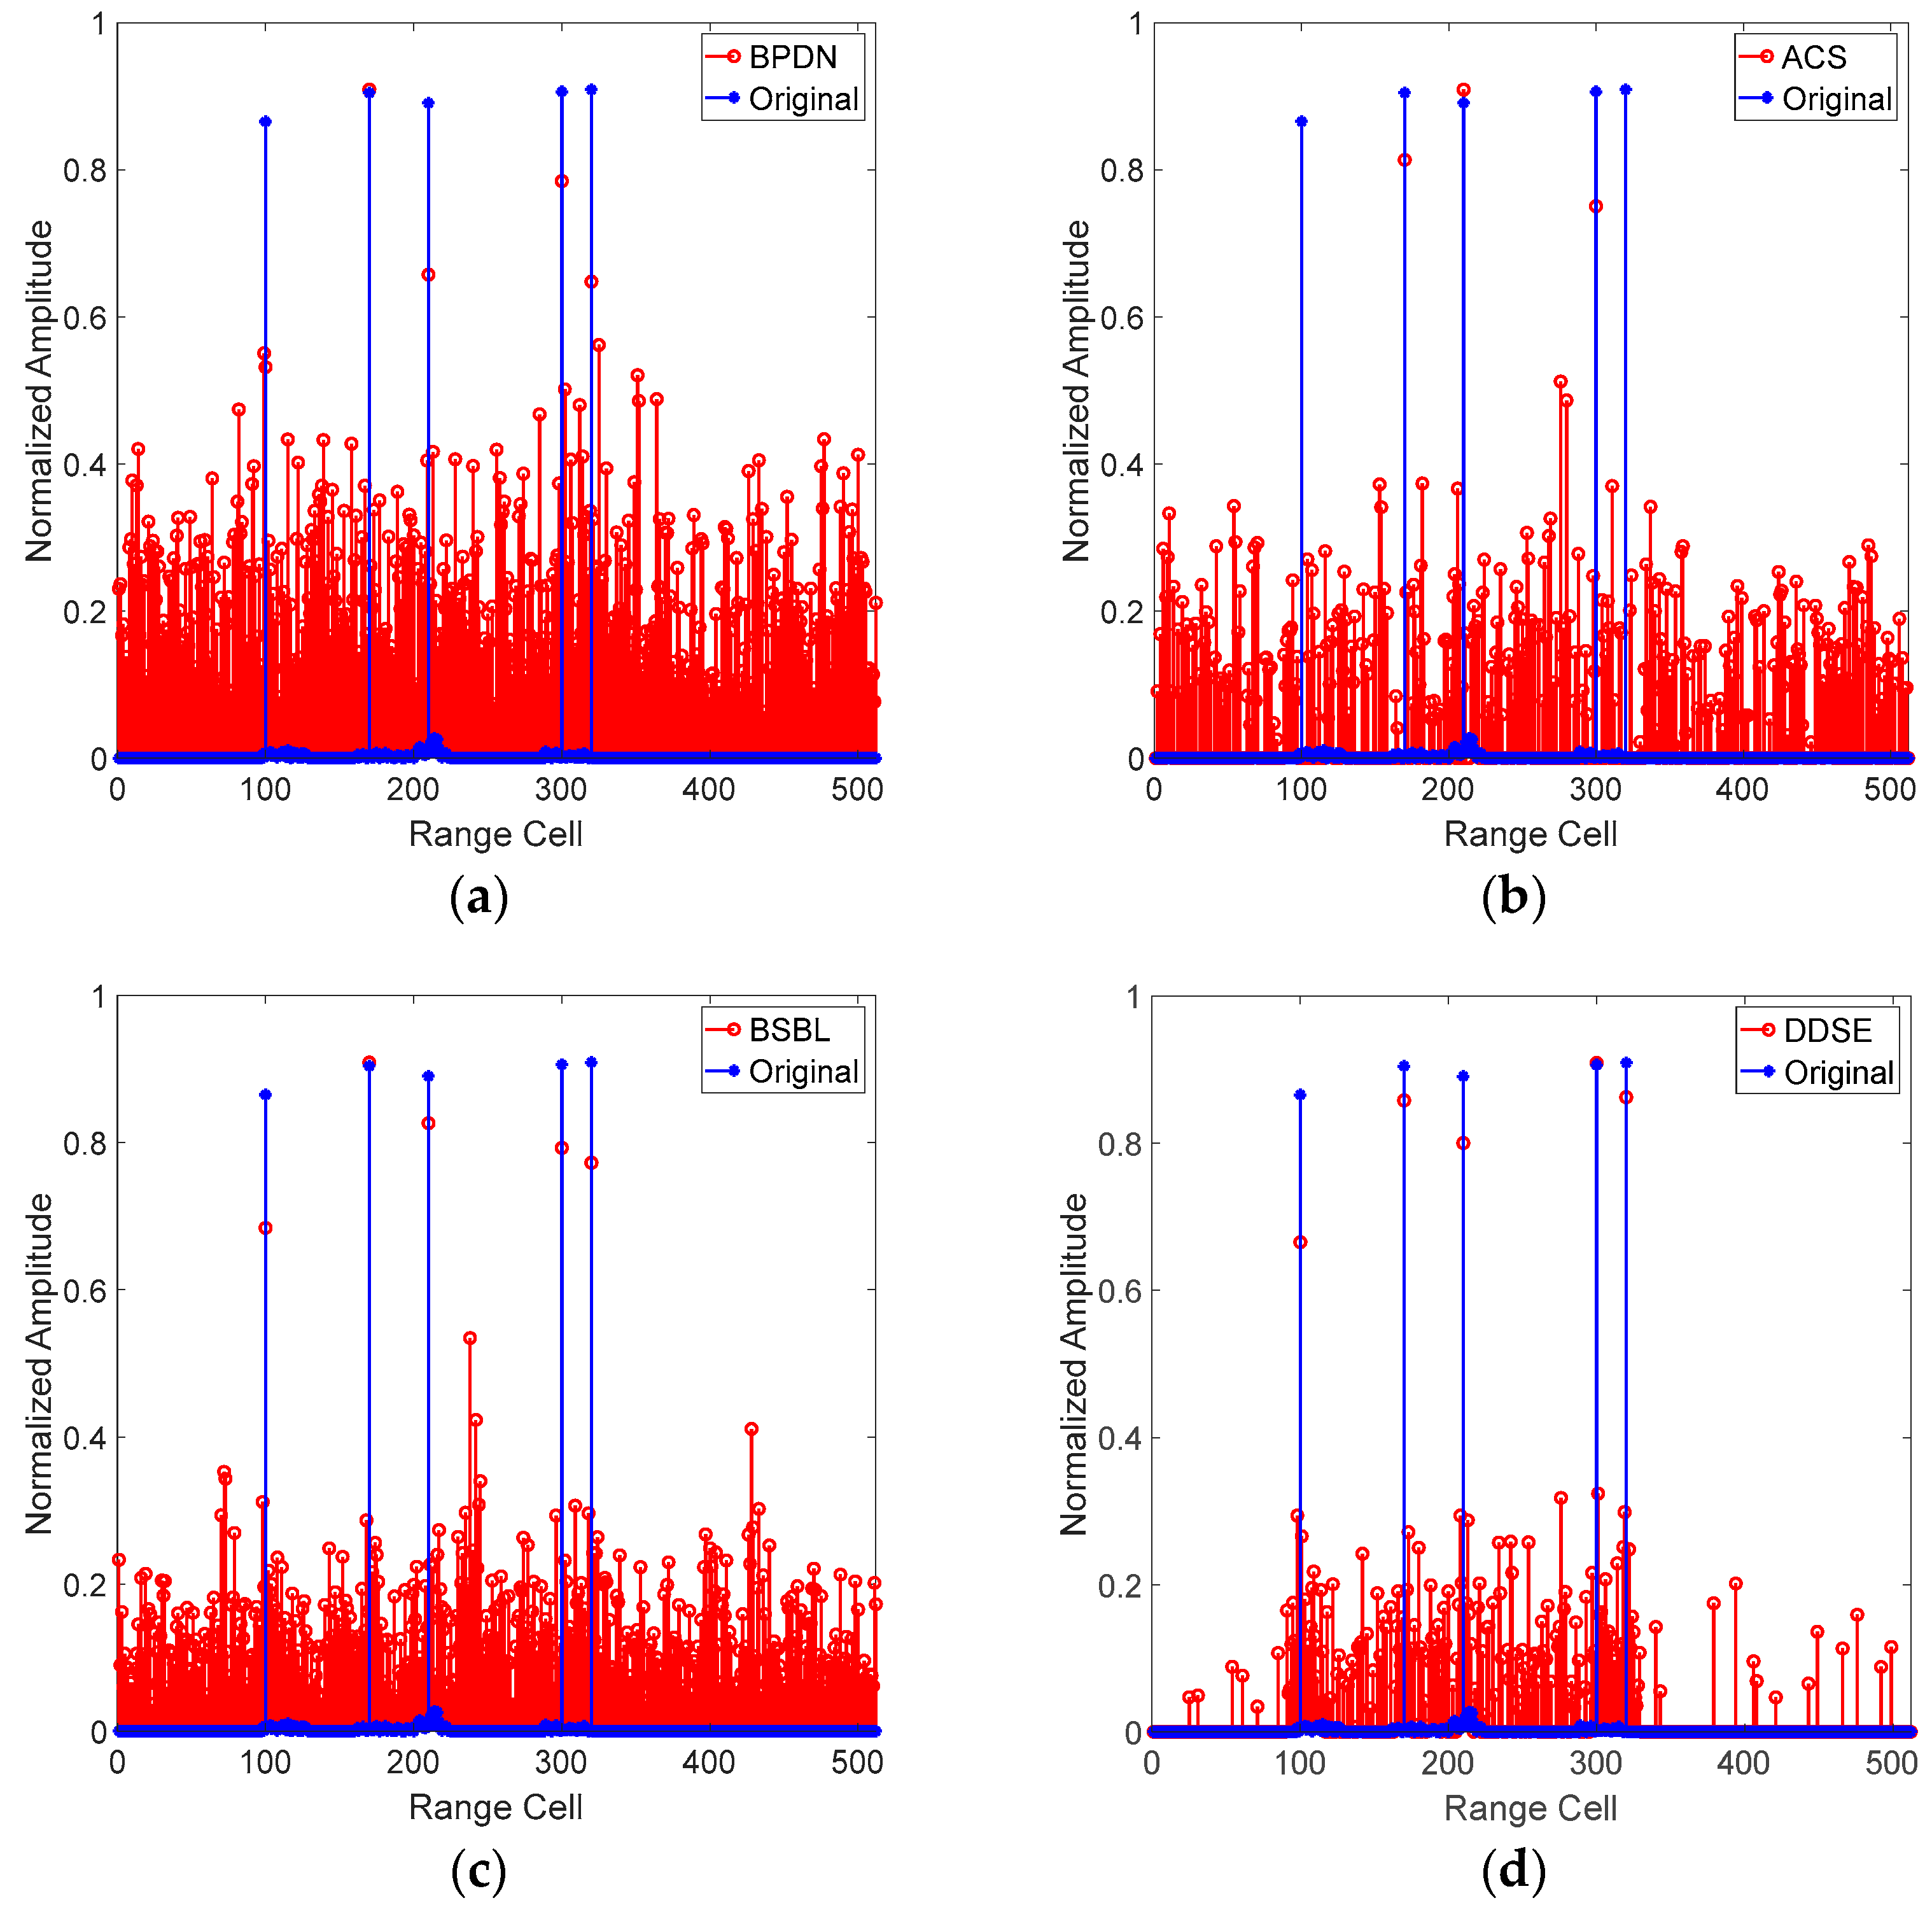
To verify the superiority of the DDSE, we compared it to other algorithms, including basic pursuit denoising (BPDN) [24], adaptive compressed sampling (ACS) [25], and block sparse Bayesian learning (BSBL) [33], the results of which are shown in Figure 8.
As shown in Figure 8, the proposed DDSE algorithm outperformed the others in terms of both signal distortion and WBNI suppression effects. The BPDN algorithm was hardly effective for WBNI suppression under low SNR conditions except for a little contribution to noise reduction. The ACS algorithm eliminated large amounts of interference but also useful information, leading to serious distortion since the signal prior was not fully exploited. The BSBL algorithm also generated undesired components in the process of WBNI suppression, though it was superior in narrowband interference (NBI) separation by utilizing structural information and time correlation [33,34].
To further benchmark the interference suppression performance of signal reconstruction, we employed the interference suppression degree (ISD) and the signal distortion degree (SDD) as main indicators [19]. ISD is usually employed to measure the ability to eliminate interference, which is defined as the energy ratio of the contaminated signal to the reconstructed one after interference suppression, i.e.:
I S D =   10 log 10 x c 2 2 x s 2 2
where xc is the contaminated signal; and xs is the reconstructed signal after interference suppression. Since interference suppression inevitably leads to signal distortion, SDD is also utilized as an assisted but significant indicator, which is defined as the degree of energy loss of the reconstructed signal to the undisturbed one, i.e.:
S D D =   10 log 10 x s x 0 2 2 x 0 2 2
where x0 is the original signal without interference.
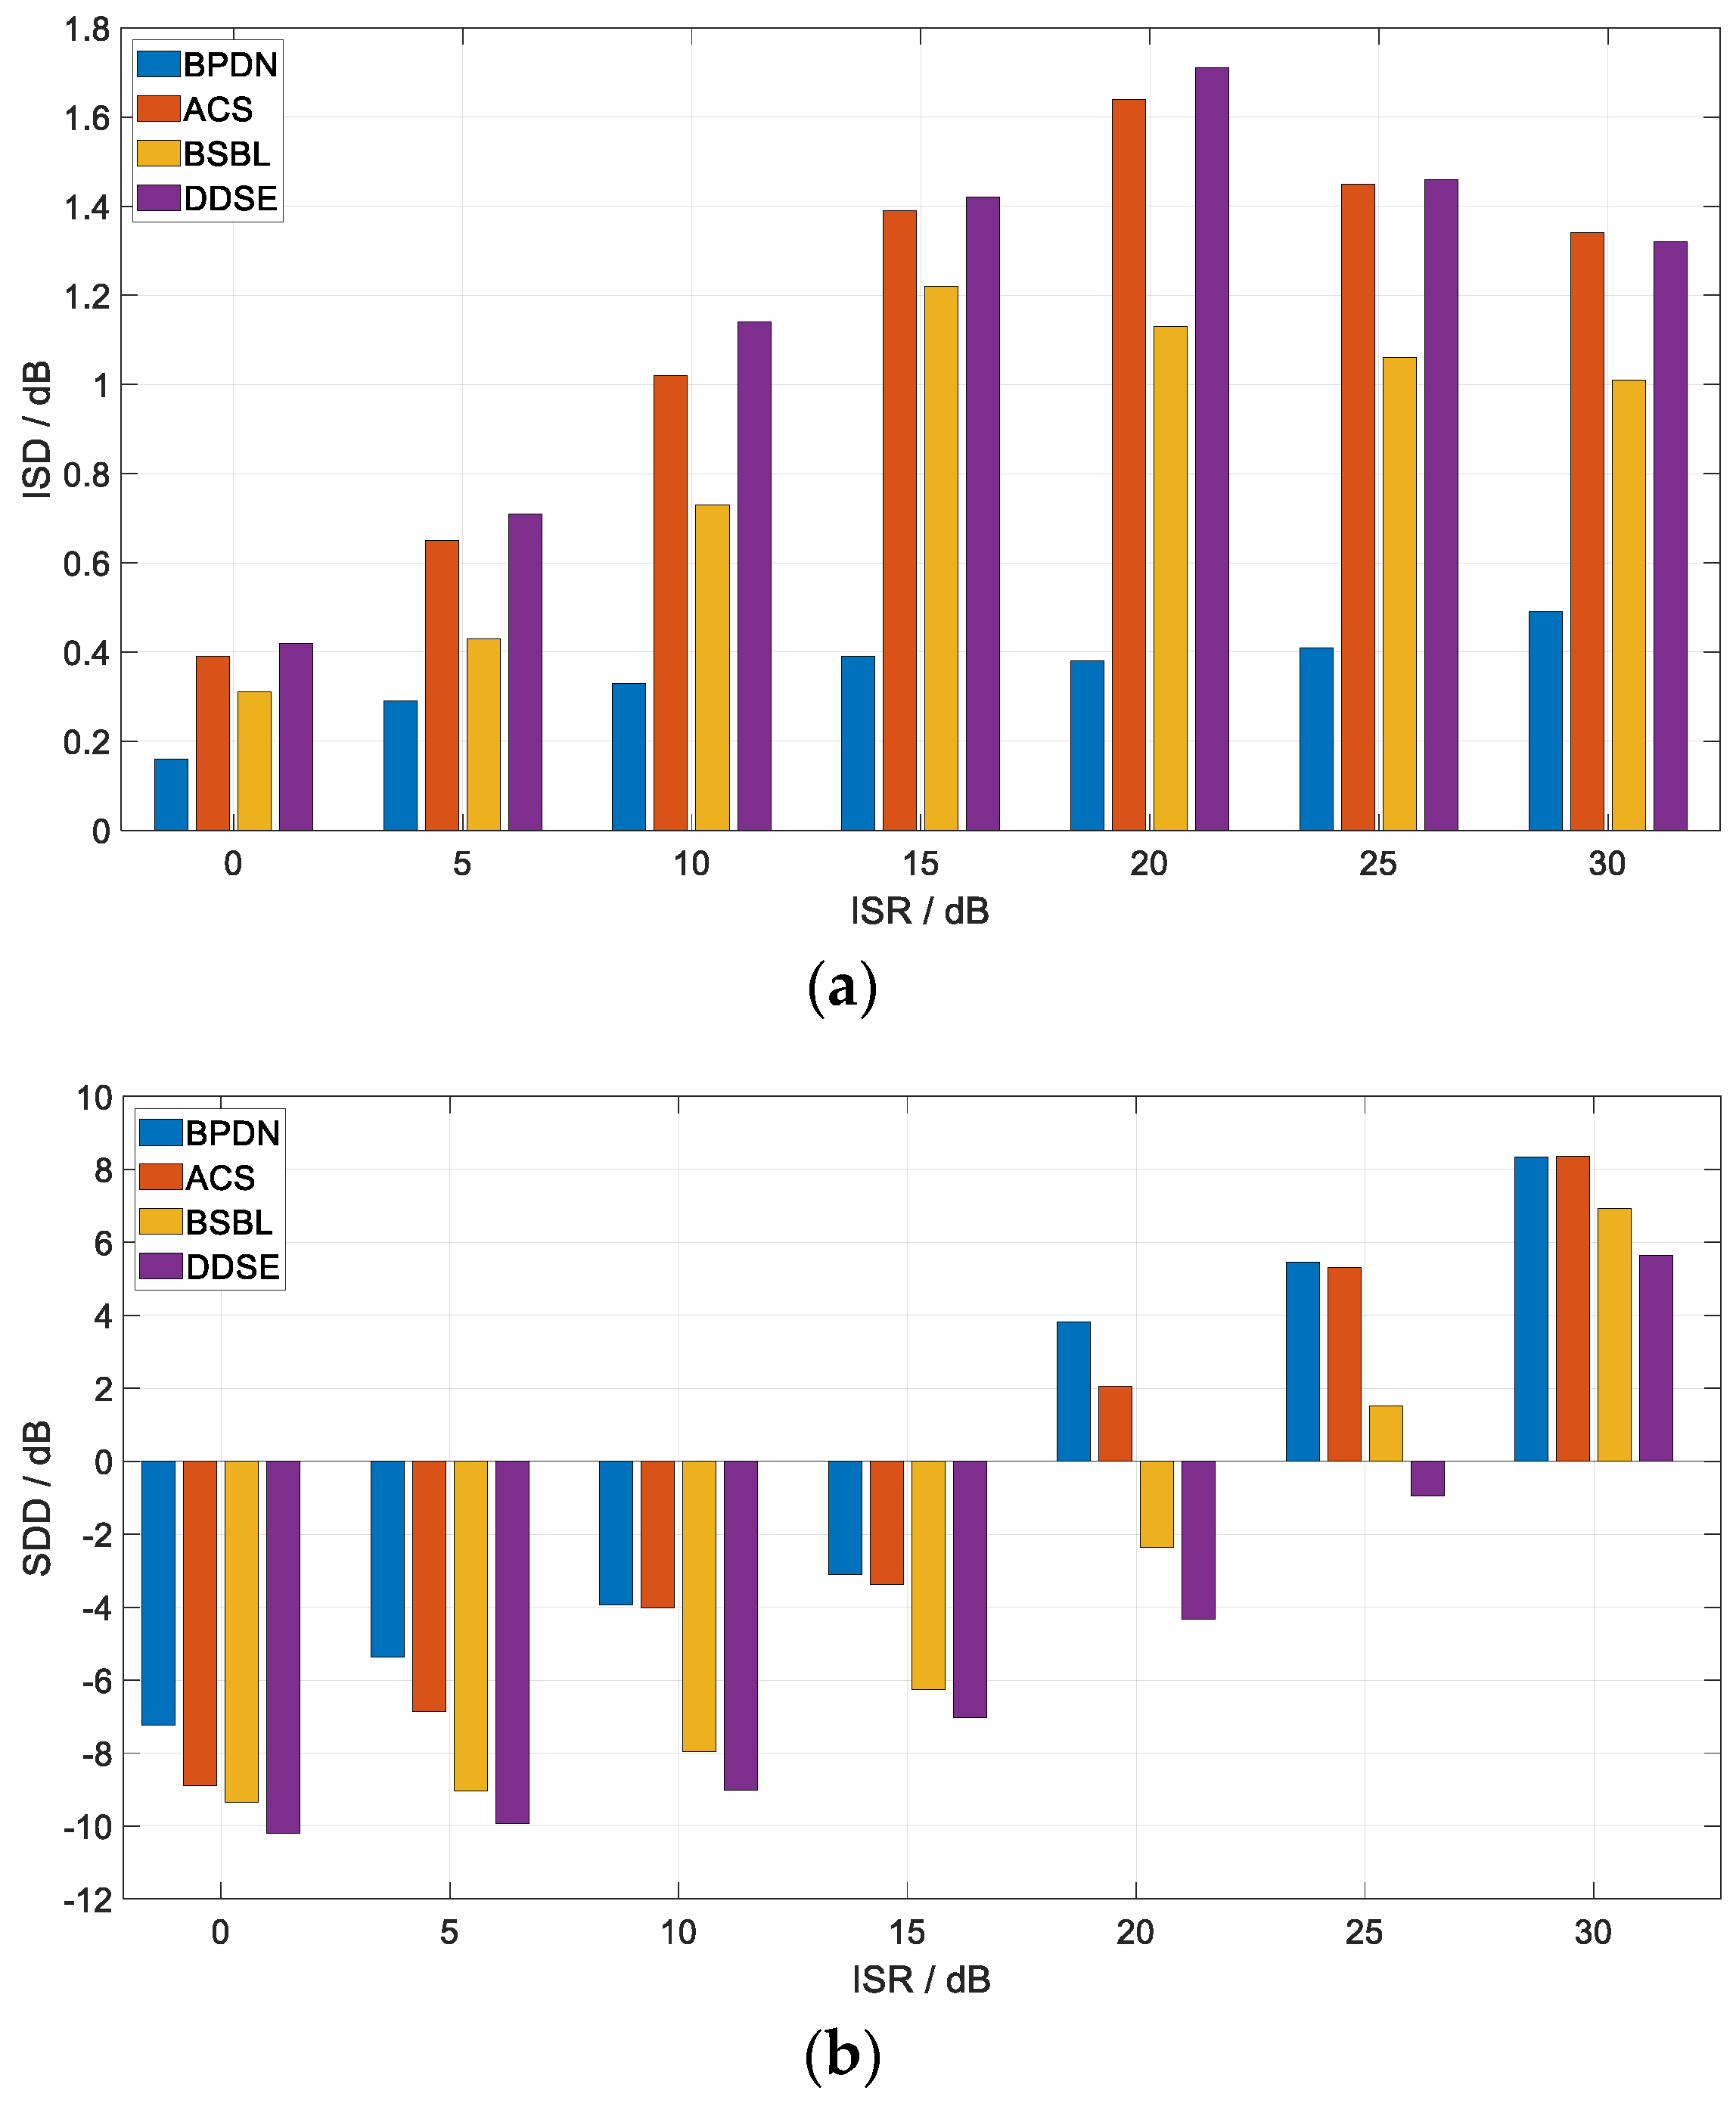
We also investigated and analyzed the impact of different parameters on WBNI suppression performance by performing 100 numerical simulations. Figure 9 shows the statistical average of ISD and SDD under different ISRs from 0 dB to 30 dB. Table 2 and Table 3 respectively show the changes of ISD and SDD based on the proposed DDSE algorithm with the sparsity level and the compression ratios (CR), where the ISR was set to 15 dB.
From the results in Figure 9, the proposed DDSE algorithm outperformed the others within the given parameter range in terms of both ISD and SDD. For the former indicator, the BPDN algorithm changed little, and the others presented a trend of increasing first and then decreasing. The ACS and the DDSE algorithms started to decrease when ISR reached 20 dB, while the BSBL algorithm started to decrease at 15 dB, which shows that DDSE and ACS are better able to suppress WBNI. For the latter indicator, all algorithms presented an upward trend with the ISR, where the DDSE and BSBL algorithms had better performances, indicating higher stability of signal recovery.
In Table 2, the ISD mainly depended on the sparsity and changed little with the compression ratio, since the subspace for signal recovery was constructed according to target distribution and CFAR detection results in the DDSE algorithm, which meant that more atoms were eliminated from the subspace when the target was sparser. In Table 3, the SDD was more affected by the compression ratio, since the low-dimensional observation introduced measurement noise into the process of signal recovery, leading to more serious signal distortion.
From the perspective of time efficiency, it is not difficult to see that the convergence iteration number in our proposed DDSE algorithm, which is the main factor of the running time, is determined by the dimensions of the extracted subspace. However, the detection results cannot be analyzed by a specific formula, since the WBNI is unpredictable. Thus, we calculated the average running time of each algorithm with the sparsity parameters listed above by 30 repeated simulations, the results of which are shown in Table 4. It can be seen that the running time of our proposed DDSE algorithm was at a minimum under low sparsity conditions, but it increased with the sparsity just like ACS, while the BPDN and the BSBL changed little.

5.2.2. Range-Azimuth Imaging

To further investigate the WBNI suppression effects with the proposed DDSE algorithm, we extended the simulation to the case of range-azimuth reconstruction, where an aircraft target with multiple scattering points was modeled and utilized for SAR imaging. The main parameters in this part are listed in Table 5 [33,34], and the intuitive results of range-azimuth imaging based on different WBNI suppression algorithms are shown in Figure 10.
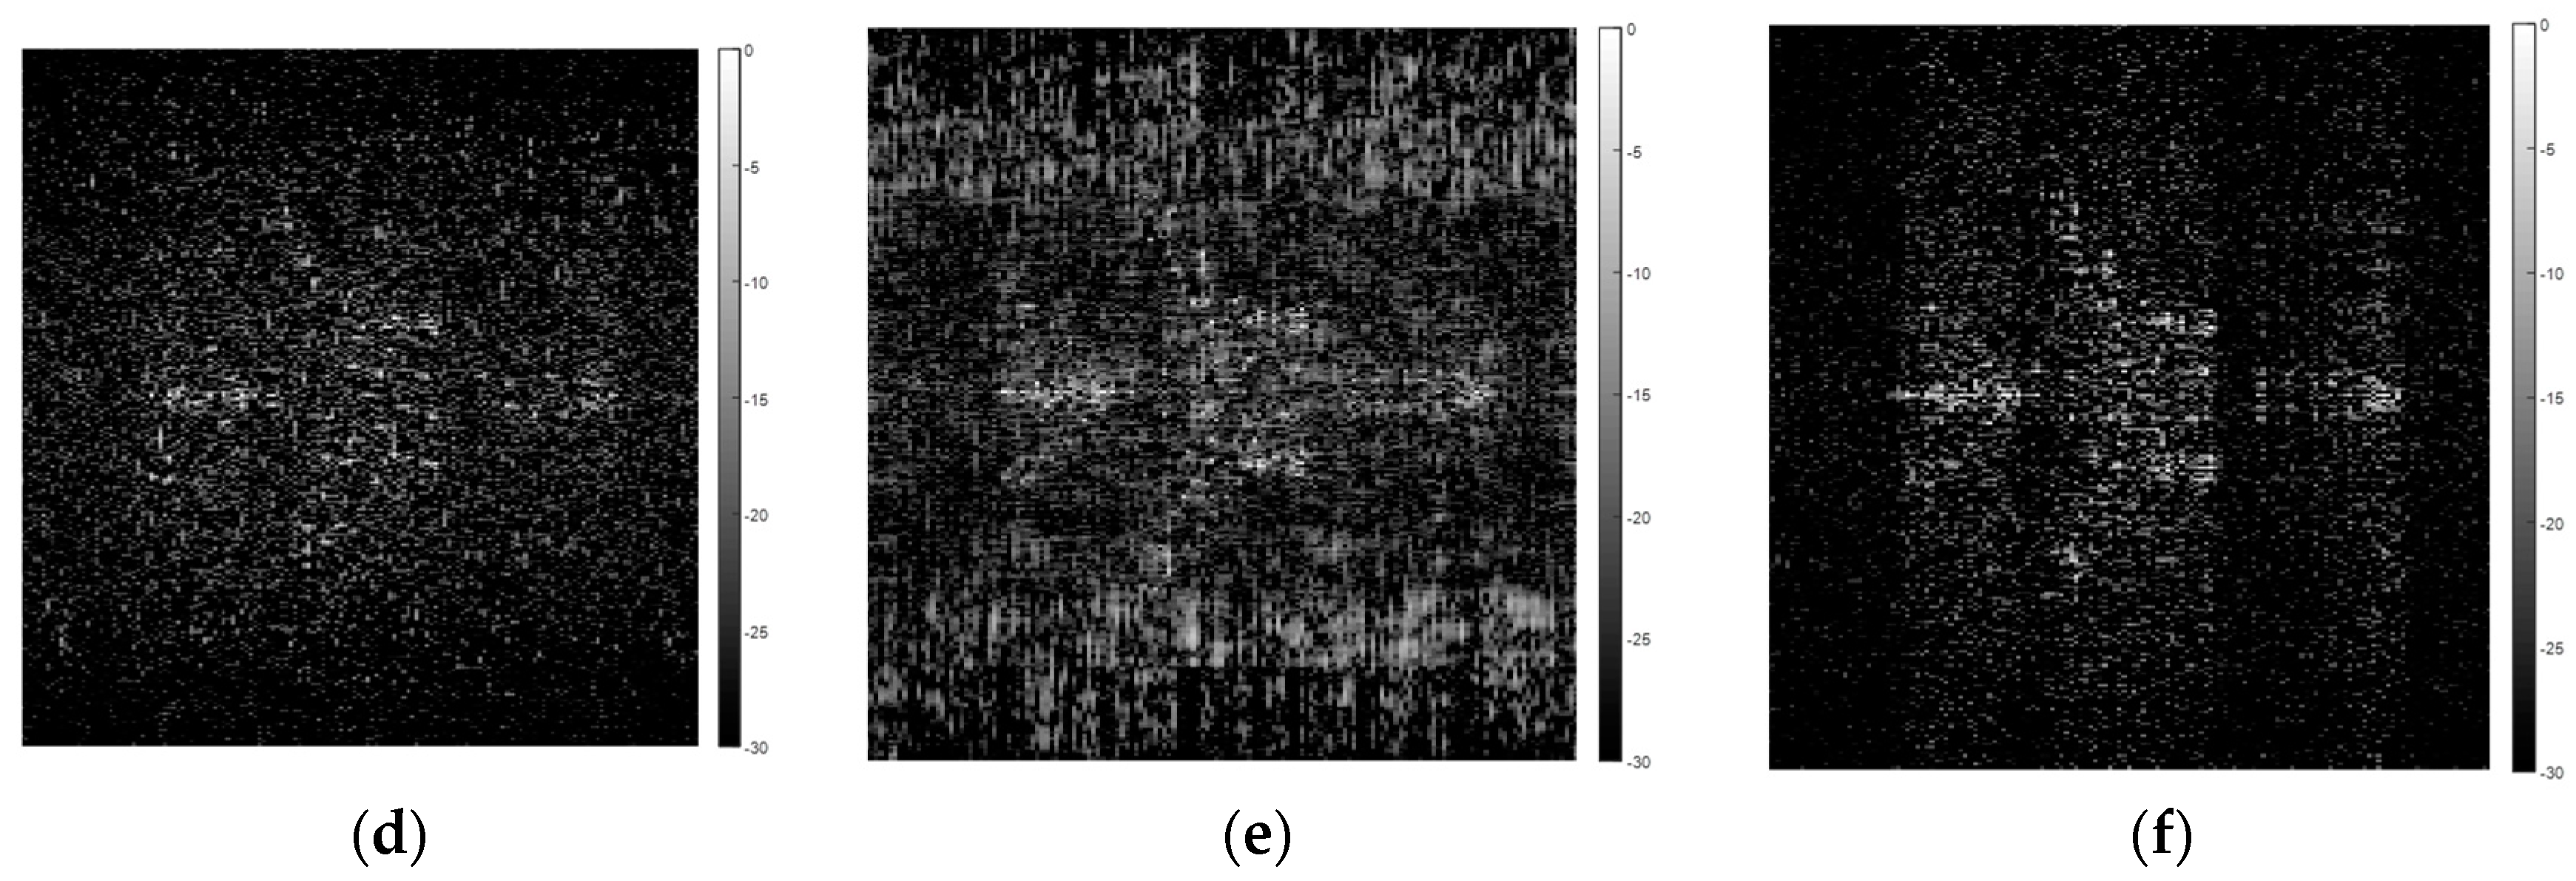
In Figure 10a,b, the reconstructed aircraft target is almost covered by WBNI and can hardly be distinguished if no measures are taken. In Figure 10c,d, the BPDN algorithm has little effect on interference suppression, and the ACS algorithm leads to serious signal distortion. The BSBL algorithm in Figure 10e, which is effective for narrowband interference (NBI) separation, increases the adverse effect for image reconstruction. In contrast, the proposed DDSE algorithm in Figure 10f performs better than the others in terms of visual quality.
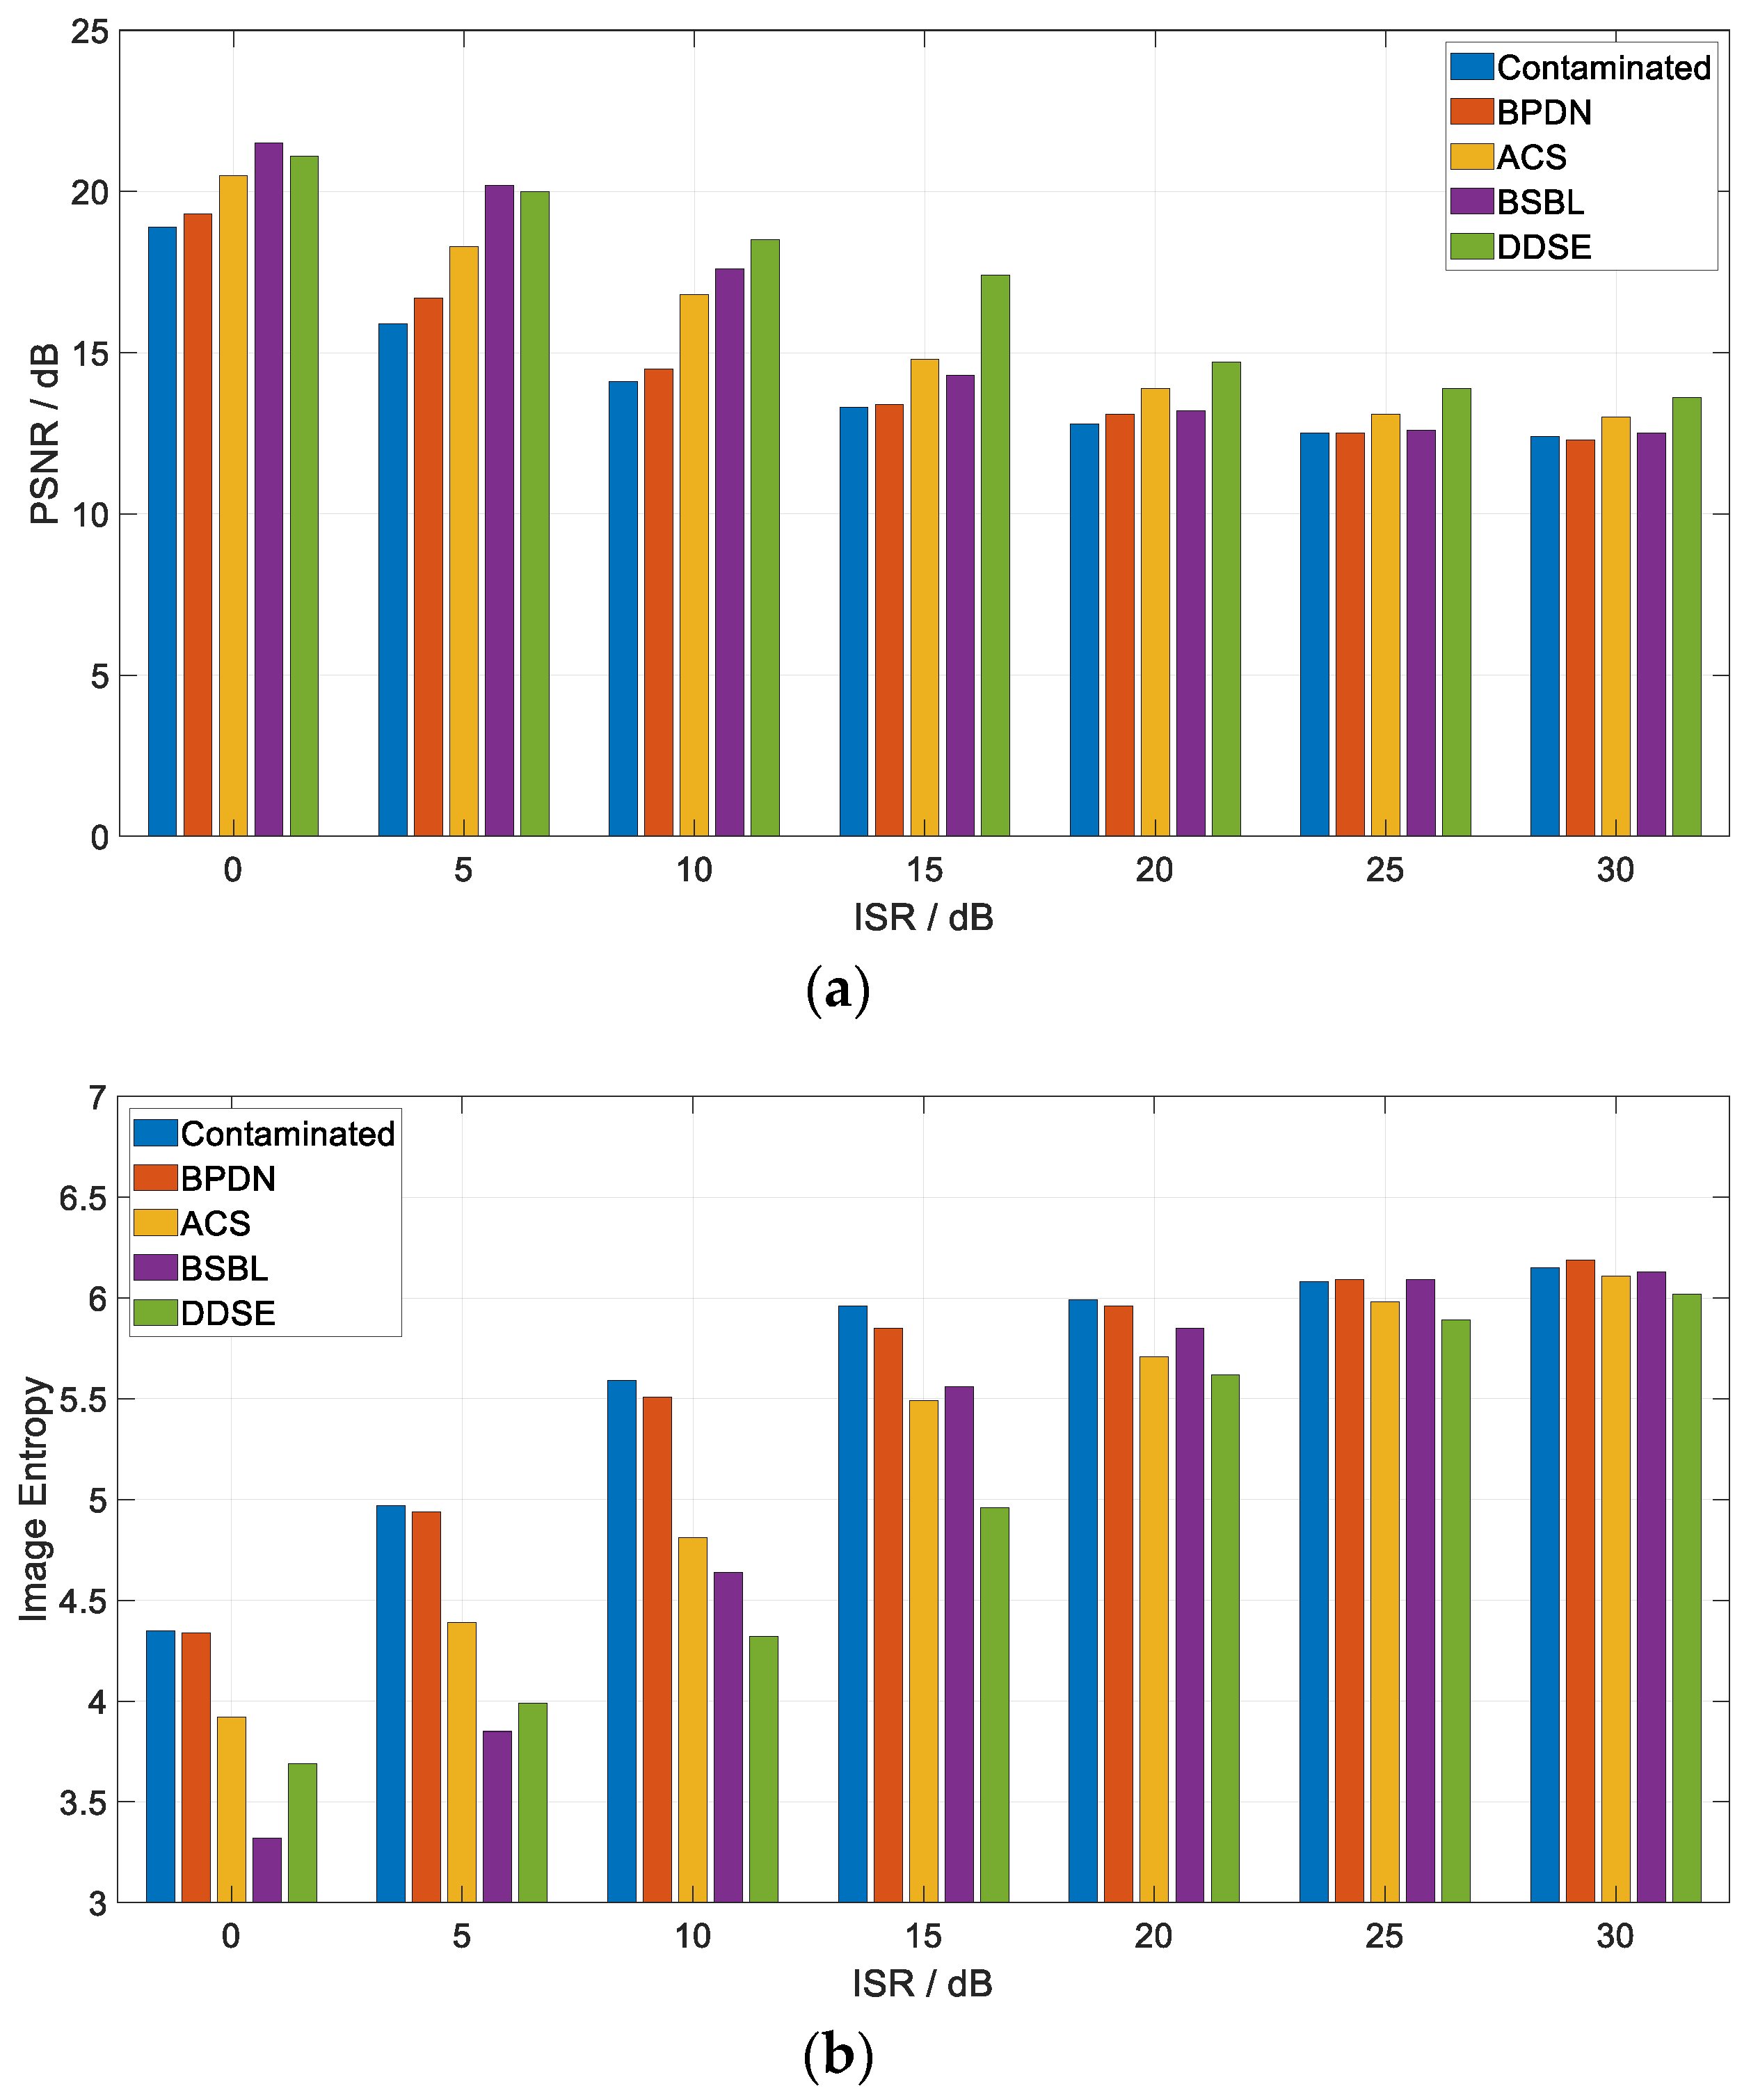
We employed the peak signal-to-noise ratio (PSNR) and image entropy to perform a quantitative evaluation of WBNI suppression performance for range-azimuth imaging, and then we carried out multiple range-azimuth imaging simulations to compare these two indicators under different parameters.
PSNR is a common indicator for evaluating image quality, which is often defined by the mean square error. It reflects the extent to which the SAR image is affected by noise or interference, and a larger value of PSNR indicates better image quality. Given the discrete property of sparse SAR images, we redefined it as:
P S N R =   10 log 10 1 L l = 1 L max L | A i , j | 2 1 N a N r L ( i = 1 N a j = 1 N r | A i , j | 2 l = 1 L max L | A i , j | 2 )
where Na and Nr are, respectively, the number of cells in azimuth and range of an SAR image; L is the number of scattering points; Ai,j denotes the complex value of the (i,j)-th point; |·| denotes the modulus value; and maxL represents picking out L largest values.
The image entropy is a statistical form used for representing the aggregation characteristics of the grayscale distribution and for measuring the average amount of information in an image. Since the principle of SAR imaging is different from that of conventional optical imaging, and a non-uniform grayscale histogram distribution can highlight the texture or the contour of the observation scene, we would rather obtain an SAR image with a lower entropy after suppression. This indicator can be calculated by:
I E =   i = 1 N G p i log 2 p i
where pi is the probability of the i-th grayscale level; and NG is the total number of all grayscale levels in the image.
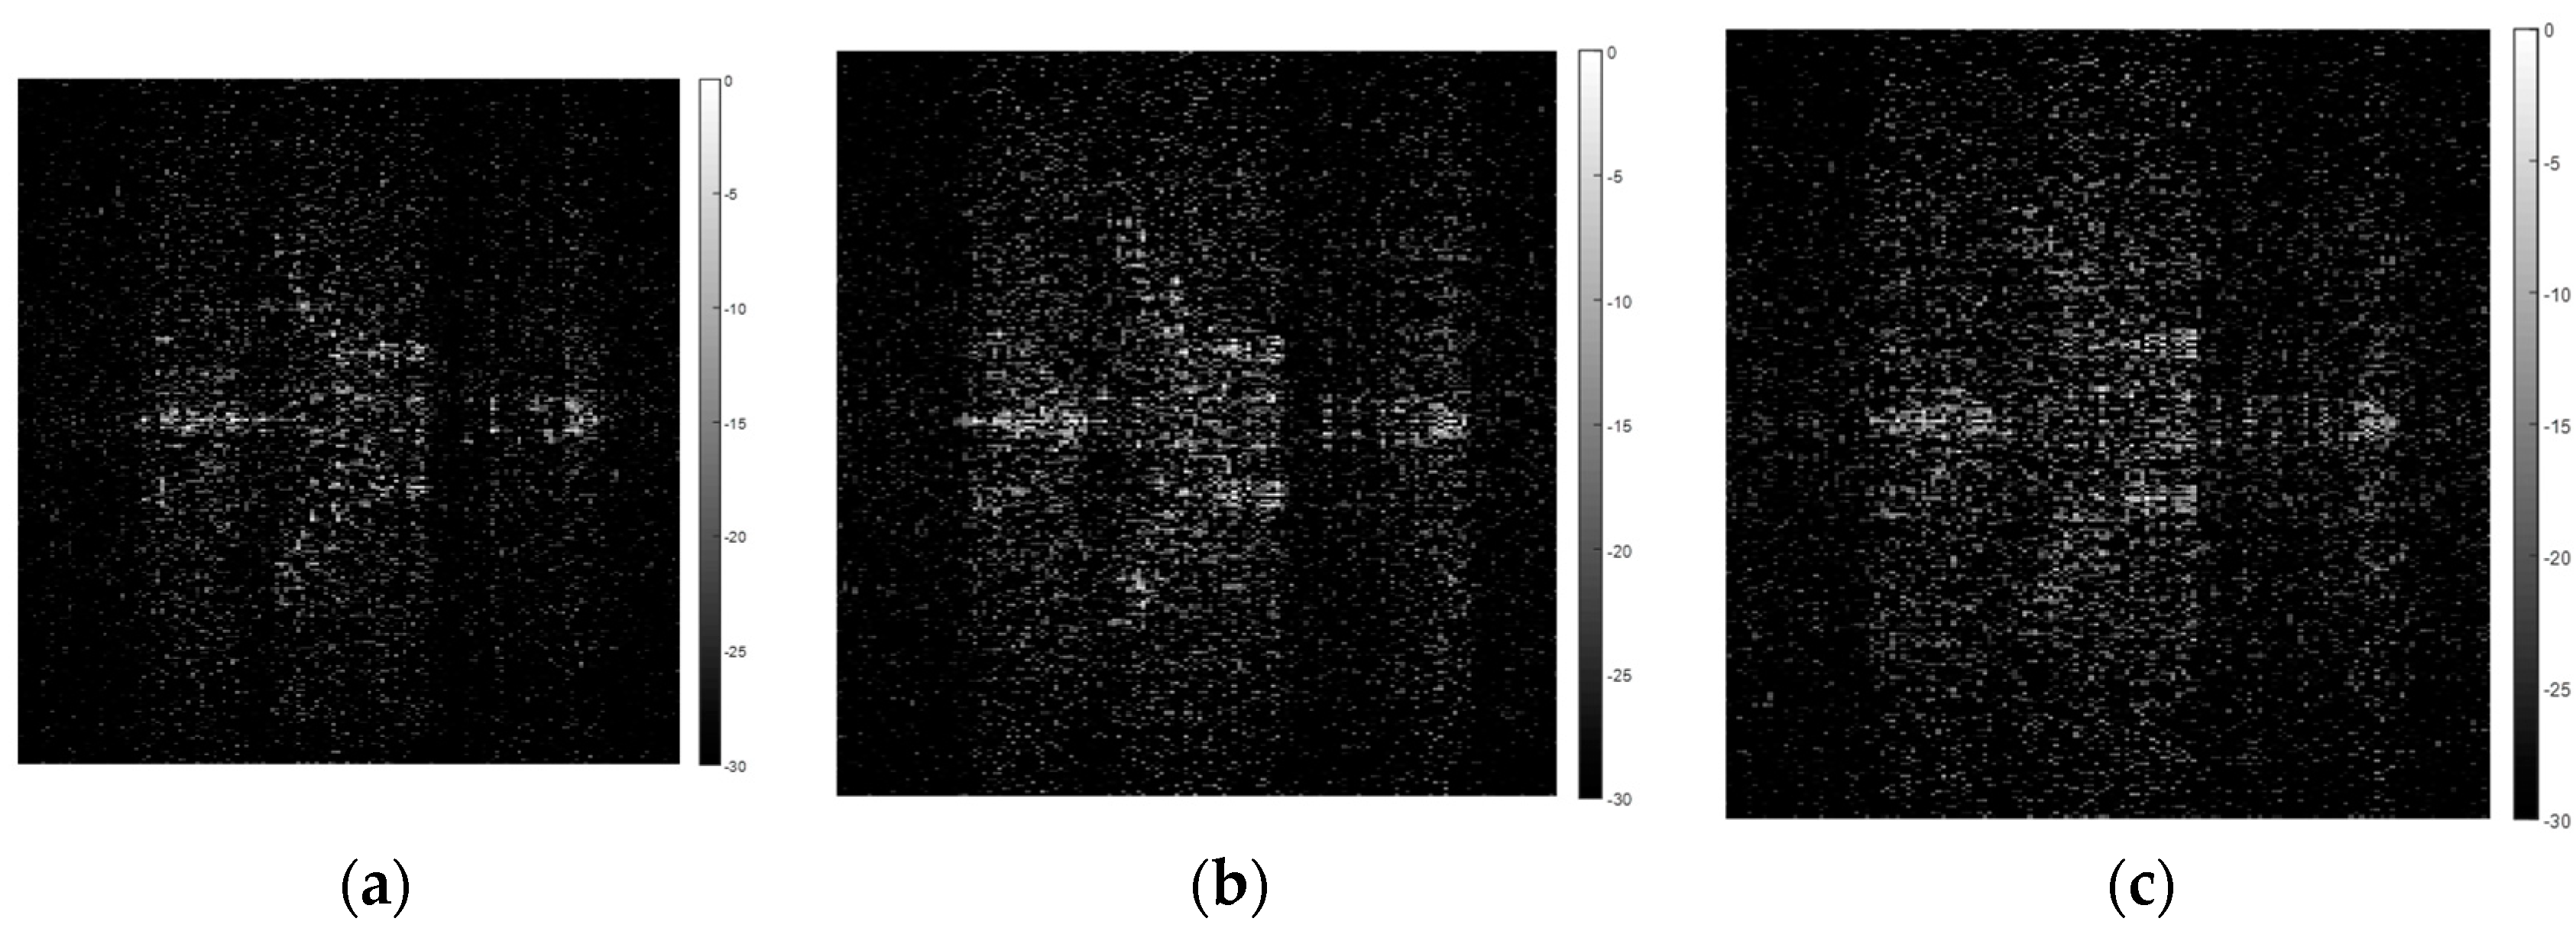
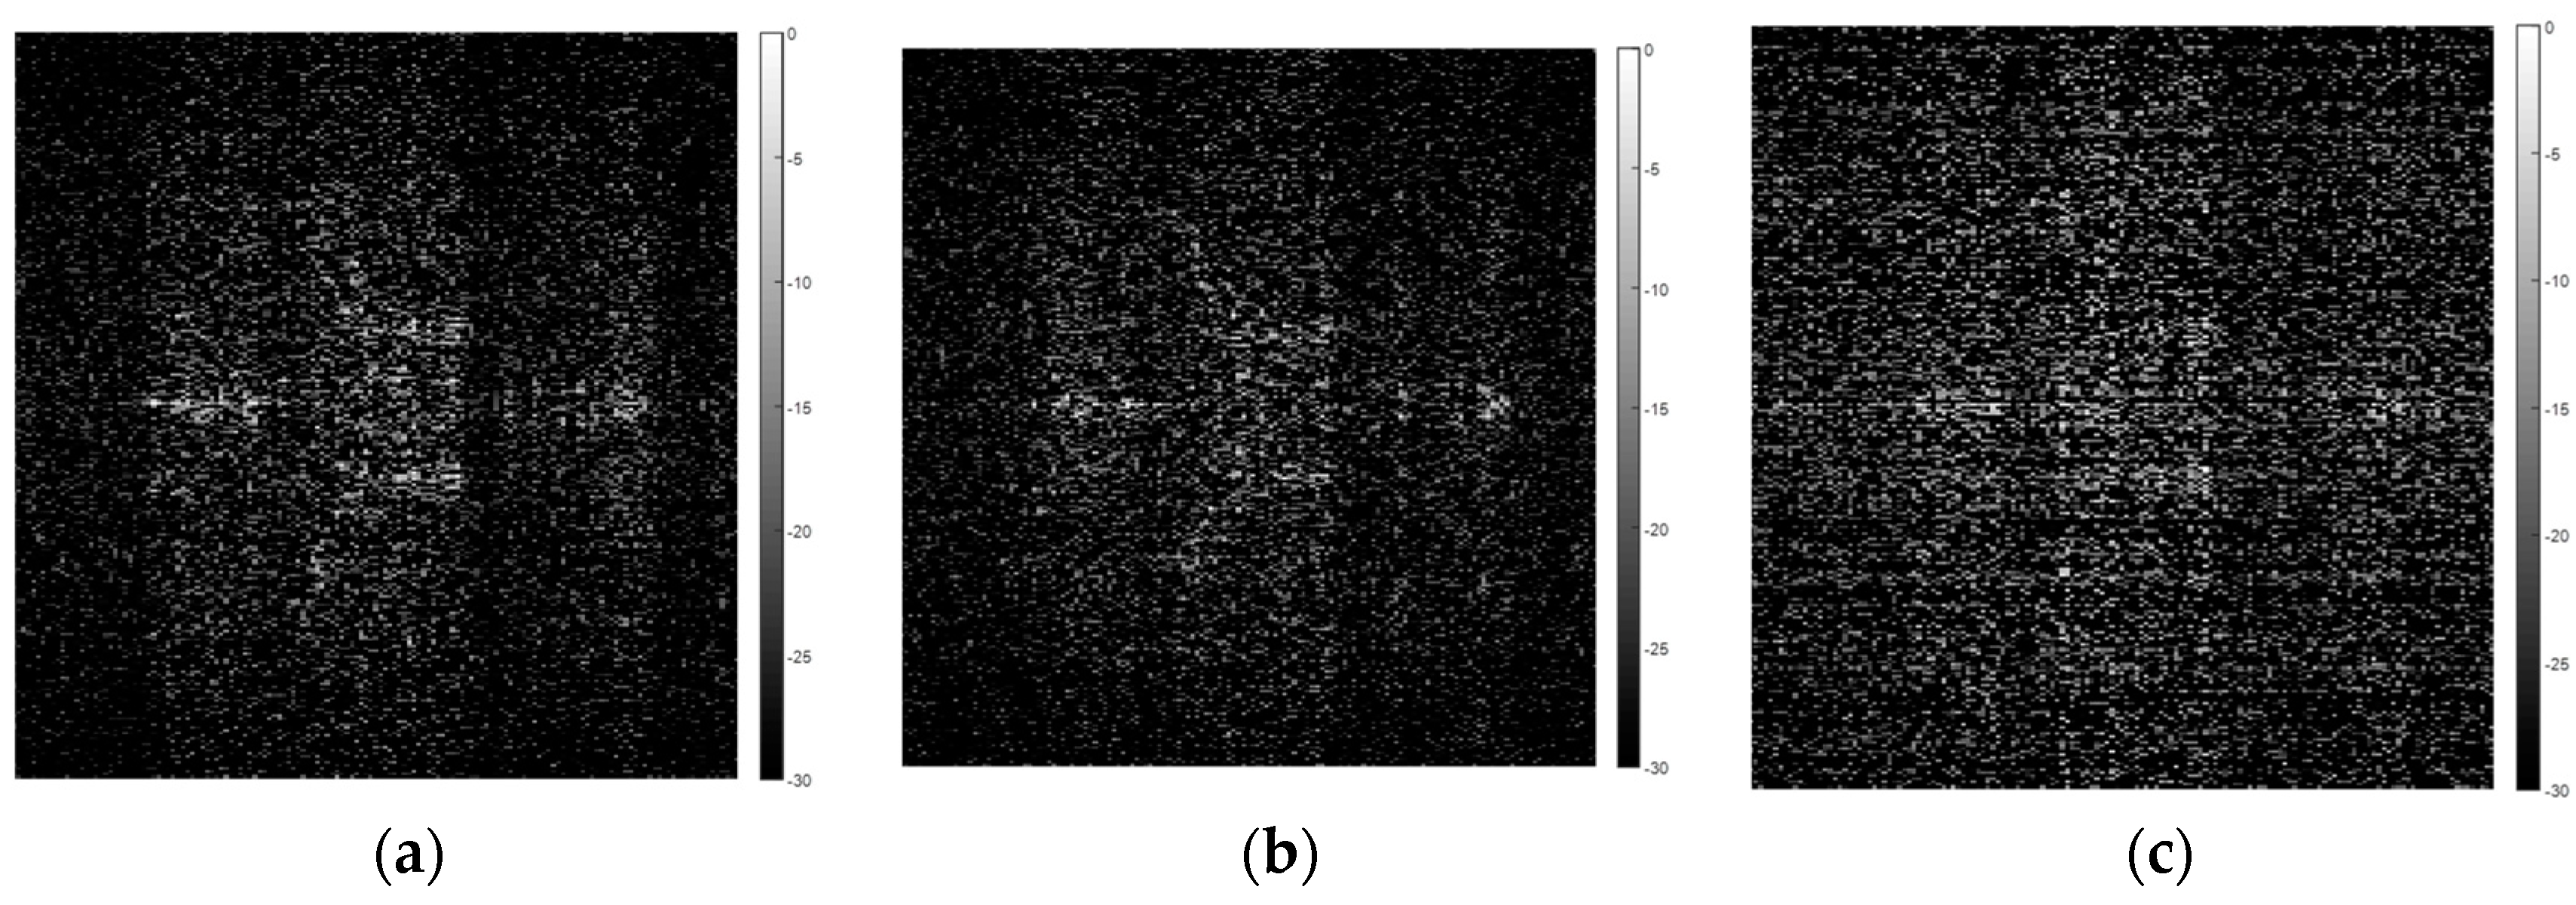
Figure 11 shows the statistical average of the peak-signal-to-noise ratio (PSNR) and image entropy under different ISRs from 0 dB to 30 dB by 100 numerical simulations. Figure 12 and Figure 13 show the range-azimuth imaging results based on the DDSE algorithm under different sparsity levels and compression ratios, where the number of points in the simulated aircraft model were set to 174, 348, and 696, and the CRs were set to 1/2, 1/4, and 1/8, respectively.
As can be seen from the results in Figure 11, the PSNR decreases with an increasing interference-to-signal ratio (ISR), while the image entropy increases. The BSBL algorithm performs better when the ISR is lower than 10 dB, but it also presents a rapid deterioration in performance. The proposed DDSE algorithm in this paper is superior to the other ones from the aspects of both WBNI suppression and stability. However, this superiority gradually weakens as the interference power increases further.
As shown in Figure 12 and Figure 13, WBNI suppression for range-azimuth imaging is influenced by both the sparsity level and the compression ratio. Under the same conditions, the proposed DDSE algorithm performs better for the observed scene with a lower sparsity level, since the dimensions of subspace corresponding to the SOI are smaller, leading to more interference components being suppressed in the process of signal reconstruction. When the compression ratio is higher than 1/4, the image quality with WBNI suppression changes little with the reduction of measurement number, but when the compression ratio is reduced to 1/8, it begins to decline seriously.

6. Conclusions

In this paper, we proposed a novel WBNI suppression approach for sparsity-based SAR imaging based on dechirping and double subspace extraction (DDSE) algorithms, the starting point of which was based on the derived conditions for minimizing energy projection of the interference. The dechirping observations were utilized to transform the raw echo to a series of single frequency signals, making it possible to be sparsely represented on an orthogonal basis, which was proven to be the optimal one. The subspace for accurate signal reconstruction was extracted from two separate and parallel steps, where both the geometric prior and the waveform prior were exploited, and then determined as the intersection of these two obtained index sets. The experimental results show that the proposed DDSE algorithm outperforms the others both in suppressing WBNI and in reducing signal distortion. It is necessary to note here that our proposed algorithm is effective under the assumptions of a small observed scene. Therefore, how to extend this algorithm to large scene conditions is our main area of focus in future research.

Author Contributions

Conceptualization and supervision: W.Y.; methodology and investigation: G.L. (Guojing Li) and G.L. (Guochao Lao); experiment: G.L. (Guojing Li) and Q.L.; writing: G.L. (Guojing Li).

Funding

This research was funded by the Research Project of State Key Laboratory of Complex Electromagnetic Environment Effects on Electronics and Information System, grant number 2017Z0203B.

Conflicts of Interest

The authors declare no conflict of interest.

References

  1. Çetin, M.; Stojanovic, I.; Onhon, O.; Varshney, K.; Samadi, S.; Karl, W.C.; Willsky, A.S. Sparsity-driven synthetic aperture radar imaging: Reconstruction, autofocusing, moving targets, and compressed sensing. IEEE Signal Process. Mag. 2014, 31, 27–40. [Google Scholar] [CrossRef]
  2. Zhang, B.; Hong, W.; Wu, Y. Sparse microwave imaging: Principles and applications. Sci. China Inf. Sci. 2012, 55, 1722–1754. [Google Scholar] [CrossRef] [Green Version]
  3. Donoho, D.L. Compressed sensing. IEEE Trans. Inf. Theory 2006, 52, 1289–1306. [Google Scholar] [CrossRef]
  4. Patel, V.M.; Easley, G.R.; Healy, D.M.; Chellappa, R. Compressed synthetic aperture radar. IEEE J. Sel. Top. Signal Process. 2010, 4, 244–254. [Google Scholar] [CrossRef]
  5. Fang, J.; Xu, Z.; Zhang, B.; Hong, W.; Wu, Y. Fast Compressed sensing SAR imaging based on approximated observation. IEEE J. Sel. Top. Appl. Earth Obs. Remote Sens. 2014, 7, 352–363. [Google Scholar] [CrossRef]
  6. Soumekh, M. SAR-ECCM using phase-perturbed LFM chirp signals and DRFM repeat jammer penalization. IEEE Trans. Aerosp. Electron. Syst. 2006, 42, 191–205. [Google Scholar] [CrossRef]
  7. Yang, L.; Gao, S.; Hu, R.; Wei, H. Performance analysis of coherent jamming and non-coherent jamming against SAR. Syst. Eng. Electron. 2018, 40, 2444–2449. [Google Scholar]
  8. Li, B.; Hong, W. Study of noise jamming to SAR. Acta Electron. Sin. 2004, 32, 2035–2037. [Google Scholar]
  9. Orlando, D. A novel noise jamming detection algorithm for radar applications. IEEE Signal Process. Lett. 2017, 24, 206–210. [Google Scholar] [CrossRef]
  10. Mishali, M.; Eldar, Y.C.; Elron, A. Xampling: Signal acquisition and processing in union of subspaces. IEEE Trans. Signal Process. 2011, 59, 4719–4734. [Google Scholar] [CrossRef]
  11. Arias-Castro, E.; Eldar, Y.C. Noise folding in compressed sensing. IEEE Signal Process. Lett. 2012, 18, 478–481. [Google Scholar] [CrossRef]
  12. Davenport, M.A.; Laska, J.N.; Treichler, J.R.; Baraniuk, R.G. The pros and cons of compressive sensing for wideband signal acquisition: Noise folding versus dynamic range. IEEE Trans. Signal Process. 2012, 60, 4628–4642. [Google Scholar] [CrossRef]
  13. Li, D.; Zhan, M.; Fang, Z.; Xiong, H.; Jiang, Q. Parameterized wideband interference suppression for SAR imaging based on HAF. Syst. Eng. Electron. 2017, 39, 514–521. [Google Scholar]
  14. Su, J.; Tao, M.; Xie, J.; Wang, L. Interference Suppression for SAR Based on Ambiguity Function Iteration Decomposition. In Proceedings of the 2018 IEEE International Geoscience and Remote Sensing Symposium (IGARSS), Valencia, Spain, 22–27 July 2018. [Google Scholar] [CrossRef]
  15. Chen, R.; Wang, Y. Universal FRFT-based algorithm for parameter estimation of chirp signals. J. Syst. Eng. Electron. 2012, 23, 495–501. [Google Scholar] [CrossRef]
  16. Elgamel, S.A.; Soraghan, J.J. Using EMD-FrFT filtering to mitigate very high power interference in chirp tracking radars. IEEE Signal Process. Lett. 2011, 18, 263–266. [Google Scholar] [CrossRef]
  17. Su, J.; Tao, H.; Song, D.; Rao, X.; Xie, J. Interference suppression algorithm for SAR based on WD and sliding window masking technique in time-frequency domain. Acta Electron. Sin. 2015, 43, 2345–2351. [Google Scholar]
  18. Zhang, S.; Xing, M.; Guo, R.; Zhang, L.; Bao, Z. Interference suppression algorithm for SAR based on time–Frequency transform. IEEE Trans. Geosci. Remote Sens. 2011, 49, 3765–3779. [Google Scholar] [CrossRef]
  19. Tao, M.; Zhou, F.; Zhang, Z. Wideband interference mitigation in high-resolution airborne synthetic aperture radar data. IEEE Trans. Geosci. Remote Sens. 2016, 54, 74–87. [Google Scholar] [CrossRef]
  20. Yang, Z.; Du, W.; Liu, Z.; Liao, G. WBI suppression for SAR using iterative adaptive method. IEEE J. Sel. Top. Appl. Earth Obs. Remote Sens. 2016, 9, 1008–1014. [Google Scholar] [CrossRef]
  21. Lu, X.; Yang, J.; Ma, C.; Gu, H.; Su, W. Wide-band interference mitigation algorithm for SAR based on time-varying filtering and sparse recovery. Electron. Lett. 2018, 54, 165–167. [Google Scholar] [CrossRef]
  22. Liu, H.; Li, D.; Zhou, Y.; Truong, T. Joint wideband interference suppression and SAR signal recovery based on sparse representations. IEEE Geosci. Remote Sens. Lett. 2017, 14, 1542–1546. [Google Scholar] [CrossRef]
  23. Liu, H.; Li, D.; Zhou, Y.; Truong, T. Simultaneous Radio Frequency and Wideband Interference Suppression in SAR Signals via Sparsity Exploitation in Time-Frequency Domain. IEEE Trans. Geosci. Remote Sens. 2018, 56, 5780–5793. [Google Scholar] [CrossRef]
  24. Chen, S.S.; Donoho, D.L.; Saunders, M.A. Atomic decomposition by basis pursuit. SIAM Rev. 2001, 43, 129–159. [Google Scholar] [CrossRef]
  25. Kang, R.; Tian, P.; Yu, Y. An adaptive compressed sensing method based on selective measure. Acta Phys. Sin. 2014, 63, 143–150. [Google Scholar]
  26. Cumming, I.G.; Dettwiler, M. Digital Processing of Synthetic Aperture Radar Data: Algorithms and Implementation; Artech House: Norwood, MA, USA, 2004. [Google Scholar]
  27. Tropp, J.A.; Gilbert, A.C. Signal recovery from random measurements via orthogonal matching pursuit. IEEE Trans. Inf. Theory 2007, 53, 4655–4666. [Google Scholar] [CrossRef]
  28. Elad, M.; Bruckstein, A.M. A generalized uncertainty principle and sparse representation in pairs of bases. IEEE Trans. Inf. Theory 2002, 48, 2558–2567. [Google Scholar] [CrossRef]
  29. Zhang, X. Matrix Analysis and Applications, 2nd ed.; Tsinghua University Press: Beijing, China, 2004. [Google Scholar]
  30. Caputi, W.J. Stretch: A time-transformation technique. IEEE Trans. Aerosp. Electron. Syst. 1971, AES-7, 269–278. [Google Scholar] [CrossRef]
  31. Ma, J.; Liu, C.; Gan, L. CFAR target detection algorithm based on compressive sensing. J. Electron. Inf. Technol. 2017, 39, 2899–2904. [Google Scholar]
  32. Gandhi, P.; Kassam, S. Analysis of CFAR processors in nonhomogeneous background. IEEE Trans. Aerosp. Electron. Syst. 1988, 24, 427–445. [Google Scholar] [CrossRef]
  33. Lu, X.; Su, W.; Yang, J.; Gu, H.; Zhang, H.; Yu, W.; Yeo, T.S. Radio frequency interference suppression for SAR via block sparse Bayesian learning. IEEE J. Sel. Top. Appl. Earth Obs. Remote Sens. 2018, 11, 4835–4847. [Google Scholar] [CrossRef]
  34. Li, G.; Ye, W.; Lao, G.; Kong, S.; Yan, D. Narrowband interference separation for synthetic aperture radar via sensing matrix optimization-based block sparse Bayesian learning. Electronics 2019, 8, 458. [Google Scholar] [CrossRef]
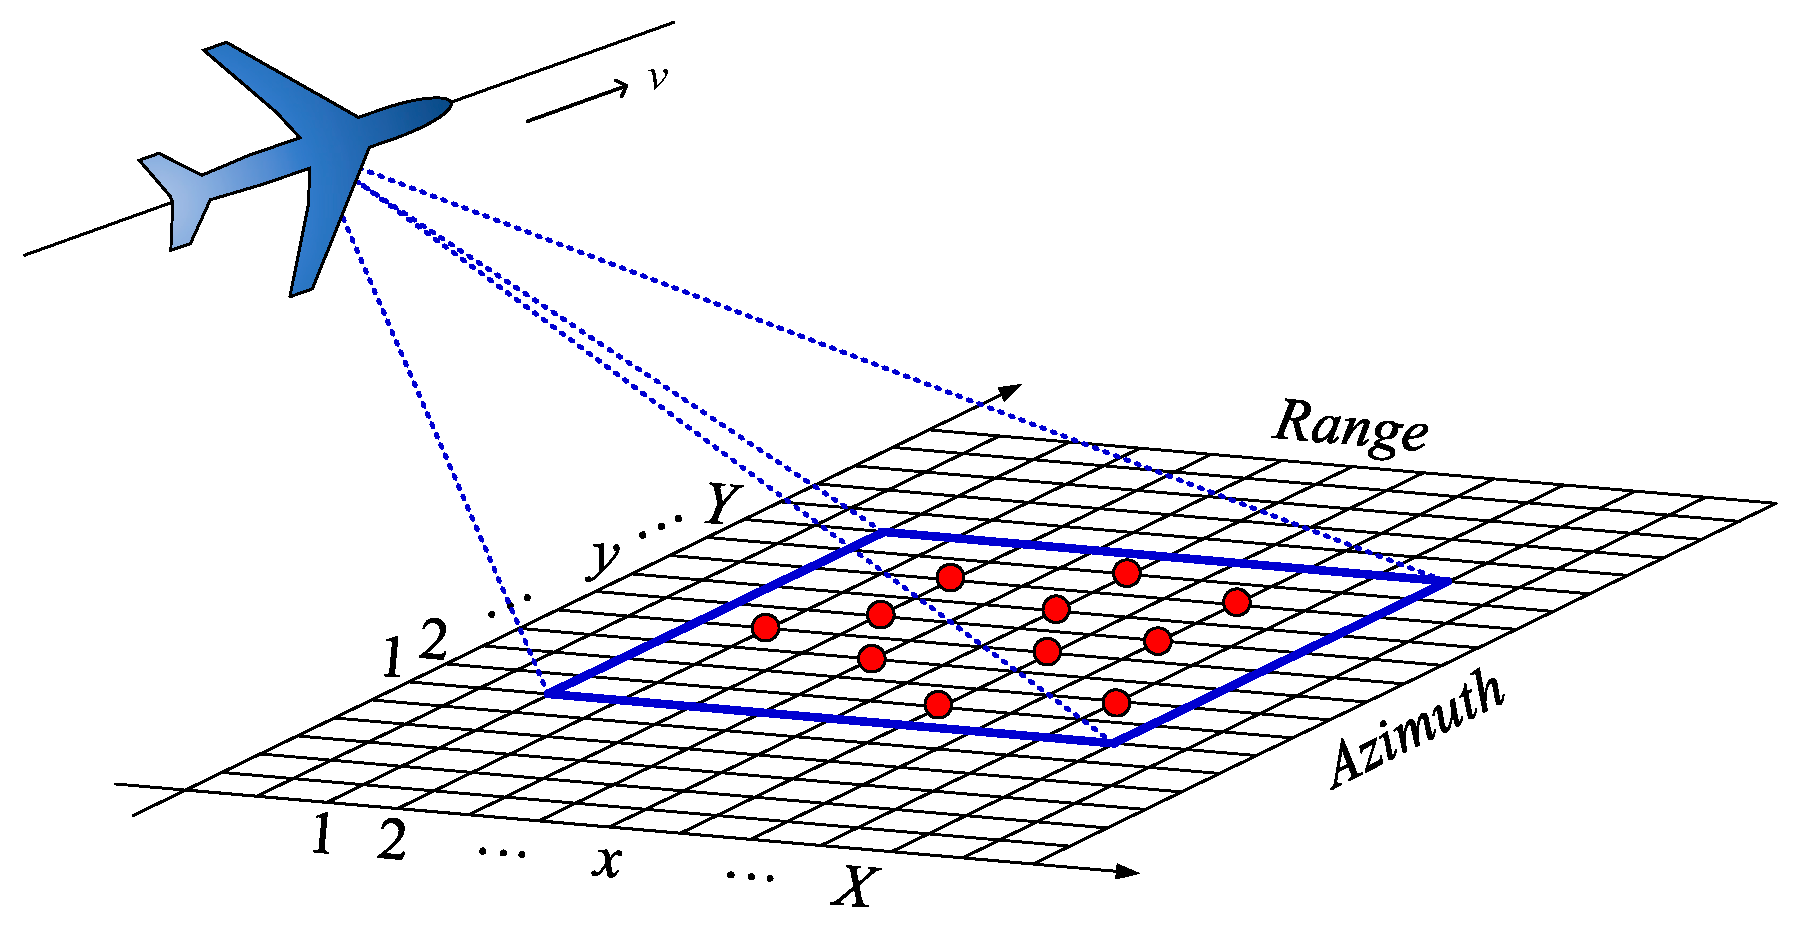
Figure 1. Diagram of a gridded synthetic aperture radar (SAR) observation model. The blue box represents the observed area. The red points represent discrete scattering points with large coefficients. X and Y are the number of grids in range and azimuth directions, respectively.
Electronics 08 01019 g001
Figure 2. Diagram of Fourier basis and coefficient distribution of different interference types. (a) Fourier basis (real part); (b) radio frequency interference; (c) narrowband noise interference; and (d) wideband noise interference.
Electronics 08 01019 g002
Figure 3. The projected energy gain (PEG) of wideband noise interference (WBNI) on a signal support set after sparse recovery. (a) Under different sparsity levels (M = N); (b) under different observation parameters (K = 100).
Electronics 08 01019 g003
Figure 4. The diagram of double subspace extraction.
Electronics 08 01019 g004
Figure 5. The flowchart of the WBNI suppression procedure based on the double subspace extraction (DDSE) algorithm.
Electronics 08 01019 g005
Figure 6. Signal characteristics. (a) Waveform; (b) frequency spectrum; and (c) range reconstruction.
Electronics 08 01019 g006
Figure 7. Subspace extraction results by denoising constant false-alarm ratio (CFAR) detection. (a) η = 1; (b) η = 2. The green line represents the CFAR threshold. The black dashed box represents the extracted index set where the real target is located. The red dashed box represents the extracted false-alert index set.
Electronics 08 01019 g007
Figure 8. Range profile reconstruction based on different WBNI suppression algorithms. (a) basic pursuit denoising (BPDN); (b) adaptive compressed sampling (ACS); (c) block sparse Bayesian learning (BSBL); and (d) DDSE.
Electronics 08 01019 g008
Figure 9. Signal reconstruction performance under different interference-to-signal ratio (ISRs). (a) interference suppression degree (ISD); (b) signal distortion degree (SDD).
Electronics 08 01019 g009
Figure 10. Range-azimuth imaging based on different WBNI suppression algorithms. (a) Original; (b) contaminated; (c) BPDN; (d) ACS; (e) BSBL; and (f) DDSE.
Electronics 08 01019 g010aElectronics 08 01019 g010b
Figure 11. Range-azimuth imaging performances under different ISRs. (a) peak signal-to-noise ratio (PSNR); (b) image entropy.
Electronics 08 01019 g011
Figure 12. Effects of WBNI suppression for range-azimuth imaging based on the DDSE algorithm under different sparsity levels. (a) K = 174; (b) K = 348; and (c) K = 696.
Electronics 08 01019 g012
Figure 13. Effects of WBNI suppression for range-azimuth imaging based on the DDSE algorithm under different compression ratios. (a) CR = 1/2; (b) CR = 1/4; and (c) CR = 1/8.
Electronics 08 01019 g013
Table 1. Main parameters for range profile imaging simulations.
Parameter ClassParameter NameParameter Value
Geometric ParametersPlatform height3 km
Pitch angle45°
Scene Range128 m
Signal ParametersCarrier frequency3 GHz
Bandwidth100 MHz
LFM pulse width2 μs
Oversampling rate1.2
*LFM= linear frequency-modulated.
Table 2. ISDs under different sparsity levels and compression ratios (CR) (dB).
K = 5K = 10K = 20K = 40
CR = 1/11.4221.3541.2471.102
CR = 1/21.4171.3521.2261.097
CR = 1/41.4101.3461.2401.080
CR = 1/81.3731.2791.1921.025
Table 3. SDDs under different sparsity levels and compression ratios (dB).
K = 5K = 10K = 20K = 40
CR = 1/1−7.035−6.685−6.104−5.217
CR = 1/2−6.490−5.782−4.878−3.632
CR = 1/4−5.852−5.046−4.220−3.096
CR = 1/8−1.507−0.879−0.121−0.274
Table 4. Average running time of different algorithms (second).
BPDNACSBSBLDDSE
K = 516.8255.3256.8273.364
K = 1017.0816.8116.7954.162
K = 2017.6308.7396.9496.593
K = 4018.53312.4476.952−199.259
Table 5. Main parameters for range-azimuth imaging simulations.
Parameter ClassParameter NameParameter Value
Geometric ParametersPlatform height3 km
Scene range128 m × 128 m
Pitch angle45°
Squint angle
Parallel velocity150 m/s
Signal ParametersCarrier frequency3 GHz
Bandwidth100 MHz
LFM pulse width2 μs
Oversampling coefficient1.2
Pulse repetition frequency125 Hz