Modernized Solar Radio Spectrograph in the L Band Based on Software Defined Radio


Abstract
:1. Introduction
1.1. Radio Diagnostics in Solar Flare Research
1.2. Direct Influence of the Solar Radio Bursts on the Radio Systems
1.3. The Motivation for Modernization of Solar Radio Spectrography Instruments
2. Design Concepts Analysis
2.1. Technical Requirements
- Processing frequency range min. 1/2 GHz.
- Frequency bins spacing <1 MHz.
- Time resolution ≤1 ms.
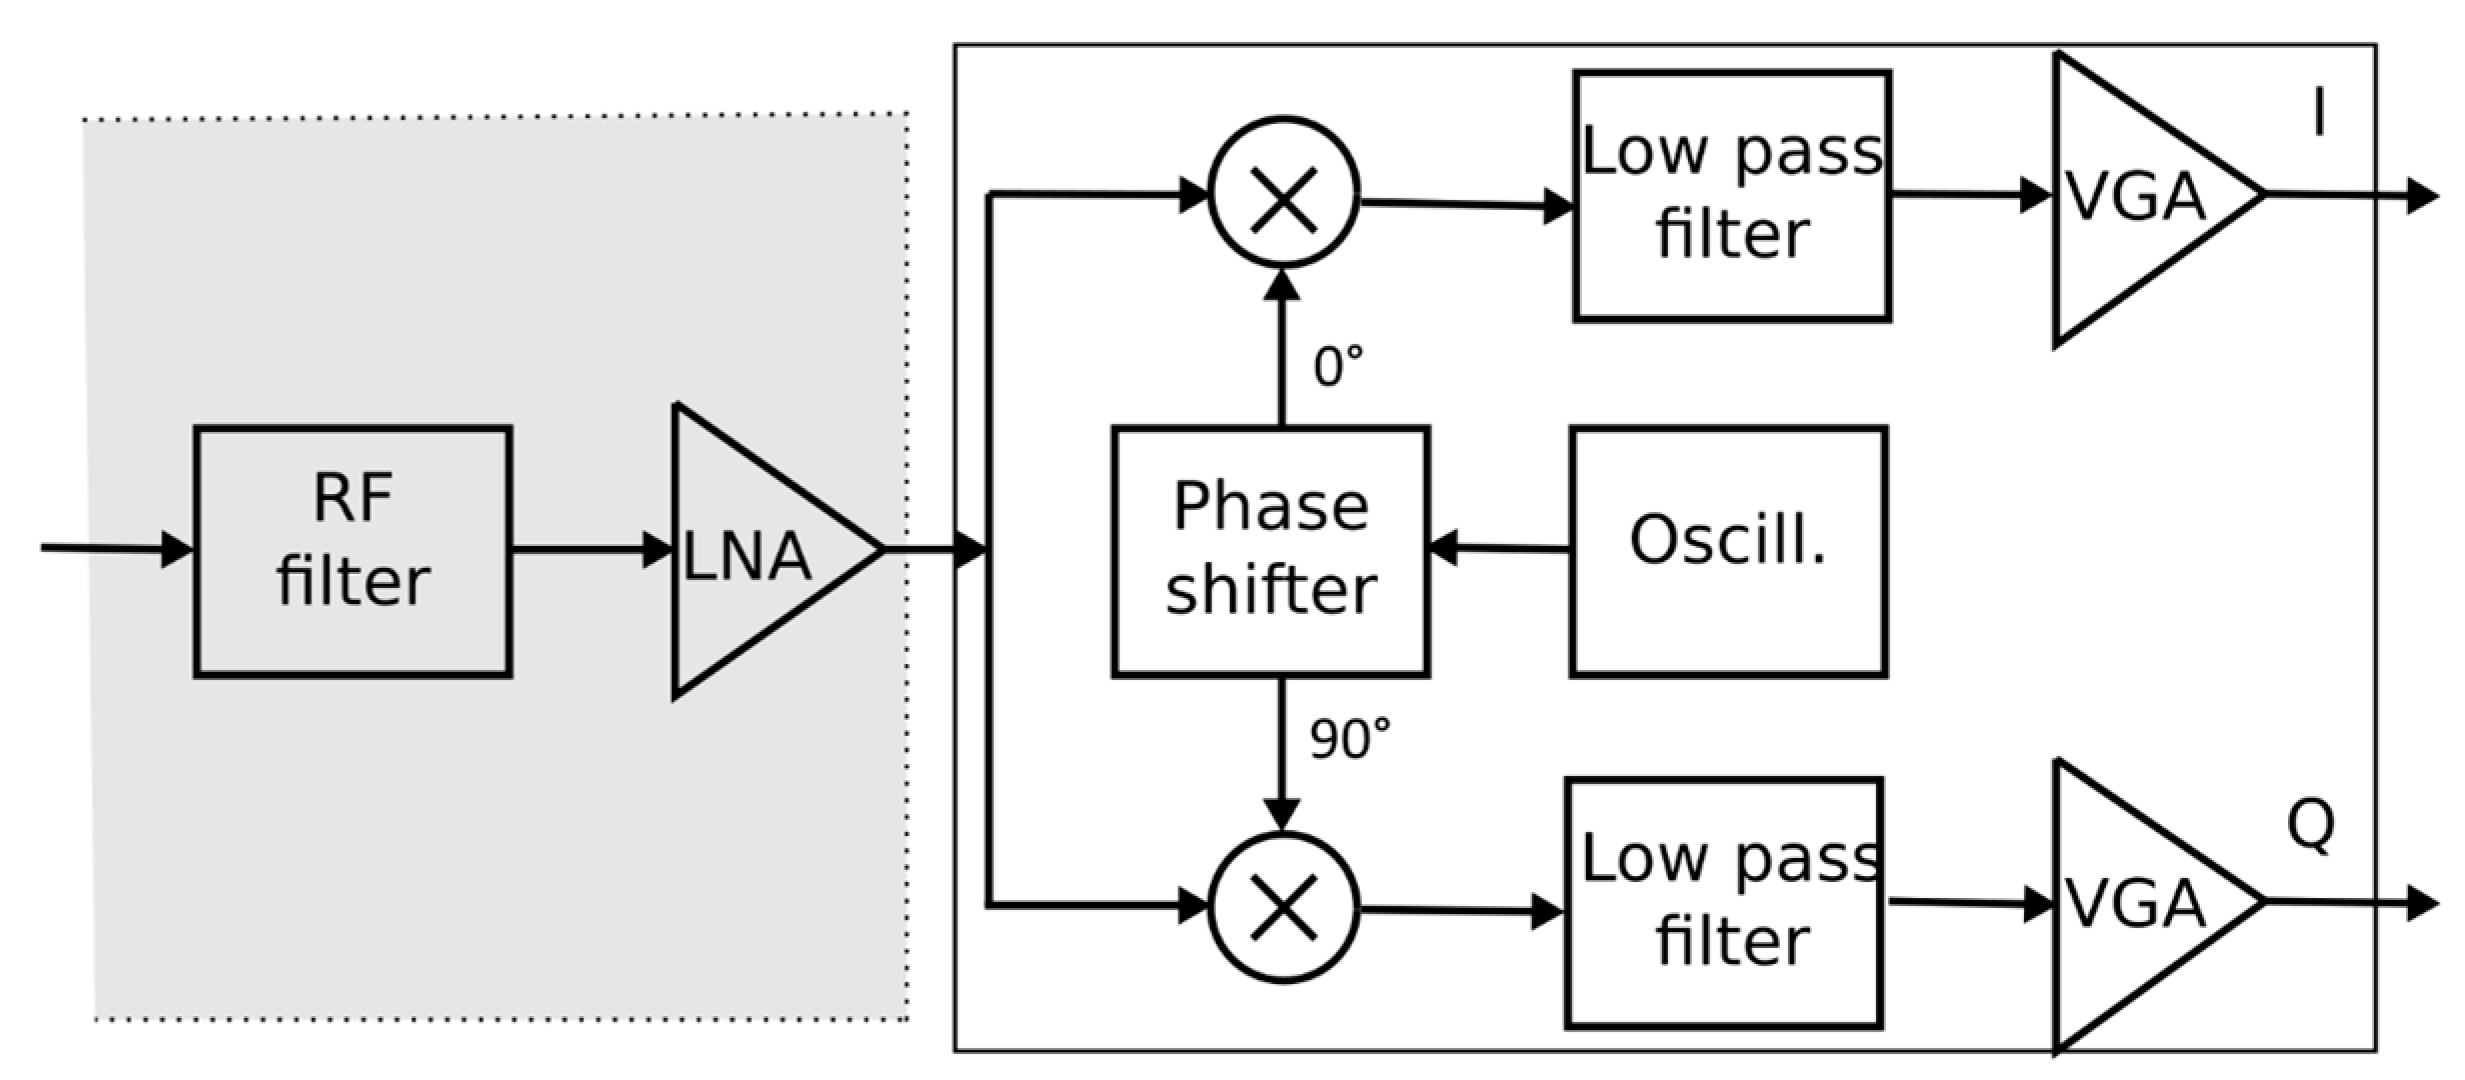
2.2. Receiver Hardware Concept
- Need of the high-speed analog-to-digital converters;
- Cost of the high-performance FPGA;
- Software IP cores for FPGA for interfacing the ADC;
- Challenging design of high selectivity wideband radio frequency (RF) filters or intermediate frequency (IF) filters.
- Problem with the semiconductor noise 1/f.
- DC offsets, and an interference of the local oscillator that oscillates in the middle of the processing frequency band.
- Amplitude and phase unbalance that causes a crosstalk between upper and lower sidebands.
3. Implementation and Results
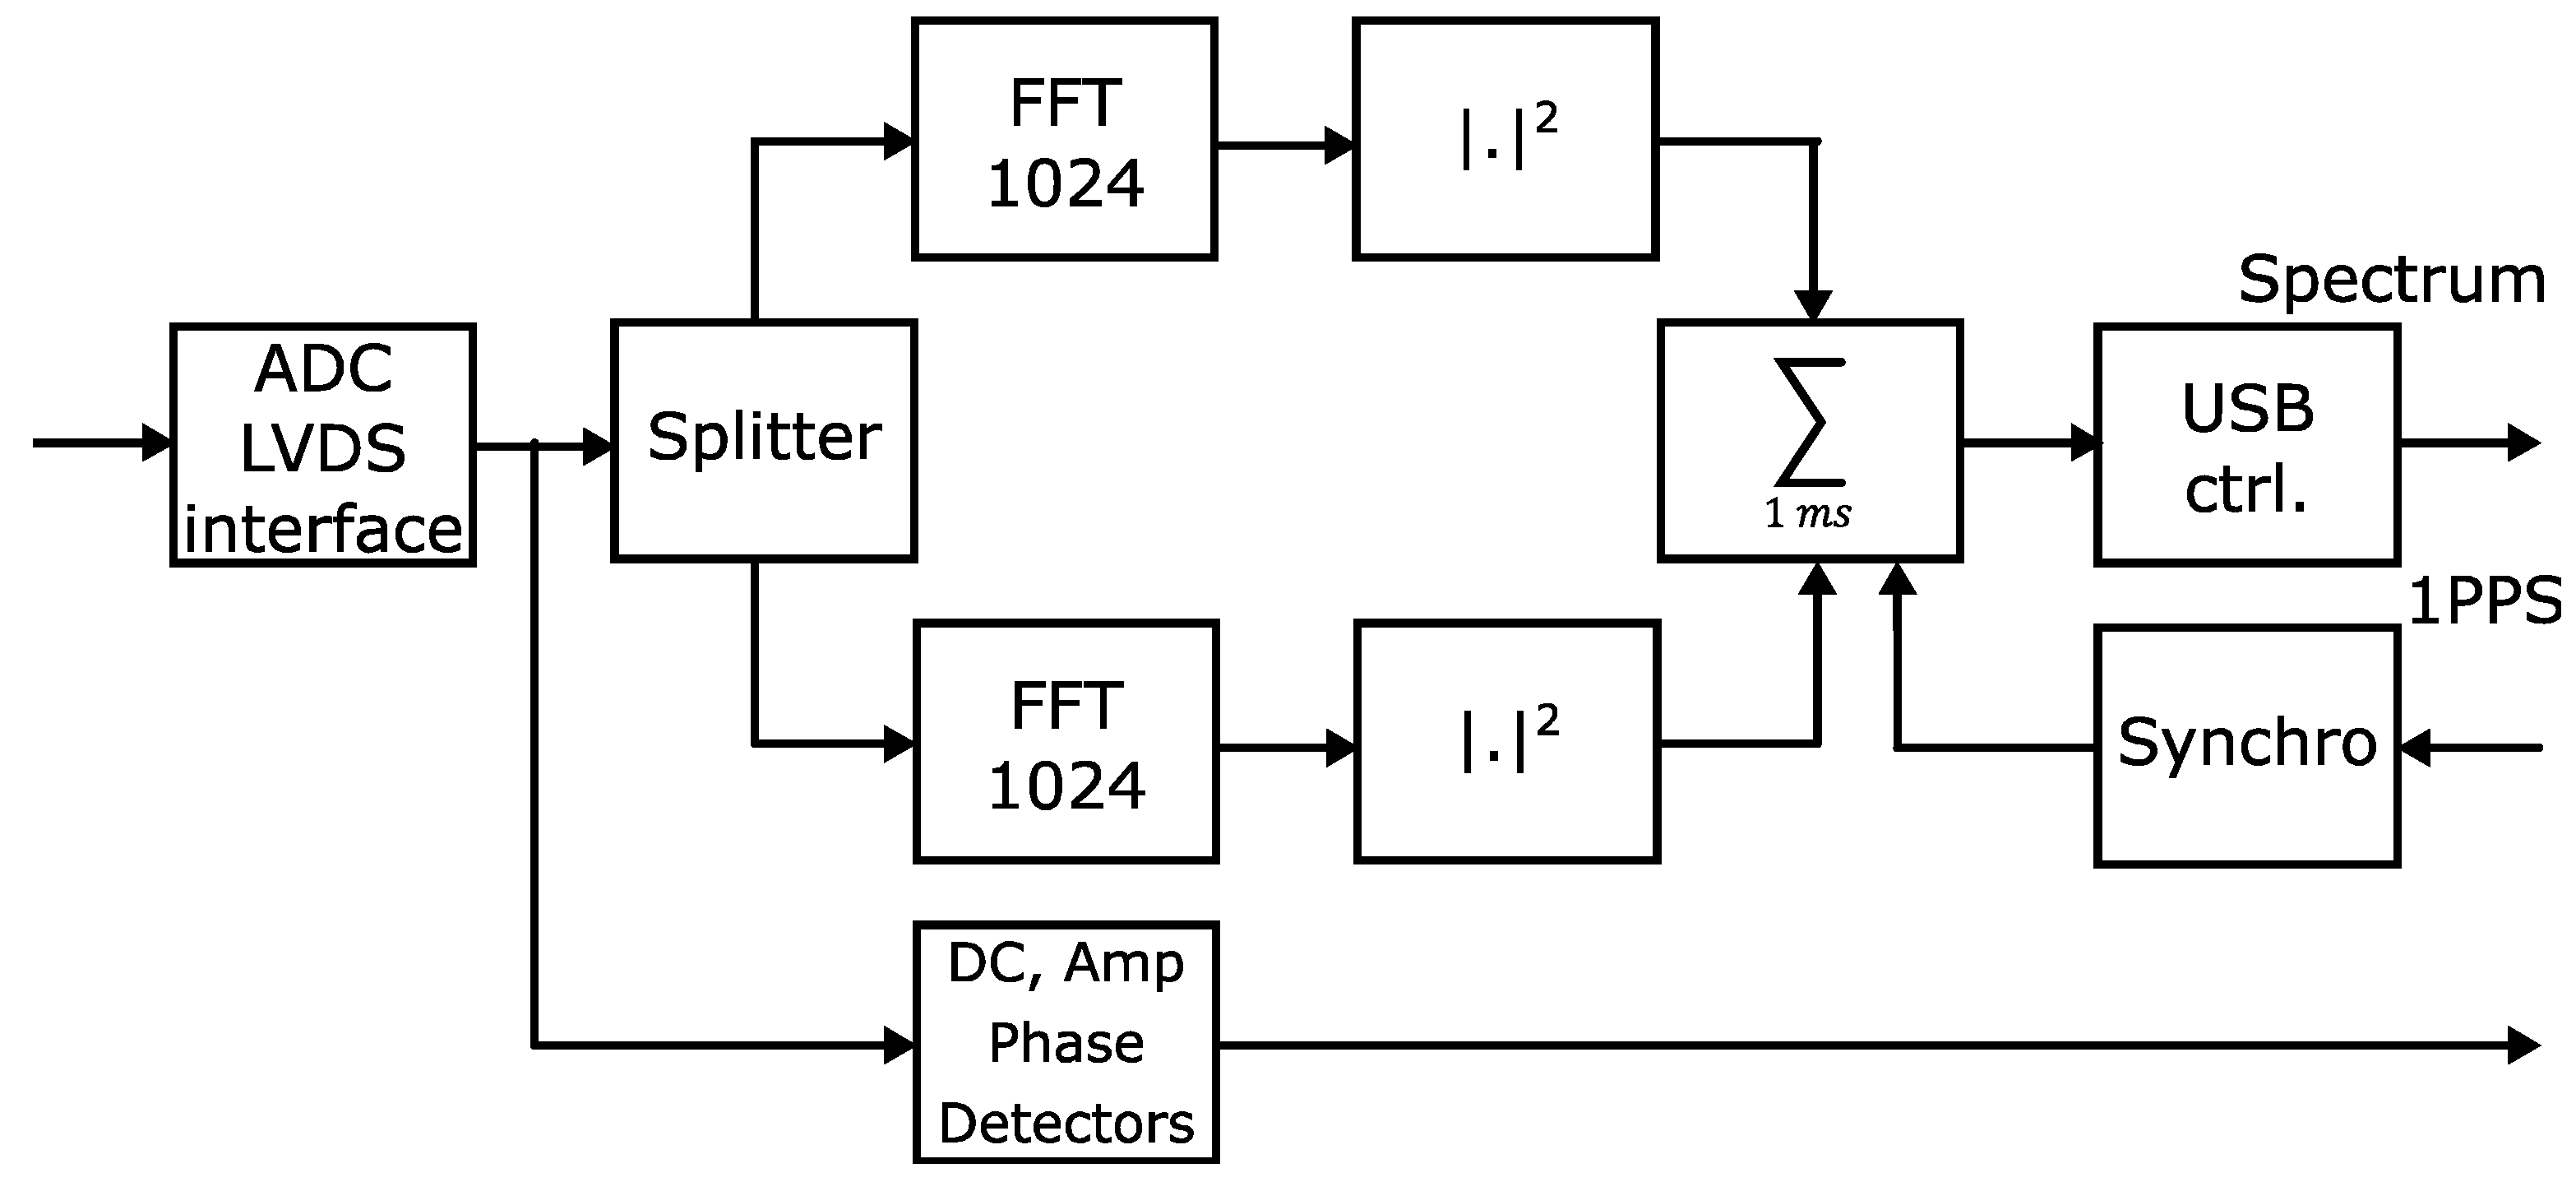
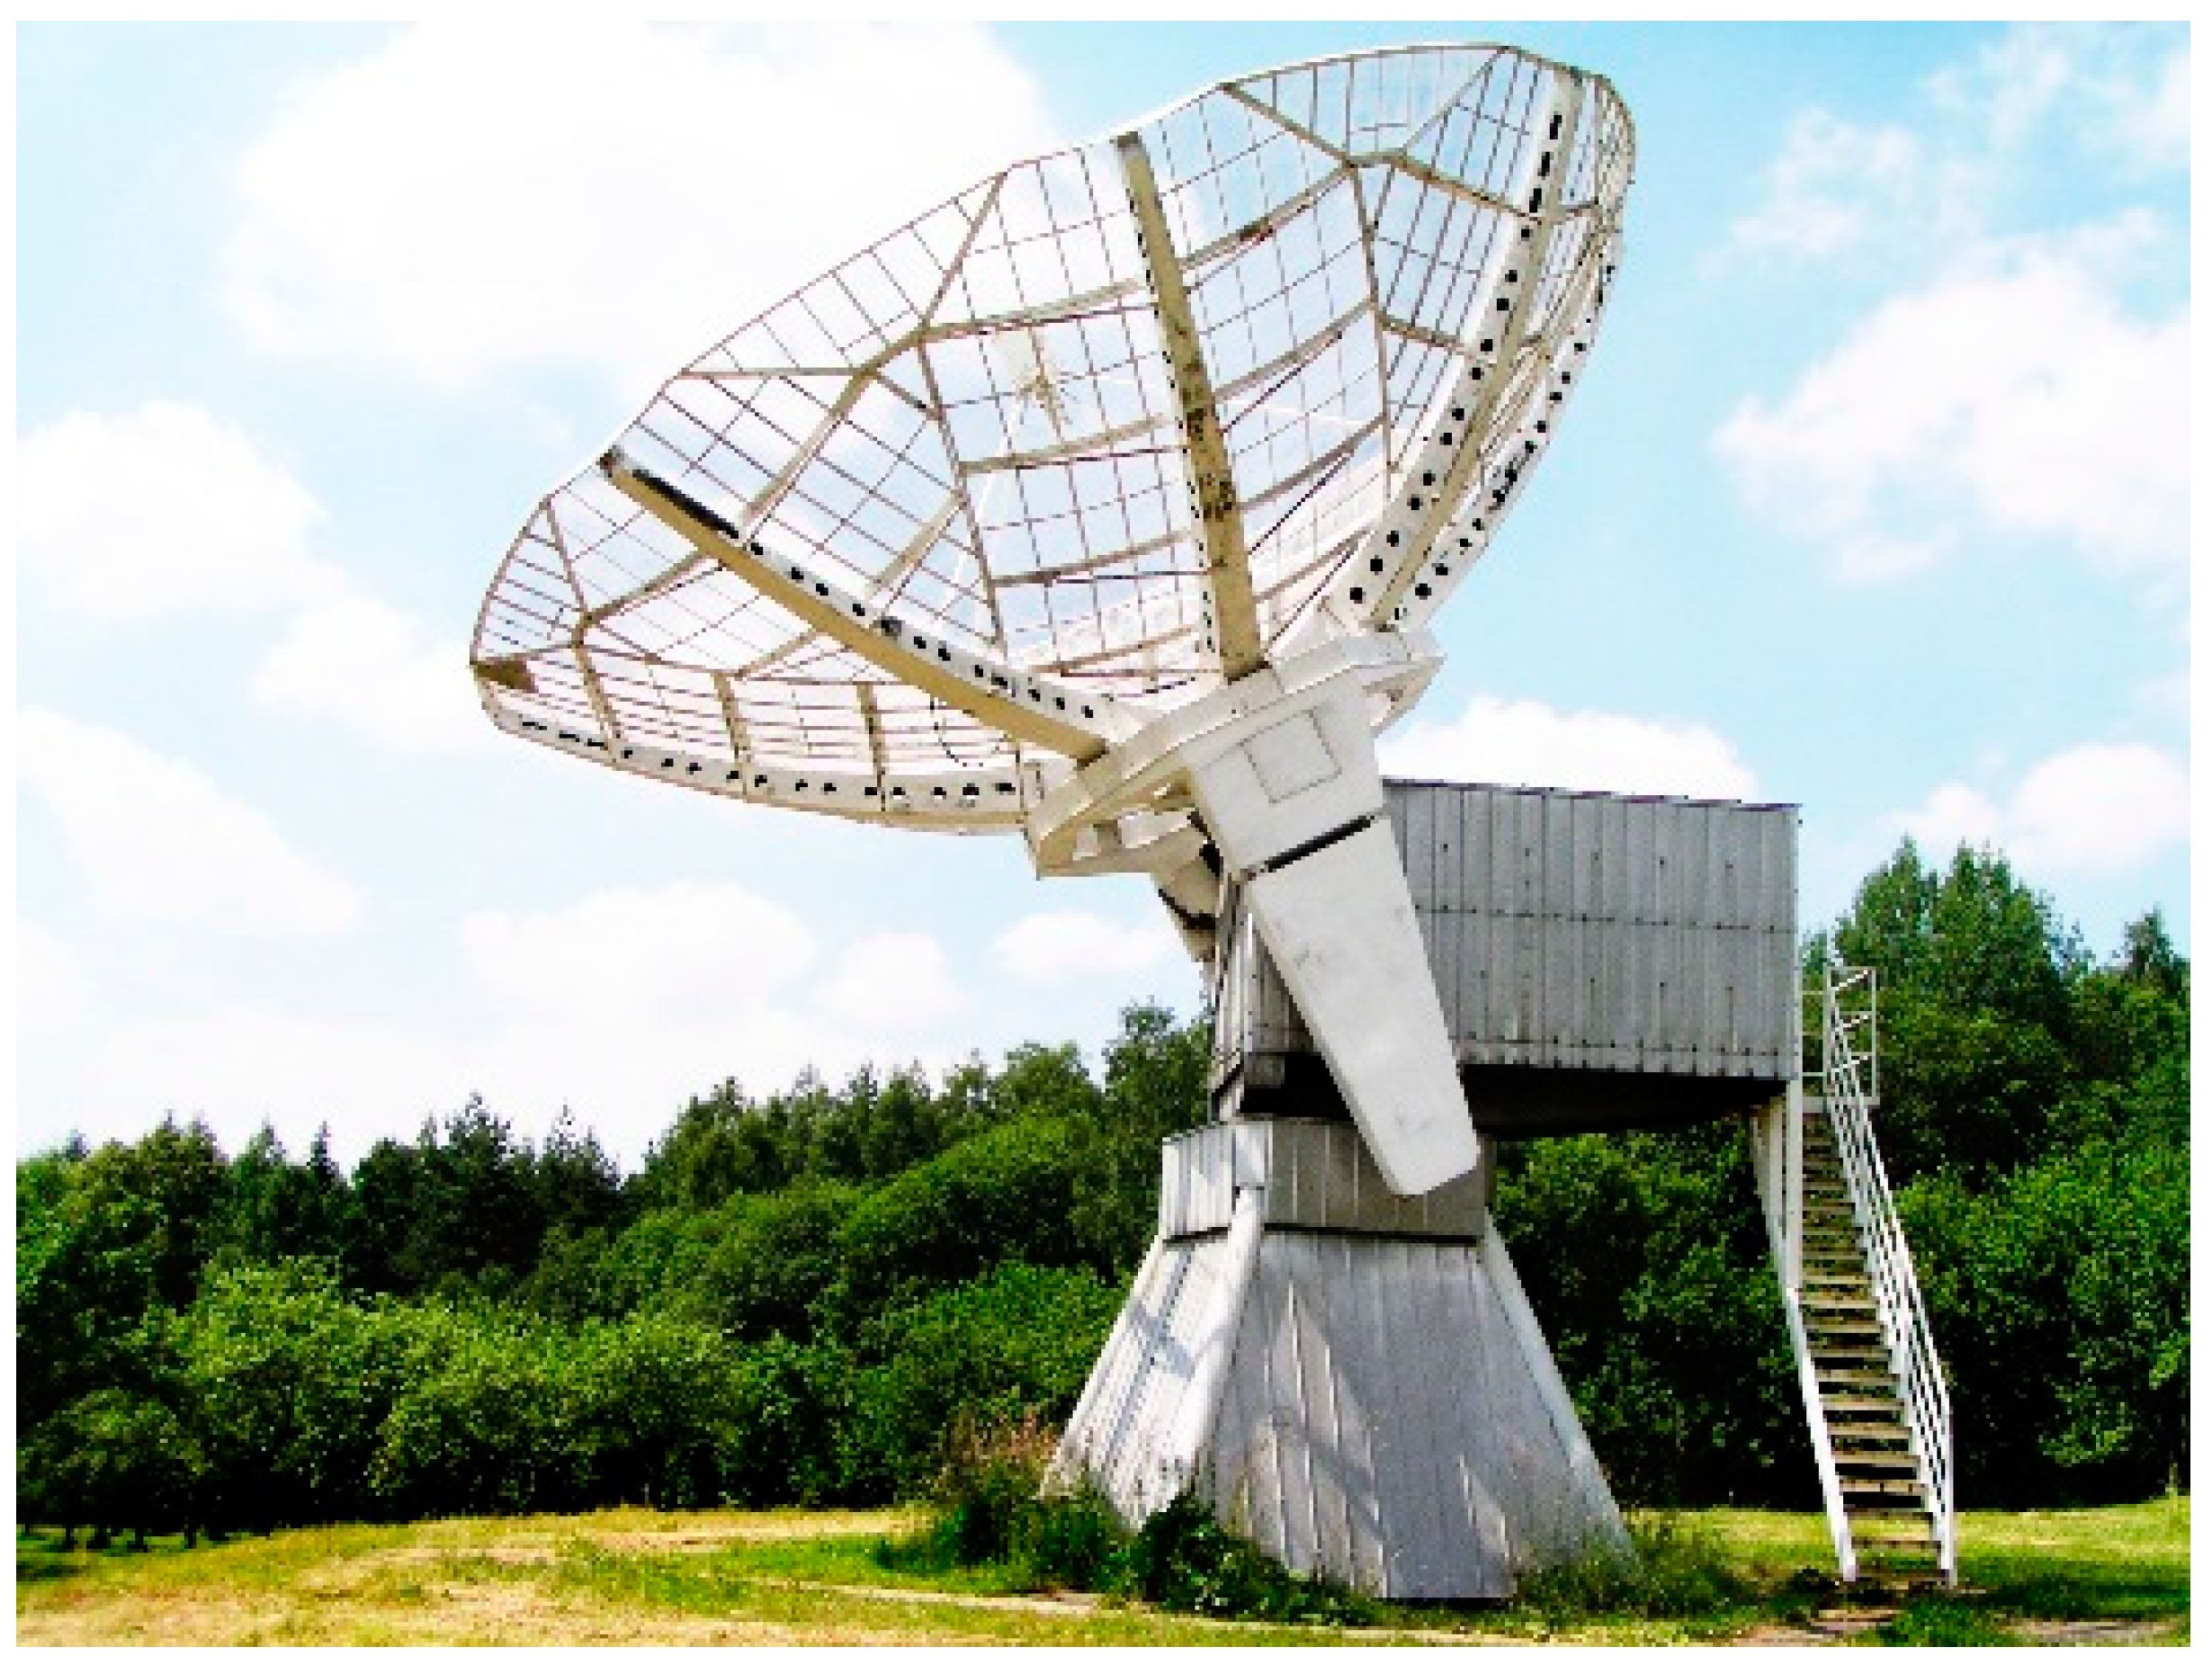
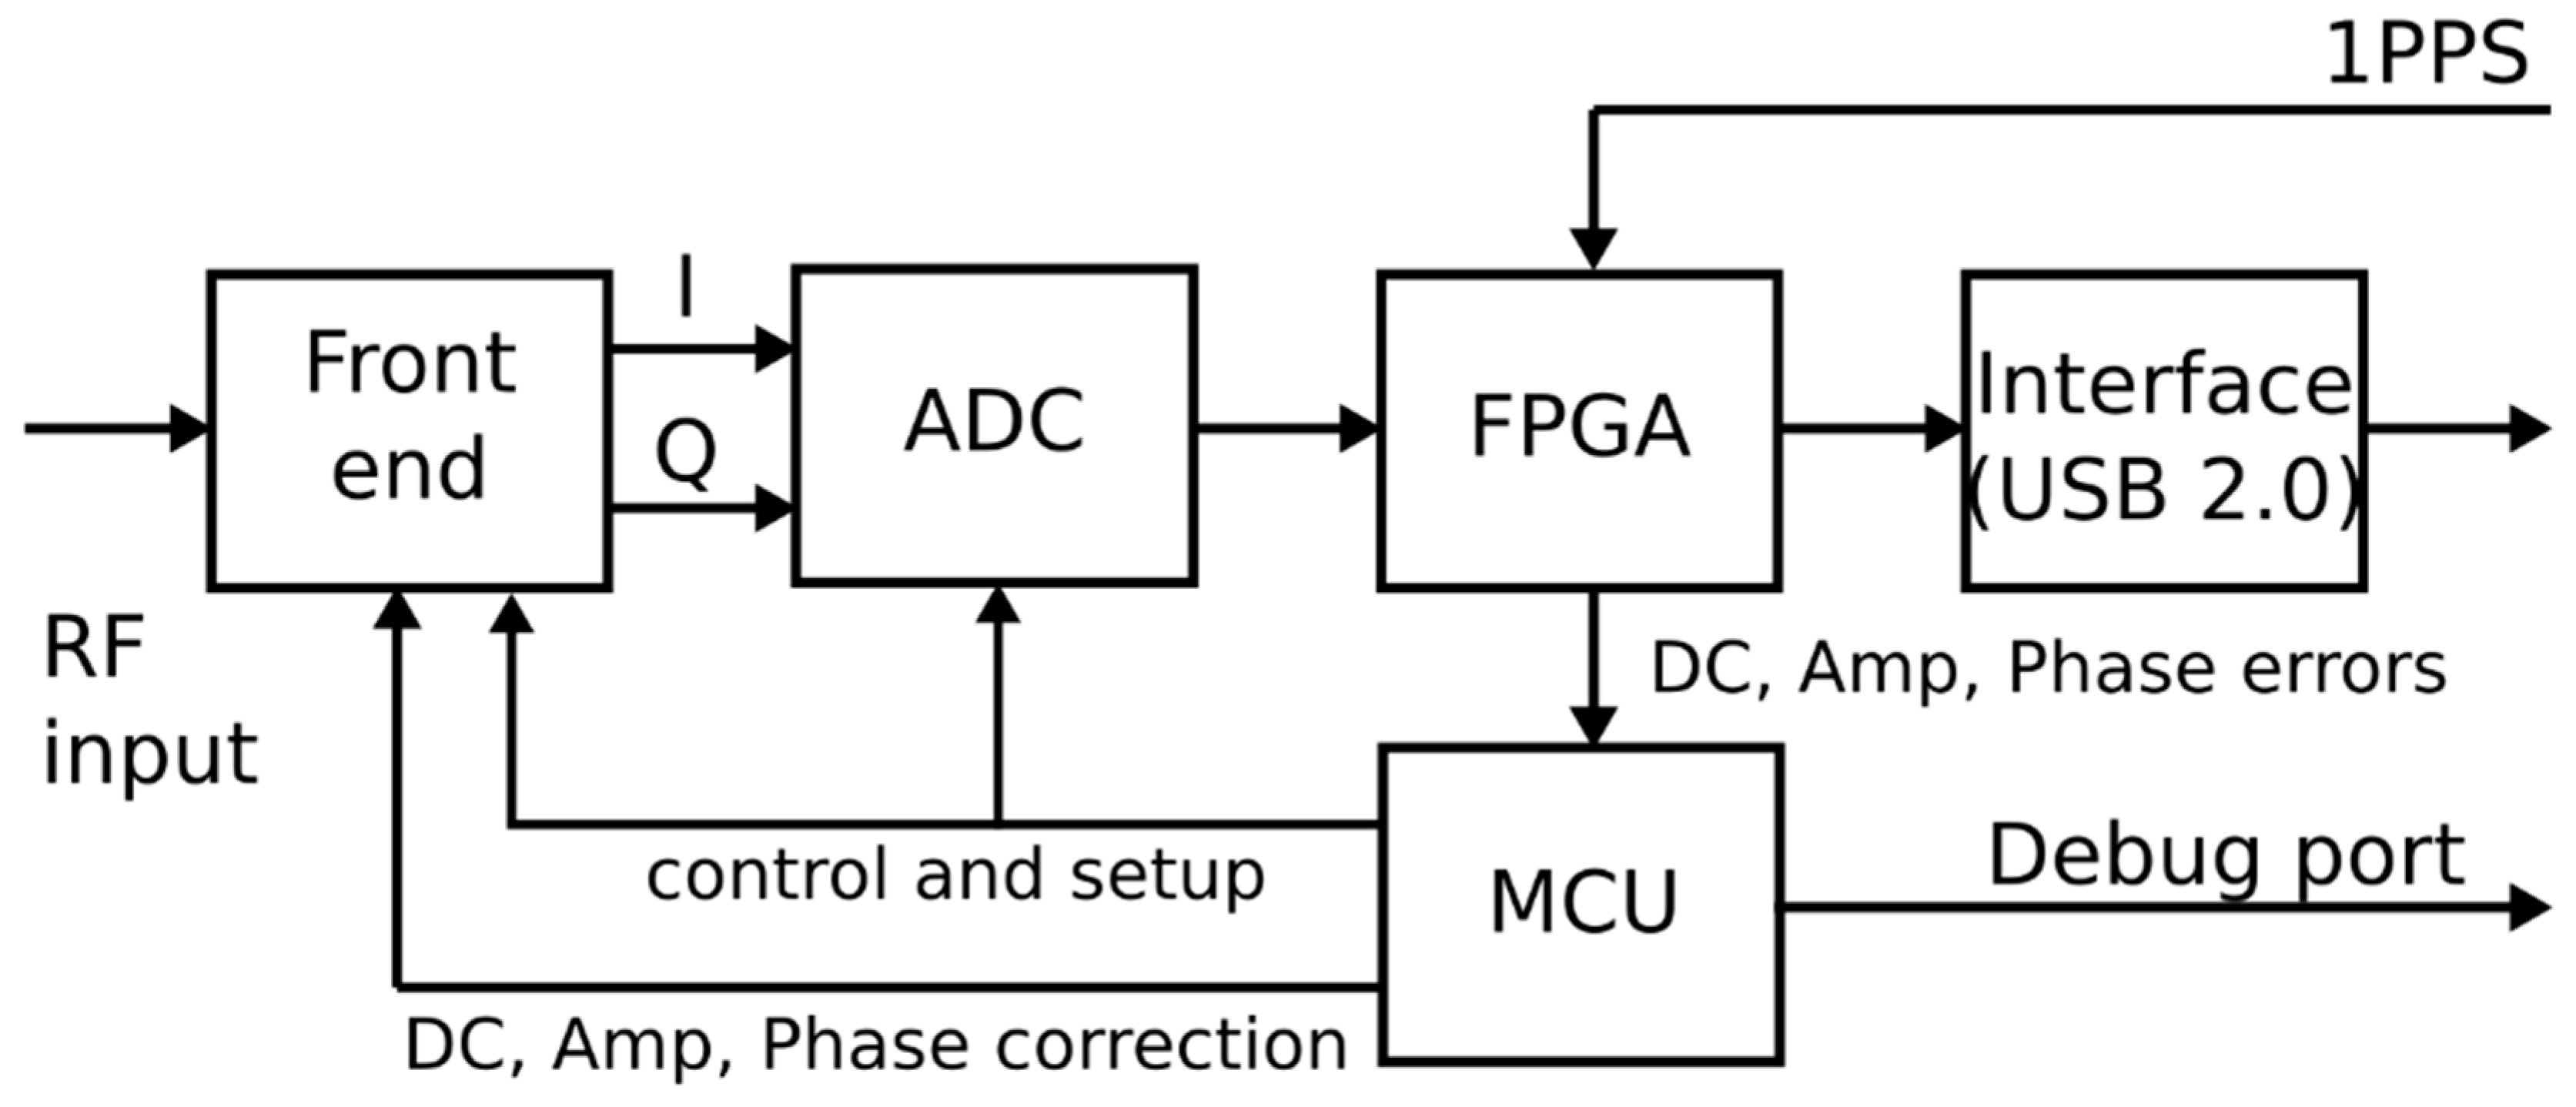
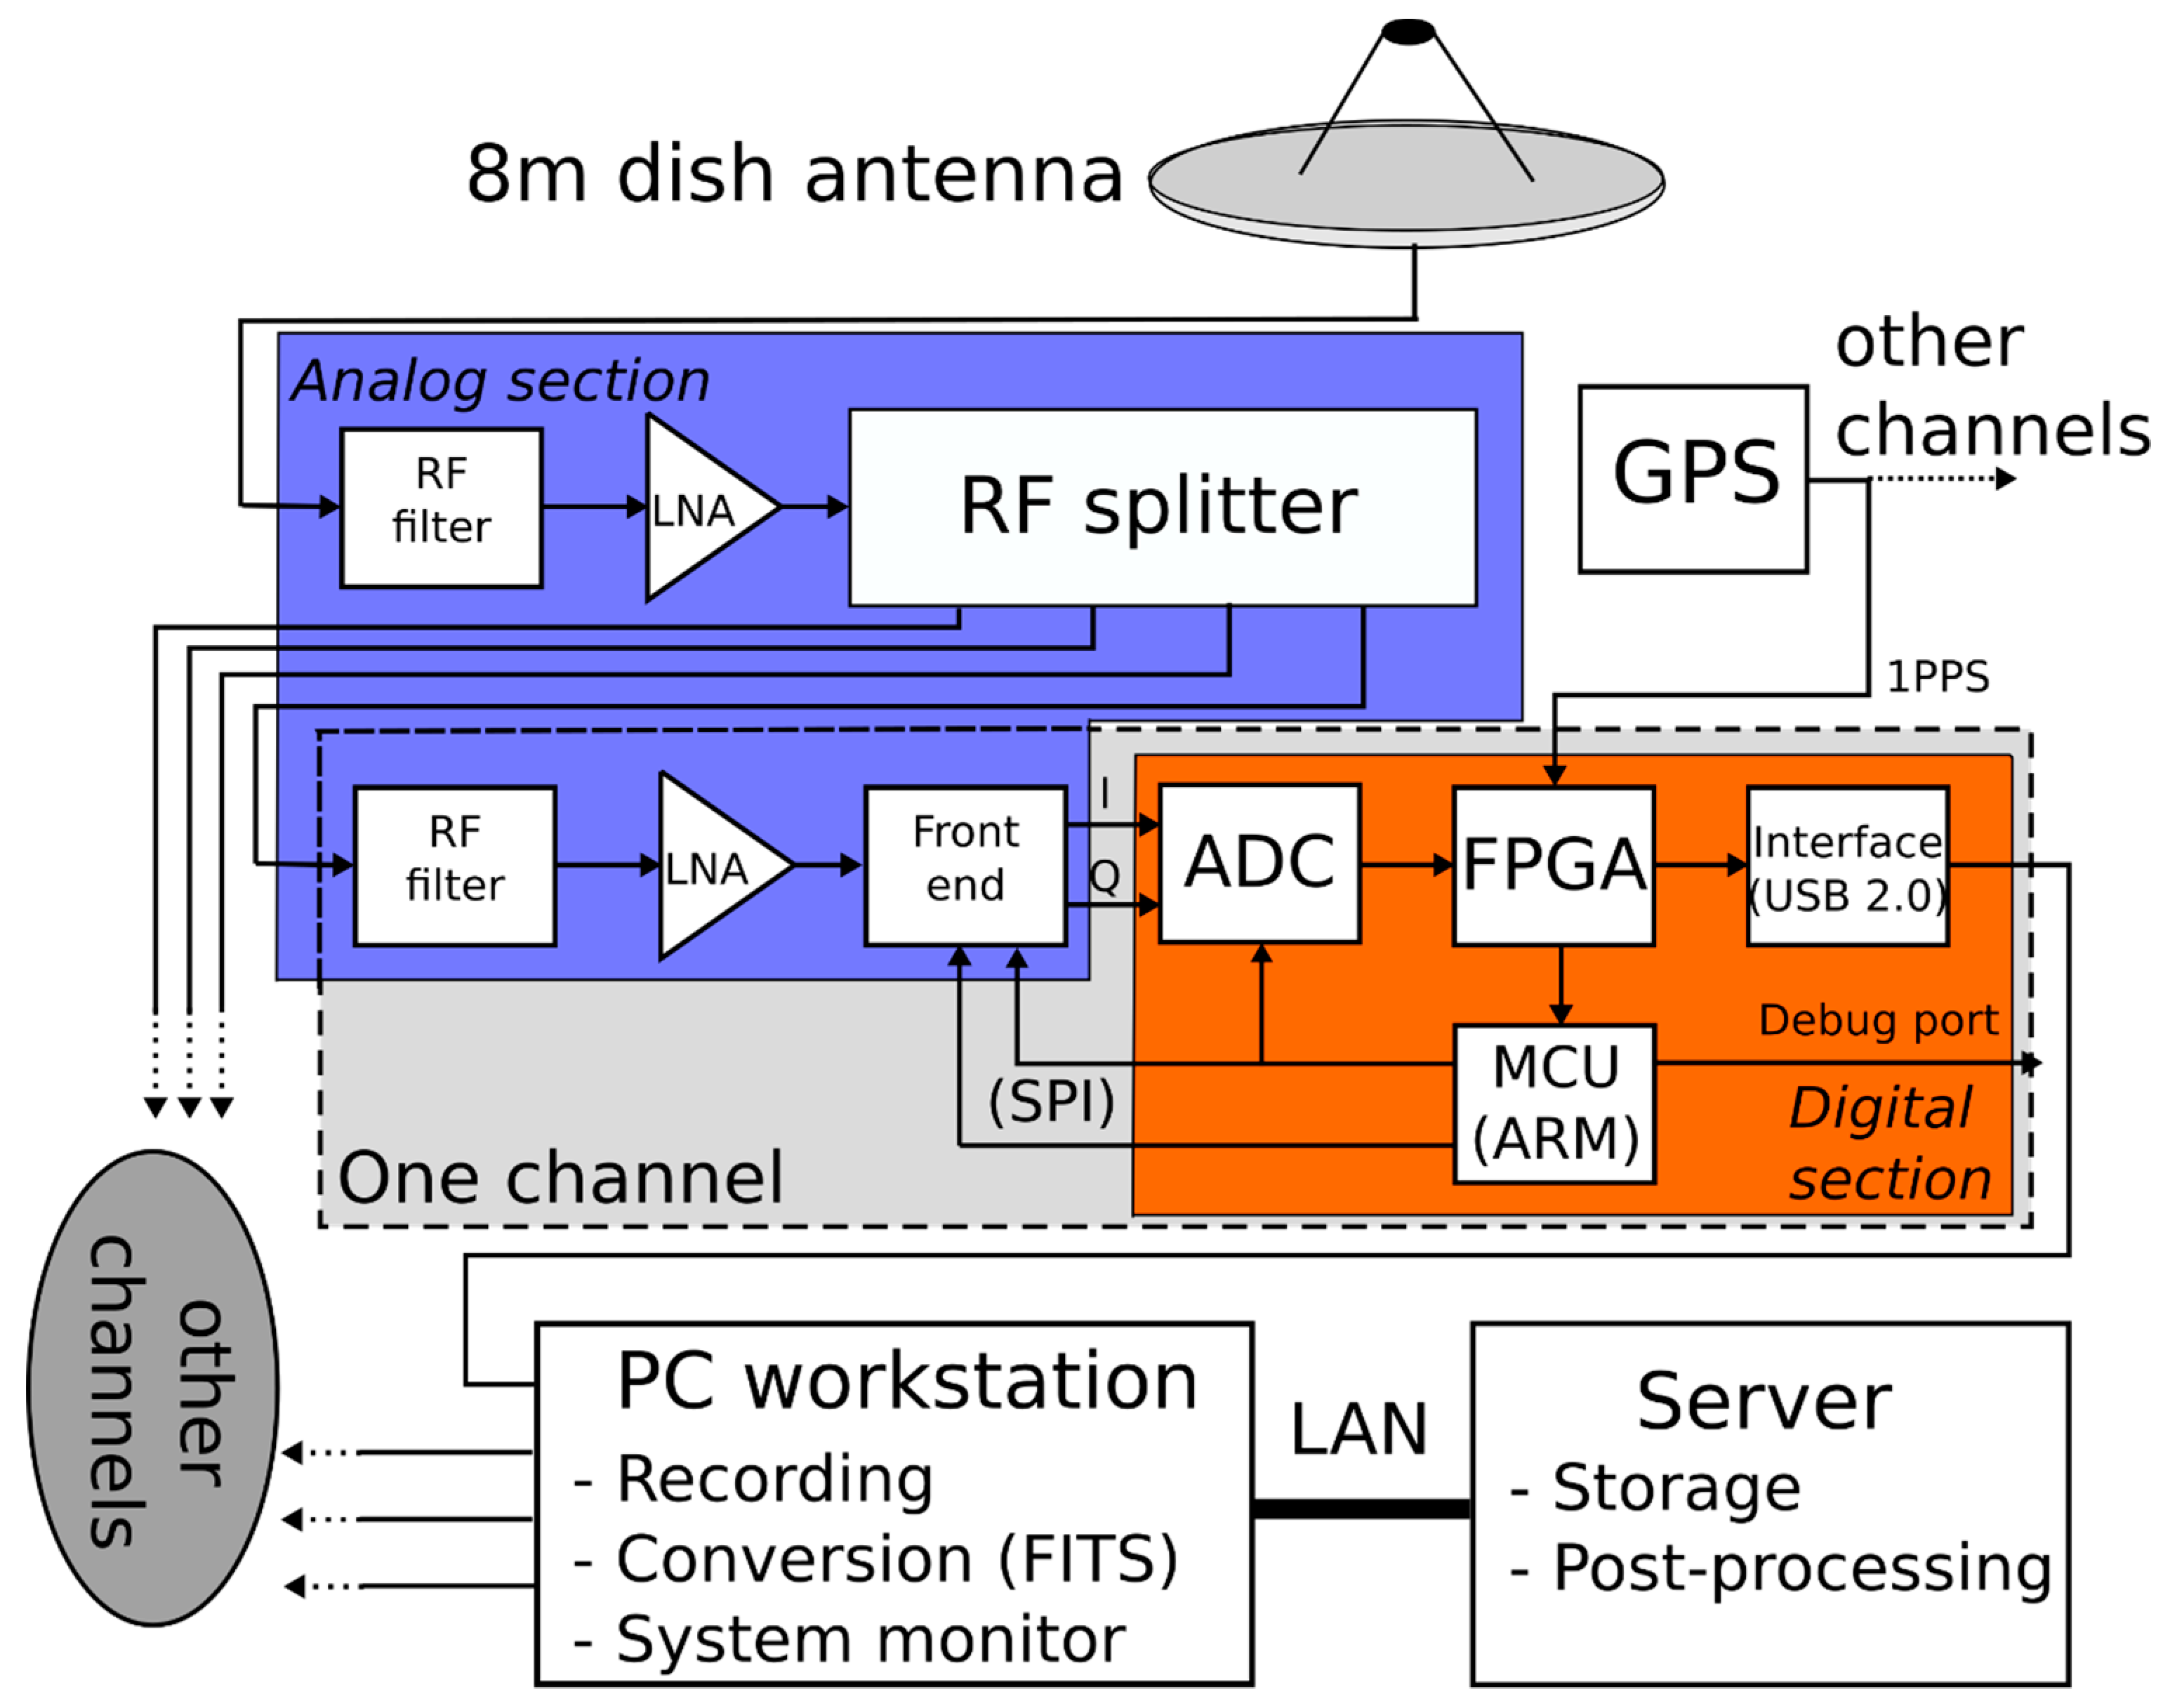
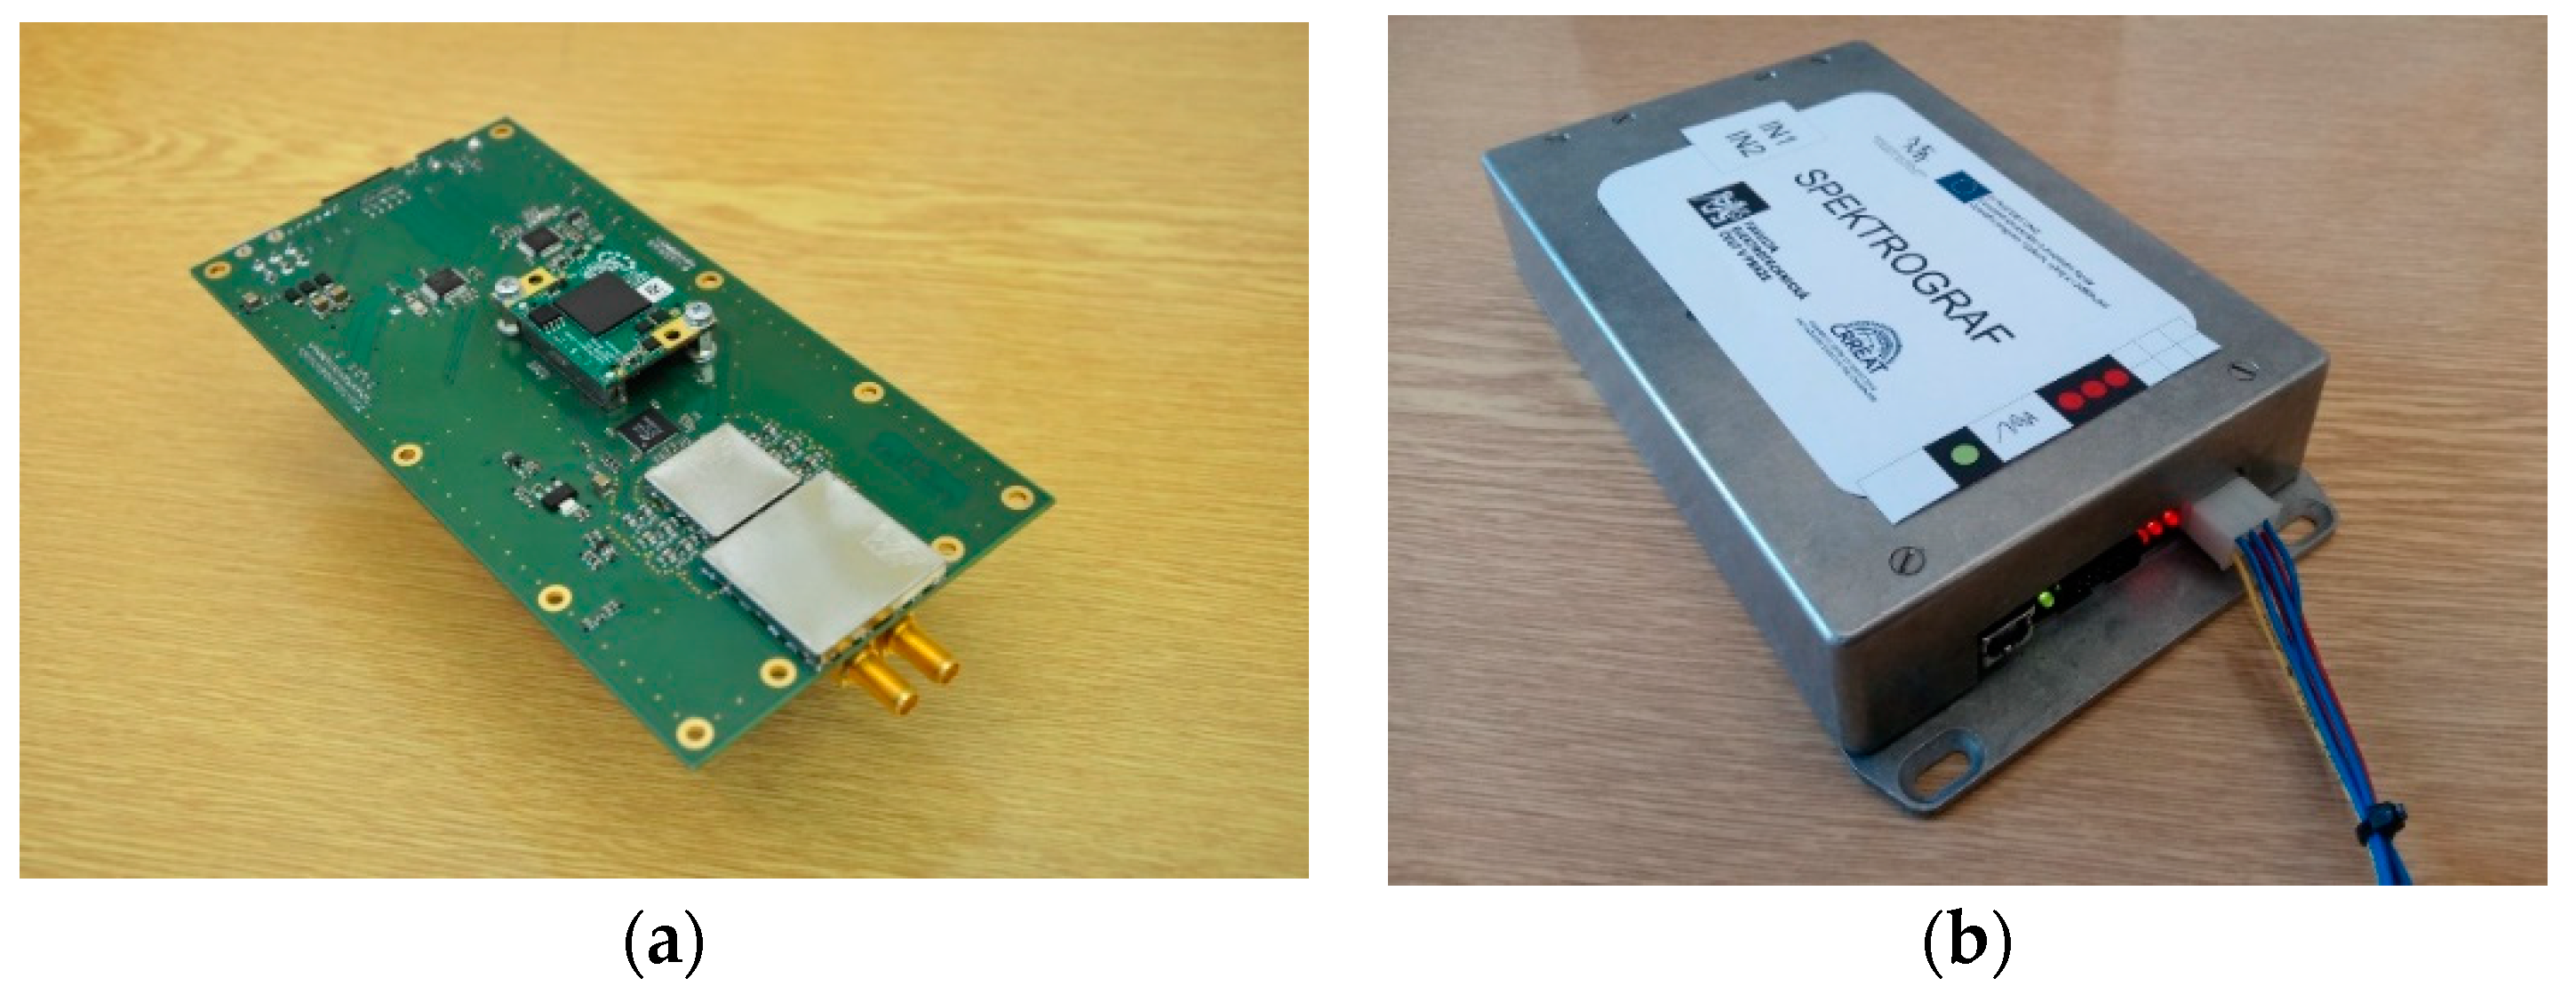
3.1. Spectrograph Hardware
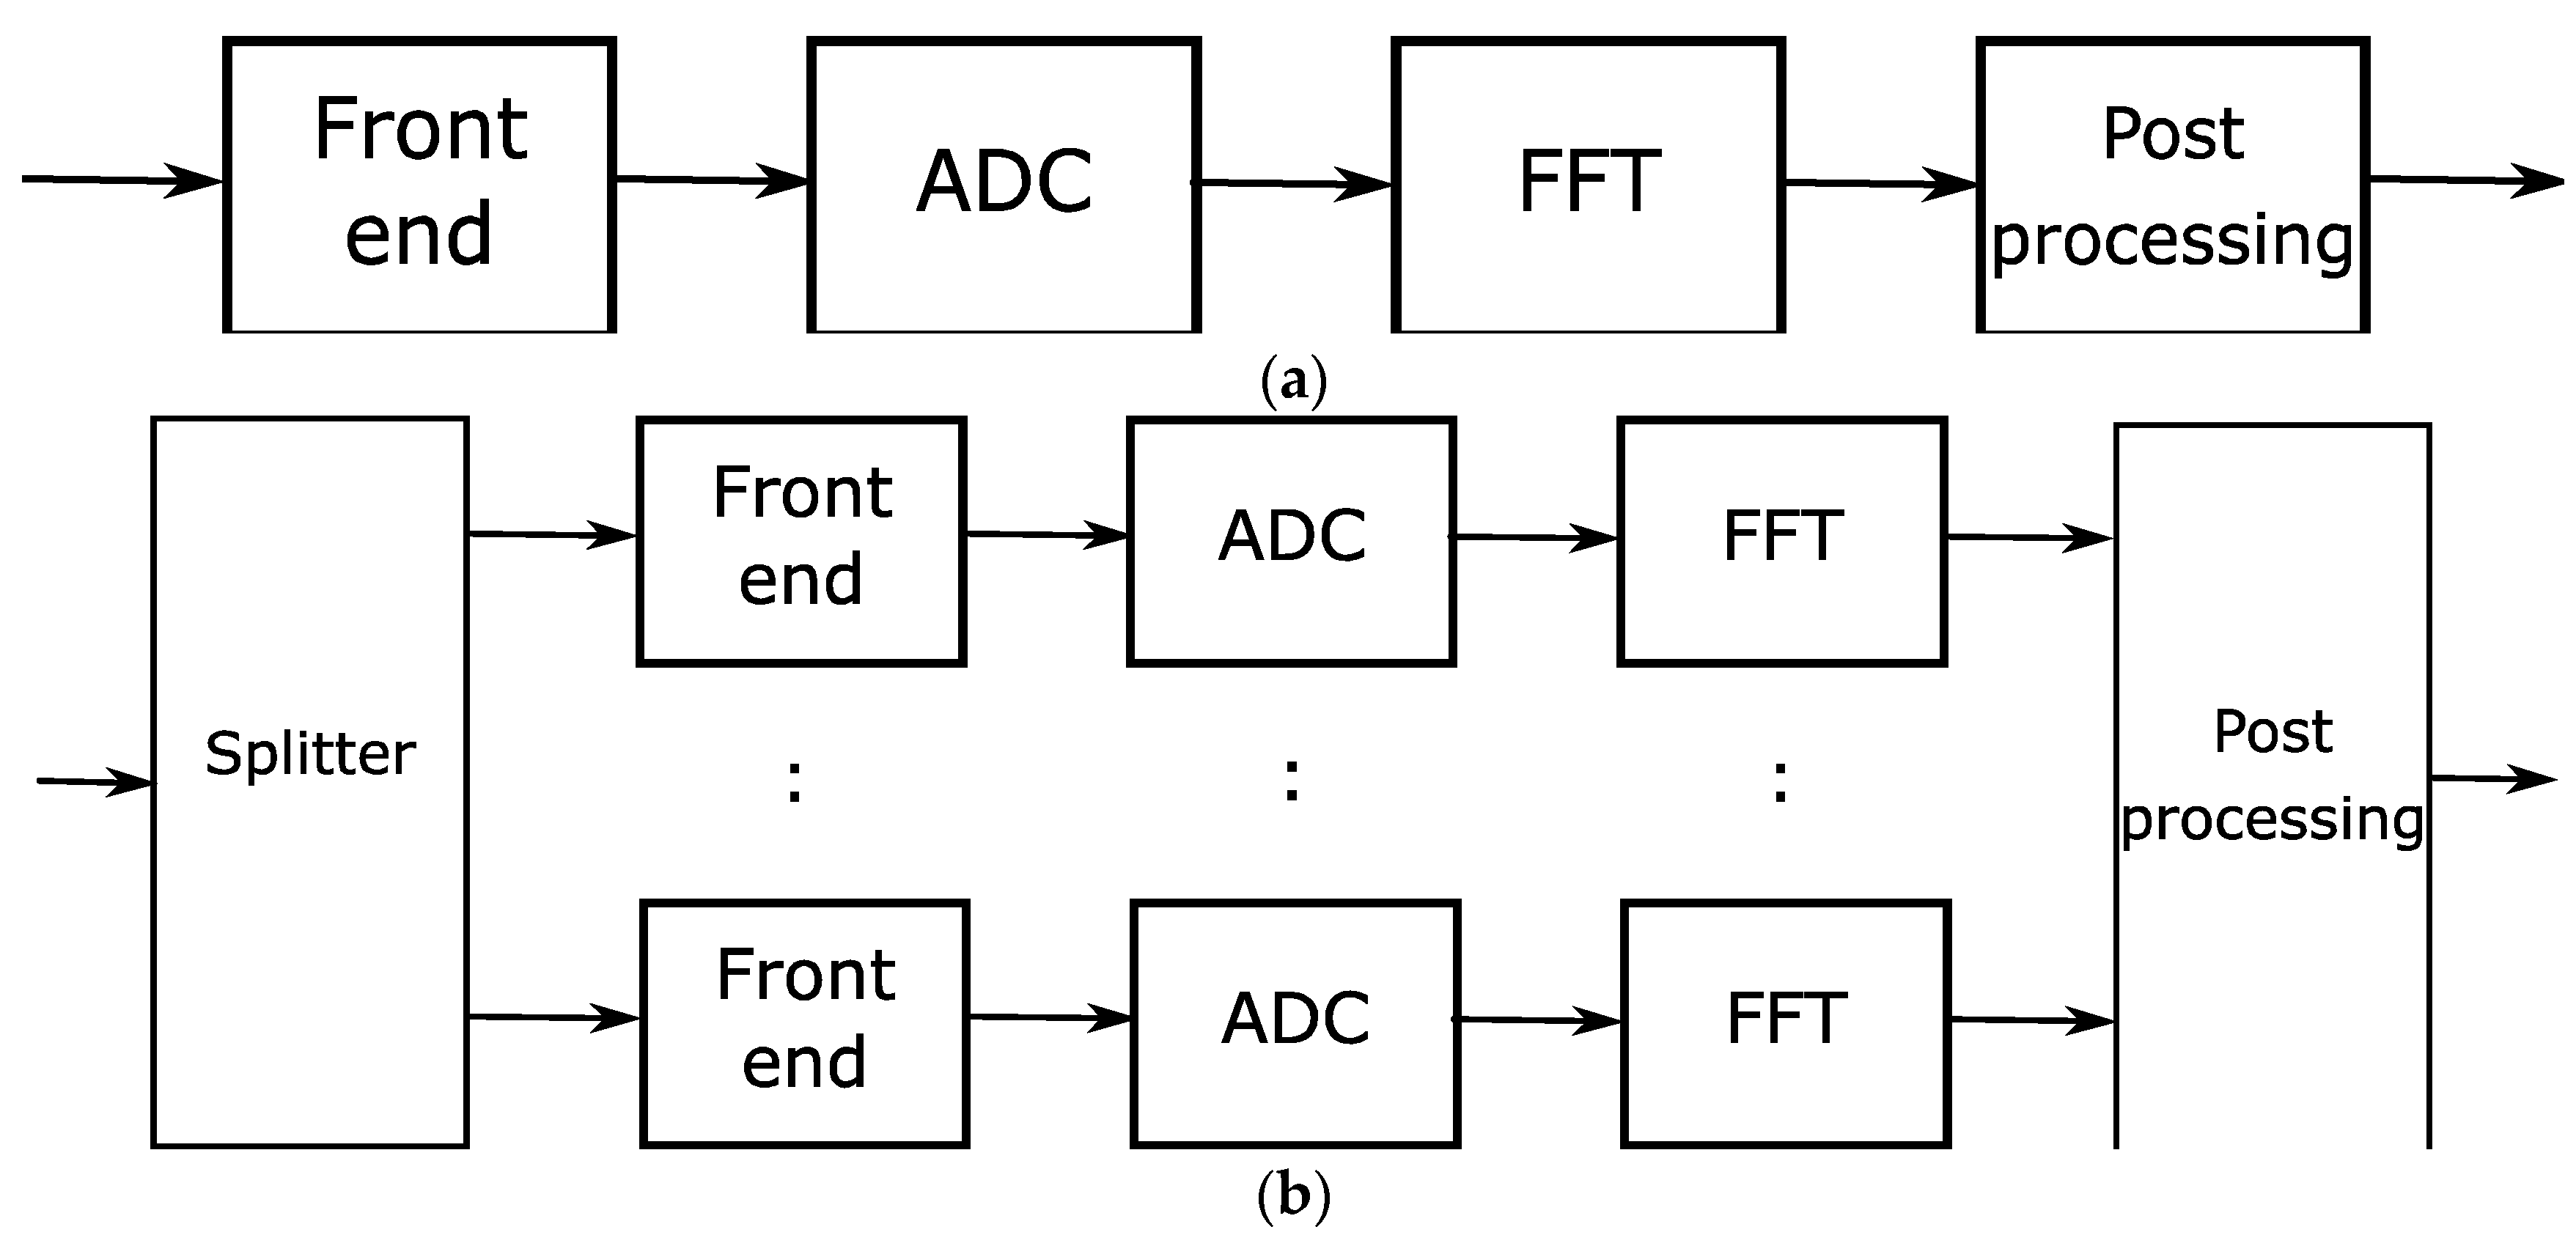
3.2. FPGA Signal Processor Content
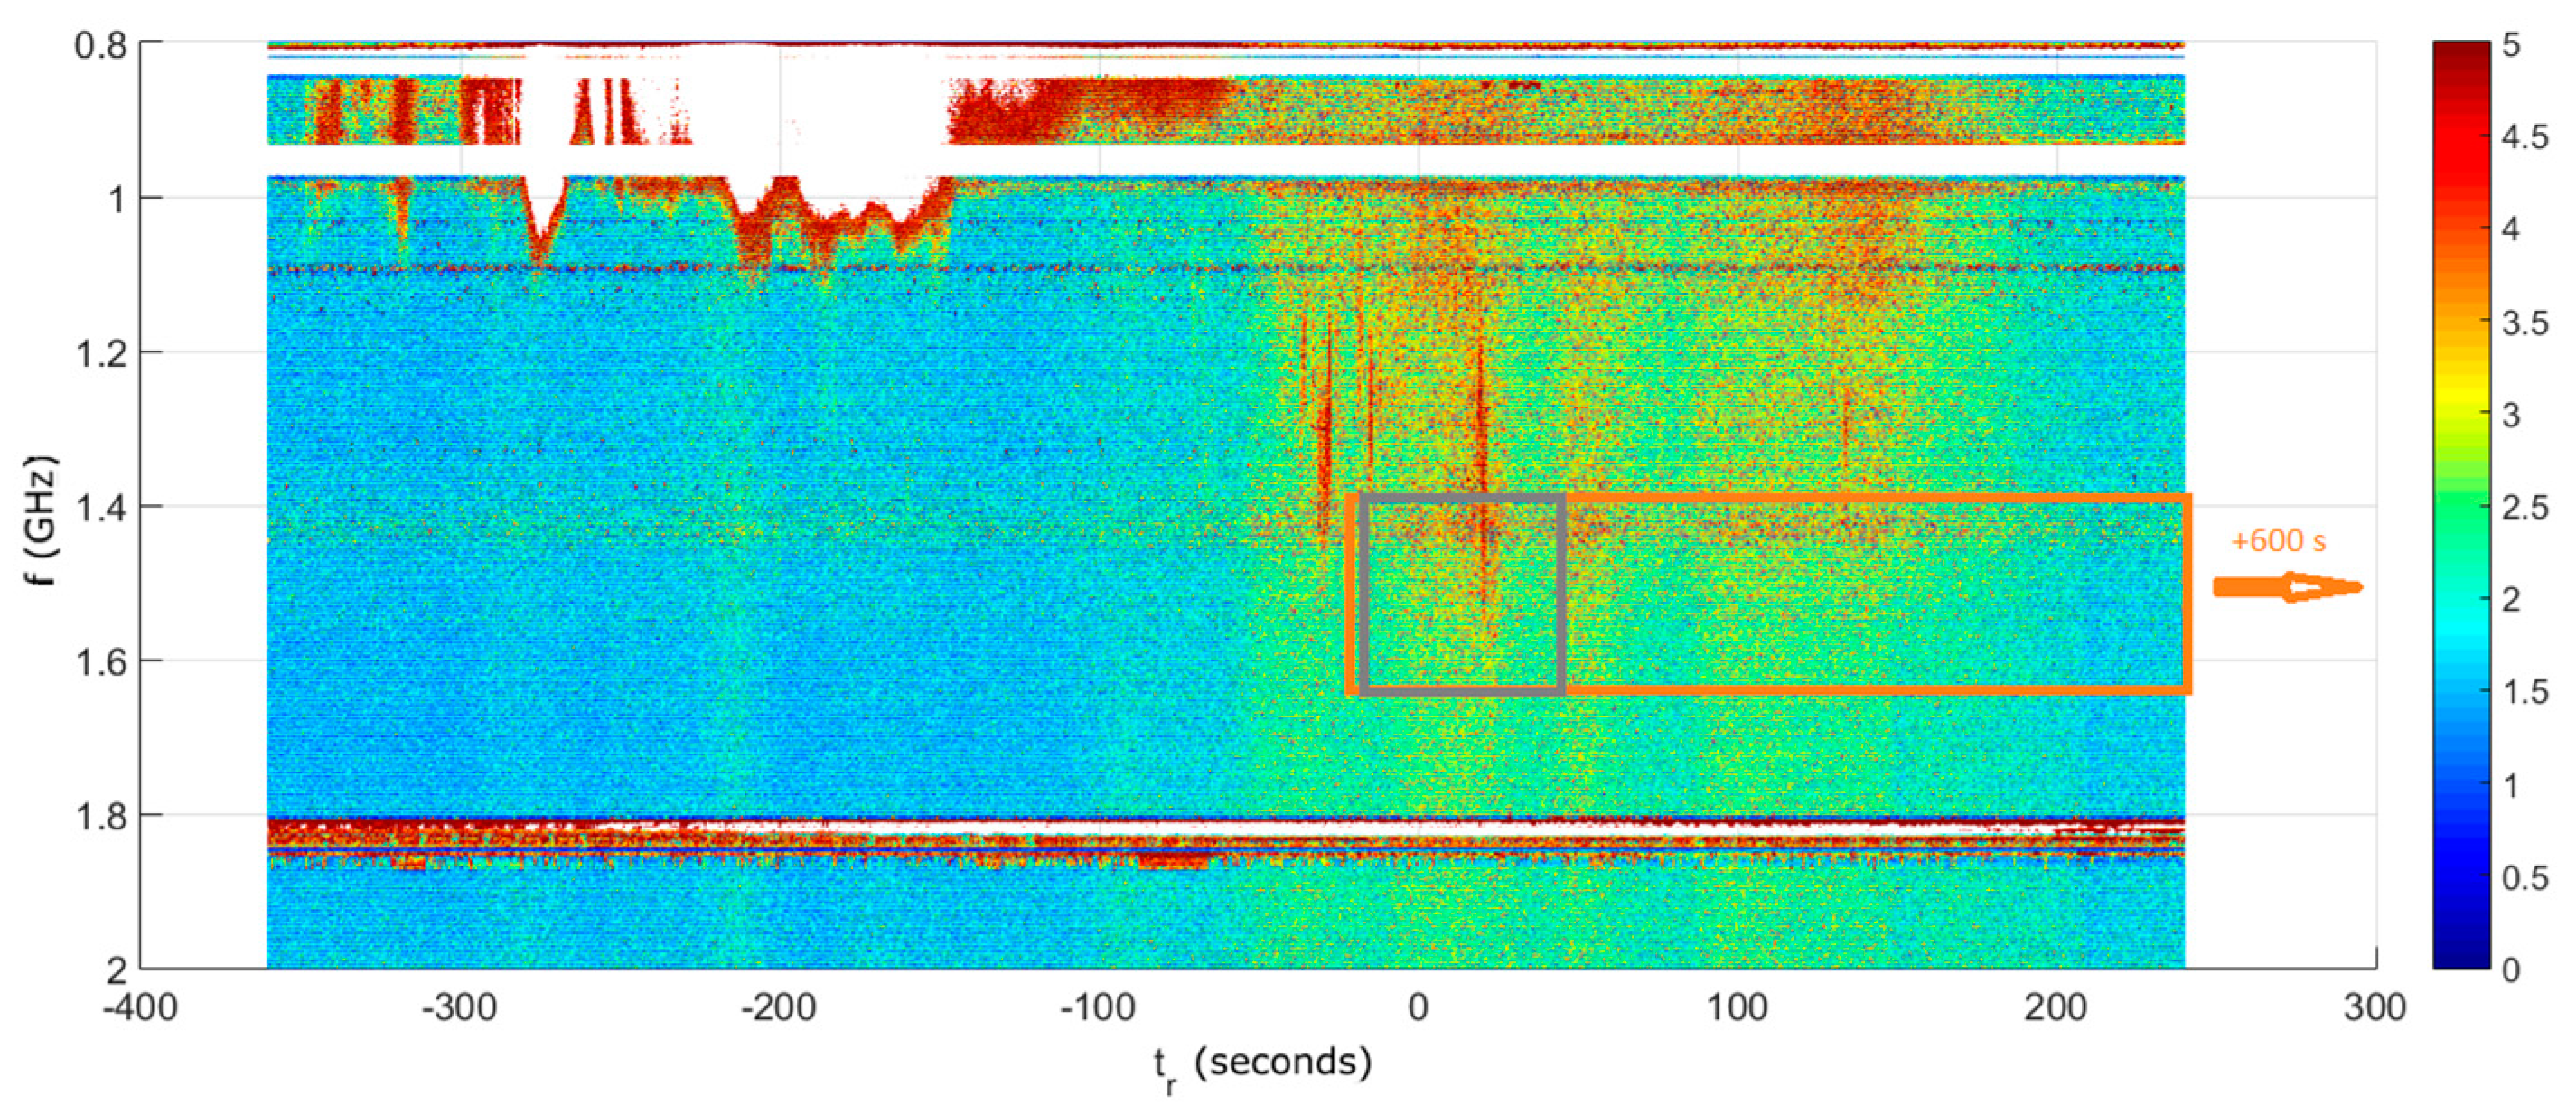
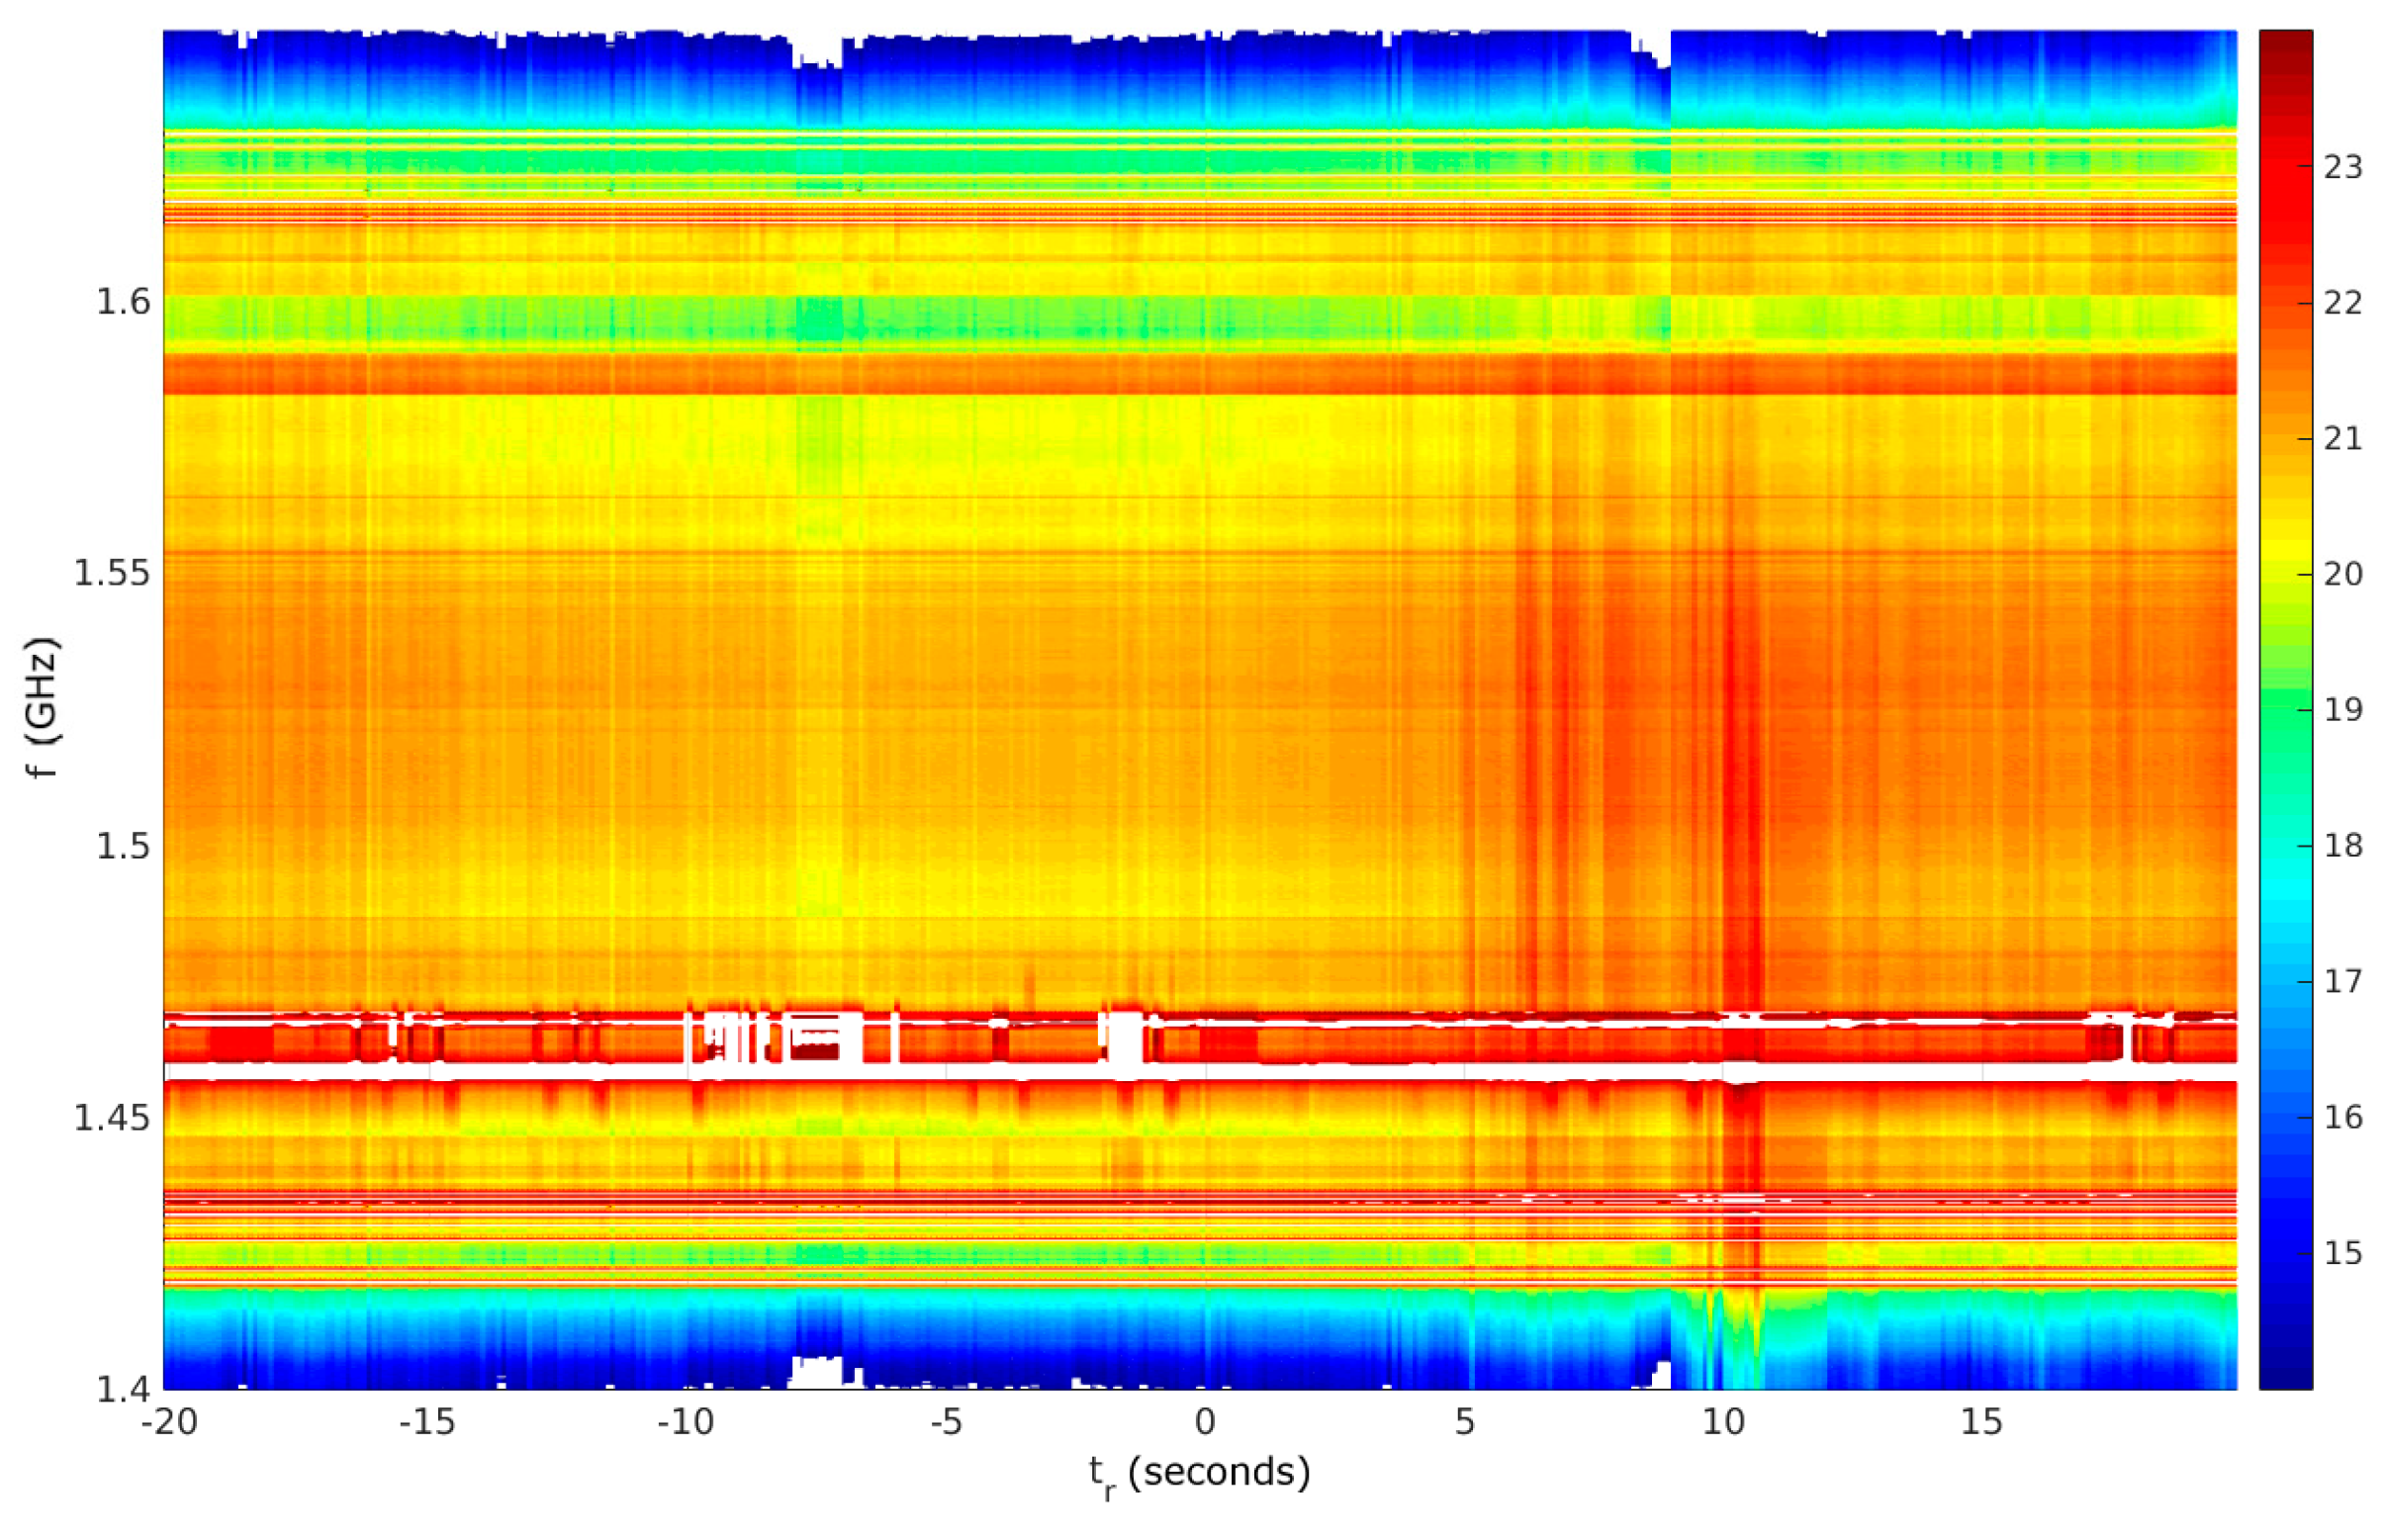
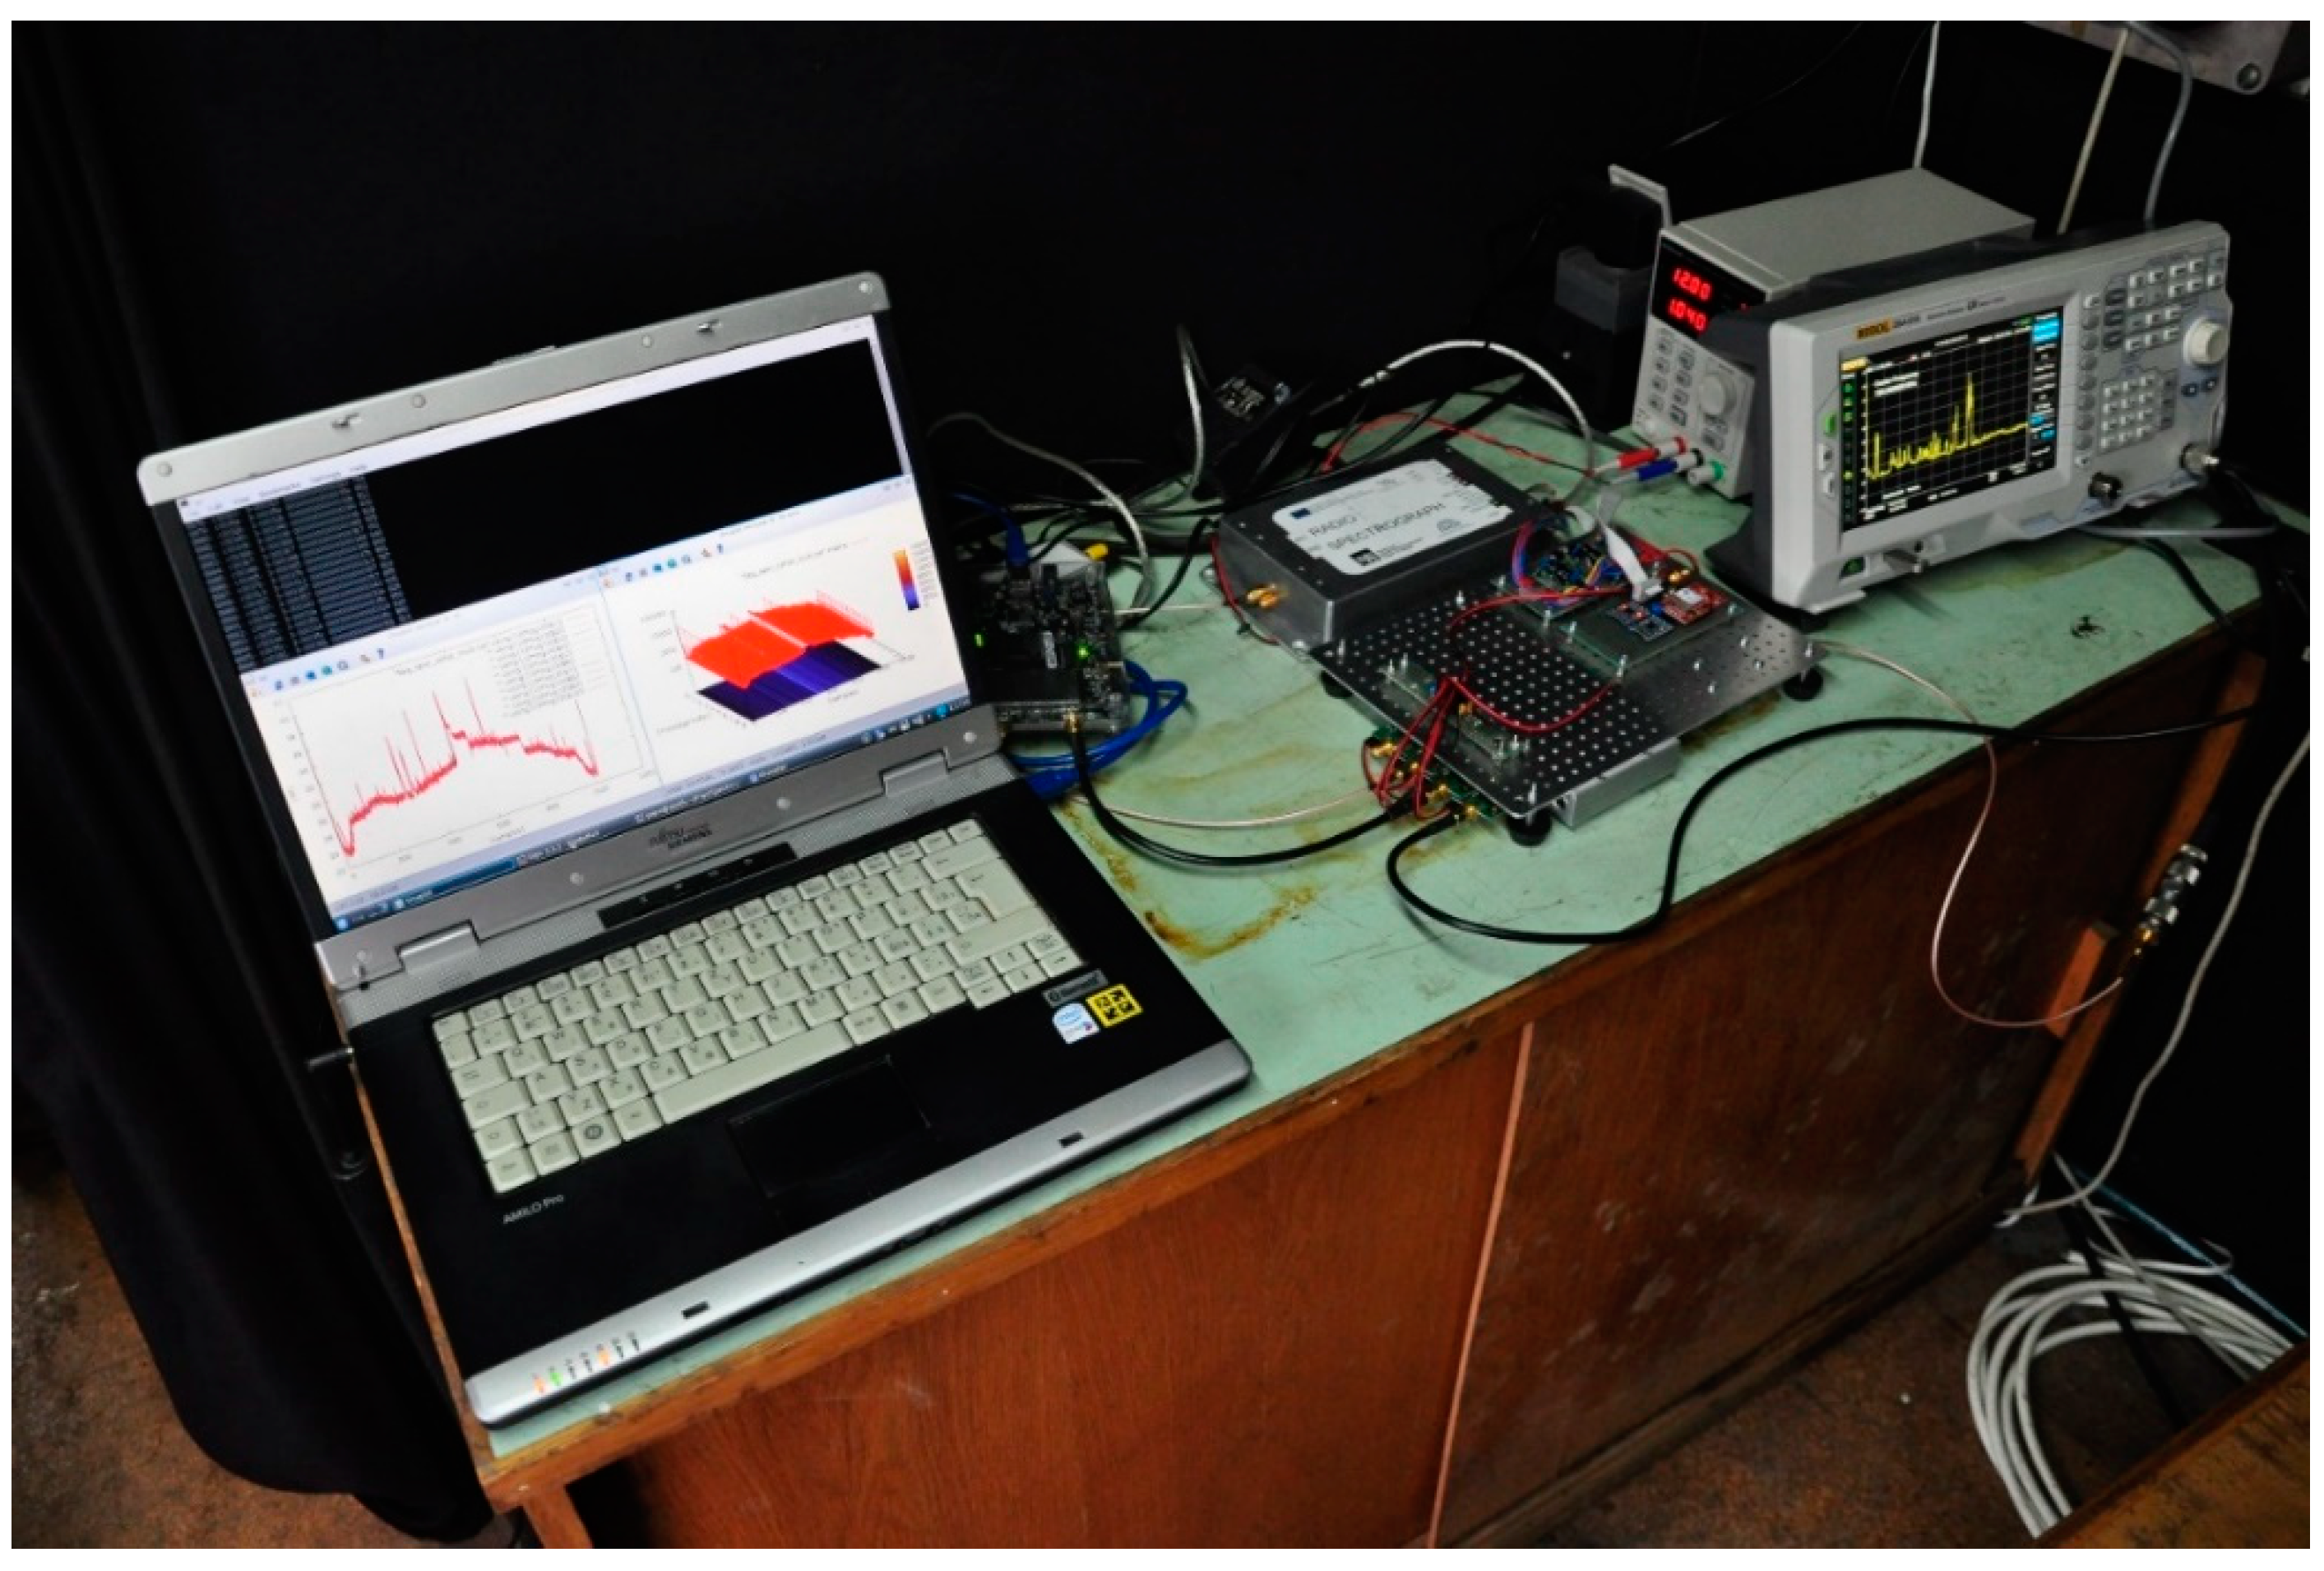
3.3. Testing
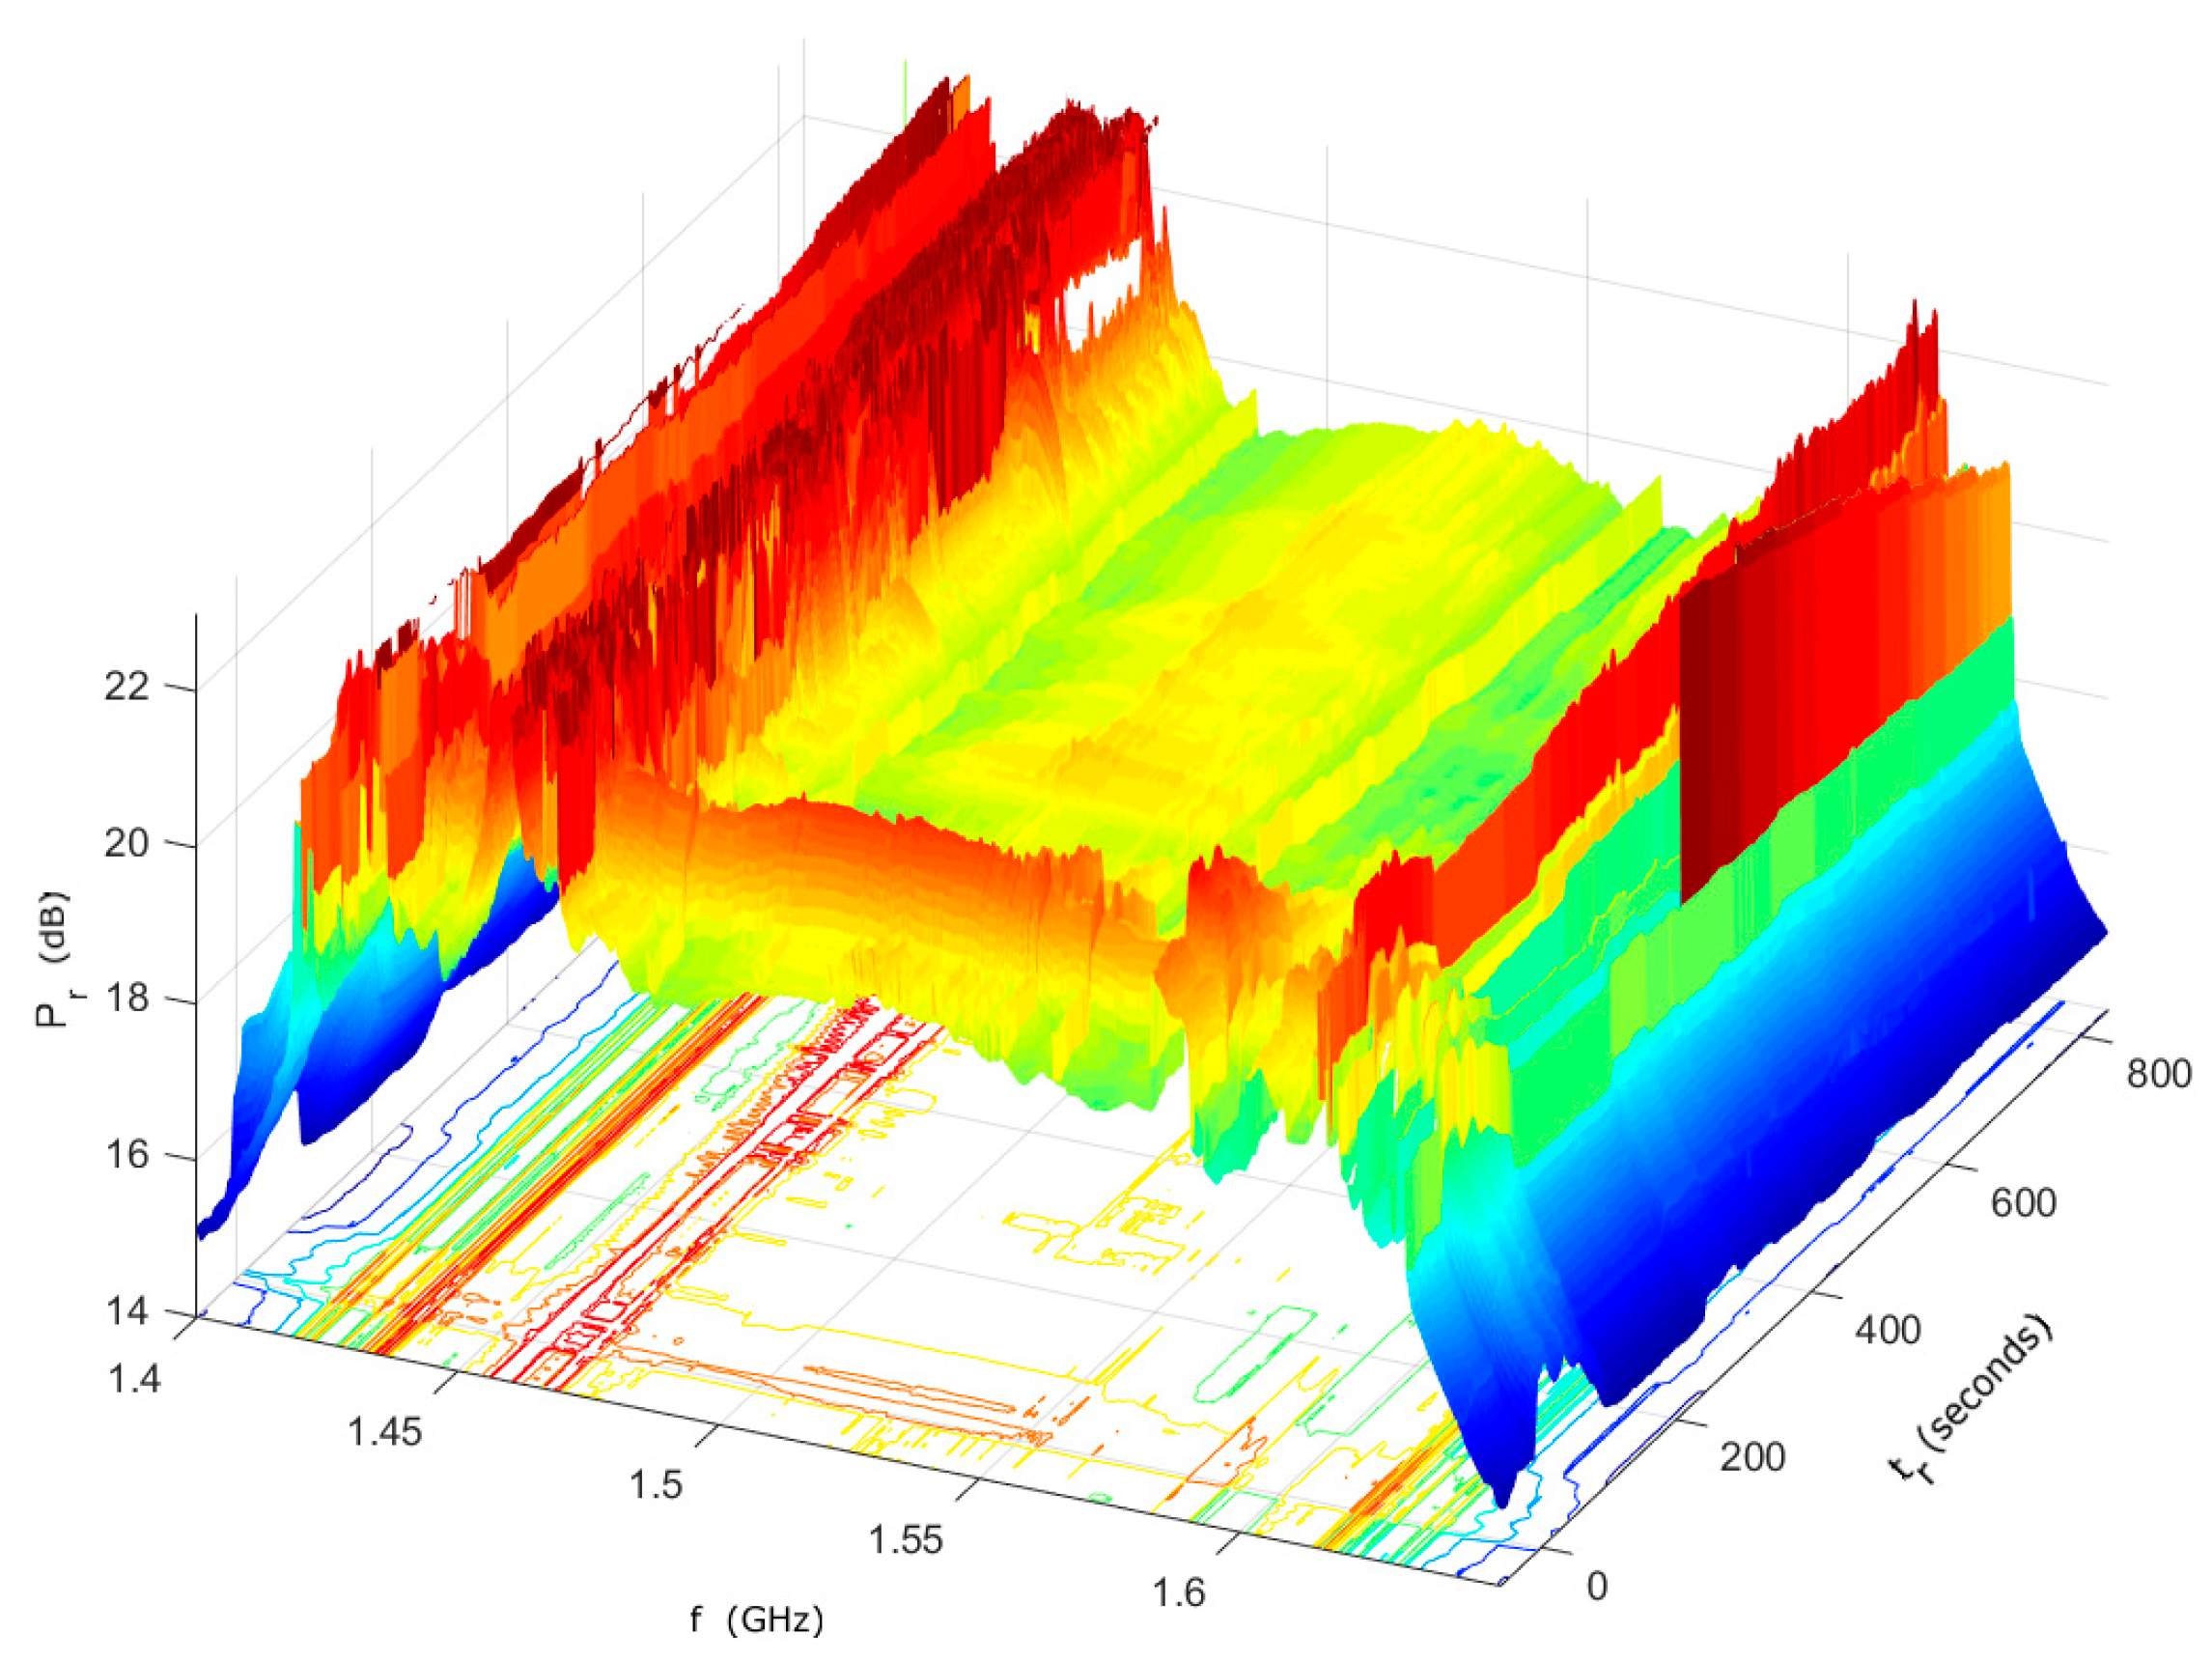
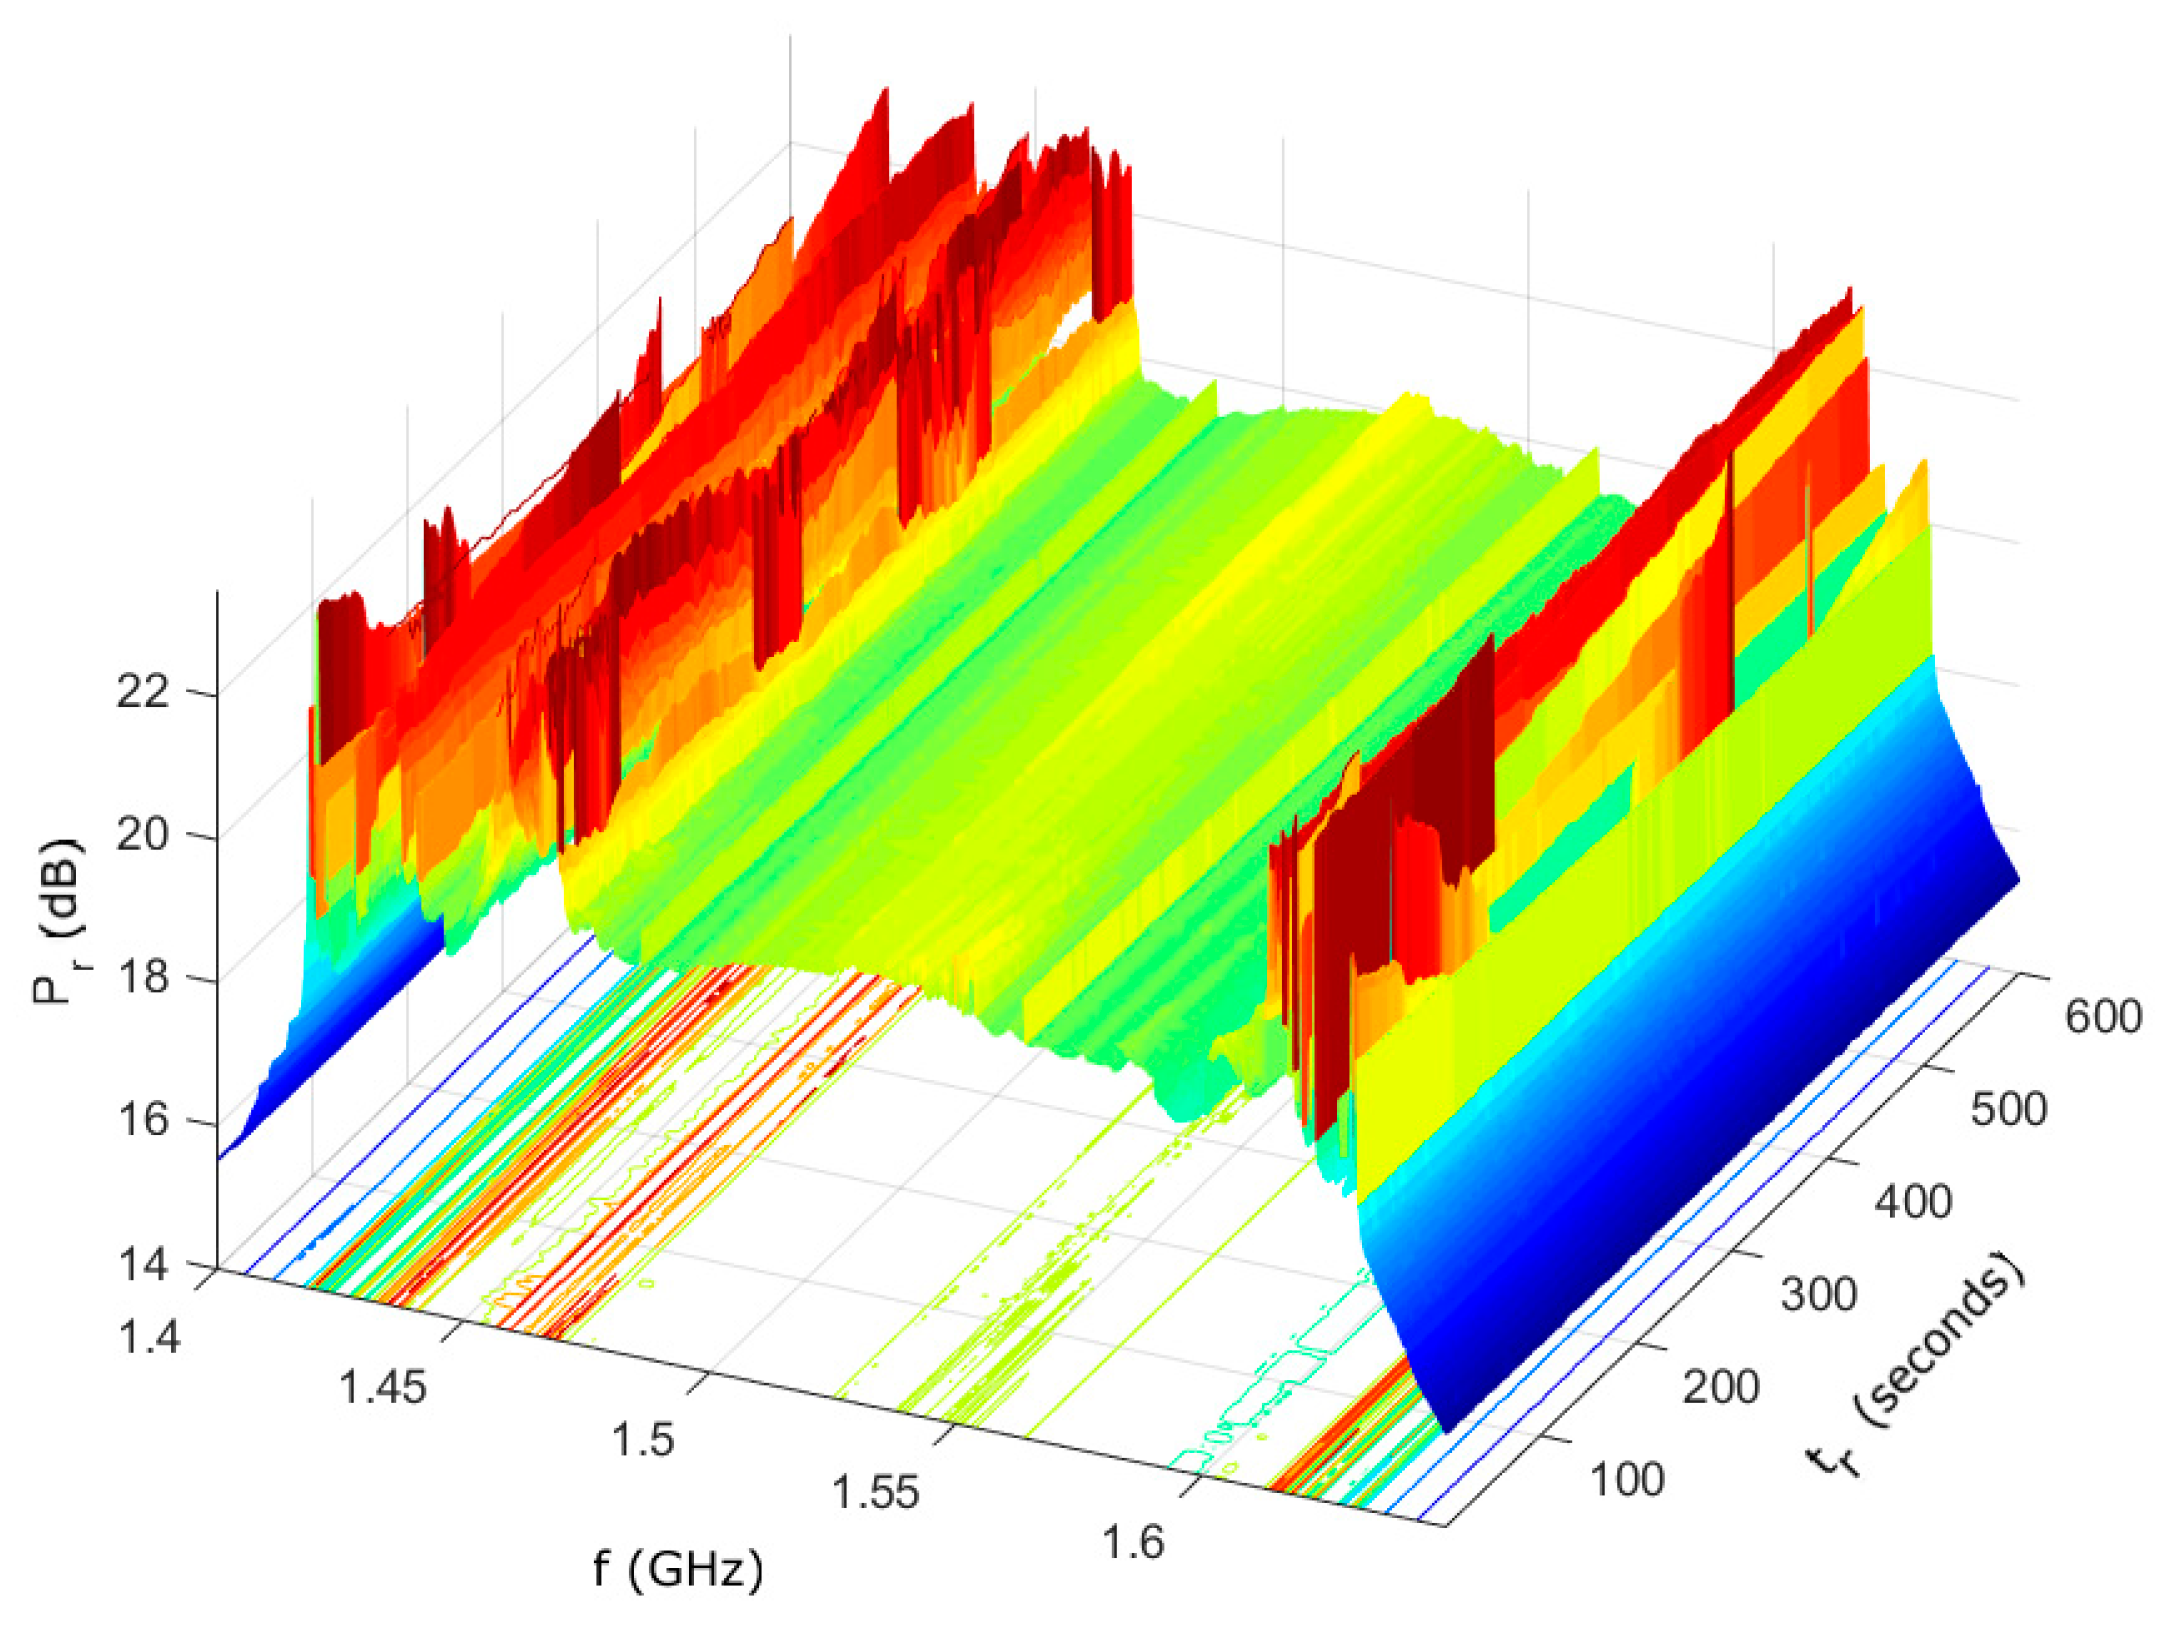
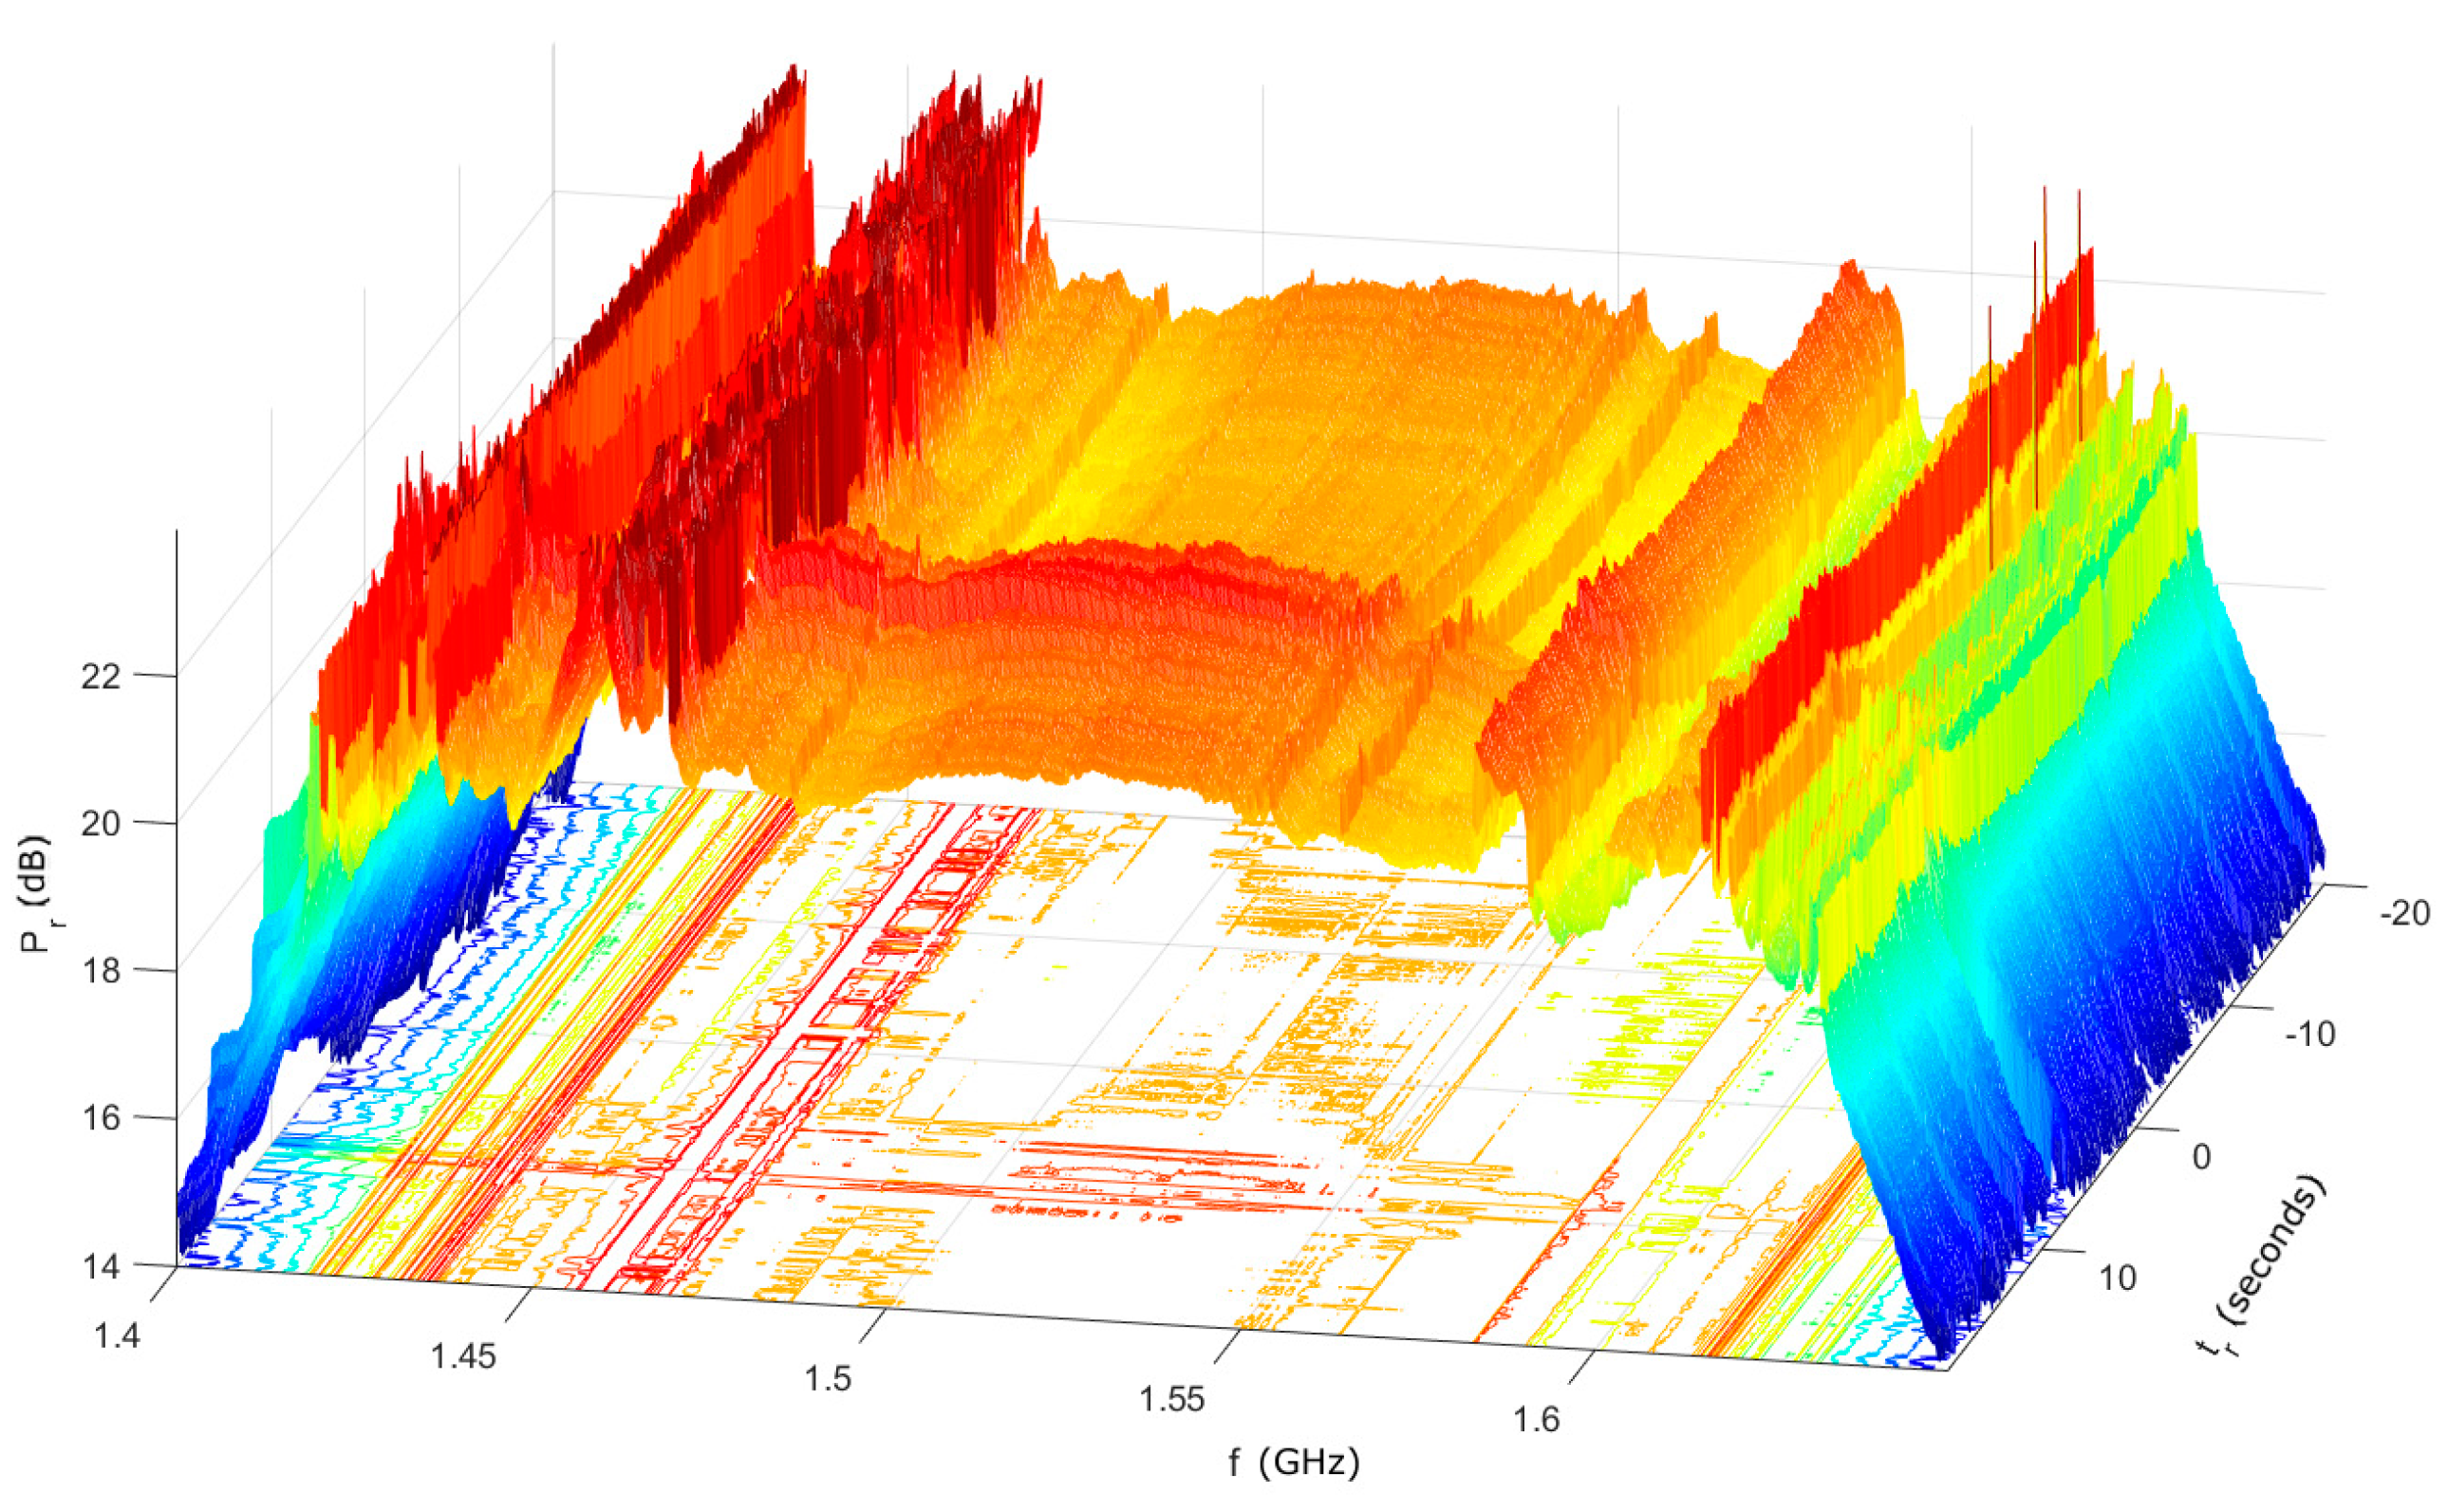
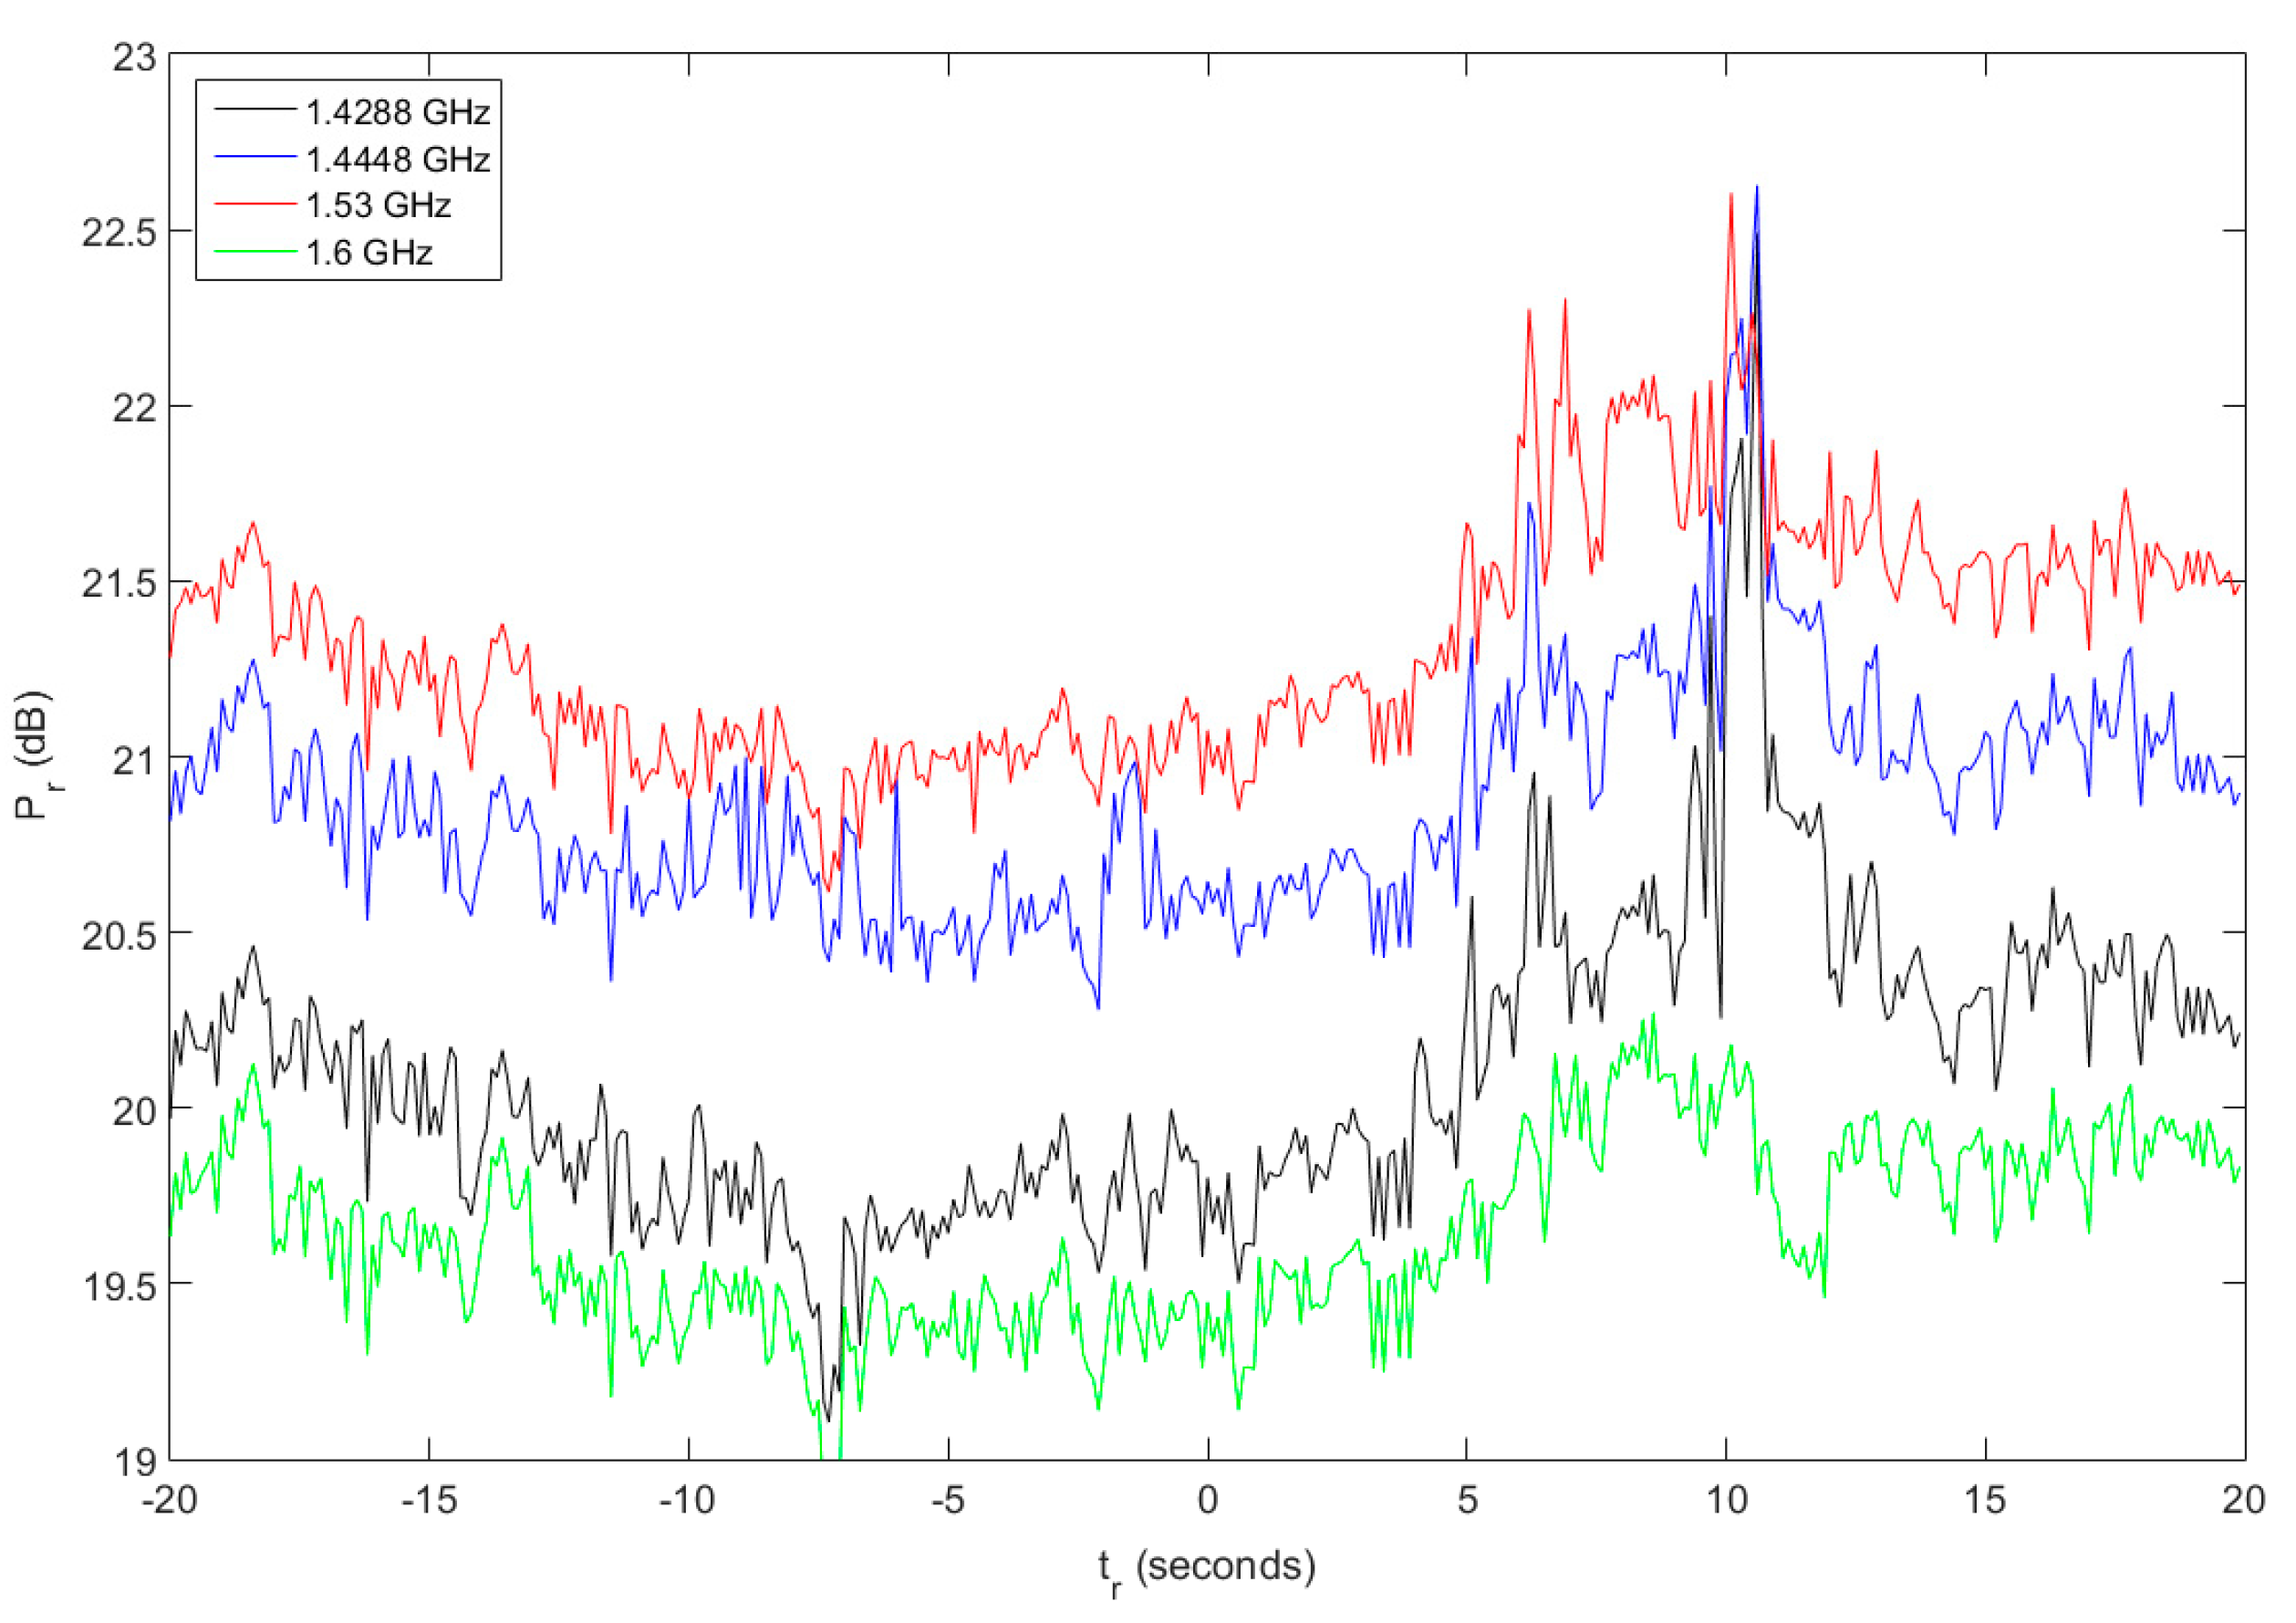
3.4. Test Results
4. Discussion and Conclusions
Author Contributions
Funding
Conflicts of Interest
References
- NOAA/NWS Space Weather Impacts. Available online: https://www.swpc.noaa.gov/impacts (accessed on 15 June 2019).
- Aschwanden, M.J.; Benz, A.O.; Dennis, B.R.; Schwartz, R.A. Solar Electron Beams Detected in Hard X-Rays and Radio Waves. Astrophys. J. 1995, 455, 347. [Google Scholar] [CrossRef]
- Bárta, M.; Büchner, J.; Karlický, M.; Skála, J. Spontaneous Current-layer Fragmentation and Cascading Reconnection in Solar Flares. I. Model and Analysis. Astrophys. J. 2011, 737, 1–11. [Google Scholar] [CrossRef]
- Carrano, C.S.; Bridgwood, C.T.; Groves, K.M. Impacts of the December 2006 solar radio bursts on the performance of GPS. Radio Sci. 2009, 44, 1–12. [Google Scholar] [CrossRef]
- Muhammad, B.; Alberti, V.; Marassi, A.; Cianca, E.; Messerotti, M. Performance assessment of GPS receivers during the September 24, 2011 solar radio burst event. J. Space Weather Space Clim. 2015, 5, A32. [Google Scholar] [CrossRef] [Green Version]
- Cerruti, A. Observed GPS and WAAS Signal-to-Noise Degradation Due to Solar Radio Bursts. In Proceedings of the 19th International Technical Meeting of the Satellite Division of The Institute of Navigation (ION GNSS 2006), Fort Worth, TX, USA, 26–29 September 2006; ION: Fort Worth, TX, USA, 2006; pp. 1369–1376. [Google Scholar]
- Cerruti, A.P.; Kintner, P.M.; Gary, D.E.; Mannucci, A.J.; Meyer, R.F.; Doherty, P.; Coster, A.J. Effect of intense December 2006 solar radio bursts on GPS receivers. Space Weather 2008, 6, 1–10. [Google Scholar] [CrossRef]
- Lanzerotti, L.; Gary, D.; Nita, G.; Thomson, D.; MacLennan, C. Noise in wireless systems from solar radio bursts. Adv. Space Res. 2005, 36, 2253–2257. [Google Scholar] [CrossRef]
- Kennewell, J.A. Solar radio interference to satellite downlinks. In Proceedings of the 1989 Sixth International Conference on Antennas and Propagation, ICAP 89 (Conf. Publ. No.301), Coventry, UK, 4–7 April 1989; IET: Coventry, UK, 1989; pp. 334–339. [Google Scholar]
- ITU Recommendation ITU-R P.372-13 (09/2016) Radio Noise; ITU: Geneva, Switzerland, 2016.
- Nita, G.M.; Gary, D.E.; Lanzerotti, L.J.; Thomson, D.J. The Peak Flux Distribution of Solar Radio Bursts. Astrophys. J. 2002, 570, 423–438. [Google Scholar] [CrossRef]
- O’Hanlon, B.; Kintner, P.M.S., Jr.; Kintner, P.M.; Gary, D.E. Global Positioning System and solar radio burst forensics. Radio Sci. 2009, 44, 1–6. [Google Scholar]
- Joseph, A. What is C/N0 and how it is calculated in a GNSS receiver. Inside GNSS 2010, 4, 20–29. [Google Scholar]
- Enge, P. WAAS Messaging System: Data Rate, Capacity, and Forward Error Correction. Navigation 1997, 44, 63–76. [Google Scholar] [CrossRef]
- Jiřička, K.; Karlický, M.; Kepka, O.; Tlamicha, A. Fast drift burst observations with the new Ondřejov radiospectrograph. Sol. Phys. 1993, 147, 203–206. [Google Scholar] [CrossRef]
- Klein, B.; Krämer, I.; Hochgürtel, S.; Güsten, R.; Bell, A.; Meyer, K.; Chetik, V. Fast Fourier Transform Spectrometer. In Proceedings of the 20th International Symposium on Space Terahertz Technology, Charlottesville, VA, USA, 20–22 April 2009; ISSTT: Charlottesville, VA, USA, 2009; pp. 199–201. [Google Scholar]
- Kallunki, J.; Uunila, M.; Monstein, C. Callisto radio spectrometer for observing the sun—Metsähovi Radio Observatory joins the worldwide observing network. IEEE Aerosp. Electron. Syst. Mag. 2013, 28, 5–9. [Google Scholar] [CrossRef]
- Antar, Y.M.M.; Zawari, A.; Islam, M.T.; Anwar, R.; Hasbi, A.M.; Asillam, M.F.; Monstein, C. Callisto radio spectrometer construction at universiti kebangsaan malaysia [antennas and propagation around the world]. IEEE Antennas Propag. Mag. 2014, 56, 278–288. [Google Scholar] [CrossRef]
- Da̧browski, B.P.; Karlický, M.; Rudawy, P. Fourier Analysis of Radio Bursts Observed with Very High Time Resolution. Sol. Phys. 2015, 290, 169–180. [Google Scholar] [CrossRef]
- Gough, P.T. A Fast Spectral Estimation Algorithm Based on the FFT. IEEE Trans. Signal Process. 1994, 42, 1317–1322. [Google Scholar] [CrossRef]
- Müller, S.; Murk, A.; Monstein, C.; Kampfer, N. Intercomparison of Digital Fast Fourier Transform and Acoustooptical Spectrometers for Microwave Radiometry of the Atmosphere. IEEE Trans. Geosci. Remote. Sens. 2009, 47, 2233–2239. [Google Scholar] [CrossRef]
- Kim, B.; Kong, S.-H.; Kim, S. Low Computational Enhancement of STFT-based Parameter Estimation. IEEE J. Sel. Top. Signal Process. 2015, 9, 1610–1619. [Google Scholar] [CrossRef]
- Cabal-Yepez, E.; Garcia-Ramirez, A.G.; Romero-Troncoso, R.J.; Garcia-Perez, A.; Osornio-Rios, R.A. Reconfigurable Monitoring System for Time-Frequency Analysis on Industrial Equipment Through STFT and DWT. IEEE Trans. Ind. Inform. 2013, 9, 760–771. [Google Scholar] [CrossRef]
- Iwai, K.; Kubo, Y.; Ishibashi, H.; Naoi, T.; Harada, K.; Ema, K.; Hayashi, Y.; Chikahiro, Y. OCTAD-S: Digital fast Fourier transform spectrometers by FPGA. Earth Planets Space 2017, 69, 1–8. [Google Scholar] [CrossRef]
- Ji, H.; Fu, Q.; Liu, Y.; Cheng, C.; Chen, Z.; Yan, Y.; Zheng, L.; Ning, Z.; Tan, C.; Lao, D.; et al. A Solar Radio Spectrometer at 5.2–7.6 GHz. Sol. Phys. 2003, 213, 359–366. [Google Scholar] [CrossRef]
- Gismalla, E.H.; Alsusa, E. On the performance of energy detection using Bartlett’s estimate for spectrum sensing in cognitive radio systems. IEEE Trans. Signal Process. 2012, 60, 3394–3404. [Google Scholar] [CrossRef]
- Benz, A.O.; Isliker, H.; Miszkowicz, S.; Stehling, W.; Benz, A. A broadband spectrometer for decimetric and microwave radio bursts: First results. Sol. Phys. 1991, 133, 385–393. [Google Scholar] [CrossRef]
- Benz, A.O.; Monstein, C.; Meyer, H. Callisto—A New Concept for Solar Radio Spectrometers. Sol. Phys. 2005, 226, 143–151. [Google Scholar] [CrossRef]
- JEDEC. JEDEC Standard. Serial Interface for Data Converters. JESD204C (Revision of JESD204B.01 January 2012); JEDEC: Arlington, VA, USA, 2012; Available online: https://www.jedec.org/system/files/docs/JESD204C.pdf (accessed on 17 June 2019).
- Horlin, F.; Bourdoux, A. Digital Compensation for Analog Front-Ends, 1st ed.; Wiley Blackwell: Hoboken, NJ, USA, 2008; ISBN 978-0-470-51708-6. [Google Scholar]
- Gokceoglu, A.; Dikmese, S.; Valkama, M.; Renfors, M. Energy Detection under IQ Imbalance with Single- and Multi-Channel Direct-Conversion Receiver: Analysis and Mitigation. IEEE J. Sel. Areas Commun. 2014, 32, 411–424. [Google Scholar] [CrossRef]
- Choi, M.; Choi, S. Performance analysis on the self-mixed interference cancellation in direct conversion receivers. IEEE Trans. Consum. Electron. 2013, 59, 310–315. [Google Scholar] [CrossRef]
- Park, B.-K.; Yamada, S.; Lubecke, V. Measurement Method for Imbalance Factors in Direct-Conversion Quadrature Radar Systems. IEEE Microw. Wirel. Compon. Lett. 2007, 17, 403–405. [Google Scholar] [CrossRef]
- Pence, W.D.; Chiappetti, L.; Stobie, E.; Page, C.G.; Shaw, R.A. Definition of the Flexible Image Transport System (FITS), version 3.0. Astron. Astrophys. 2010, 524, 1–40. [Google Scholar] [CrossRef]


| Parameter | Value | Note |
|---|---|---|
| Usable bandwidth | 250 MHz | |
| Operating range | 400 MHz/6 GHz | (Center frequency) |
| Full Scale | −25/+5 dBm | Programmable, step 1dB |
| Sampling rate | 310 MHz | |
| ADC resolution | 2× 14 bits | IQ sampling |
| Baseband filters | 6th order Cauer, symmetrical | |
| Filter pass-band | 0/125 MHz, 0.5 dB ripple | |
| Stop-band | ≥155 MHz, Attenuation ≥50 dB | |
| Data interface | USB 2.0 device | |
| Synchronization | 1 PPS | Free running mode 1.1s if 1 PPS signal is not present |
| Parameter | Value |
|---|---|
| FFT length | 1024 |
| Frequency bin size | 302,704.375 Hz |
| Number of averaging (M) | 300 |
| Parameter | RT5 Analog Spectrograph | Designed Digital Spectrograph |
|---|---|---|
| Time resolution | 10 ms shared by 256 channels | 1 ms |
| Frequency resolution | 4 MHz | 303 kHz |
| ADC resolution | 12 bit | 14 bit |
| Dynamic range | 36 dB | 50 dB |
| QSR/noise ratio | 3.7 dB | 3–10 dB (impact of antenna) |
© 2019 by the authors. Licensee MDPI, Basel, Switzerland. This article is an open access article distributed under the terms and conditions of the Creative Commons Attribution (CC BY) license (http://creativecommons.org/licenses/by/4.0/).
Share and Cite
Puricer, P.; Kovar, P.; Barta, M. Modernized Solar Radio Spectrograph in the L Band Based on Software Defined Radio. Electronics 2019, 8, 861. https://doi.org/10.3390/electronics8080861
Puricer P, Kovar P, Barta M. Modernized Solar Radio Spectrograph in the L Band Based on Software Defined Radio. Electronics. 2019; 8(8):861. https://doi.org/10.3390/electronics8080861
Chicago/Turabian StylePuricer, Pavel, Pavel Kovar, and Miroslav Barta. 2019. "Modernized Solar Radio Spectrograph in the L Band Based on Software Defined Radio" Electronics 8, no. 8: 861. https://doi.org/10.3390/electronics8080861
APA StylePuricer, P., Kovar, P., & Barta, M. (2019). Modernized Solar Radio Spectrograph in the L Band Based on Software Defined Radio. Electronics, 8(8), 861. https://doi.org/10.3390/electronics8080861