Article

Development of a Punch-O-Meter for Sport Karate Training

by
Jay Venkatraman
,
Rayyan Manwar
and
Kamran (Mohammad) Avanaki
*
Department of Biomedical Engineering, Wayne State University, Detroit, MI 48201, USA
*
Author to whom correspondence should be addressed.
Electronics 2019, 8(7), 782; https://doi.org/10.3390/electronics8070782
Submission received: 30 May 2019 / Revised: 8 July 2019 / Accepted: 9 July 2019 / Published: 12 July 2019
(This article belongs to the Section Computer Science & Engineering)

Abstract

:
In karate sparring (kumite), punches are used more than kicks to score points. Among these punches, gyaku tsuki is a very commonly used punch. The objective of the punch is to hit the target at a medium range in a very short time, producing a maximum force. In this study, we proposed the development of a novel standalone Punch-O-Meter system to measure the speed and the force generated by a punch.

1. Introduction

Karate training is divided into three main parts: kata (forms), kihon (basics), and kumite (sparring). The strikes in karate are mostly in a straight line [1] i.e., their minimal displacement makes them quick. The mass of the leg is about 20%, while that of the arm is just 5% of the total body weight [2]. This difference in mass is why punches are easier to aim but are less powerful as compared to kicks. In competitions, scoring precise points quickly is more emphasized than delivering powerful blows. Hence, punches h play a very important role in the karate kumite arsenal.
Gyaku tsuki, also known as the reverse punch, is the most frequently used punch in karate competitions. The objective of the punch is to hit the target at a medium range in a very short time, producing maximum force. From the normal fight stance, the attacker athlete lowers his center of mass while extending his stance, lunging towards his opponent and extending his punching arm forward, executing the punch in the open unguarded part of the opponent’s abdomen [3]. This punch is preceded by a series of bodily movements, namely the twisting of the hips and shoulder rotation. The peak velocity of the joint preceding a joint aids in further increasing the joint’s peak velocity. Rathee et al. [4] conducted a study for the parameters required for breaking a wooden board by two karatekas. For inelastic collision, the deformation energy (DE) is the energy (in joules) lost to deformation. It is determined by:
D . E . = ( 1 / 2 ) ( ( m 1 × m 2 ) / ( m 1 + m 2 ) ) × V c 2
where m1 is the mass (kg) of the wooden board and m2 is the mass (kg) of the arm of the punching participant. Vc (ms−1) is the velocity of the punch upon impact. The impact due to the mass of the arm would remain constant or would not cause any significant change even if trained hard. Hence, karatekas should train to increase their punch velocity. A double increase in the punch velocity would quadruple the energy production.
In recent decades, different methods have been used to calculate the absolute force of a martial artist’s punches and kicks for research purposes. Researchers in Poland developed a punching bag with an embedded strain gauge to measure the force of a punch [5]. They improved it by using embedded accelerometers and a larger bag, which calculated the forces acting on the bag and separated the force components in the three direction axes. Another study, carried out in [6], used motion capture and force plates to calculate the ground reaction force on the legs while striking, and a target placed on specific joints on the limb aided in determining the kinematics of the arm. Another system built based on the target lever arm’s torsional movement along the target stand gave the force values acting on the target [7]. Singh Anupam, in his thesis, presented a force measuring instrument FGV SHIMPO to measure force [2]. Five springs were added behind a stiff punching board to dampen the force values and a study with the relative force values was conducted. For this specific study, calculating the absolute force values was not necessary [2]. In another study by Girodet et al. [8], an instrumented makiwara was designed and used to measure the force of the reverse punch. In [9,10,11,12], piezoresistive sensors were used to measure the force of kicks in taekwondo. In gyaku tsuki, both force and speed are required to be monitored simultaneously for efficient training, which is not feasible using the existing methods. Each method has its own merit and limitations, but the proposed system focuses on building a cost-effective, stand-alone and portable system. Most previous studies focused on recording the force of the strike and not the speed, and the ones which focused on recording the speed did not record the true speed. In this study, the aim is to determine the striking speed—the speed of the punch—just before it makes contact. The limb’s speed when it is starting is lower than when it strikes—this would not be a true representation of speed.
In the proposed study, we developed a portable and standalone active sensing system capable of measuring the speed and the force of gyaku tsuki punches and display them in real time.

2. Materials and Methods

The proposed Punch-O-Meter system consisted of two circular wooden slabs with a spacer in between to hold the sensors in place. To determine the force distribution pattern among the sensors when punching different regions within the punching zone, we performed a finite element analysis (FEA) using Hypermesh software. Initially, an outline of this model was designed in SolidWorks and imported in Optistruct. Wood (thickness: 1.3 cm, diameter: 25 cm) and sensor components (Young’s modulus E = 1000 MPa) were modelled, material properties were assigned, and constraints were defined. The components were meshed using a 5 mm and 1 mm mesh size. A distributed total load of 2 kN was added to every node inside a rectangular area with a side length of 80 × 60 mm, considering the size of the fist. Studies by Krzystof Busko et al. [13,14,15] stated that the maximum force delivered by a boxer is between 4.5 and 5 kN. Other studies indicated different values for a boxer’s maximum striking force, depending on the methodology used. For instance, studies by Karpilowski [16,17] stated that a boxer’s maximum striking force is 2697 N. Karate punches are considered to generate less force than boxing punches. Since this study used 9 sensors with a force range of 455 N each, there was no need to further increase the sensing range of the sensor. Single point constraint (SPC) forces were extracted on all the elements of the sensors using Hypermesh. The simulation showed the force distribution and verified that punching inside the area covered by the sensors was the best place.
For the experimental setup, two wooden circular plates were cut to have a diameter of 25 cm and the sensors were placed in-between them to detect the force applied on the wooden platform. The wooden slabs’ thickness was chosen to be 1.3 cm so that they could withstand forces up to 5 kN without any permanent deformation. The sensors used in this study were Flexiforce A201 force sensors with a thickness of 0.2 mm (Tekscan Inc., South Boston, MA, USA) [18]. The nine sensors were arranged along the sides of an equilateral triangle with a length 15 cm. Three sensors were arranged along the midpoint of each side of the triangle, as shown in Figure 1a. The sensors were placed between the two spacers on each side, such that when the wooden plates underwent compression, they would not touch each other and dissipating the force between themselves, so that, the force could be distributed homogenously throughout the wooden surface and recorded by the sensors.
Four holes were made through the two wooden plates—two for holding the wooden plates together and two for hanging the system on the wall. A foam with a 2.54 cm thickness and a 20 cm diameter was placed on the punching surface to protect the user’s hands from injuries. Next, the wooden plates were attached together with screws such that they did not move with respect to each other laterally and to avoid any misalignment of the sensors’ arrangement. As suggested by the manufacturer, the sensors were loaded with a 1100 N (newton weight) to condition them, then the calibration was implemented once under the Instron machine with the foam padding. The loading area was a rectangle with dimensions of 100 × 150 mm, considering the dimensions of the area of contact of the fist for punching. The sensing area for each sensor was 73.9 mm2. The area under the 9 sensors was 665.17 mm2. The value obtained is the total value obtained from all the sensors without averaging the result of any individual sensor. The corresponding voltage values were noted and the force values were obtained by interpolation (Figure 1b).

2.1. Punch Speed Detection Module

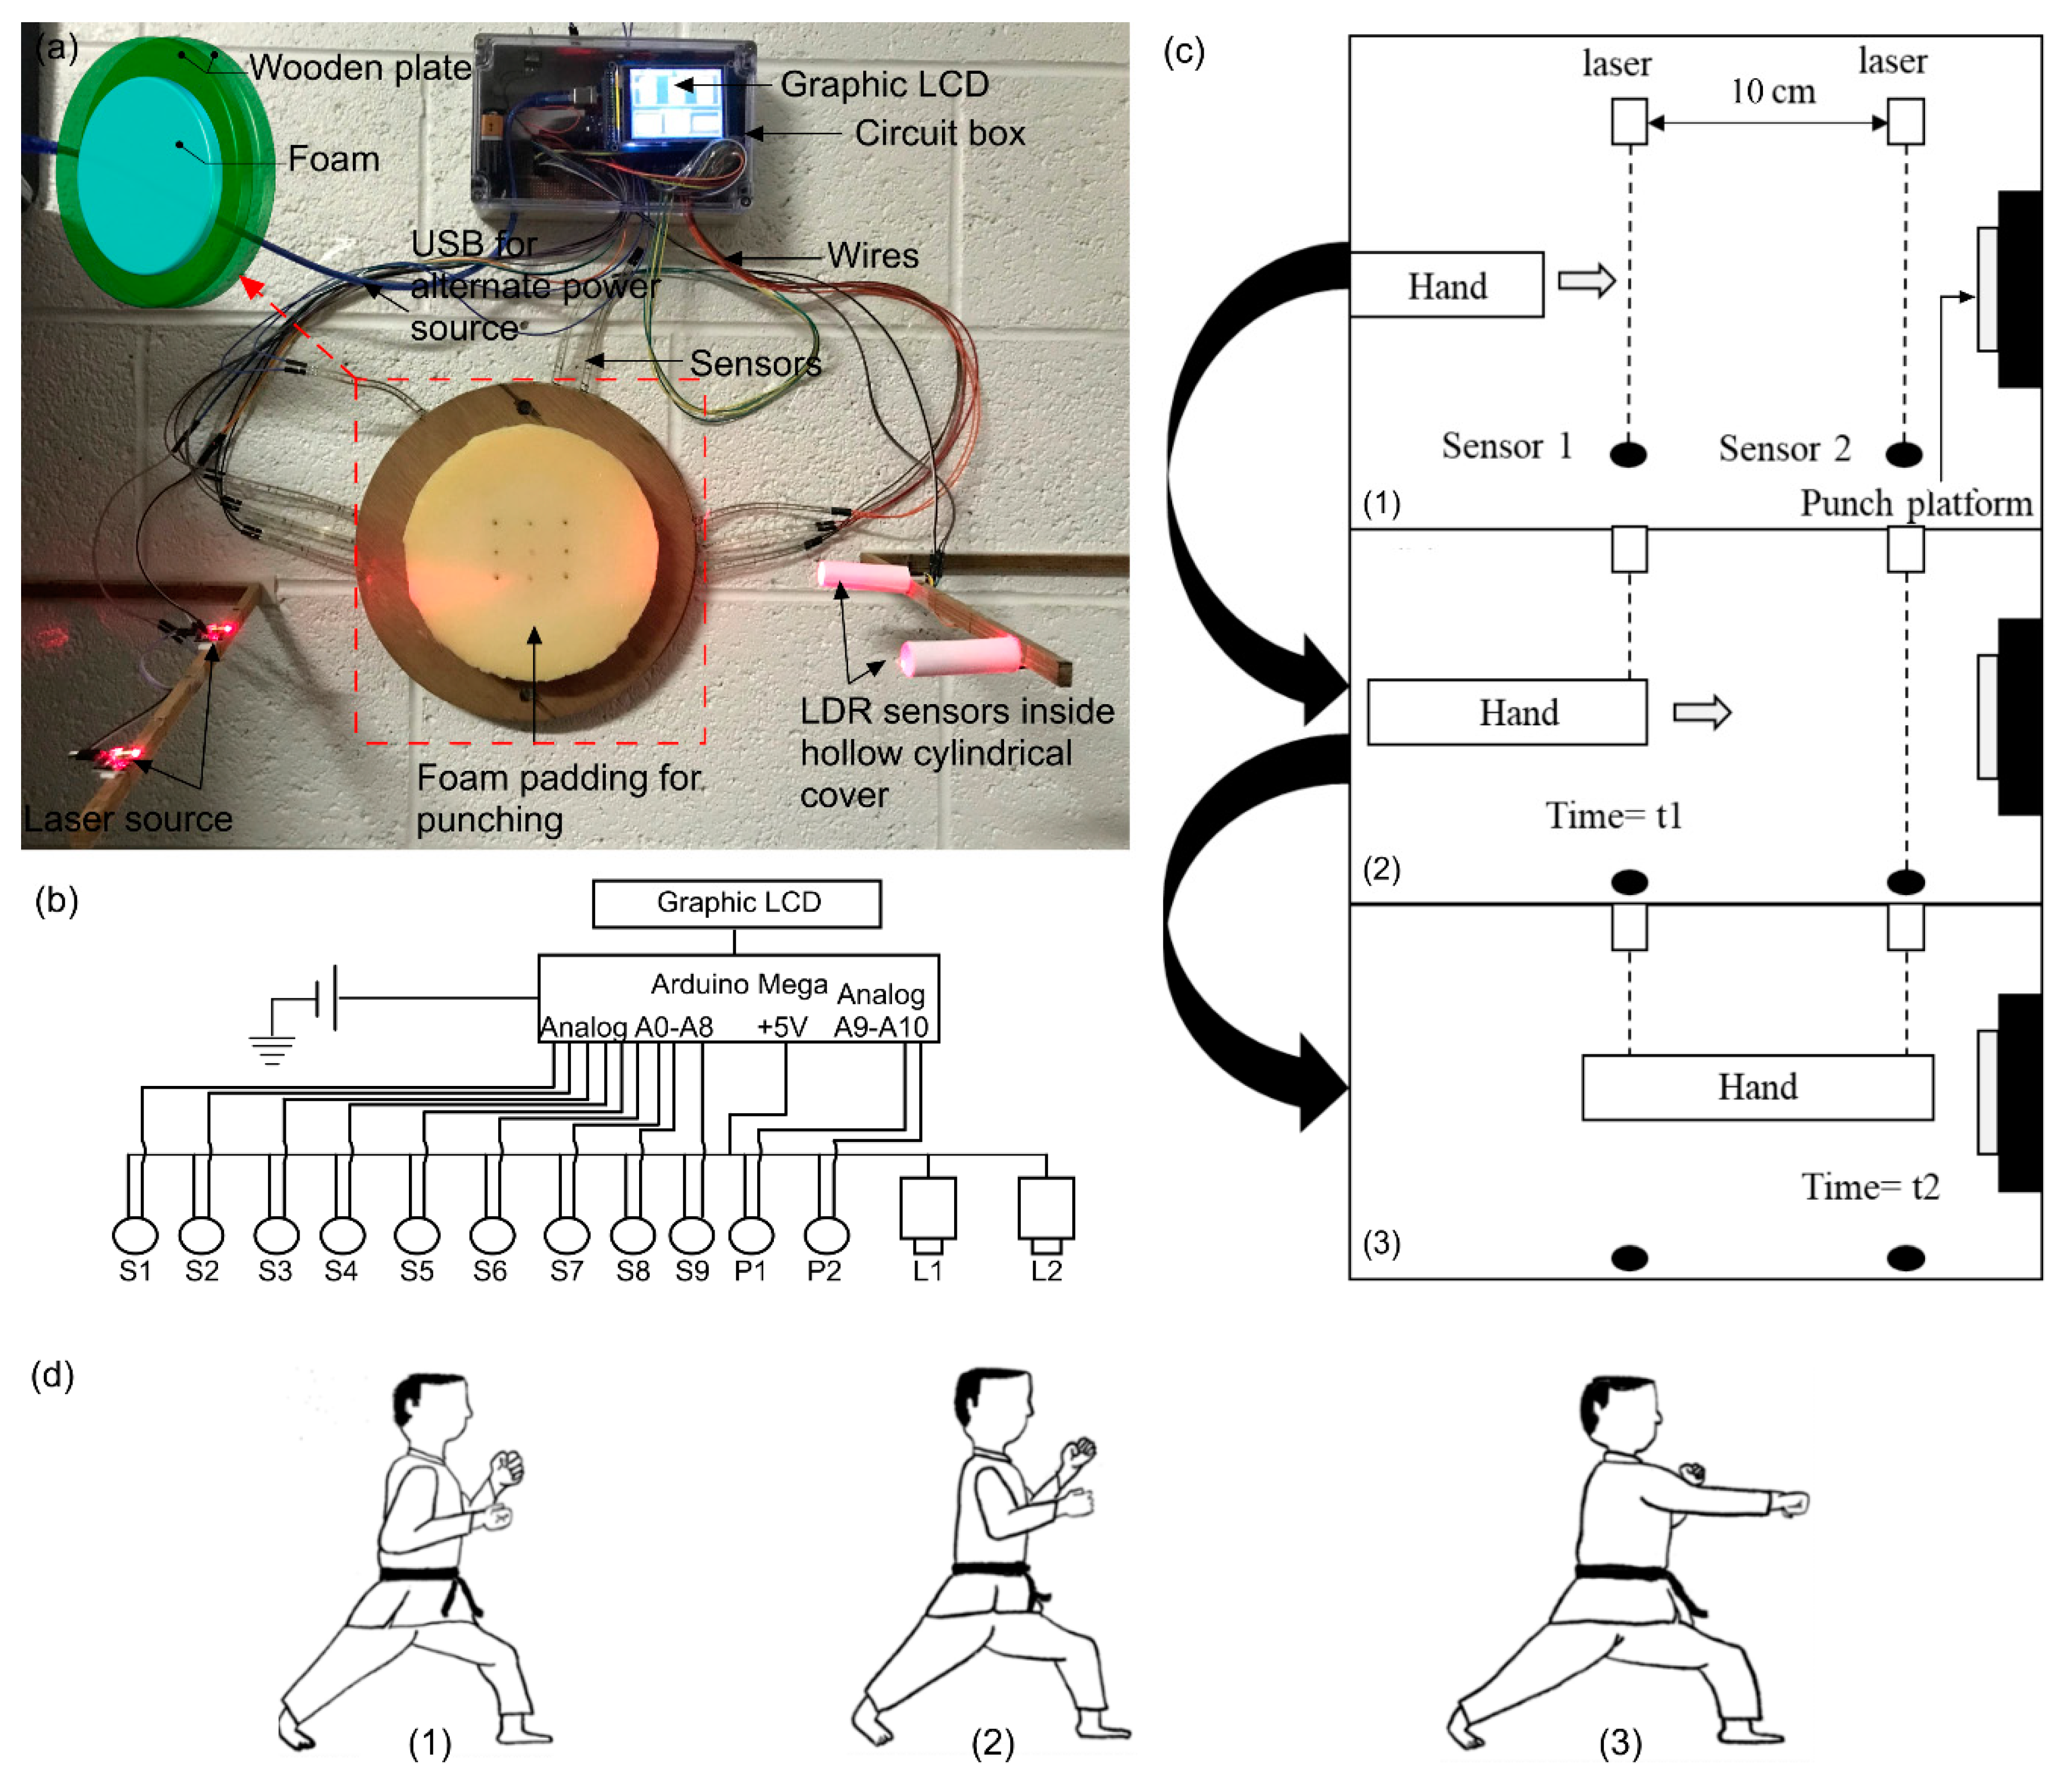
To detect the punch speed, two lasers (KY-008 red dot diode laser, rp-semiconductor, City of Industry, CA, USA)—photoresistor sensor pairs—were placed on a wooden stand, 10 cm from each other. The laser beams were directed perpendicularly to the direction of the punch. The sensors were wrapped with hollow cylindrical covering to avoid any false reading due to the ambient light. This arrangement is shown in Figure 2a. When the punching hand interrupted the laser-induced signals detected by sensor, time t1 and t2 were noted for laser 1 and laser 2, respectively. The punch speed was then obtained based on the time difference (t2t1) and the distance travelled by the punching hand (in this case, 10 cm). The working principle of the device is shown in Figure 2c. The sampling rate was 134 Hz and the maximum speed this system could detect was 8.33 m/s.

2.2. Other Components

A SainSmart 3.2″ TFT LCD (SainSmart Technology Inc., Lanexa, KS, USA) was used for displaying the values. The LCD was connected to the Arduino Mega board 1.8.2 using an Arduino mega shield for the LCD. On/off and reset buttons were soldered to the circuit and set up on the surface of the circuit box. The Graphic LCD displayed a graph of the time vs force (total of the 9 sensors), the total force, the speed of the punch in values, and the type of punch, i.e. punch or compression punch. A compression punch gives higher results and is not accurately termed as a ‘punch’, which delivers maximum energy in a short time. A schematic of the circuit diagram is provided in Figure 2b.

2.3. System Specifications

The specifications of the system were determined based on the calibration curve shown in Figure 1b, which follows a logarithmic pattern. The sensitivity of the system was 0.015 V·N−1 up to 400 N, and it decreases to 0.0024 V·N−1 at 1000 N. Due to the weight of the wood, the minimum value of 0.6 V was detected and upon application of 1000 N, the detected voltage increased up to 7.95 V.

2.4. System Evaluation

To experimentally demonstrate the system’s capabilities, an expert in karate (weight: 72 kg, age: 24) was chosen for the test. The forces and the speeds of the punches were to be determined to analyze the best type of gyaku tsuki to be used in competitions. The Wayne State University Institutional Review Board (IRB) approved the participant for the tests. The participant was asked to stand at a comfortable arm’s length for punching the system and to maintain the Kumite stance to maintain balance, since punching the rigid wall tended to throw the participant off balance. All the punches were done from a stationary position without any stepping motion. Figure 2d shows the initial, middle and final positions of the fist while punching. While punching, the participant was instructed not to compress the wood, as the algorithm would not accept this as a valid reading. Any punch value with a plateau at the peak value was rejected.

3. Results

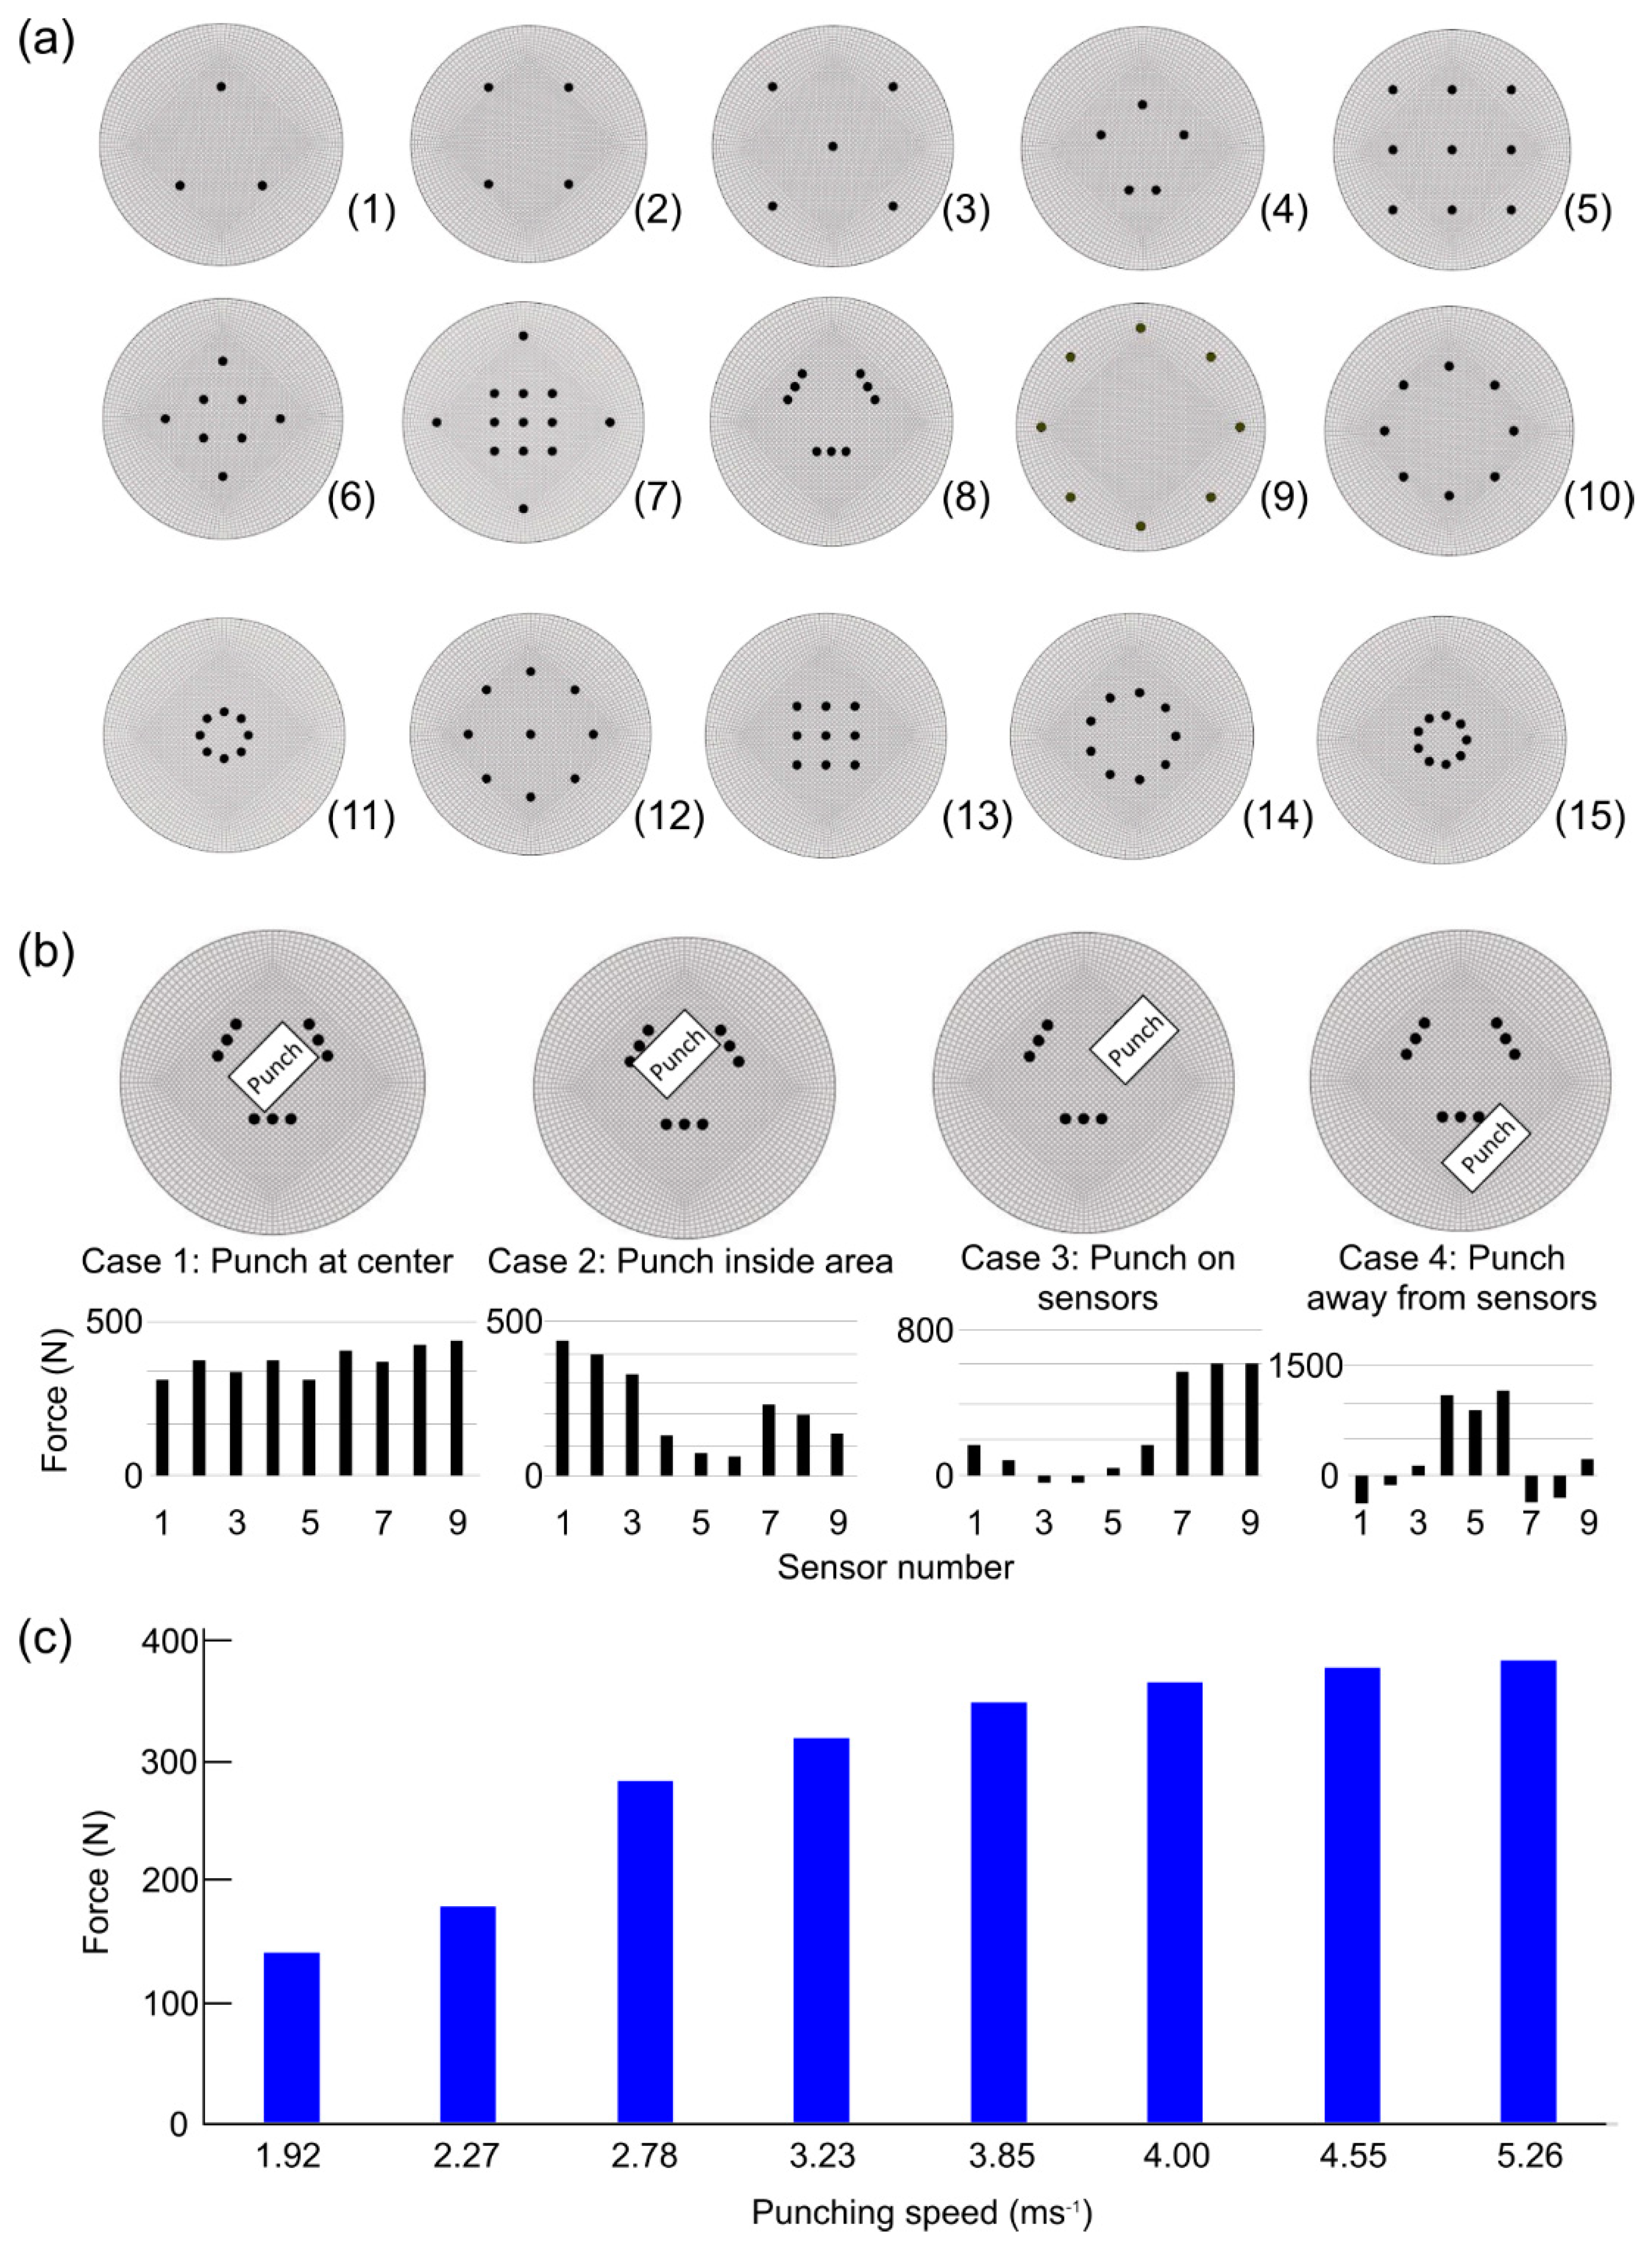
A finite element analysis (FEA) of the wood and different sensor arrangements was performed (Figure 3a) to determine the most effective configuration of the sensors that would provide the maximum homogeneity in terms of cumulative sensitivity. In Table 1, the different configurations of the sensor location on the wooden plate and the corresponding homogenous sensitivity are provided. Once we achieved the efficient sensor arrangement (Configuration 8) as shown in Figure 3a, different punching locations were tested to find out the most optimum location that could be homogenously read by the sensors. These simulations were performed using Hypermesh software. As shown in Figure 3b, the large outer circle is the wood and the small dots are the sensors’ locations. The punch was simulated at four different locations on the wooden platform (shown in Figure 3a): the center, where most of the force of the sensors was distributed (case 1), inside the area formed by the sensors but away from the center (case 2), halfway outside the triangular area on the sensors (case 3), and completely outside the area (case 4).
The corresponding simulation results detected by each sensor are provided in Figure 3b. After narrowing down the most efficient way to detect the punch force and the speed based on the optimum sensor configuration and the punching location, the gyaku tsuki punch was tested experimentally at 6 different speeds and the corresponding force was detected by the sensors, as shown in Figure 3c. After the force generated by the punch was verified, it was tested for achieving maximum speed. Table 2 shows the maximum speed that was attained by the punch when tested 5 consecutive times.

4. Discussion

In order to determine the speed and force of gyaku tsuki punches in real-time, we proposed a stand-alone active sensing system. The sensor arrangement, adopted by Falco et al. [12] for taekwondo, was followed and simulated to verify how the forces were being distributed on all the sensors when punched on different areas of the wooden platform. Ideally, a load would need to be supported by a base on at least three of the sides. Placing a load inside the area enclosed by the sensors would distribute the whole load between them, whereas if the load was placed outside the area enclosed by the sensors, not all of the force would be recorded by the sensors. Moreover, if all the sensors read the forces equally, then the effective range required by each sensor would be reduced, which would be more effective than forces being distributed in an uneven pattern when punched near one sensor and away from another. As seen in Figure 3b, the sensors recorded force more evenly when punched at the center than away from the center. In case 2, there is a large gap between the highest and the lowest readings on the sensors since the punch was closer to a certain group of sensors than to others. In case 3, the gap is higher due to the introduction of negative forces. Since the load extended in the area not supported by the sensors, an imbalance was created and the sensors on the other end displayed a negative force. The negative force acted by pushing the board away from the sensor. The resultant of all these forces was 2 kN. In case 4, the negative forces were higher because the board was tilting a considerable distance on one side. The Flexiforce A201 sensor could only record 445 N without increasing its sensing range. As shown in Figure 3b, all the sensors were able to record the values since they were well within range in case 1. In case 2, the highest force was 405 N, which means that this case was almost on the verge of the range of the recording force. Hence, punching any harder on the sensors would have saturated the readings of the sensors. The highest readings in case 3 and 4 were 591 N and 1070 N, respectively, which is outside the sensors’ sensing range. Hence, this specific arrangement worked for recording the punch forces fully inside the triangular area. The values obtained from the programmable microcontroller display the force values in Newtons on the graphic LCD, along with the force time curve, thus providing real-time data to the user. The values obtained in Figure 3b show that the force generated by the normal gyaku tsuki gradually increased along with the increase in punch speed. The maximum attainable speed of the punch was checked in Table 2 to determine the maximum average speed of the punch. The five tests yielded a mean value of 5.52 m/s with an S.D. of 0.212 m/s. This minor variation can be attributed to the participant’s ability to not punch at the same speed each time but within a close range of the other attempts. Although the participant practiced before punching, the first punch was relatively slower as he familiarized himself with the system. The obtained preliminary results demonstrate that the proposed device was able to measure the speed of punches, their force, and even perform similar tests. This system can be used to determine all these parameters for any type of punch, except for punches which have a pushing movement. The impact of any movement aiding the punch, such as the yori Yashi (forward step)—gyaku tsuki/ kizami tsuki—can also be studied.
The proposed device had a relatively low sampling rate, hence, only a punch speed up to 8.33 m/s could be recorded. The curves obtained from the punches prove that with an increase in the punch speed, the force of the punch increased. By simulating the force distribution on all sensors by punching in different areas of the wooden platform, it was seen that the sensors recorded force more homogenously when the punch landed inside the area of the triangle formed by the sensors. As per the results shown in Figure 3c, the system worked as expected, by displaying higher force values with increasing punch speeds, increasing in a logarithmic curve pattern. Similarly, the punch speed detection module could analyze any punch in the laser’s trajectory with a speed up to 8.33 ms−1, which could be greatly improved if more expensive sophisticated data acquisition systems were used. The absolute force value of the punch was not obtained in this system since calibration of the system was achieved by placing static loads, whereas the punch is a dynamic load. Moreover, since the sampling rate was less than 134 Hz, the system was not able to record any higher peaks, which could have been missed. Studies conducted previously proved our results that gyaku tsuki punched from near the waist, rather than starting midway, produced more linear velocity of the wrist [19]. Furthermore, the faster the opposite arm was retracted, the faster the punch was [20,21]. A potential alternate way to detect punch speed would be using capacitance sensors [22]. However, as compared to capacitive sensors, diode lasers are compatible for non-contact measurement and therefore, the overall system would become robust. Using the proposed system, study of the kinematics of the arm is possible. In the future, electromyogram (EMG) signals of a particular muscle group could be correlated to the function of a punch.
The combination of an imaging system that has depth sectioning and functional imaging capabilities [23,24,25,26,27] with what is proposed here would enable us to study the blood flow change and structural damage at the point of contact.
The prime objective of this manuscript was to develop a Punch-O-Meter device, characterize it and test its feasibility for measuring both the force and the speed of a punch, simultaneously. The next step will be to test the device from a biomechanical point of view in a large population following the protocol described in previous research [28], which requires Institutional Review Board (IRB) approval. We have already started acquiring IRB approval for this study, and approval is pending.

5. Conclusions

We developed a standalone Punch-O-Meter system to measure the speed and the force generated by a punch. The arrangement of the sensors was carefully chosen based on an extensive finite element analysis (FEA) simulation. The system was used to measure the speed and the maximum force generated by a karate punch, gyaku tsuki. Developing a faster data acquisition system and testing the system in a larger population are the next steps of this project.

Author Contributions

Conceptualization, J.V. and K.(M.)A.; methodology, J.V. and K.(M.)A.; software, J.V.; validation, J.V. and K.(M.)A.; formal analysis, J.V. and R.M.; investigation, J.V. and R.M.; resources, K.(M.)A.; data curation, J.V.; writing—original draft preparation, J.V.; writing—review and editing, J.V., R.M. and K.(M.)A.; visualization, J.V. and R.M.; supervision, K.(M.)A.; project administration, K.(M.)A.

Acknowledgments

We are thankful to Hypermesh for the help in FEA simulations and the Wayne State University Machine Shop’s staff for their help in the hardware development of the proposed device.

Conflicts of Interest

The authors declare no conflict of interest.

References

  1. Arus, E. Biomechanics of Human Motion: Applications in the Martial Arts; CRC Press: London, UK, 2012. [Google Scholar]
  2. Anupam, S. Analysis of Force, Time, Energy, Psychological Demand and Safety of Common Kicks in Martial Arts, in Industrial Engineering; Iowa State University: Ames, IA, USA, 2017. [Google Scholar]
  3. Ciubucciu-Ionete, G.; Mereuta, E. Biomechanics of Karate Techniques. Ann. Dunarea Jos Univ. Galati Fascicle XV 2008, 1454, 212–216. [Google Scholar]
  4. Rathee, N.K.; Magnes, J.; Davis, J. Kinematics of Board Breaking in Karate Using Video Analysis—A Dynamic Model of Applied Physics and Human Performance. Eur. Sci. J. 2014, 10, 1857–7881. [Google Scholar]
  5. Busko, K.; Staniak, Z.; Lach, P.; Mazur-Rożycka, J.; Michalski, R.; Gorski, M. Comparison of two boxing training simulators. Biomed. Hum. Kinet. 2014, 6. [Google Scholar] [CrossRef] [Green Version]
  6. Estevan, I.; Falco, C.; Jandacka, D. Mechanical analysis of the roundhouse kick according to the stance position. A Pilot Study. In Proceedings of the ISBS-Conference Proceedings Archive 2011, Porto, Portugal, 27 June–1 July 2011. [Google Scholar]
  7. Chadli, S.; Ababou, N.; Ababou, A. A new instrument for punch analysis in boxing. Procedia Eng. 2014, 72, 411–416. [Google Scholar] [CrossRef]
  8. Girodet, P.; Vaslin, P.; Dabonneville, M.; Lacouture, P. Two-dimensional kinematic and dynamic analysis of a karate straight punch. Comput. Methods Biomech. Biomed. Eng. 2005, 8, 117–118. [Google Scholar] [CrossRef] [Green Version]
  9. Estevan, I.; Alvarez, O.; Falco, C.; Castillo, I. Self-efficacy and performance of the roundhouse kick in taekwondo. Rev. Artes Marciales Asiaticas 2014, 9, 97–105. [Google Scholar] [CrossRef]
  10. Estevan, I.; Alvarez, O.C.T.A.V.I.O.; Falco, C.; Molina-García, J.; Castillo, I. Impact force and time analysis influenced by execution distance in a roundhouse kick to the head in taekwondo. J. Strength Cond. Res. 2011, 25, 2851–2856. [Google Scholar] [CrossRef]
  11. Estevan, I.; Falco, C.; Alvarez, O.; Molina-García, J. Effect of Olympic weight category on performance in the roundhouse kick to the head in taekwondo. J. Hum. Kinet. 2012, 31, 37–43. [Google Scholar] [CrossRef]
  12. Falco, C.; Alvarez, O.; Castillo, I.; Estevan, I.; Martos, J.; Mugarra, F.; Iradi, A. Influence of the distance in a roundhouse kick’s execution time and impact force in Taekwondo. J. Biomech. 2009, 42, 242–248. [Google Scholar] [CrossRef]
  13. Buśko, K.; Staniak, Z.; Szark-Eckardt, M.; Nikolaidis, P.T.; Mazur-Różycka, J.; Lach, P.; Górski, M. Measuring the force of punches and kicks among combat sport athletes using a modified punching bag with an embedded accelerometer. Acta Bioeng. Biomech. 2016, 18, 47–54. [Google Scholar]
  14. Smith, M.S.; Dyson, R.J.; Hale, T.; Janaway, L. Development of a boxing dynamometer and its punch force discrimination efficacy. J. Sports Sci. 2000, 18, 445–450. [Google Scholar] [CrossRef] [PubMed]
  15. Walilko, T.J.; Viano, D.C.; Bir, C.A. Biomechanics of the head for Olympic boxer punches to the face. Br. J. Sports Med. 2005, 39, 710–719. [Google Scholar] [CrossRef] [PubMed] [Green Version]
  16. Karpiłowski, B.; Staniak, Z.; Nosarzewski, Z.; Ptak, C. Kontrola realizacji zadań treningowych przy pomocy trenażera bokserskiego, [Control of training task by means of a boxing simulator]. Trening 1997, 2, 159–164. [Google Scholar]
  17. Karpitowski, B.; Nosarzewski, Z.; Staniak, Z. A versatile boxing simulator. Biol. Sport 1994, 11, 133. [Google Scholar]
  18. Tekscan. FlexiForce A201 Sensor. 2016. Available online: https://www.tekscan.com/products-solutions/force-sensors/a201 (accessed on 21 June 2017).
  19. Shahbazi, M.M.; Sheikh, M.; Amini, A. Kinematic-kinetic comparisons of Tsuki technique in performing from waist and from midway in classic and individual styles. In Proceedings of the ISBS-Conference Proceedings Archive, Seoul, Korea, 14–18 July 2008. [Google Scholar]
  20. Gallaher, D.M. 3D Analysis of Punching Technique: Reverse vs. Lead (Gyaku tsuki vs. Oi tsuki). Master’s Thesis, California State University, Long Beach, CA, USA, 2014. [Google Scholar]
  21. Wąsik, J.; Da Silva, S.; Jonatas, F.; Franchini, E. Movement structure and kinetics of the traditional straight punch: Measurements in taekwon-do athletes. Ido Mov. Cult. 2013, 13, 42–47. [Google Scholar]
  22. Matko, V.; Milanović, M. Temperature-compensated capacitance–frequency converter with high resolution. Sens. Actuators A Phys. 2014, 220, 262–269. [Google Scholar] [CrossRef]
  23. Nasiriavanaki, M.; Xia, J.; Wan, H.; Bauer, A.Q.; Culver, J.P.; Wang, L.V. High-resolution photoacoustic tomography of resting-state functional connectivity in the mouse brain. Proc. Natl. Acad. Sci. USA 2014, 111, 21–26. [Google Scholar] [CrossRef]
  24. Turani, Z.; Fatemizadeh, E.; Blumetti, T.; Daveluy, S.; Moraes, A.F.; Chen, W.; Nasiriavanaki, M. Optical Radiomic Signatures Derived from Optical Coherence Tomography Images to Improve Identification of Melanoma. Cancer Res. 2019, 79, 2021–2030. [Google Scholar] [CrossRef]
  25. Mahmoodkalayeh, S.; Jooya, H.Z.; Hariri, A.; Zhou, Y.; Xu, Q.; Ansari, M.A.; Avanaki, M.R. Low Temperature-Mediated Enhancement of Photoacoustic Imaging Depth. Sci. Rep. 2018, 8, 4873. [Google Scholar] [CrossRef]
  26. Adabi, S.; Hosseinzadeh, M.; Noei, S.; Conforto, S.; Daveluy, S.; Clayton, A.; Nasiriavanaki, M. Universal in vivo textural model for human skin based on optical coherence tomograms. Sci. Rep. 2017, 7, 17912. [Google Scholar] [CrossRef]
  27. Zafar, M.; Kratkiewicz, K.; Manwar, R.; Avanaki, M. Development of Low-Cost Fast Photoacoustic Computed Tomography: System Characterization and Phantom Study. Appl. Sci. 2019, 9, 374. [Google Scholar] [CrossRef]
  28. De Souza, P.A., Jr.; Paulo, A.; Brasil, G. Hespanha, Assessing uncertainties in a simple and cheap experiment. Eur. J. Phys. 2009, 30, 615. [Google Scholar] [CrossRef]
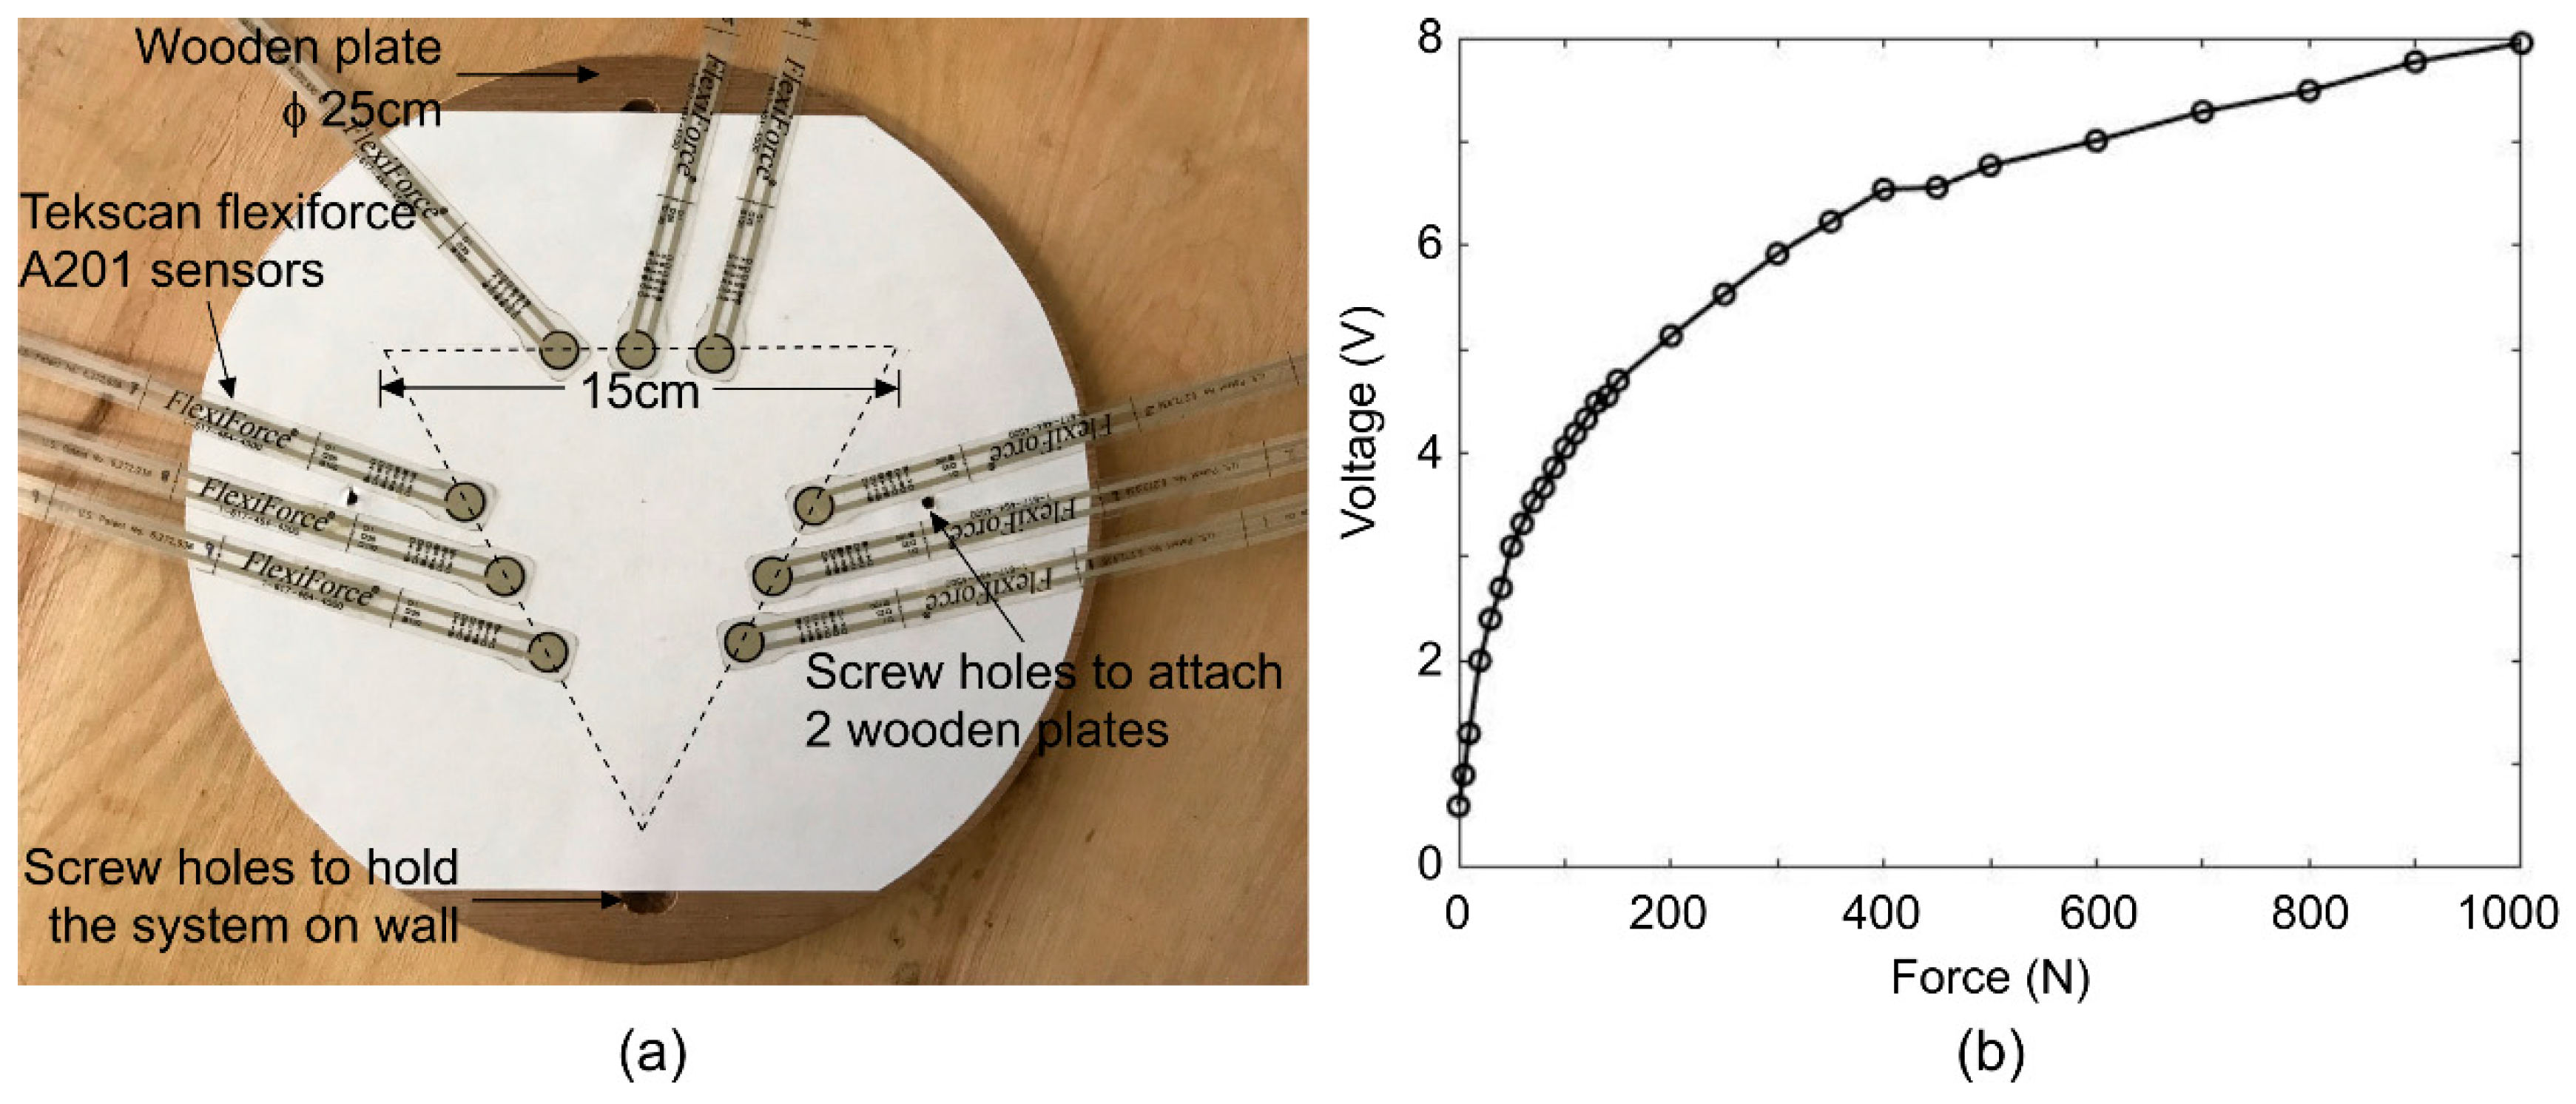
Figure 1. (a) The nine A201 Flexiforce sensors arranged along the sides of an equilateral triangle with a length 15 cm, (b) The calibration curve obtained by the Instron machine loading force on the system versus the voltage obtained.
Electronics 08 00782 g001
Figure 2. (a) Arrangement of the system on the wall and a 3D concept image of the punching structure, (b) schematic circuit diagram of the system, (c) speed detection module working principle. (1) setup initial position. (2) hand interrupts signal to sensor 1—time t1 is noted. (3) hand interrupts signal to sensor 2—time t2 is noted, (d) Punching positions of gyaku tsuki style (1) starting, (2) mid, and (3) final position. Sensors: S1-S8, Photoresistors: P1, P2, and Laser diodes: L1, L2.
Electronics 08 00782 g002
Figure 3. (a) The simulation of the different sensor configurations, (b) sensor force readings when punched on different areas on the wooden plates, (c) speed and corresponding force values of the gyaku tsuki punches.
Electronics 08 00782 g003
Table 1. Standard deviation of homogenous sensitivity for different sensor configurations.
Configuration No.Standard Deviation
114.22
222.85
331.68
423.09
519.66
623.52
725.83
812.99
913.37
1021.55
1126.81
1215.84
1327.43
1425.65
1527.93
Table 2. Maximum attainable speeds (ms−1) of the punches.
Test No.Normal gyaku tsuki
15
25.56
35.26
45.26
55.56