1. Introduction
Buildings use electricity as a source of energy in order to provide thermal comfort (cooling and heating), lighting, communication, and entertainment to their inhabitants. This consumption represents 40% of total energy consumption nowadays. Buildings are one of the major sources of energy consumption and the ratio of this energy against total energy consumption increased from 34% to 41% in 30 years (1980 to 2010) [
1]. The ratio of building energy consumption to total energy consumption increased from 33.7% to 41.1% between 1980 and 2010 in the U.S. [
2].
Higher Education institution campuses can introduce Building and Energy Management Systems (BEMS), using Internet of Things (IoT) principles, in order to provide device connectivity and introduce automation, thereby reducing energy consumption costs campus-wide, improving energy efficiency at classrooms with intelligent control of climate and lighting, and also providing means for reducing wasted energy.
Several trials have already been performed, such as at New Richmond schools in Tipp City, Ohio that saved approximately
$128,000 each year by using a web-based system that controls all mechanical equipment inside its buildings [
3]. Also saving in water can be performed with control of loses and automation for garden watering systems [
4].
Nowadays building management is possible through an easy installation of sensors with batteries (no cables or associated power issues), allowing the deployment of solutions to control energy consumption and identify actions that would introduce savings and consequently reduce costs.
The IoT economy is growing in all areas with the increasing availability of low cost sensors, research on new transmission solutions introducing longer ranges and improved power management integrated with other platforms, that store, visualize and manipulate the data providing intelligence. Forecasting agencies, such as McKinsey Global predict that this will be a market of
$6.3 trillion by 2025 [
5].
Today Building Management Systems (BMS) that provide control over specific building features such as environment conditions or access control, or Energy Management Systems (EMS) that provide control or monitoring functions over a building energy grid, are expensive, with costs of
$2.5 to
$7 per square meter [
6], making the demand for low-cost solutions rise exponentially. This fact-challenged us to create a low-cost, feature-rich and flexible Building and Energy Management System (BEMS) that we called LoBEMS (LoRa BEMS system), with an estimated cost of
$2 per square meter, equivalent to a cost reduction of 38%–78%, considering the previously mentioned values. Despite every EMS or BMS requiring an investment, payback time is reduced due to savings applied on labor costs because of the introduction of automated actions.
Traditional Building and Energy Management Systems are based on pre-defined rules created by developers or administrators who follow a traditional approach of using a general best practice, making them less effective when compared with IoT context-aware solutions, where systems perform data fusion between multiple data sources such as real-time environmental indoor sensors, external temperature, number of persons in a room and thermal performance of the building material.
Regarding communications, LoRaWAN (LoRa Wide Area Network), a protocol that provides a network stack using LoRa as the physical layer, fulfils the IoT requirements providing an addressable bi-directional communication link for long-range low power devices. LoRaWAN is available in 140 countries, and big companies like Cisco are providing commercial solutions. There are three types of LoRaWAN devices: (1) Class A, which are devices that wake up only at specific times to send data to save power and support bidirectional communication, (2) Class B, that use extra receive windows, coordinated with the network, during the downlink period in addition to two time slots specified in Class-A; and (3) Class C devices, that are always listening. They can work as emergency alerts or automation controls with the lowest latency on the downlink [
7]. The LoRa modulation technique performs better in buildings due to the ability of penetration on walls with less interference compared with others like Wi-Fi, Bluetooth, ZigBee or Z-Wave. Also, more than 80 million LoRa connected devices have already been introduced in more than 100 countries and with a CAGR (Compound Annual Growth Rate) for 100% or double each year (
https://inbuildingtech.com/smart-buildings/lora-iot-inbuilding-connectivity/).
Considering this scenario and based on previous works [
8,
9], we developed a low-cost LoRa/LoRAWAN solution to monitor building environment with the objective of cost reduction. Our work, besides the kindergarten, is also being applied in a university campus and a data centre. We aimed for the creation of a cable-free installation in order to provide an easier deployment, another objective of our work was to develop an open-source platform for the collection of sensors that would include an interface for data visualization and alerting. The platform also interacts with existing lighting, heating and cooling systems using infrared.
2. Building and Energy Management System Survey
Energy management in the context of the building is a similar system to our proposal, but traditionally these Energy Management Systems (EMS) or Building Management Systems (BMS) are based on Smart devices, Wireless Sensor Networks (WSN), and a centralized platform for data presentation and management. Example of this systems are in references [
10,
11,
12,
13], including implementations of Energy Management Systems with Wireless Sensor Networks that use ZigBee Module for communication with sensor nodes. Other works have been extended to longer ranges in the IoT paradigm utilizing the GSM/GPRS (Global System for Mobile/General Packet Radio Service) networks to remotely control the end-devices [
14,
15], but these networks have the problem of power consumption and range. We consider this a drawback for battery-powered sensors that have the advantage of avoiding installation cables. Other studies applied scheduling approaches to optimize HVAC energy consumption [
16,
17,
18]. In reference [
19], a home controller system integrated with sensor devices is responsible for aggregated energy reporting of all devices to homeowners. In reference [
20], authors create an IoT based Direct Current (DC) powered home to develop a DC distribution system encompassing all residential DC-based loads that interact with each other. However, the lack of standardized protocols and regulations were the main challenges in considering intelligent DC powered homes as a suitable replacement to Alternated Current (AC) power systems. Challenges could be overcome with IoT that will provide an integrated platform for DC powered technologies with inefficient energy distribution. Using smart meter data, this EMS can monitor and provide real-time information on home energy consumption along with online access to devices status, thus allowing remote control of devices by customers. The proposed design is based on standard Hypertext Transfer Protocol (HTTP) protocol and does not provide support for lighter-weight communication protocol like Message Queuing Telemetry Transport (MQTT) which is essential to scale up the system in order to accommodate multiple residential areas. In reference [
21], a residential gateway controller was developed with a central management system that generated an operation plan for all the connected nodes in a home network depending on weather conditions.
Additionally, the researchers in reference [
22] propose a cost modeling scheme for an optimization-based energy management model that aims at reducing energy expenses of consumers. Another study found that a Home energy management system can reduce electricity consumption by 15%, potentially with acceptable discomfort [
23,
24].
In reference [
25] the authors compiled several electricity savings studies to determine what type of feedback an energy management system should have to optimize the results, and concluded that Real-time feedback systems are the most efficient, rather than estimated or periodical feedback reports.
In
Table 1, we summarized alternative Building and Energy Management Systems, together with our proposal, taking into account the following data facts: (1) The domain of application reported in the work; (2) If it is associated with data collection in a real implementation case; (3) If a data set was provided for scientific usage and the number of years of this dataset; (4) The data collected from implemented sensors divided into utilities (electricity, water, and gas) and environment data (temperature/humidity, Gases-CO/NO
2/O
3/SO
2, this is a sensor layer description; (5) Communication layer description with the communication protocol used; (6) Application layer, associated with IoT Platform; (7) Information related to energy savings and related topics divided by automatic actions and Human actions that can be divided by in the following interactive features: (i) real time information sensor data available on mobile devices; (ii) user behavior modeling processes through any interactive applied process; (8) if the system has implemented any prediction process using collected data; and (9) If the system development is a commercial type or open source based.
So our system LoBEMS (LoRa Building and Energy Management System) is differentiated from others because we provide 3-year data set (
www.kaggle.com/brunomataloto/loems-lora) in a real scenario implementation using a LoRaWAN implementation, with real-time actions savings based on pre-defined heuristics created from data visualization. We are working on modeling user behavior towards savings with real-time and predictive information to employees.
Most works related to BEMS are based on simulations and test datasets. Our system is fully implemented and running with real-time data on a 24/7 basis. It also differentiates itself from other systems due to the amount of provided features such as automated savings and the impact caused on user behavior once they begin to interact with it.
The technology LoBEMS uses, also allows easy deployment and extended coverage from the gateway, on the other hand, ZigBee and WiFi, usually used by other BEMS, rely on proximity to the gateway.
2.1. Energy Reducing Approaches
Feedback on energy consumption at home potentially results in up to 15% in energy savings [
26]. This is a basic approach to providing information about energy consumption in a certain period. Past studies show energy savings typically fall in the region of 5%–20% [
27]. User behavior is also an important factor in this saving process of consumed energy [
28]. Report information on users shows that energy levels have the potential to be reduced with little or no impact on household well-being [
26]. Also, user reports about consumption lead them to engage in energy-saving behaviors.
Eco-feedback applications are usually based on the assumption that individuals lack awareness and understanding of how their everyday activities affect the environment [
29]. Therefore, eco-feedback applications not only present the amount of consumed or conserved energy as feedback, but also have the potential to point out the consequences of this consumption on the environment. Further, eco-feedback applications can provide comparisons between a user’s consumption vis-à-vis that of their neighbors and friends, as well as disclose devices or activities that are energy intensive. The manner in which individuals will react to the information content of the feedback provided is largely dependent on their motivation to conserve energy. A recent survey [
30] performs a systematic overview of current approaches in this topic divided into conceptual and experimental approaches. Taking into account the experimental studies, most of these studies focus on exploring and identifying challenges in user behavior modification towards savings actions. But few on commercial applications and it is hard to identify long term savings based on user behavior. Our approach was to perform an automatization process of savings actions, taking into account locally collected data. The collected data can be manipulated in pre-defined templates (this can be used in any system) into reports that allow users to extract heuristics. Most important savings are achieved with the heating/cooling system working times, but we can also apply saving rules to lights and other electrical appliances. These working rules can be programmed to work automatic using infrared remote commands on air conditioners or even with the application of an openADR standard [
9,
31]. This protocol allows the remote turn on/off and any appliance that has this standard implemented. Also, these heuristics can be applied during any system phase, since they do not require any previous data.
2.2. Remote Actions
Electrical appliance interaction is a problem due to the diversity of suppliers and missing standardization. These remote actions can be performed automatically and allow savings because they perform on a regular basis without failures. We developed tools based on collected data to perform actions in an automatic way with pre-defined programmed rules. In this work, we perform remote interaction with local A/C using infrared, but it is possible to perform these actions using OpenADR (
https://www.openadr.org), standard defined by the open alliance for the problem of demand response [
32]. One appliance has this protocol implemented and on/off commands can be performed. This approach allows for continuous saving (programmed based) without failures.
3. Internet of Things Platform Proposal
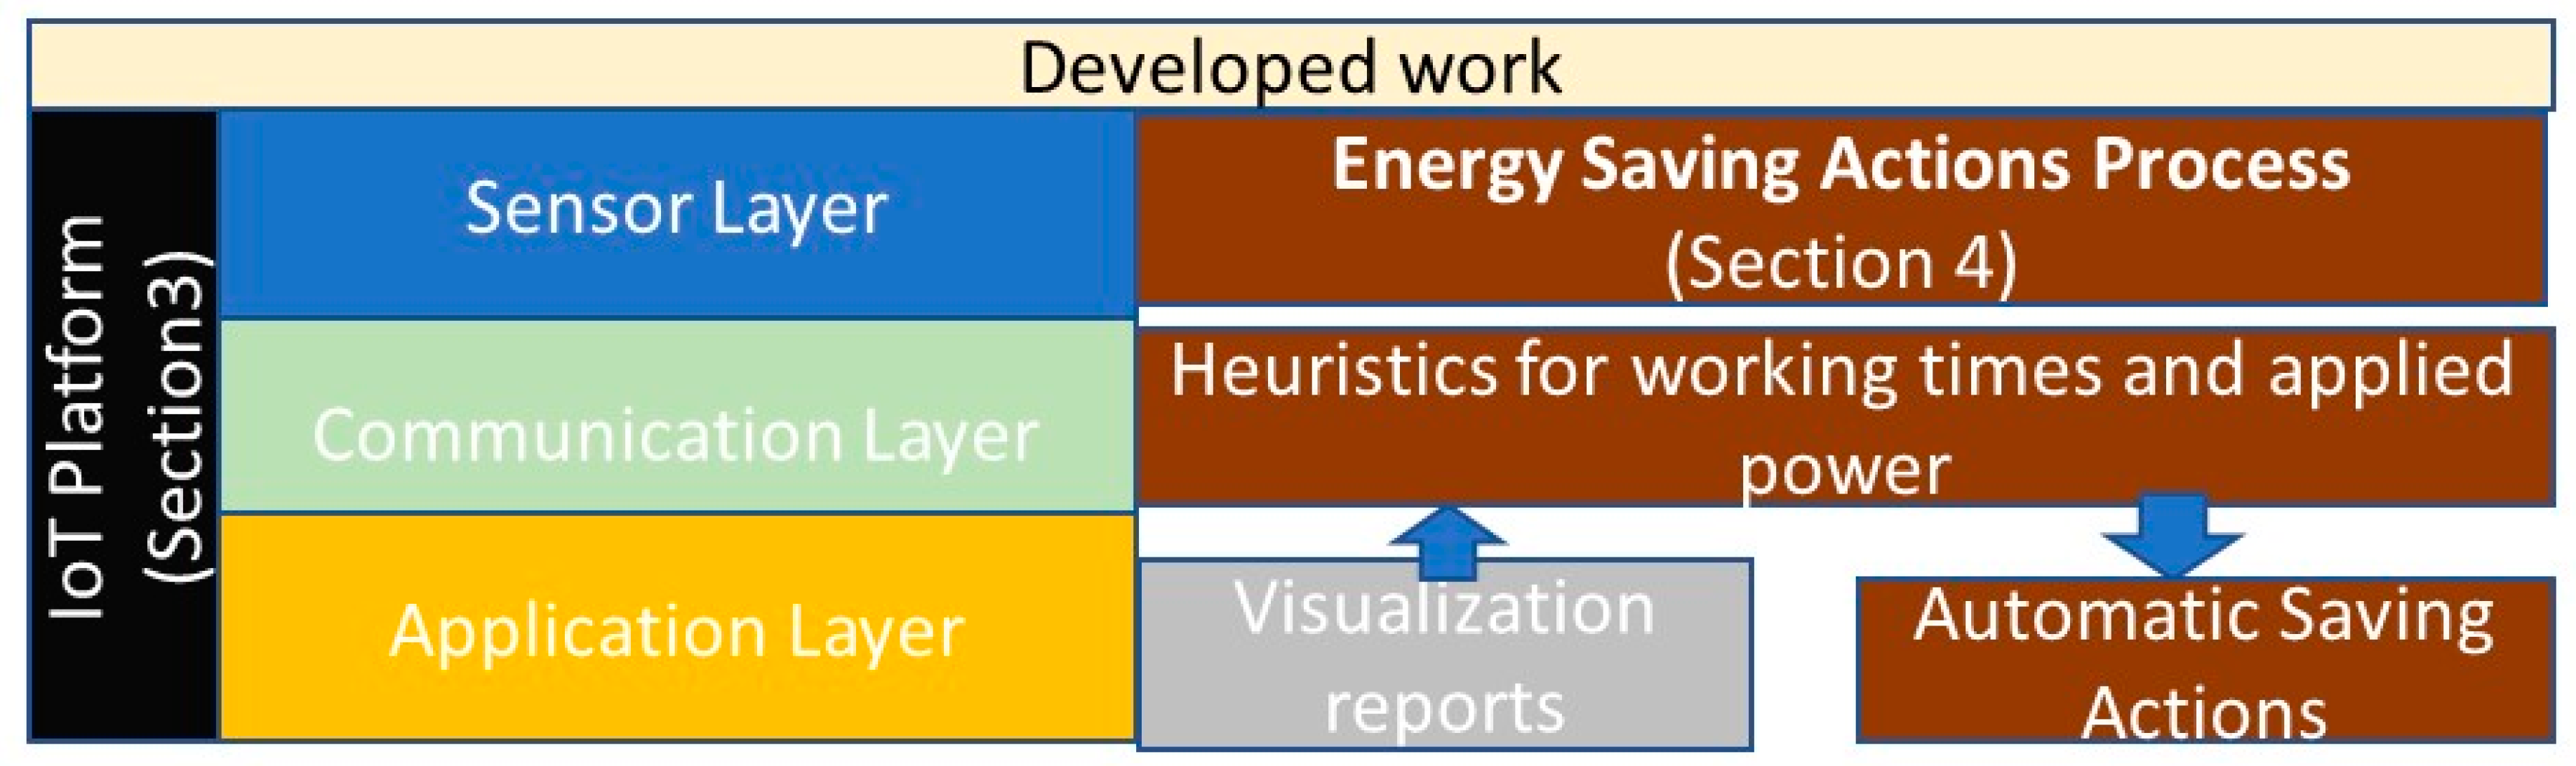
Our platform follows the principles of system integration through a common platform for multiple devices, all these devices transmit data to the platform using the Internet of Things (IoT) related technologies. The proposed system can be structured in 3 separated layers, see
Figure 1, the Physical layer with the sensors and actuators, the Network layer with all the IP and LoRa communications and finally the Application layer where all the data is fused, processed and displayed. In
Section 4, the developed work towards the implementation of an energy saving actions process is presented.
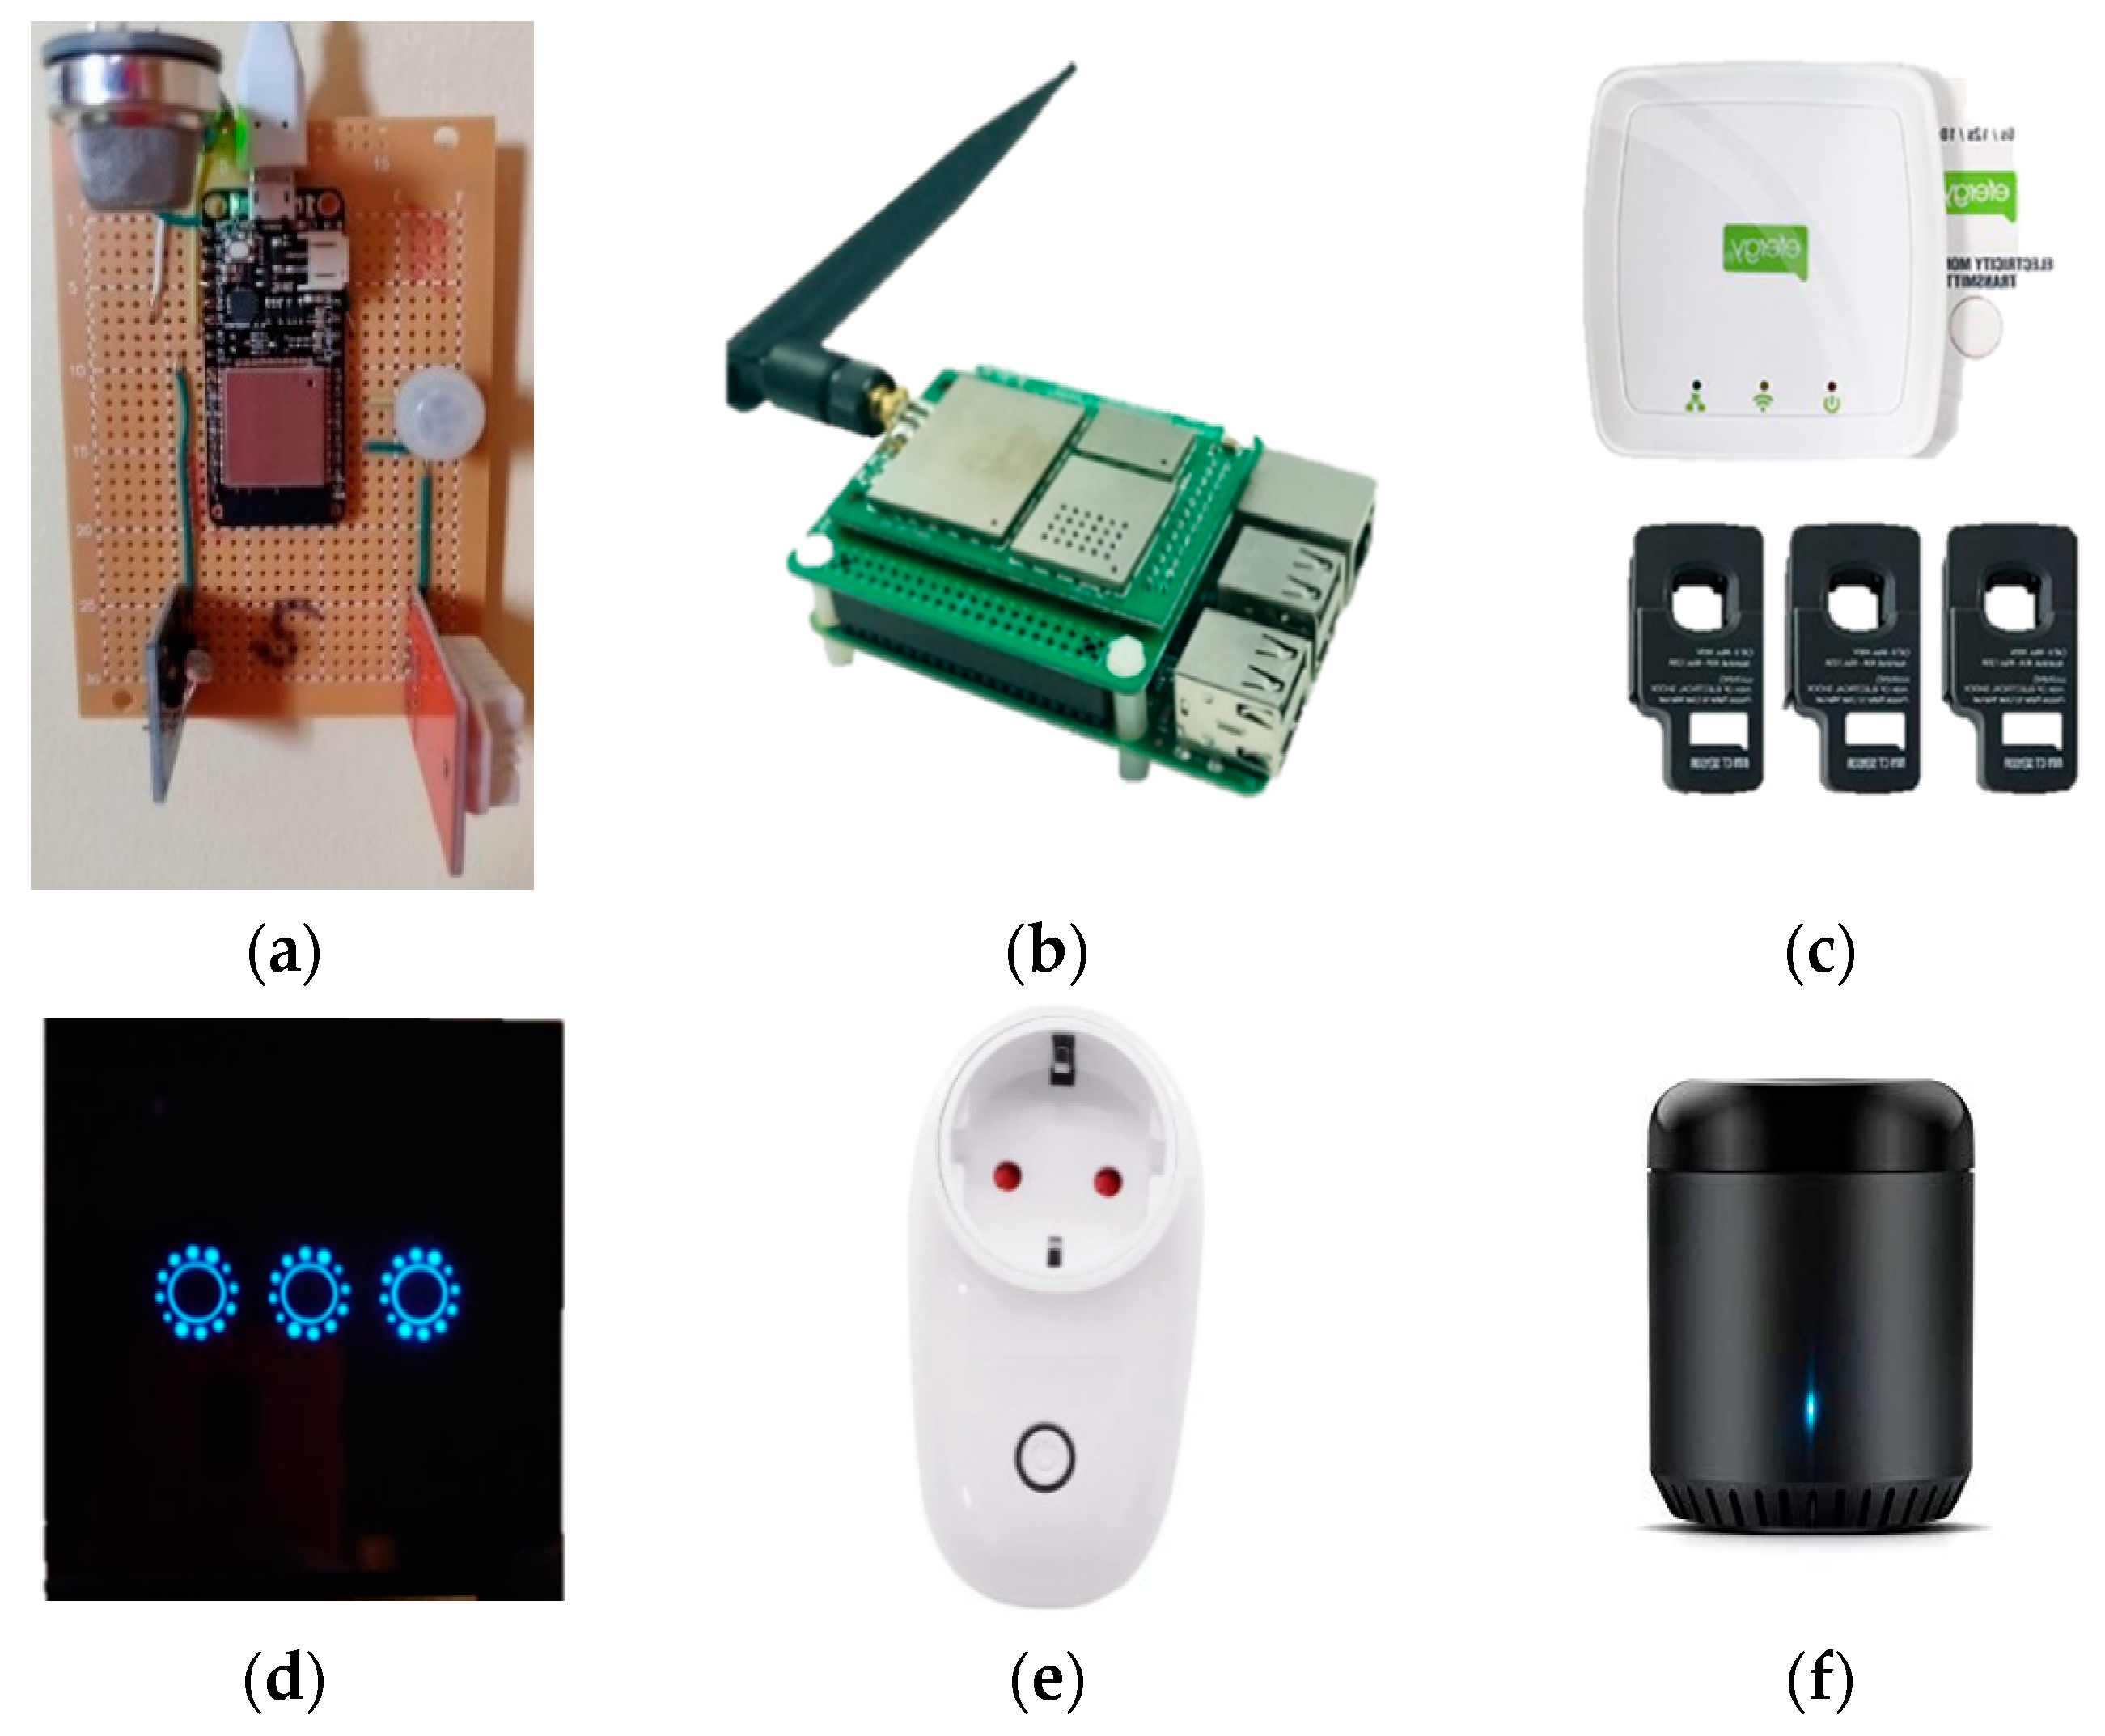
The platform can be deployed to any building in any place. As major requisites, we identify the following: (1) The need for a local person that manages the place with the ability to use graphics configuration templates and from this customize data representation identify savings rules; (2) Energy monitor process with Current transformers (CT) sensors need space at switchboards or there is a need to perform installation changes; (3) The installation of the sensors in
Figure 2a, since they are battery power is based on wall assembly with hot glue, see
Figure 3; (4) There is also the need for Lora communication; if it is not available, it is possible to buy a small gateway or assemble one with a Raspberry PI (
Figure 2b), like in our study case; (5) Heating/cooling system remote interaction is mandatory; we integrated a solution with infrared commands, but others can be applied like the OpenADR (
https://www.openadr.org) implementation for on/off commands, using local equipment Application Programming Interfaces (API).
Figure 3 shows an example of an installation in our validation case that we will describe in
Section 5.
The proposed system can be structured in 3 separated layers, the Physical layer with the sensors and actuators, the Network layer with all the IP and LoRa communications and finally the Application layer where all the data is fused, processed and displayed.
3.1. Physical Layer
The developed board (
Figure 2a), consists of 4 different types of sensors, temperature/humidity with a DHT22 sensor, light with a photoresistor sensor, motion with a Passive infrared (PIR) sensor and air quality with a MQ-135 sensor suitable for detecting of Ammonia (NH
3), nitrogen oxide (NO
x), alcohol, Benzene, smoke, Carbon Dioxide (CO
2), all connected to a SoC powered by a Lithium Polymer battery with a capacity of 2400 mAh and a small solar panel to restore its power over time, since the sensors are configured to send data every 5 min.
The hardware equipment was chosen based on the following principles: (1) Assembly flexibility —how easy is it to assemble from of-the-self components; (2) Accuracy and Versatility—how the sensors perform and what is their form factor; (3) Price—Low cost; (4) Modularity—Compatibility with other hardware ecosystems; (5) Power—Low/optimized consumption devices.
For Flexibility to assembly (1), simple and low-cost sensors were chosen, mostly used for development with Arduino and other microcontrollers, that can be easily attached to the microcontroller using jump wires, or as in our case, soldering to an empty circuit board.
To evaluate accuracy and versatility (2) multiple sensors were tested throughout the project development, and some of them had to be excluded due to unreliable outputs and low quality, such as the temperature/humidity sensor “DHT11” that had a precision of ±2 °C, whose output was compared with a highly sensitive IR temperature thermometer. The light sensor was tested under different light conditions such as natural light only, artificial light only or both, and the motion sensor was tested for false positives (when the output is one but it should be zero). The air quality sensor was calibrated by the manufacturer, but we also tested it with a few substances such as alcohol.
For Price—Low cost (3), the LoRa board that we used costs €13 and each sensor costs €2 on average. Comparing with commercial solutions, our developed board has a much lower cost.
Since the LoRa board is fully programmable and customizable, the platform is able to send all the necessary information over the LoRa network and access it from multiple applications such as Node-Red or IFTTT and all the APIs it provides.
One of LoRa’s best features is the extremely low power consumption (5) required to transmit the data, and since when the board is not transmitting, during a sleep mode state, the average power consumption is 3.1 mA, meaning that a 2400 mAh can power the sensor for a month, while other WiFi approaches such as an ESP32 microcontroller, spend 230 mA on average. These values were measured on the Lab for several weeks by storing the battery voltage on a database. The WiFi board consumption value was also measured using a similar code with the same working periods.
A detailed power consumption evaluation of the LoRa board was performed at the lab, by comparing the battery duration with the amount of data sent by the sensors and the periodicity. The results concluded that increasing periodicity to 10 min (the double), also doubles the battery duration as expected, because during sleep mode the board spends only 0.005 mA which means that only 0.16% of the energy is spent on sleep mode, while 99.84% of the energy is spent when it sends data to the gateway.
To test the effects of reducing the size of the messages sent by the board, sensor’s values were encoded using simple arithmetic operations, for instance, the humidity reading was divided by four in order to reduce the size of the number and therefore optimize the payload sent over LoRa.
We managed to cut the message size by half and the results prove that battery duration was extended more than two and half times. This can be explained because the board sending time is reduced and since the message is smaller, the microcontroller processes it faster and therefore spends less energy, 2.3 mA on average.
We can assume, based on our experiments, that payload size optimizations have slightly more impact than changing the sending periodicity, however, if combined together, this approach can extend the battery duration much more than previously expected.
The Raspberry Pi, (
Figure 2b) is the core of the system, functioning as a LoRaWAN gateway and as an application server LoRaWAN connection with The Things Network (TTN), data processing and storage functions.
The energy system (
Figure 2c) is an ongoing solution that uses 3 amperometric clamps attached to the main power cables to detect the current that is passing throw them and sends the data over the Internet to a dedicated web platform. This solution will be integrated into our system.
Smart wall switches, (
Figure 2d) work as an interface between the ceiling lights and WiFi, and the same with smart sockets, (
Figure 2e) and appliances, allowing their control over the Internet and therefore the automation system.
A WiFi controlled device that emits infra-red signals, (
Figure 2f) will be used to send commands to air conditioning units, mimicking their remote control. This device captures Infrared signals and stores them as commands. Each command works as the A/C remote buttons, allowing the system to change each parameter independently such as fan speed, temperature, or working mode (winter/summer/dehumidifier).
Table 2 summarizes each device function and communication type.
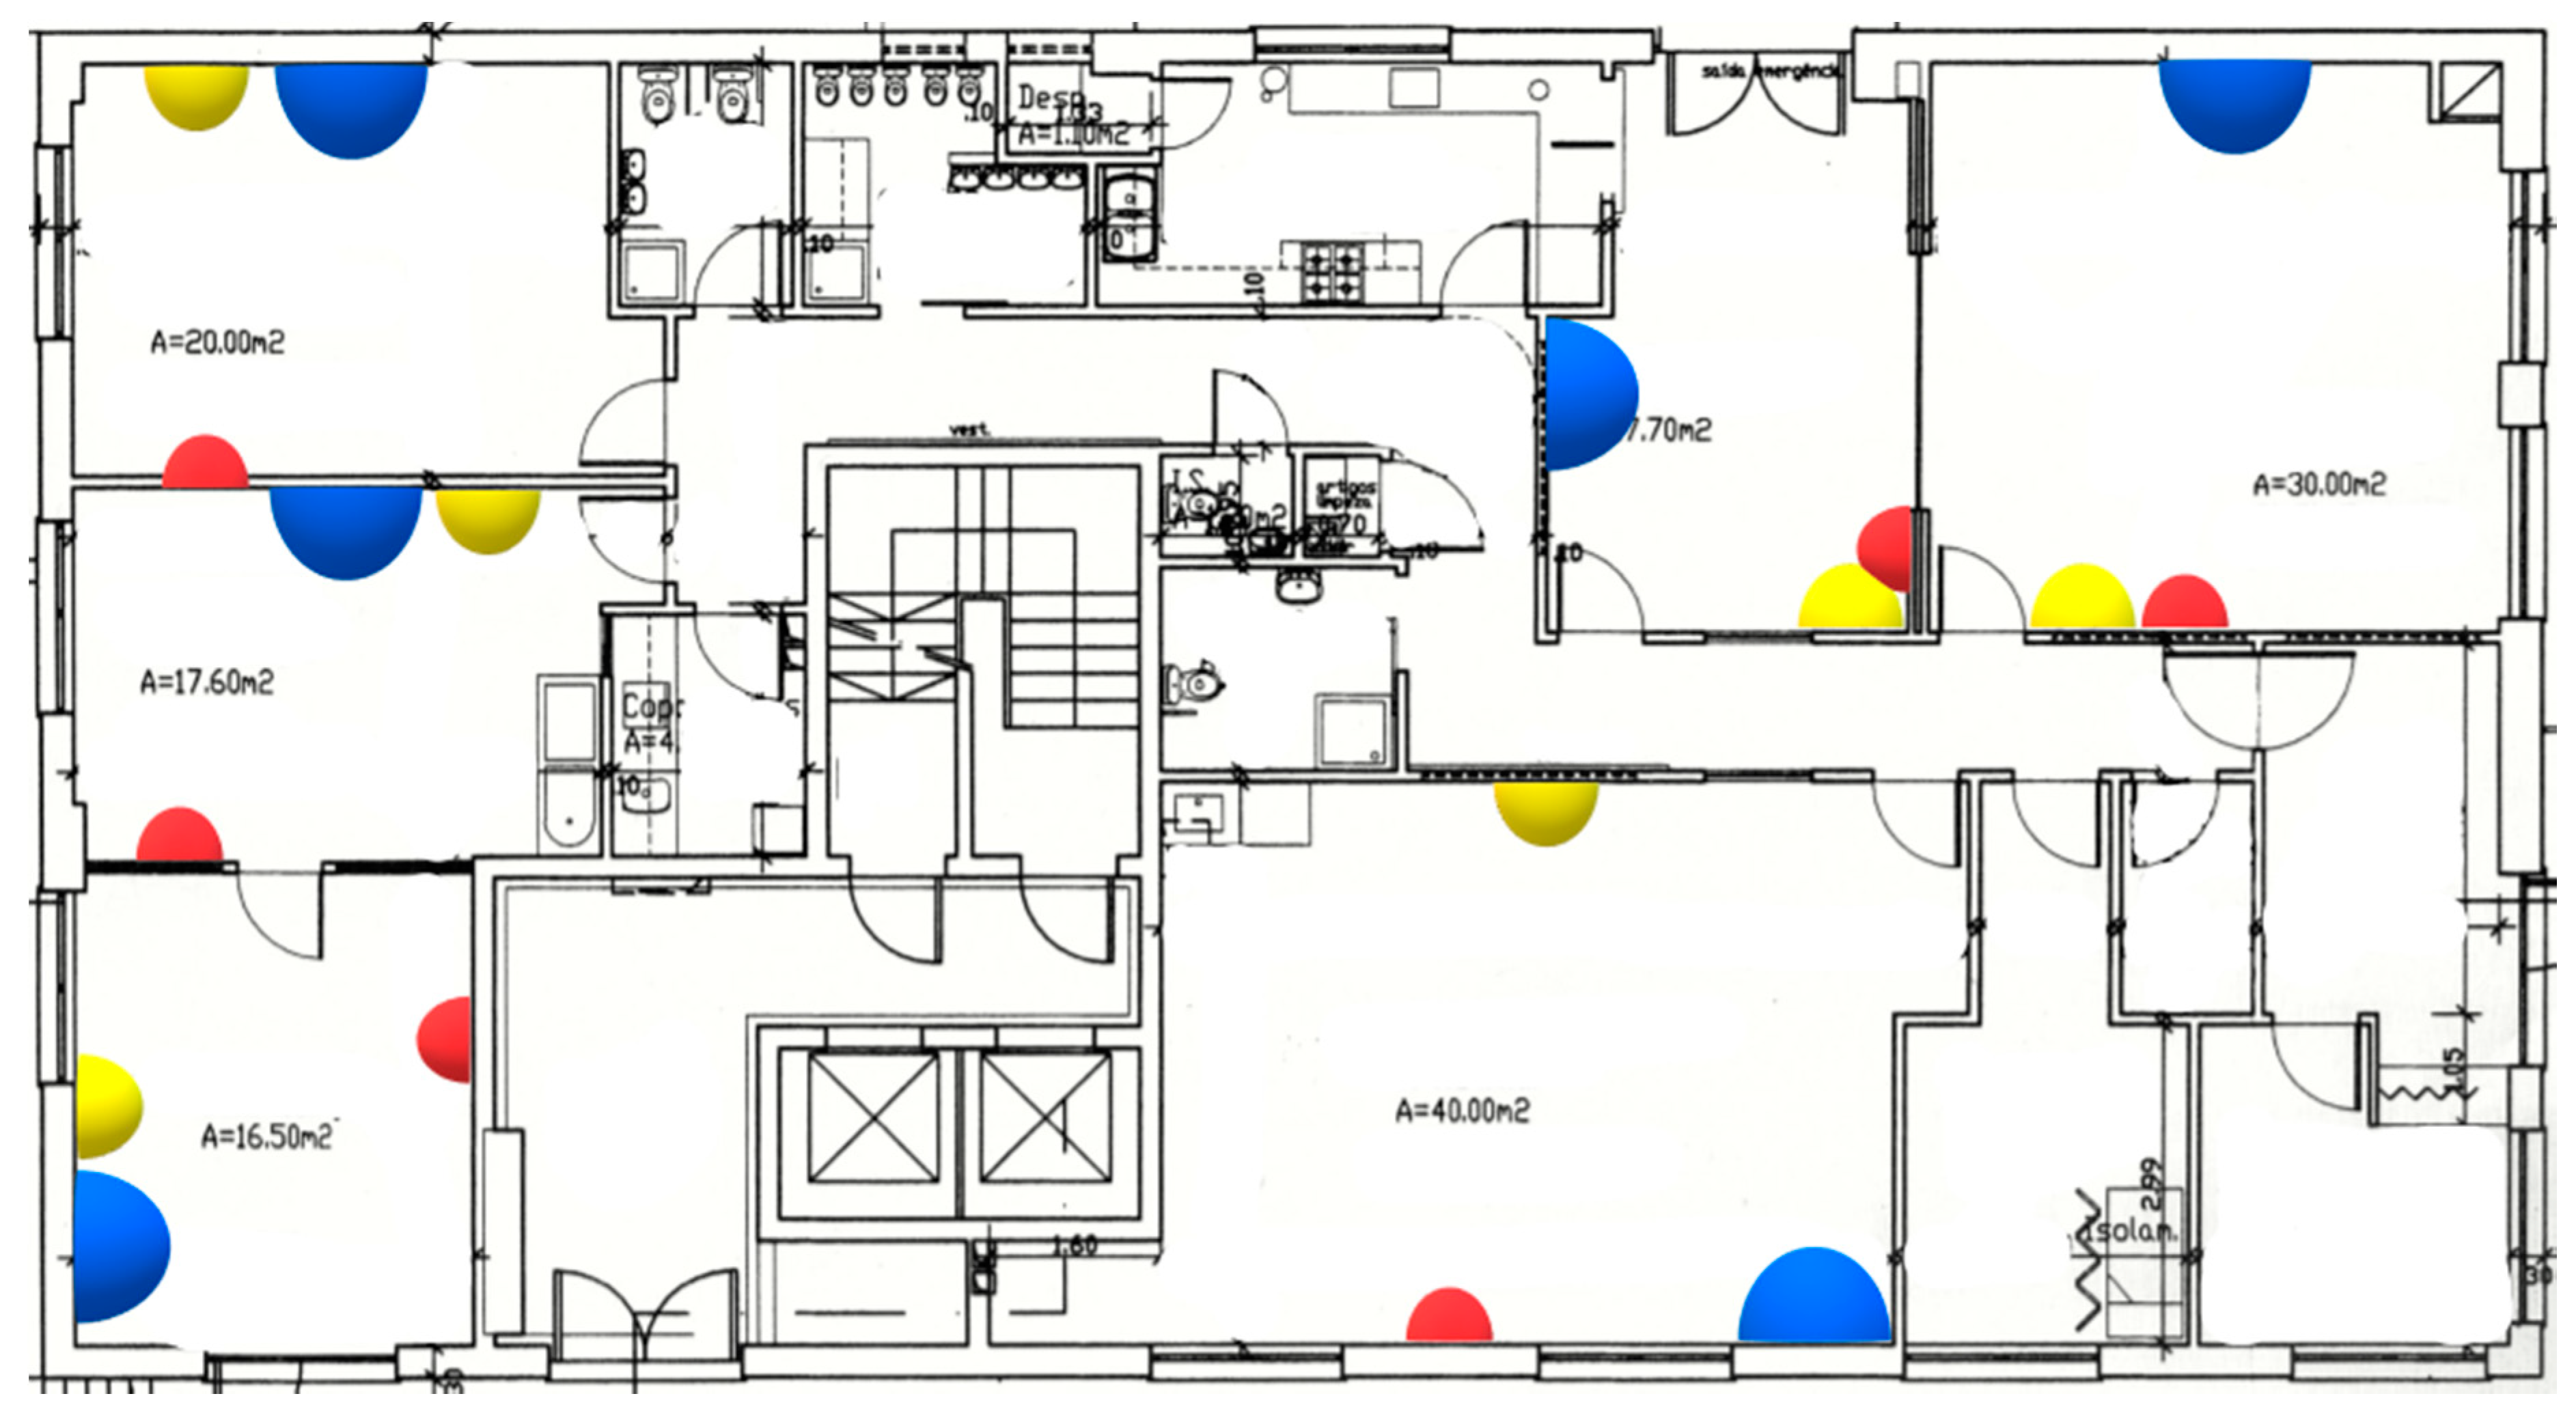
Figure 3 presents the blueprint of our case study building, a kindergarten, with the chosen hardware locations. The sensors (marked in yellow) were placed where it would be easier to detect motion. It was also considered the solar orientation because of the solar panels minimum required light, to allow the batteries to be recharged, the A/Cs position (marked in blue), to avoid false sensor’s readings and the line of sight between the Infra-Red emitters (marked in red) and the A/C receiver.
3.2. Network Layer
The entire system depends on 3 wireless communications protocols, LoRaWAN, WiFi and IR.
LoRa uses ISM bands (868 MHz in Europe, 915 MHz in North America, 433 MHz in China), however in order to improve SNR and providing long ranges (approximately 18.5 km in rural areas and 6.5 km in urban areas [
25]), it only supports an extremely low data rate. This limitation is of little relevance when we refer to IoT devices, as sensors do not require very low latency or high-frequency transmissions [
33].
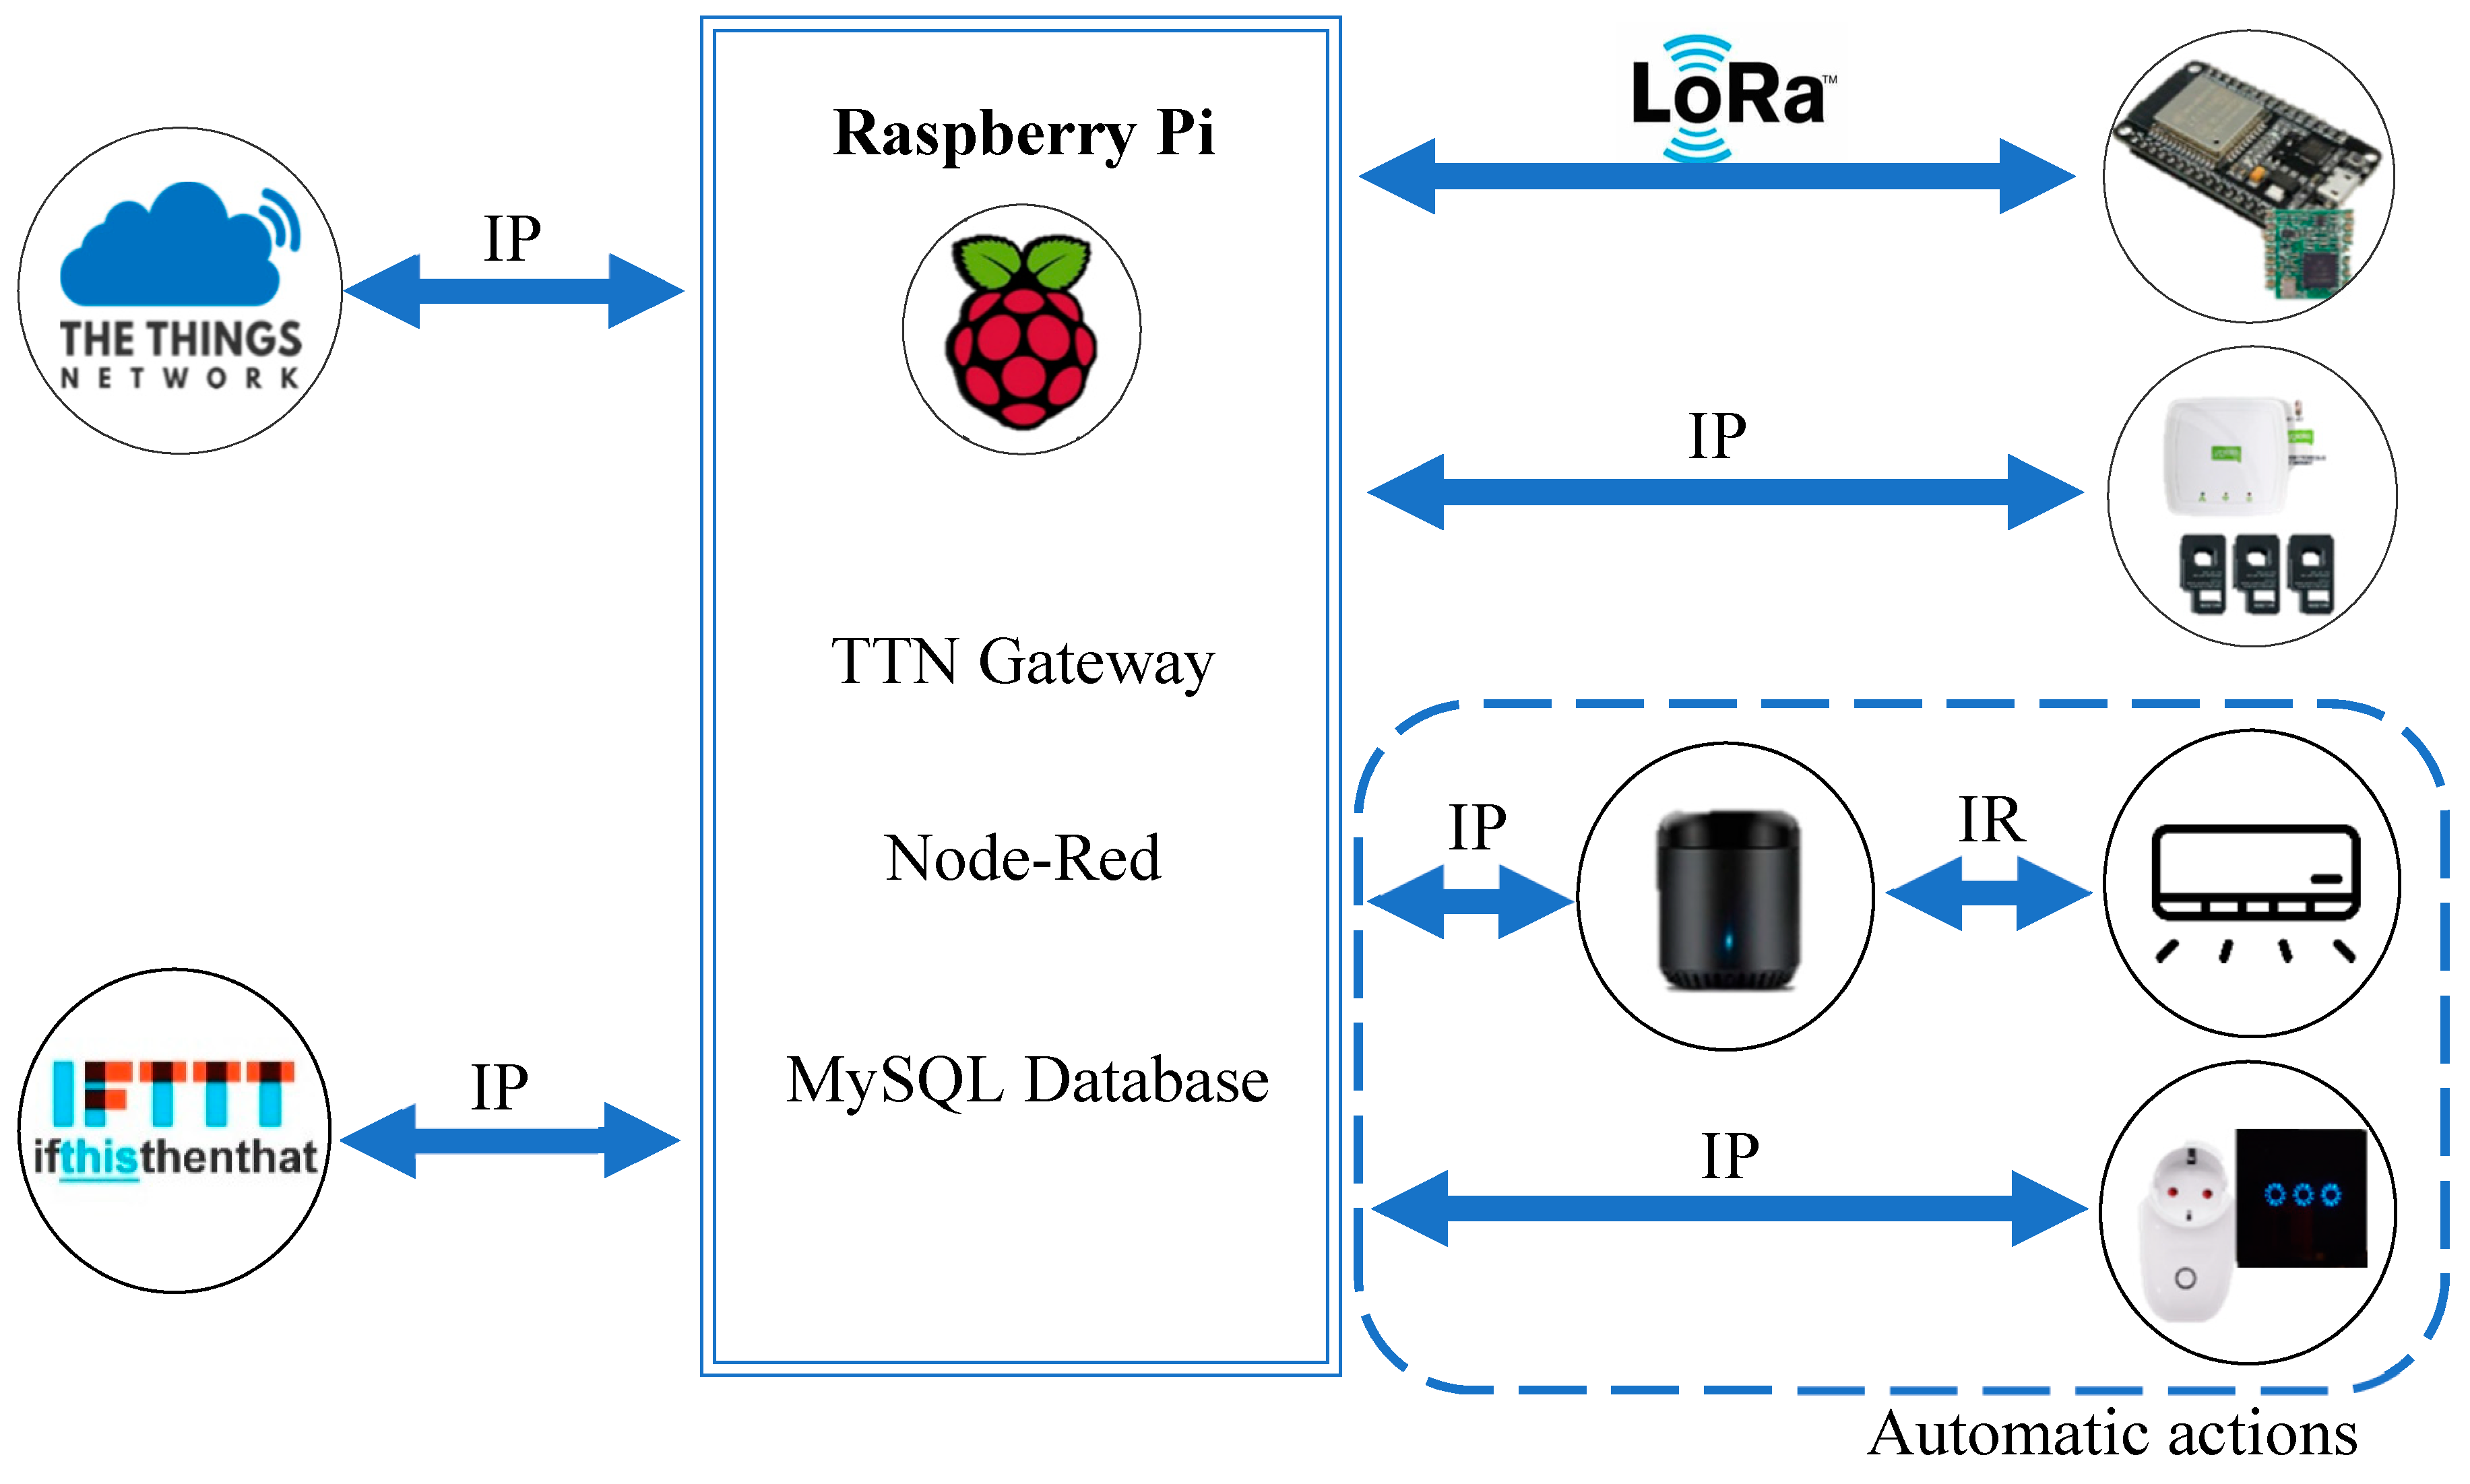
A schematic of the project communication network is shown in
Figure 4.
The LoRaWAN protocol is used to establish a connection between Class A sensors and the LoRa gateway running on the Raspberry Pi as previously mentioned.
As a member of the LoRa Alliance, The Things Network, or TTN, is a worldwide project focused on developing open access and secure IoT network based on LoRa technology and LoRaWAN protocol [
34]. One of TTN’s best feature is the possibility of creating a Gateway with relatively cheap and readily available hardware. The software setup is fully documented and, in a few hours, the Gateway is ready to receive and send messages from/to sensors.
Each sensor is added on the network using the TTN console that provides a user-friendly interface to make device management as easy as possible. It also allows the integration of a variety of services such as HTTP, however, the Application server that will be used is going to connect directly to TTN.
TCP/IP over WiFi will connect all the other devices, actuators and energy monitoring system to the Raspberry Pi, where HTTP requests will be originated to change devices states.
If This Then That, or IFTTT, is a free Web platform that allows the interaction between services and dozens of different Application programming interfaces (APIs) provided by many manufacturers all around the world, like weather service, time service, HTTP service, voice assistant APIs or smart devices APIs.
As both are IR emitters, WiFi switches and power sockets require interaction with their API to be remotely controlled. This is done using IFTTT HTTP service, and all notifications are also sent using IFTTT email services.
3.3. Application Layer
The Raspberry Pi is where services and applications run (aside gateway functions). These include instances of Node-RED and Maria-DB.
Node-RED is an open source software available for many platforms including the Raspberry Pi. It is a flow-based programming software, created specifically for IoT applications where it is possible to connect APIs, physical devices, other network interfaces and web services. It also allows the programming of rules in JavaScript to run or keep from running specific flows or the installation of extra features such as a TTN node that provides connectivity to TTN. Node-RED will also connect to a local MySQL database where all the data will be stored. Temperature, humidity, light, motion, air quality values and other variables for each classroom will be acquired and stored locally and will allow data extraction at a later stage. A set of reports were developed and main applied results are shown in
Section 5.
5. Implementation at a school
As technology progresses and people become aware of all the new possibilities for well-being improvement, energy savings and resource management, local companies try to invest and obtain visible results.
In reference [
36], the authors studied what encourages people to increase their home’s efficiency, and how they attempt to do it. Most popular approaches are focused on home renovations to decrease energy costs, however, people don’t know how much energy it is possible to save by reducing the defined A/C temperature difference, compared to the outdoor temperature, or the potential a building and energy management system has to increase savings and automate some actions.
In our case study, the owners were already taking measures to increase the school’s efficiency and reduce energy costs, however, they were also aware of technology’s potential to increase both savings and comfort, and that awareness led them to immediately accept the project.
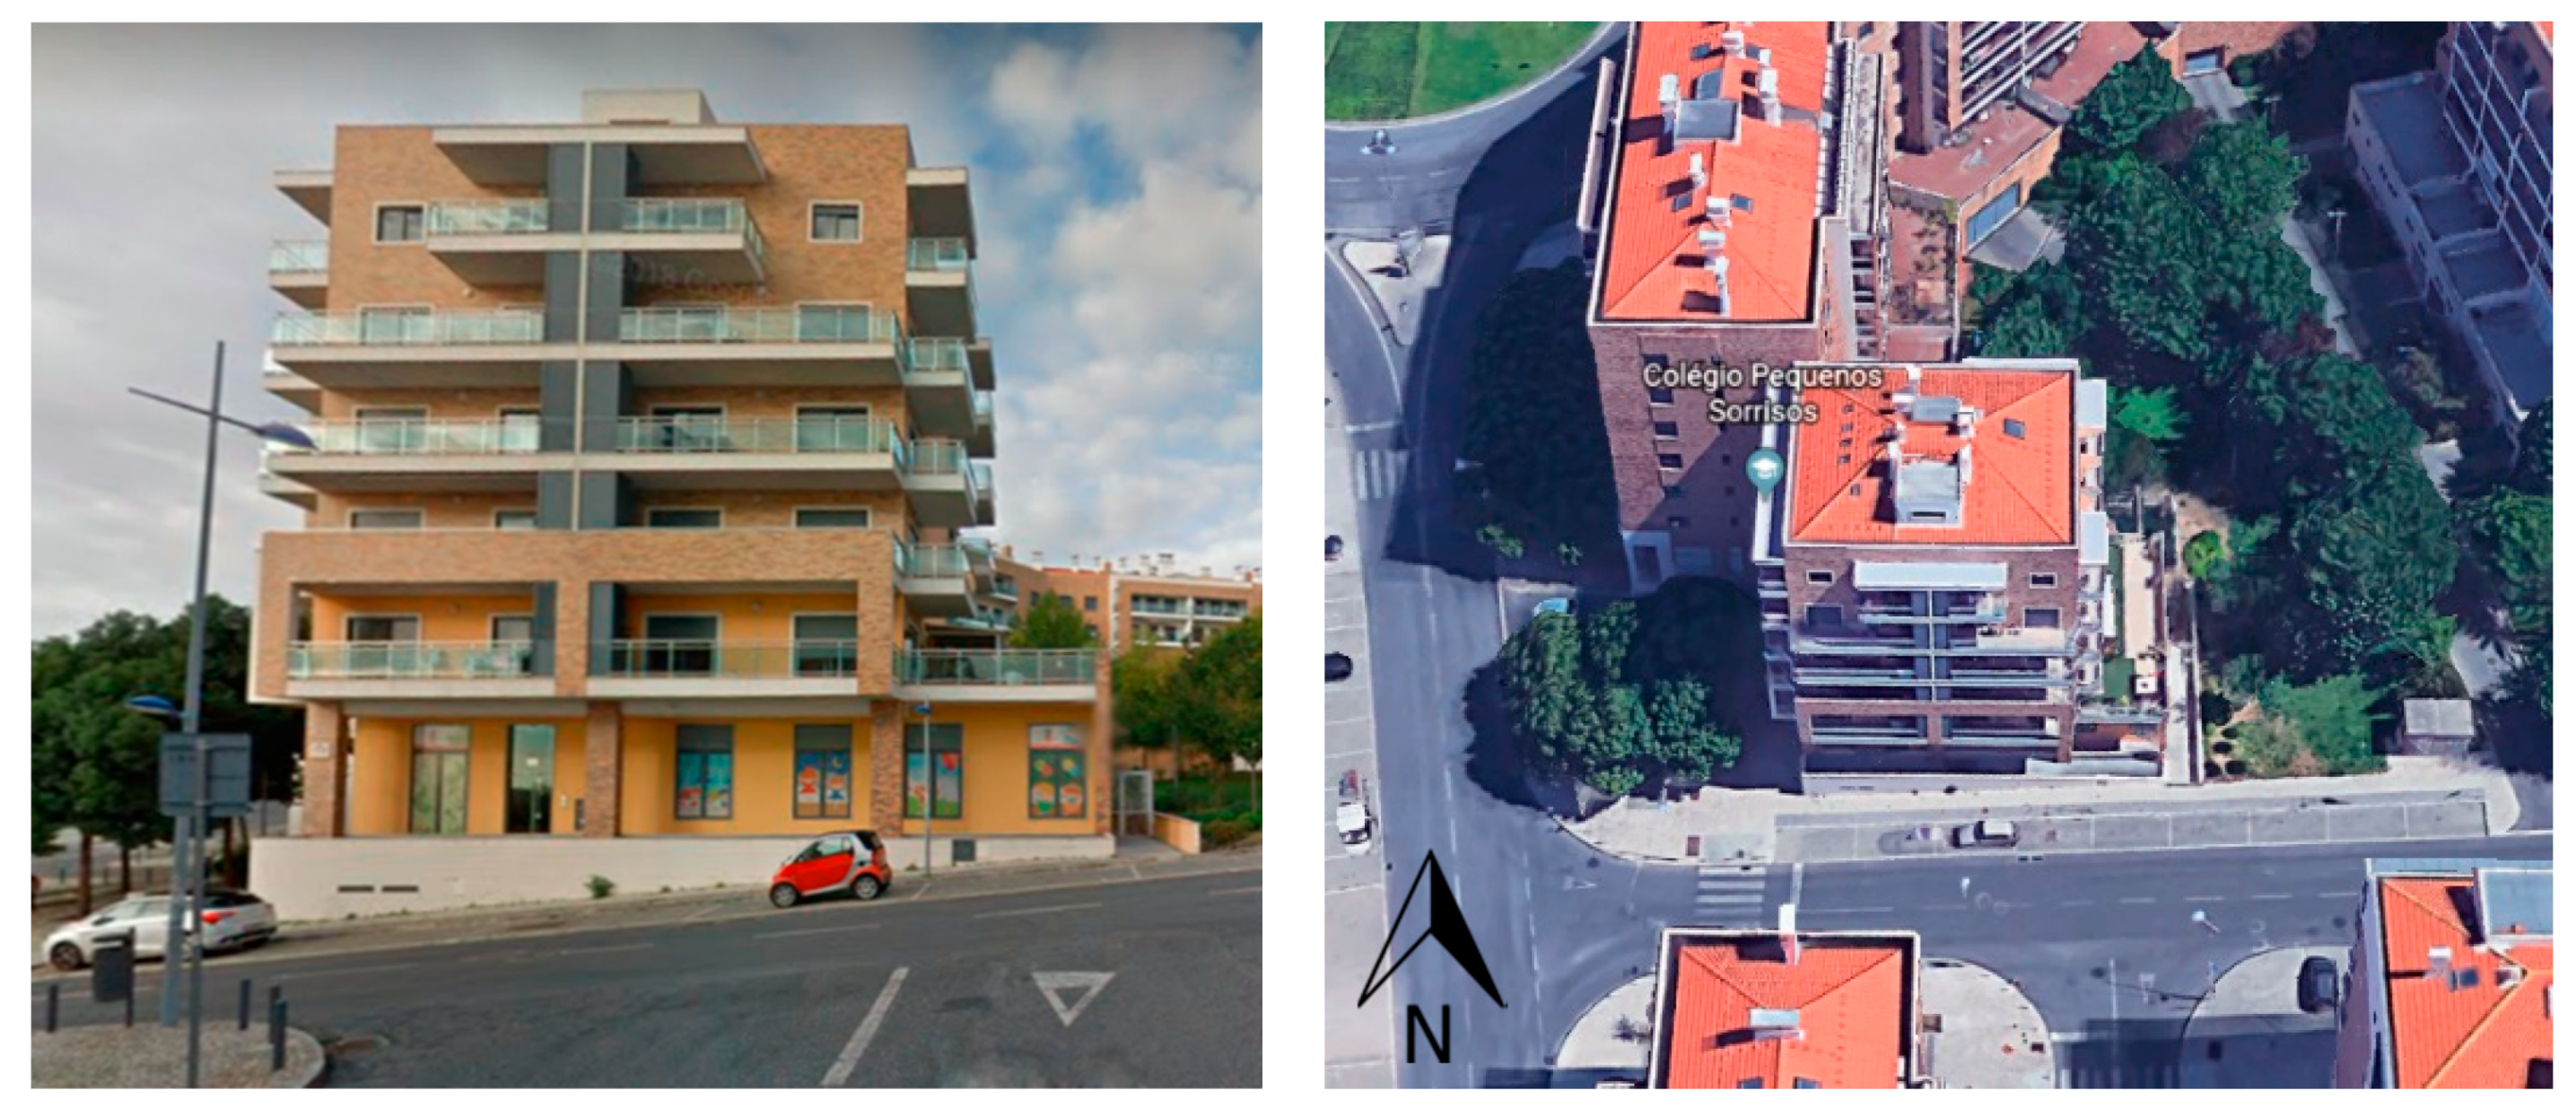
“Pequenos Sorrisos, Lda.”, a private kindergarten (
Figure 7) with 50 students and 12 rooms of 16 to 40 m
2 located at Amadora, Lisbon, Portugal, (latitude 38.7664 and longitude −9.2388) has been working on a sustainability project since 2016, which includes a real-time energy monitoring platform available on the market, total information digitalization and total lighting systems upgrade to LEDs. The building was constructed in 2007 and it has natural light from all sides, despite being currently surrounded by vegetation, as shown in
Figure 7. The kindergarten also has electric blinds that are open during working hours.
This case study was chosen because the building category is related to our work environment and it presents appropriate dimensions for our project deployment. The owners gave us the opportunity to design and implement the system following their guidelines, and conduct our project, potentially increasing the quality of education in our city in the process.
Some detected issues were related to standby consumptions, however, the main part of the energy bill was due to kitchen appliances and the air conditioning system.
In reference [
37] the authors present an “overheating risk and thermal comfort assessment of a prototype building to understand what causes a major impact on the building environment and how it affects the occupant’s comfort and health”. The authors concluded that besides the number of people using each room, the building construction materials can have different capacities to absorb heat and therefore increase or reduce the time it takes for the building to heat up or cool down. Also, the building orientation has a major impact on the environment inside because facades more heavily exposed to direct sunlight can heat up much faster than others. It was also concluded that human interaction can reduce the impact of these factors, for instance, opening the windows when the outdoor temperature is more comfortable and the air flow can regulate indoor temperature.
Since our case study building has windows from all sides, solar exposure could be a problem, however, the vegetation around the North, East and West facade, keeps most direct solar radiation from reaching the windows. Each classroom at the kindergarten has a different capacity, so it is expected that it will affect each room’s temperature and humidity. As the authors in reference [
37] also concluded, on our case study, employees did not know when to use natural ventilation, and sometimes, they would open the windows with much less comfortable temperatures outside, or even with the A/C turned on.
As dealing with standby energy consumption was unavoidable, replacing kitchen appliances would introduce higher costs and because managing the air conditioning system is very time consuming and reliant on staff behavior, the owners agreed to integrate a LoRa intelligent automation system to monitor each room’s conditions and interact with the air conditioning system, the lighting (which was often unintentionally left on), and smart WiFi sockets, based on the collected and processed information.
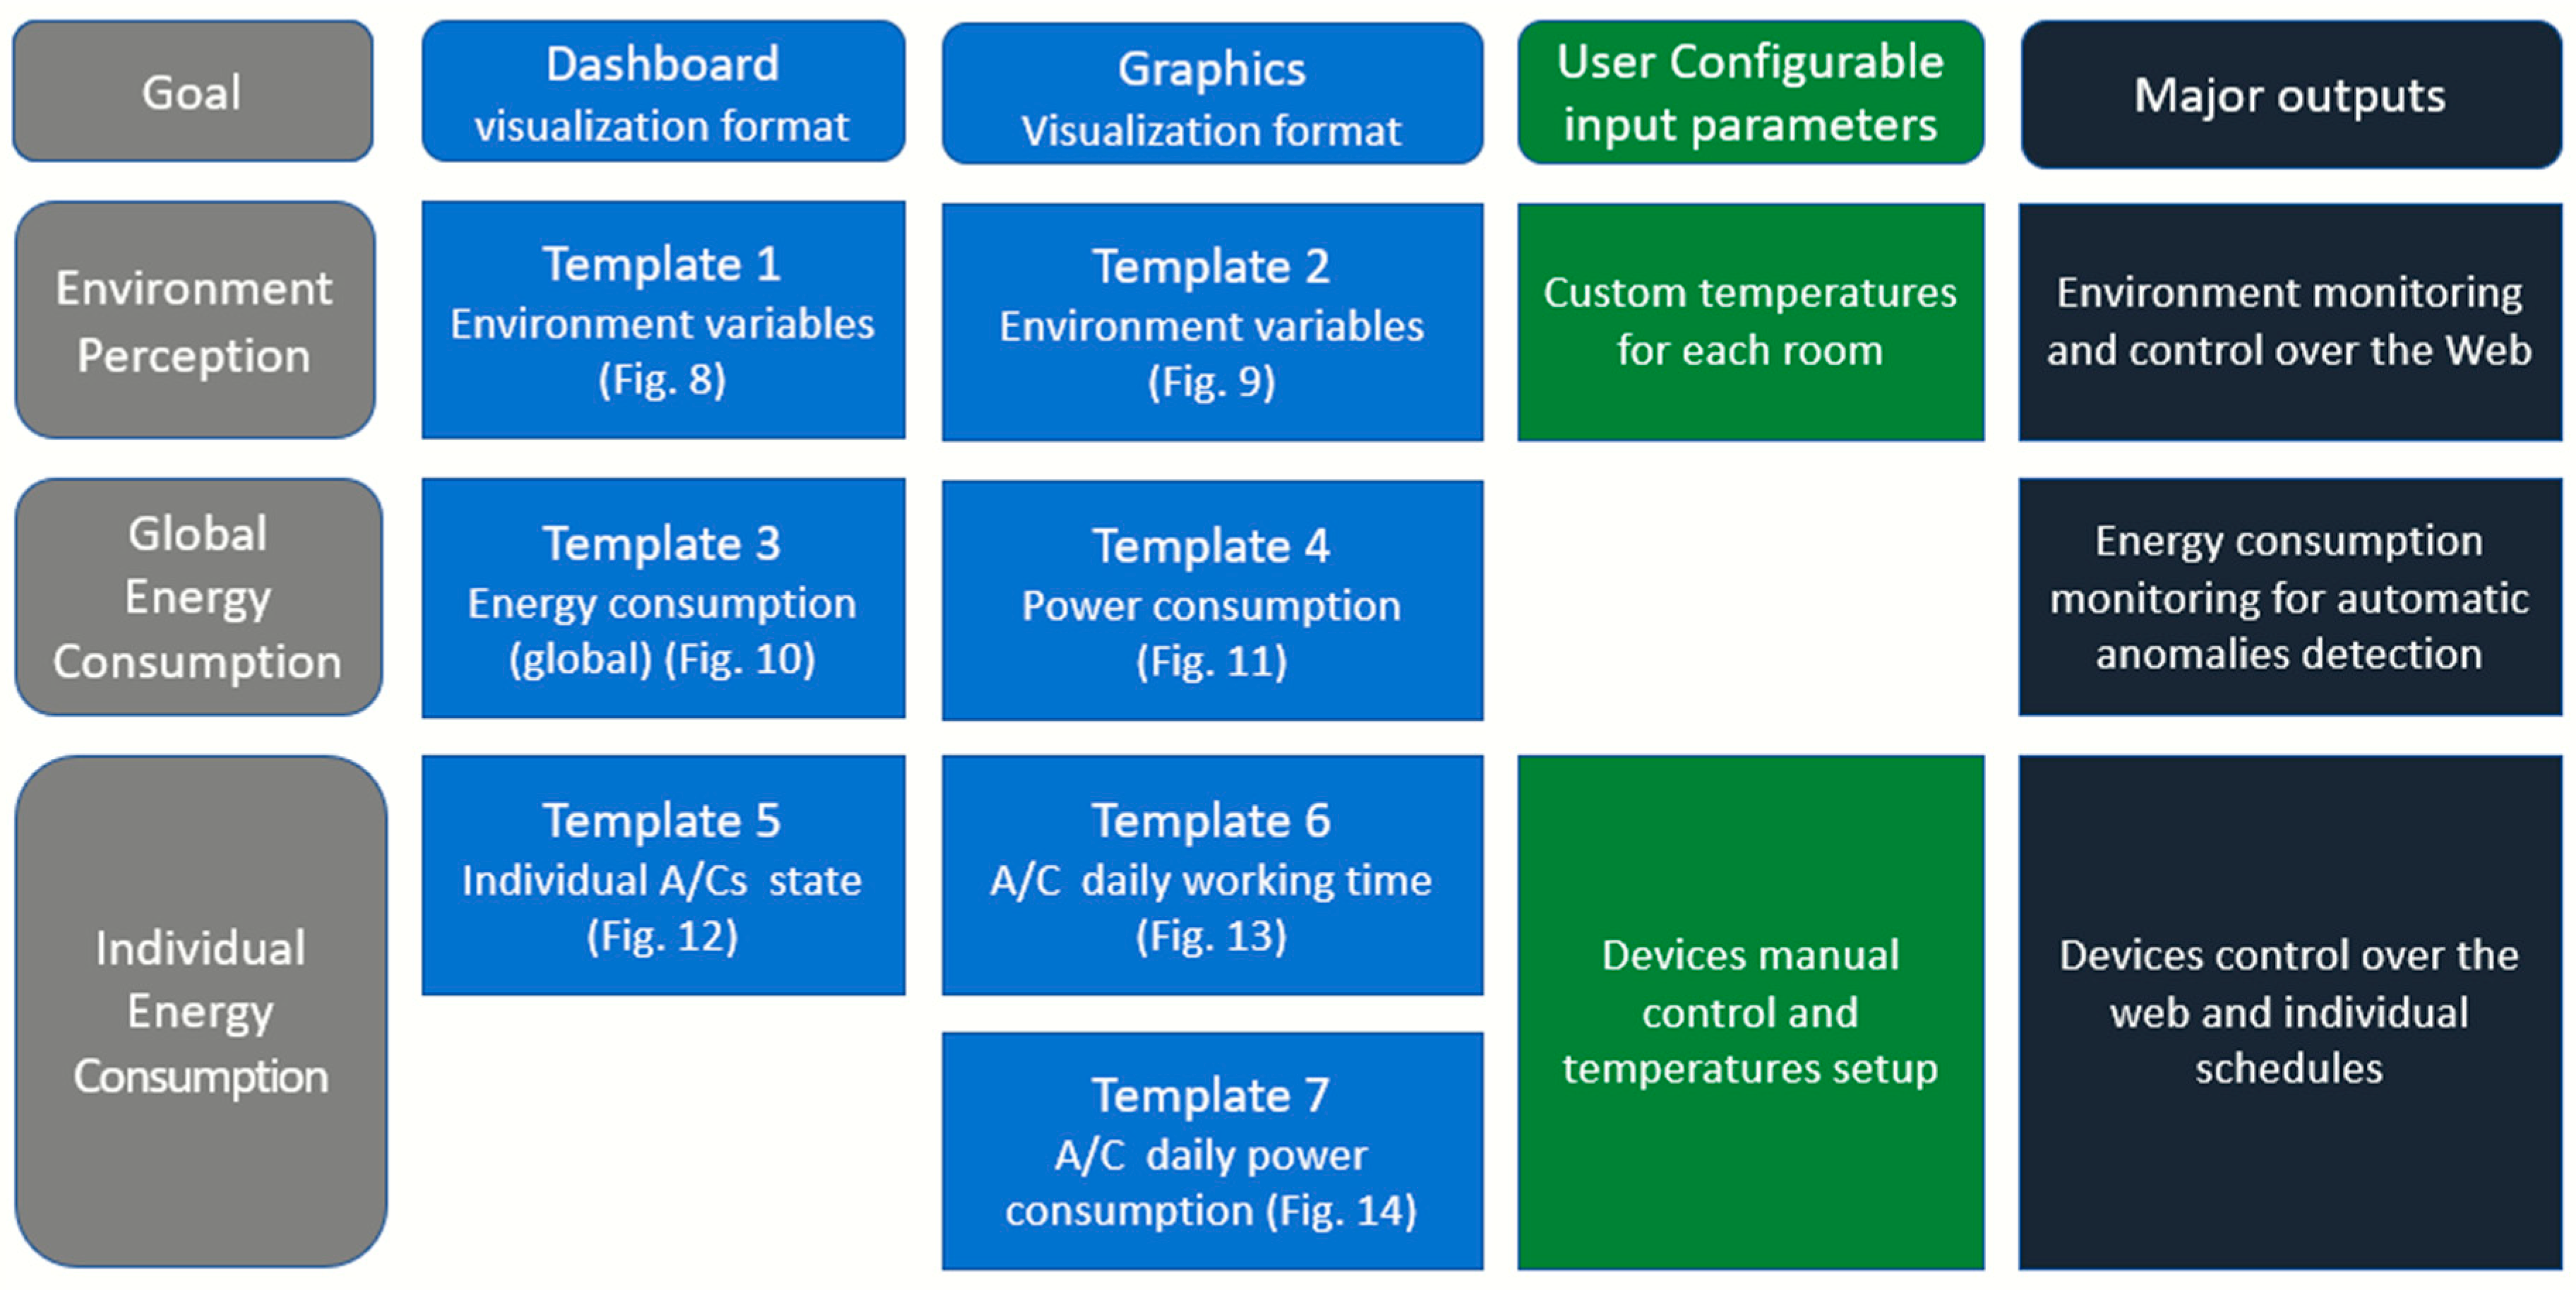
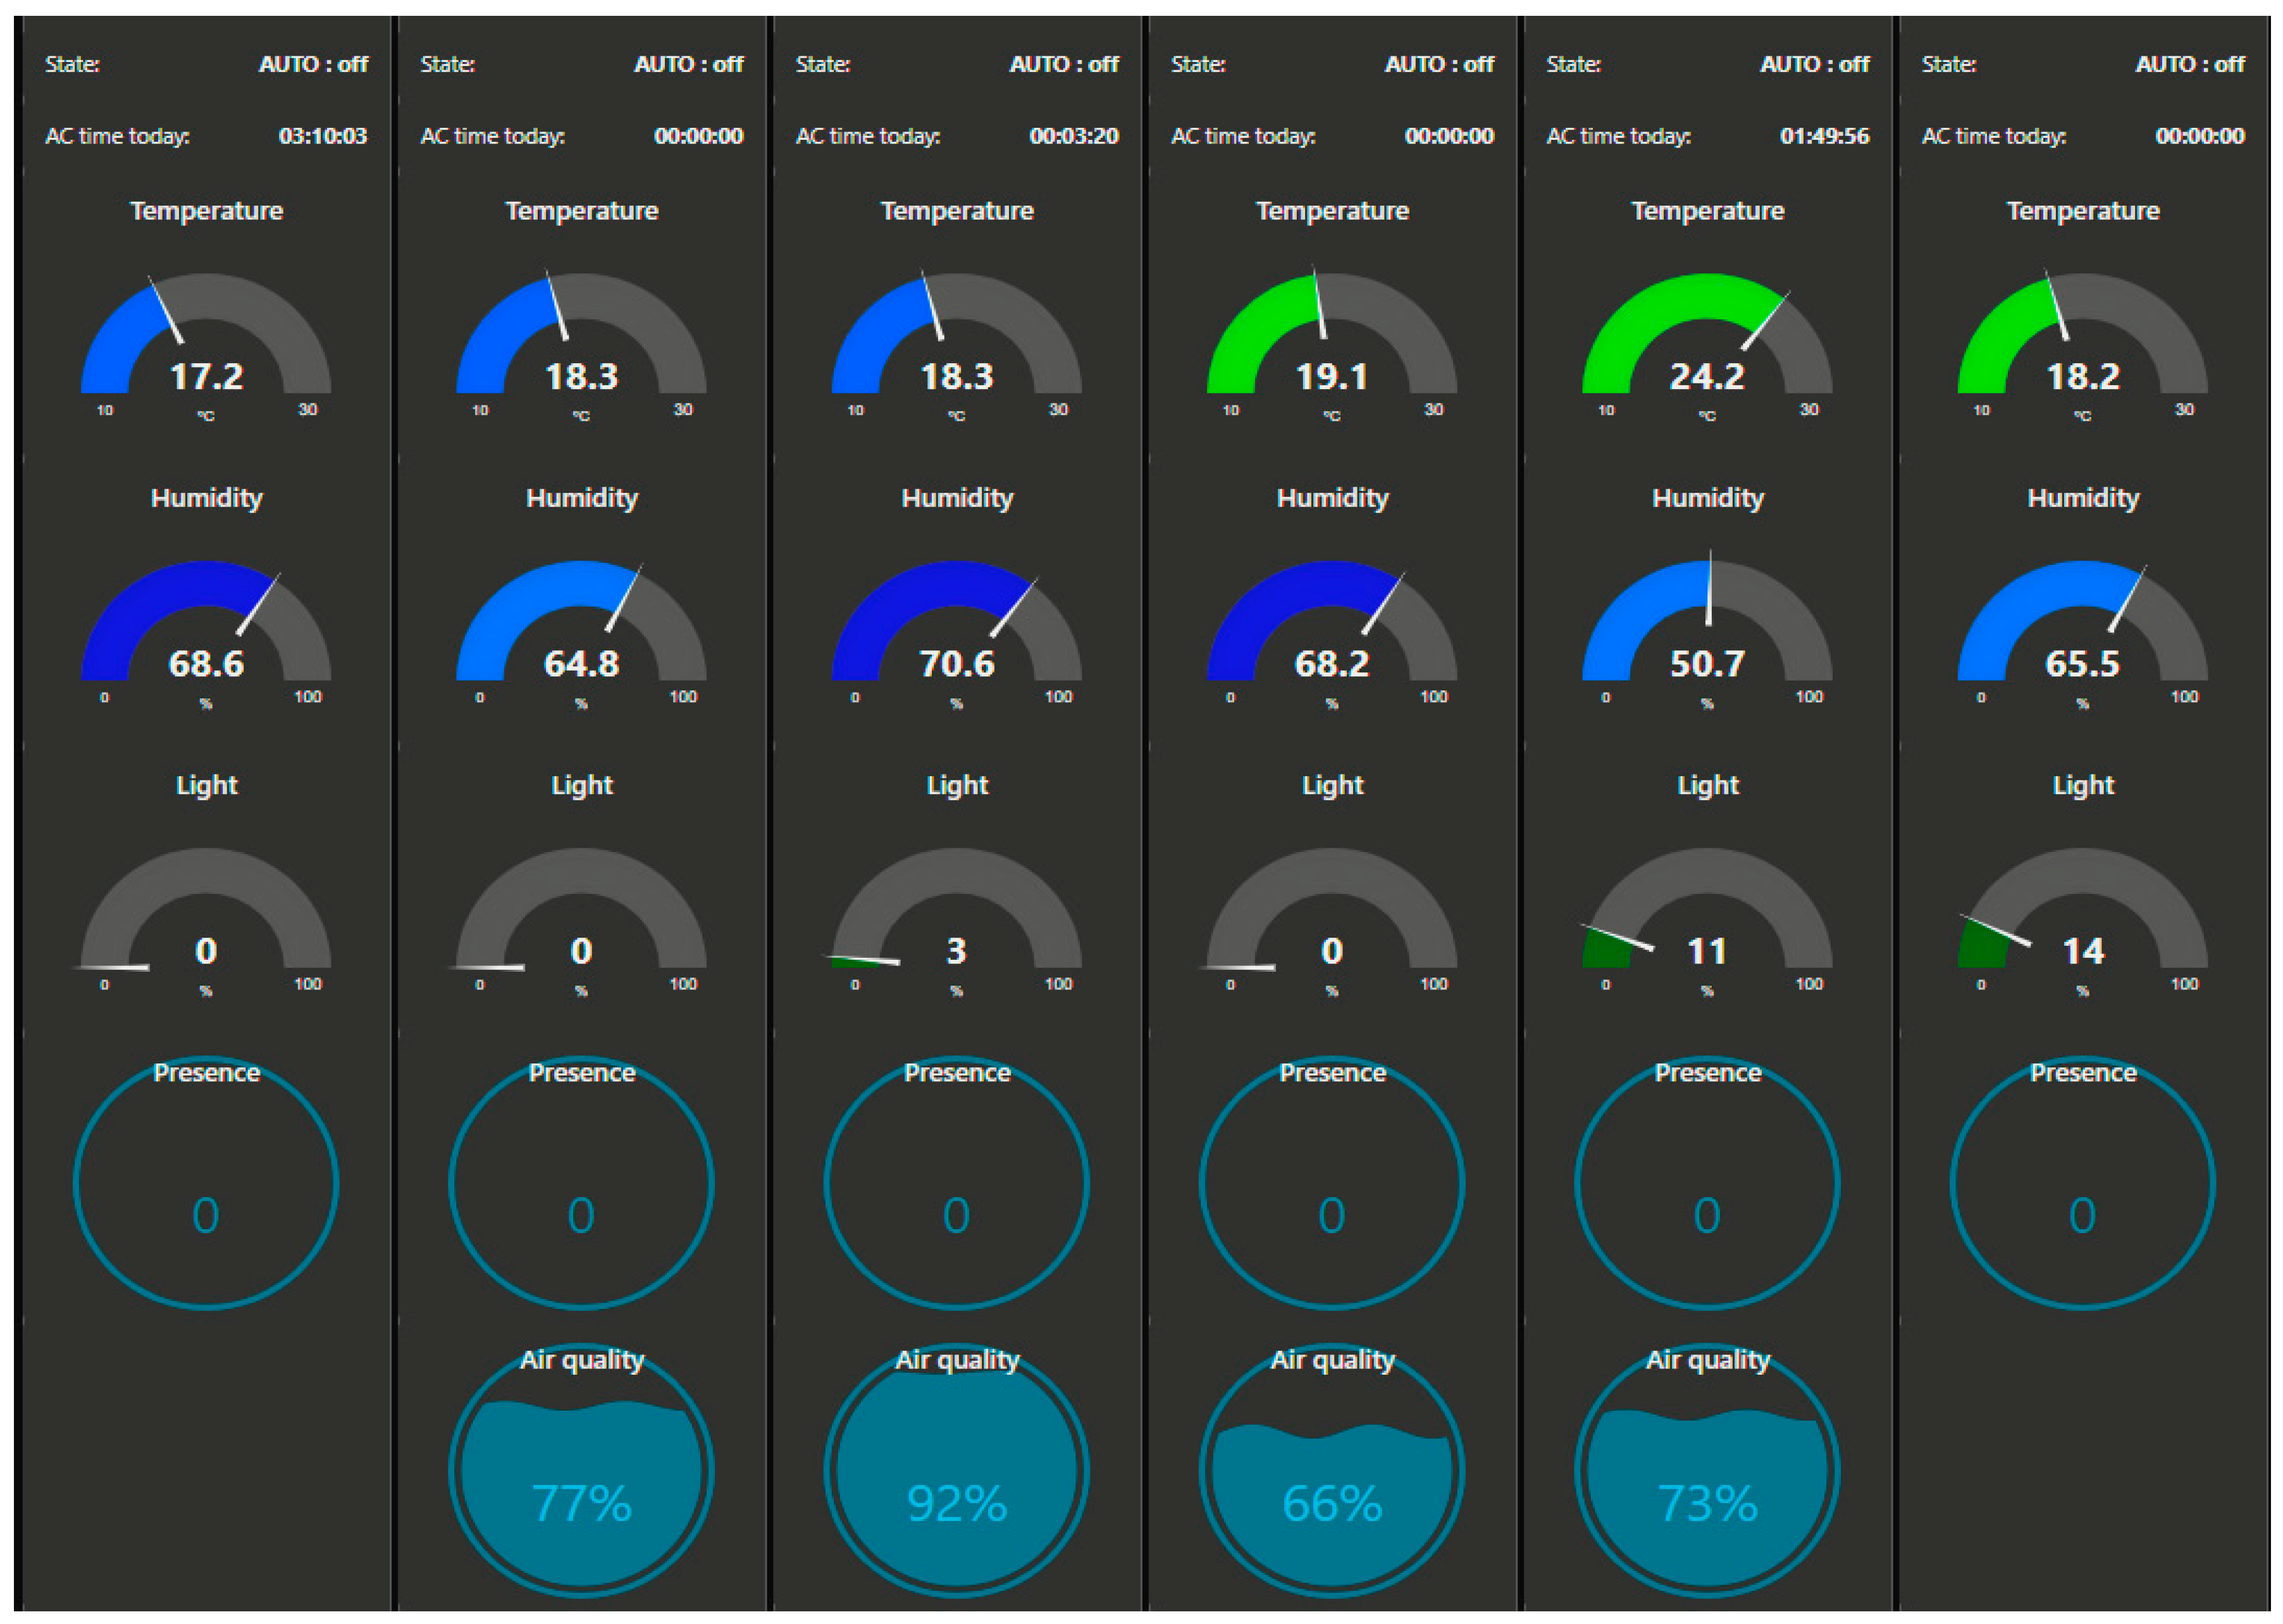
5.1. Data Visualization Reports
Developed templates allow users to create easily personalized reports based on these pre-defined templates where users can choose visualization parameters. This approach allows users with low knowledge to develop or create personalized reports as a big picture and from this, the creation of local and personalized saving rules for automatic actions can occur. Most indicators provide the user with a quick and easy way to see the current state of a classroom, for example, if the light is on and the room is empty, or if the room is too cold and the air conditioning is off. Each column on the dashboard (
Figure 8), represents a single room with all the sensors values and other values such as current air conditioning state, daily air conditioning working time and current light state. These types of figures allow the visualization and the users’ perceptions about environment parameters to be developed based on data available from local implemented sensors. These values, mainly around room temperature, can be used together with energy consumption to create trigger temperature rules to turn on/off A/C or increase/decrease the power.
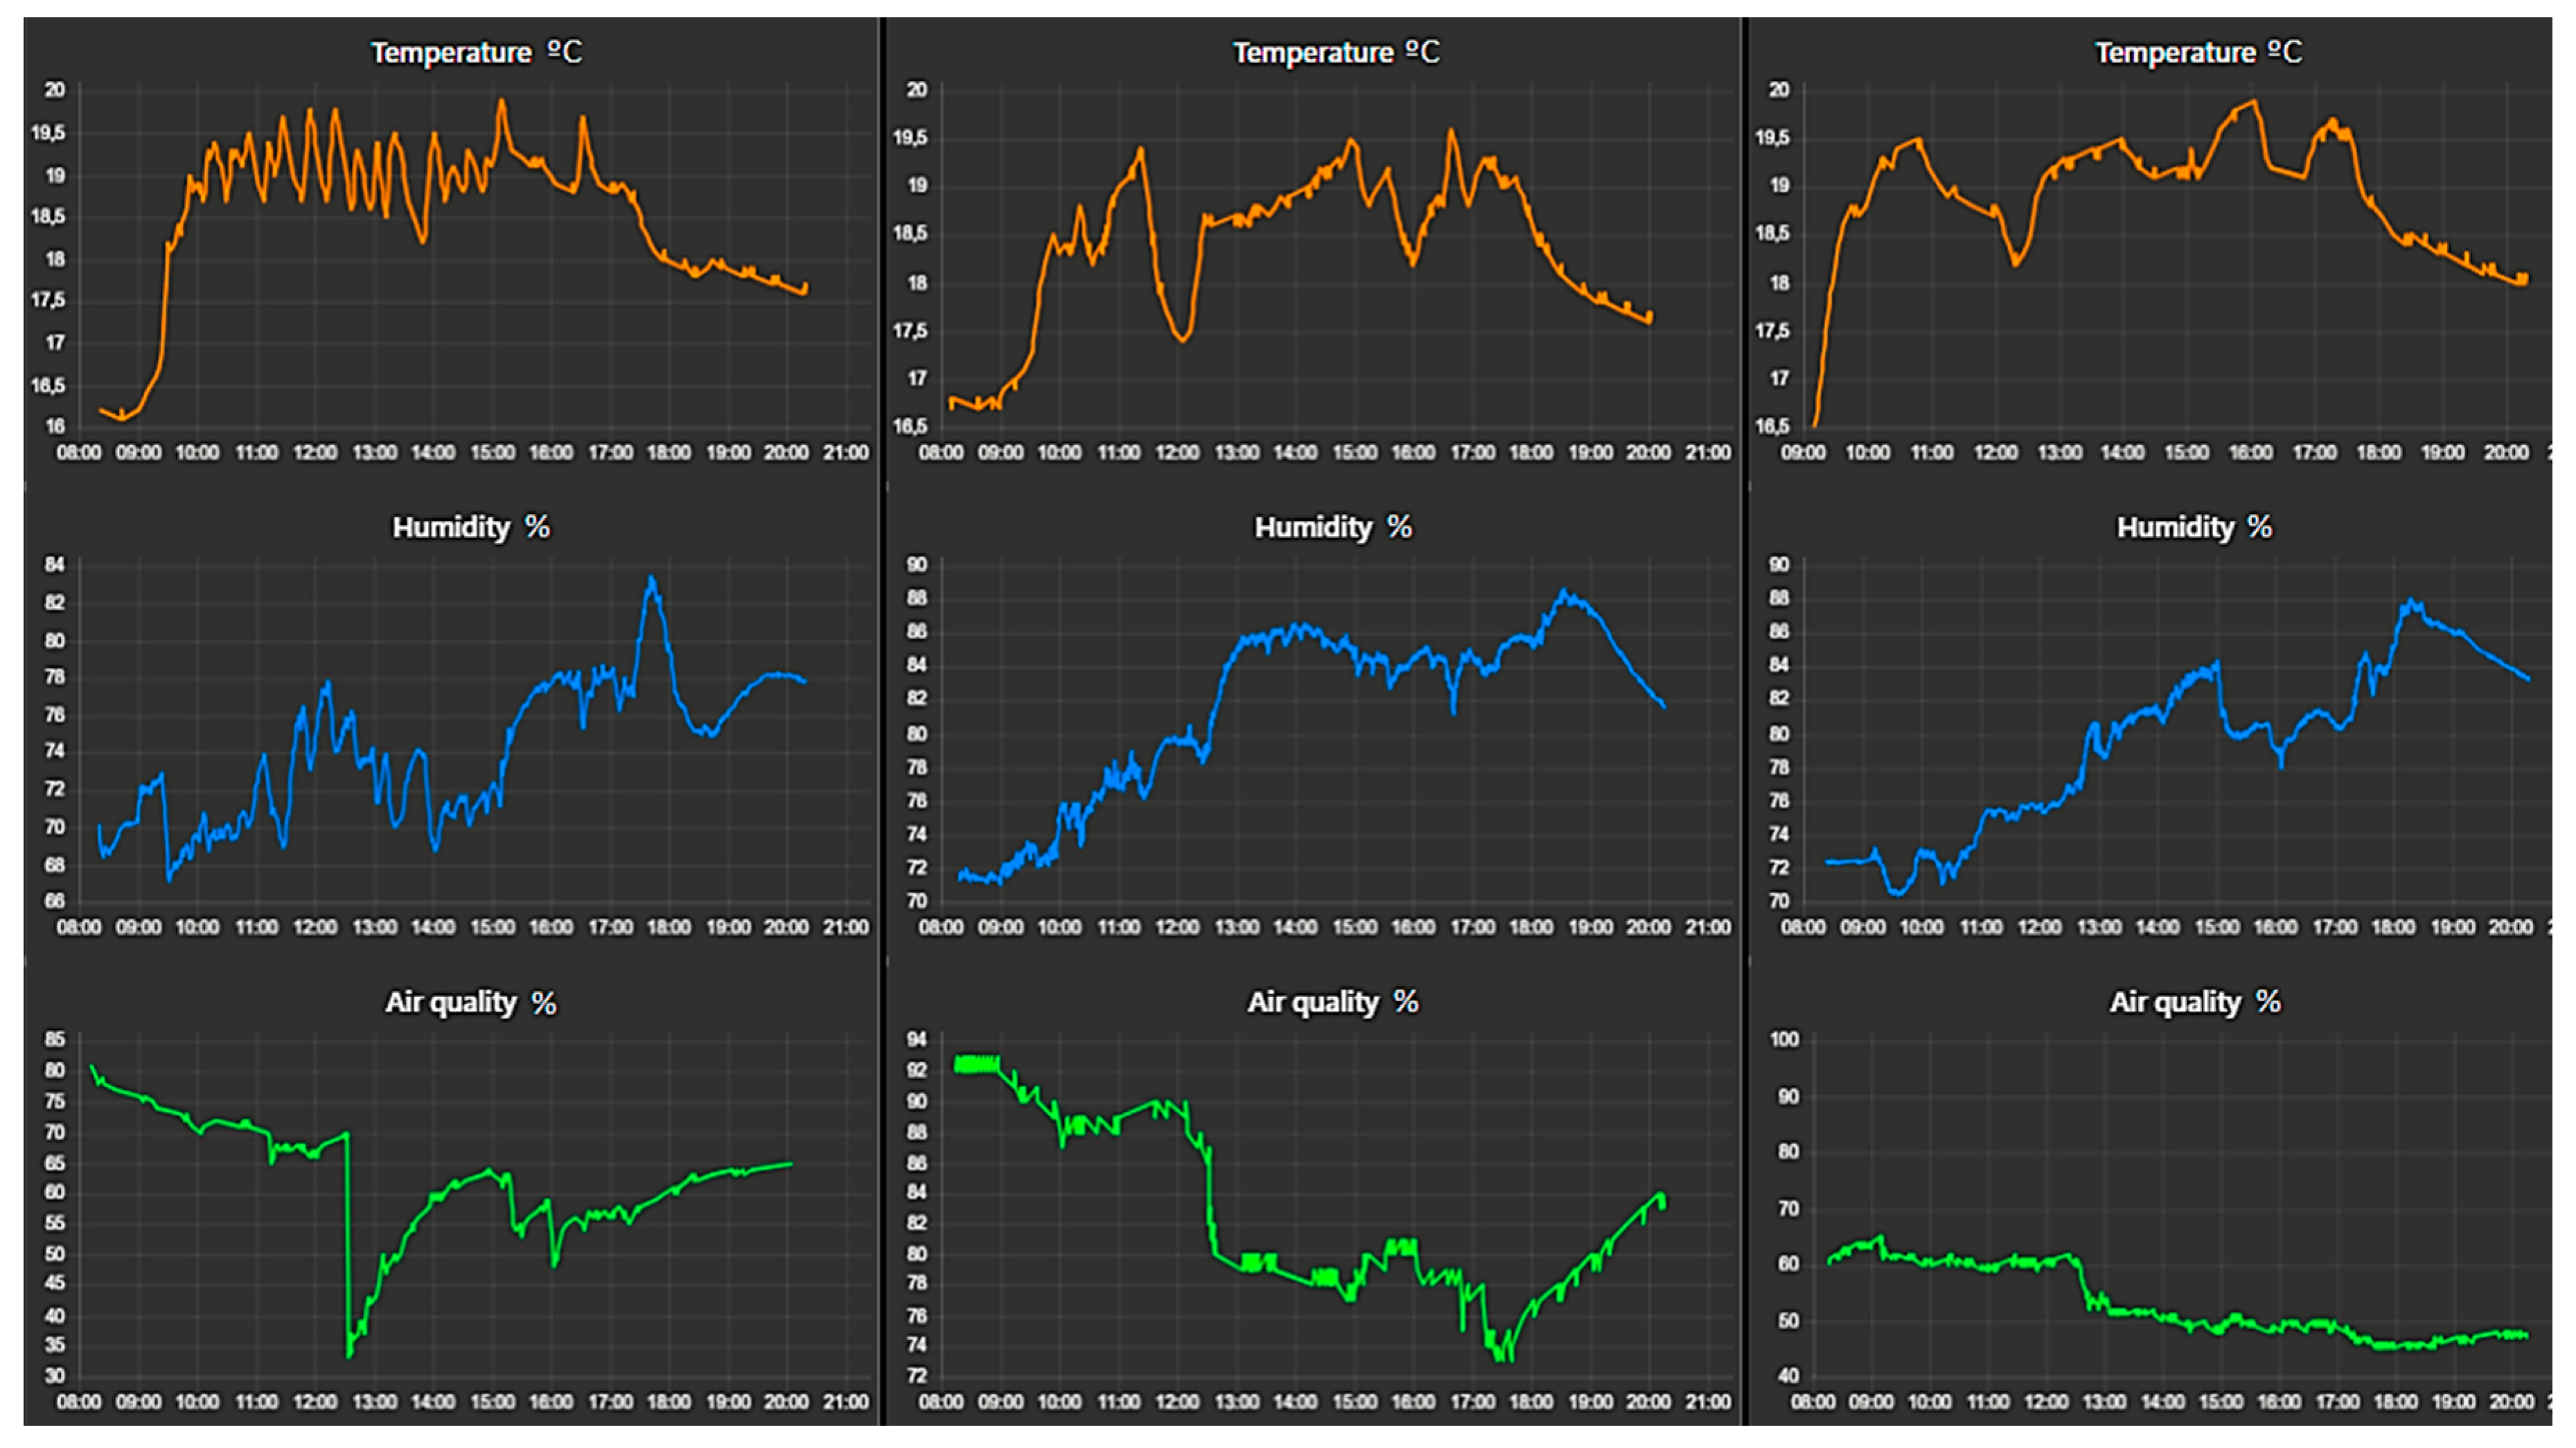
At a secondary window (
Figure 9) on the dashboard, all variables are displayed in line charts with a 12-h time period. Air quality percentage is calculated by comparing the sensor reading with the maximum and minimum readings ever detected, since the used sensor does not allow a direct conversion of the output signal into a specific unit.
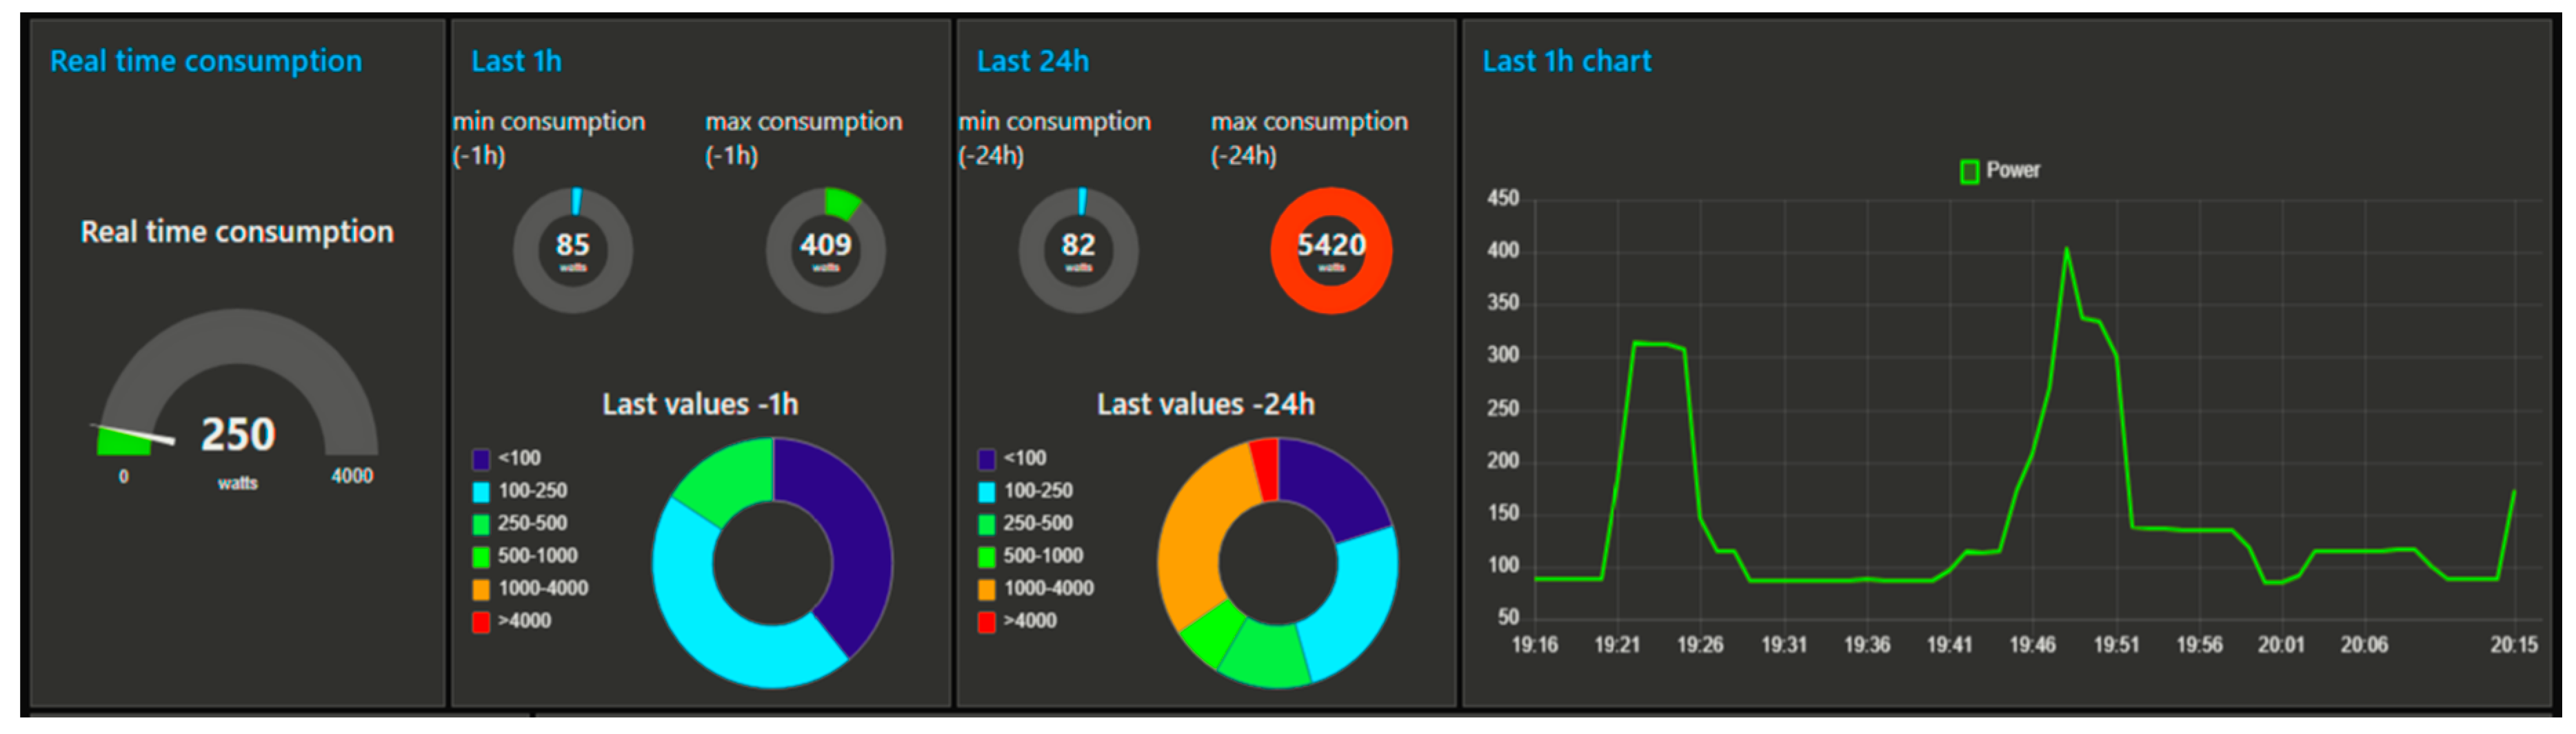
As part of the existing energy management system integration, the available API was used to retrieve real-time data presented on the energy management tab (
Figure 10) was more accurate than the solution provided with the system because the original website is limited to a minimum real-time consumption of 100 watts, which reduces this tool’s capabilities.
This tab also presents indicators of the real-time consumption (measured every 15 s) and the minimum and maximum recorded consumption values within the last hour and the last 24 h.
These values are divided into categories with different colors, with cold colors equivalent to lower consumption values, and warm colors equivalent to higher consumption values.
This feature was requested by the school owners as a preventative measure for unwanted energy waste, especially on weekends.
A notification email is sent to specific employees when an abnormal consumption is detected during non-work days or during the night, for which no automation rule is possible.
From the data analysis, we found that air conditioning systems are one of the biggest energy consumers in the building, and standby power (measured during the night) makes up approximately 15% of the total amount of energy spent per day.
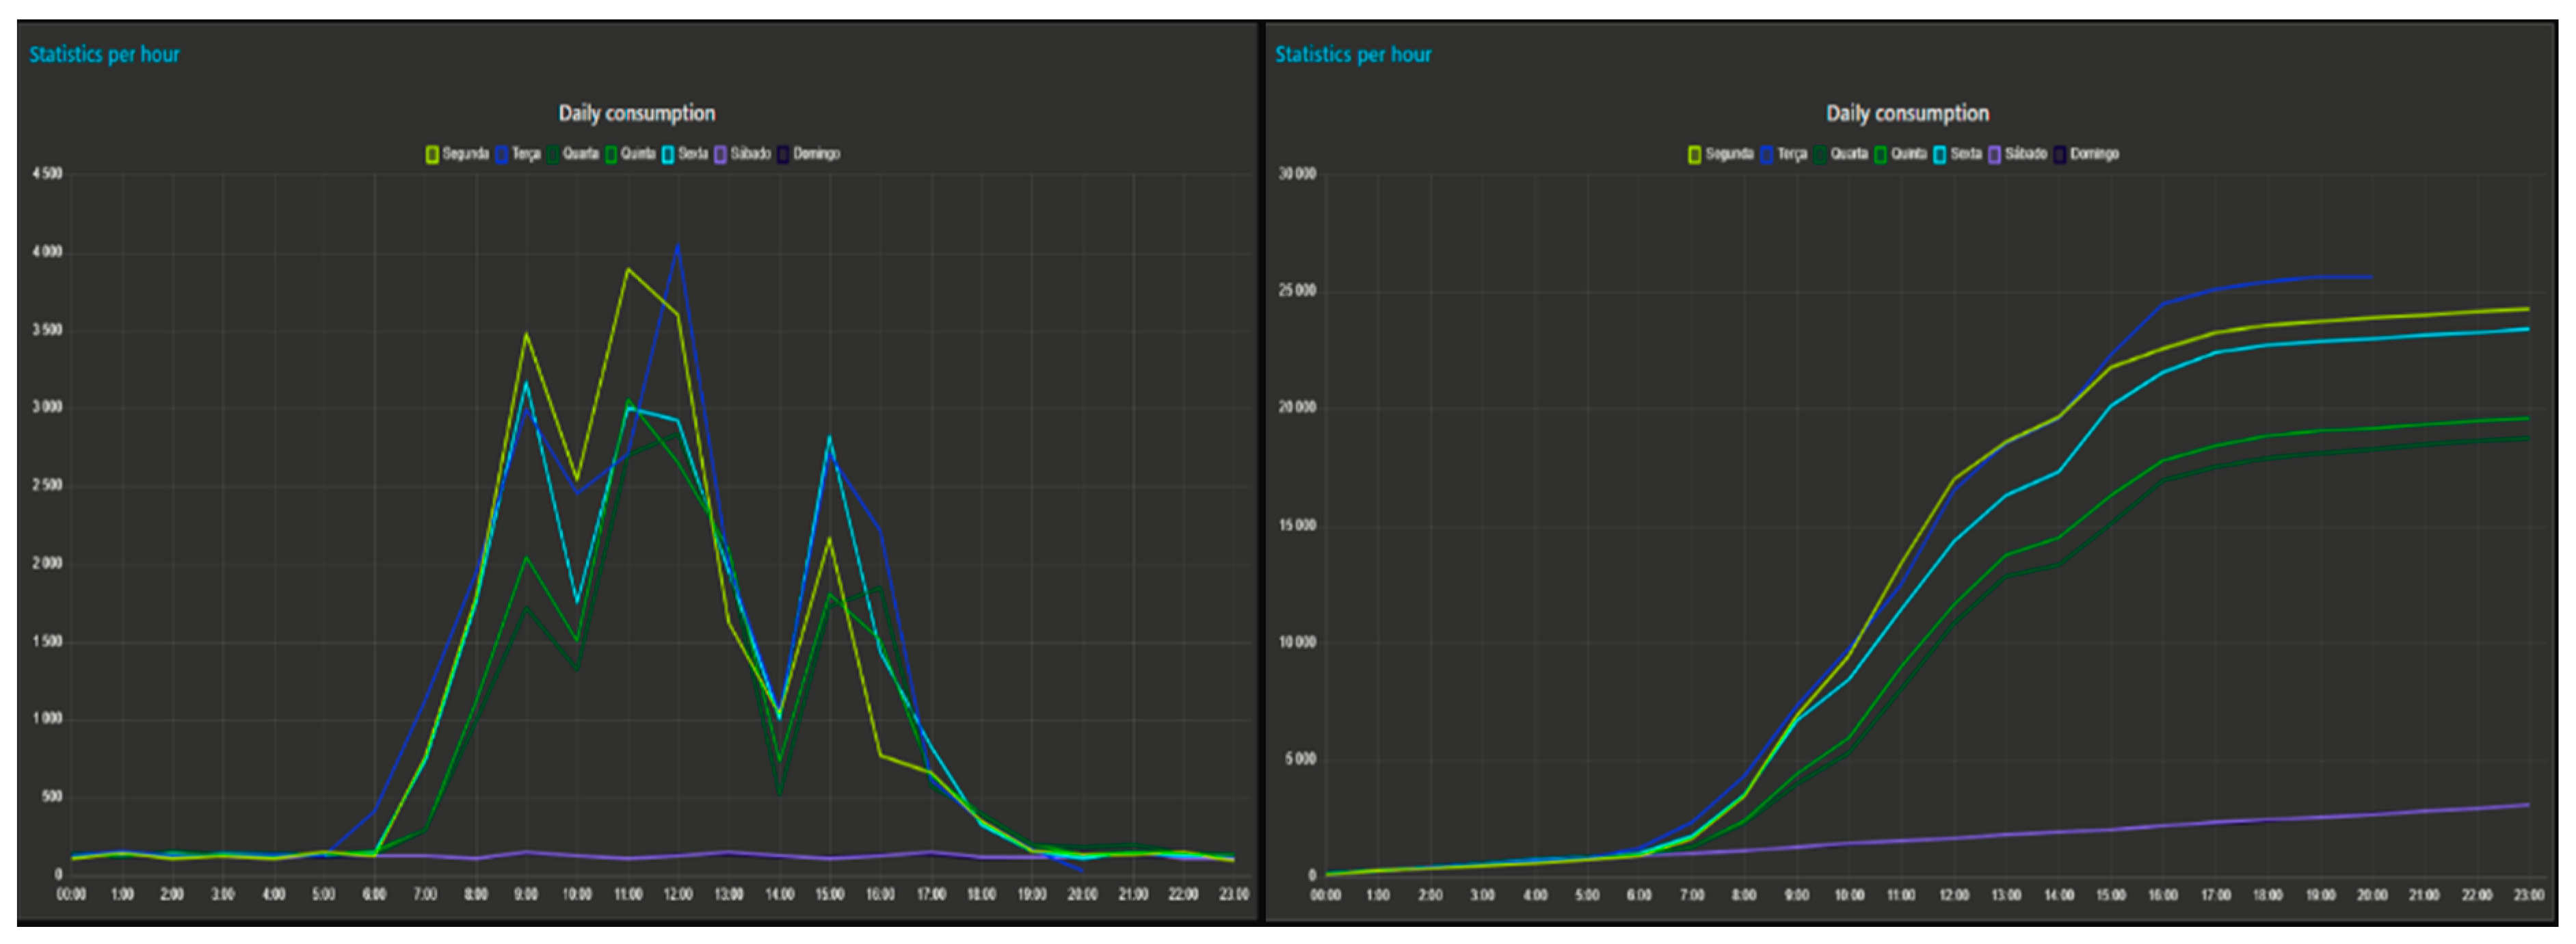
Figure 11, shows a daily view of energy consumptions by 2 different modes, linear and accumulated, which is useful for detecting the periods of the day when energy consumption increases or decreases relative to other days, and minimum and maximum consumption values recorded each hour, which are particularly useful for detecting anomalies and power limits.
In
Figure 11, the chart on the left shows that it is possible to determine that the beginning of the day, lunch and afternoon is when more energy is spent, and on the second chart, it is possible to understand in which period of a certain day more energy than the average was spent, such as the day identified with a white arrow, such as at 16:00 h where an extra 2.5 kilowatts hour was spent.
By knowing the maximum power usage per hour, it is possible to determine the necessary contracted power that also represents part of the energy bill.
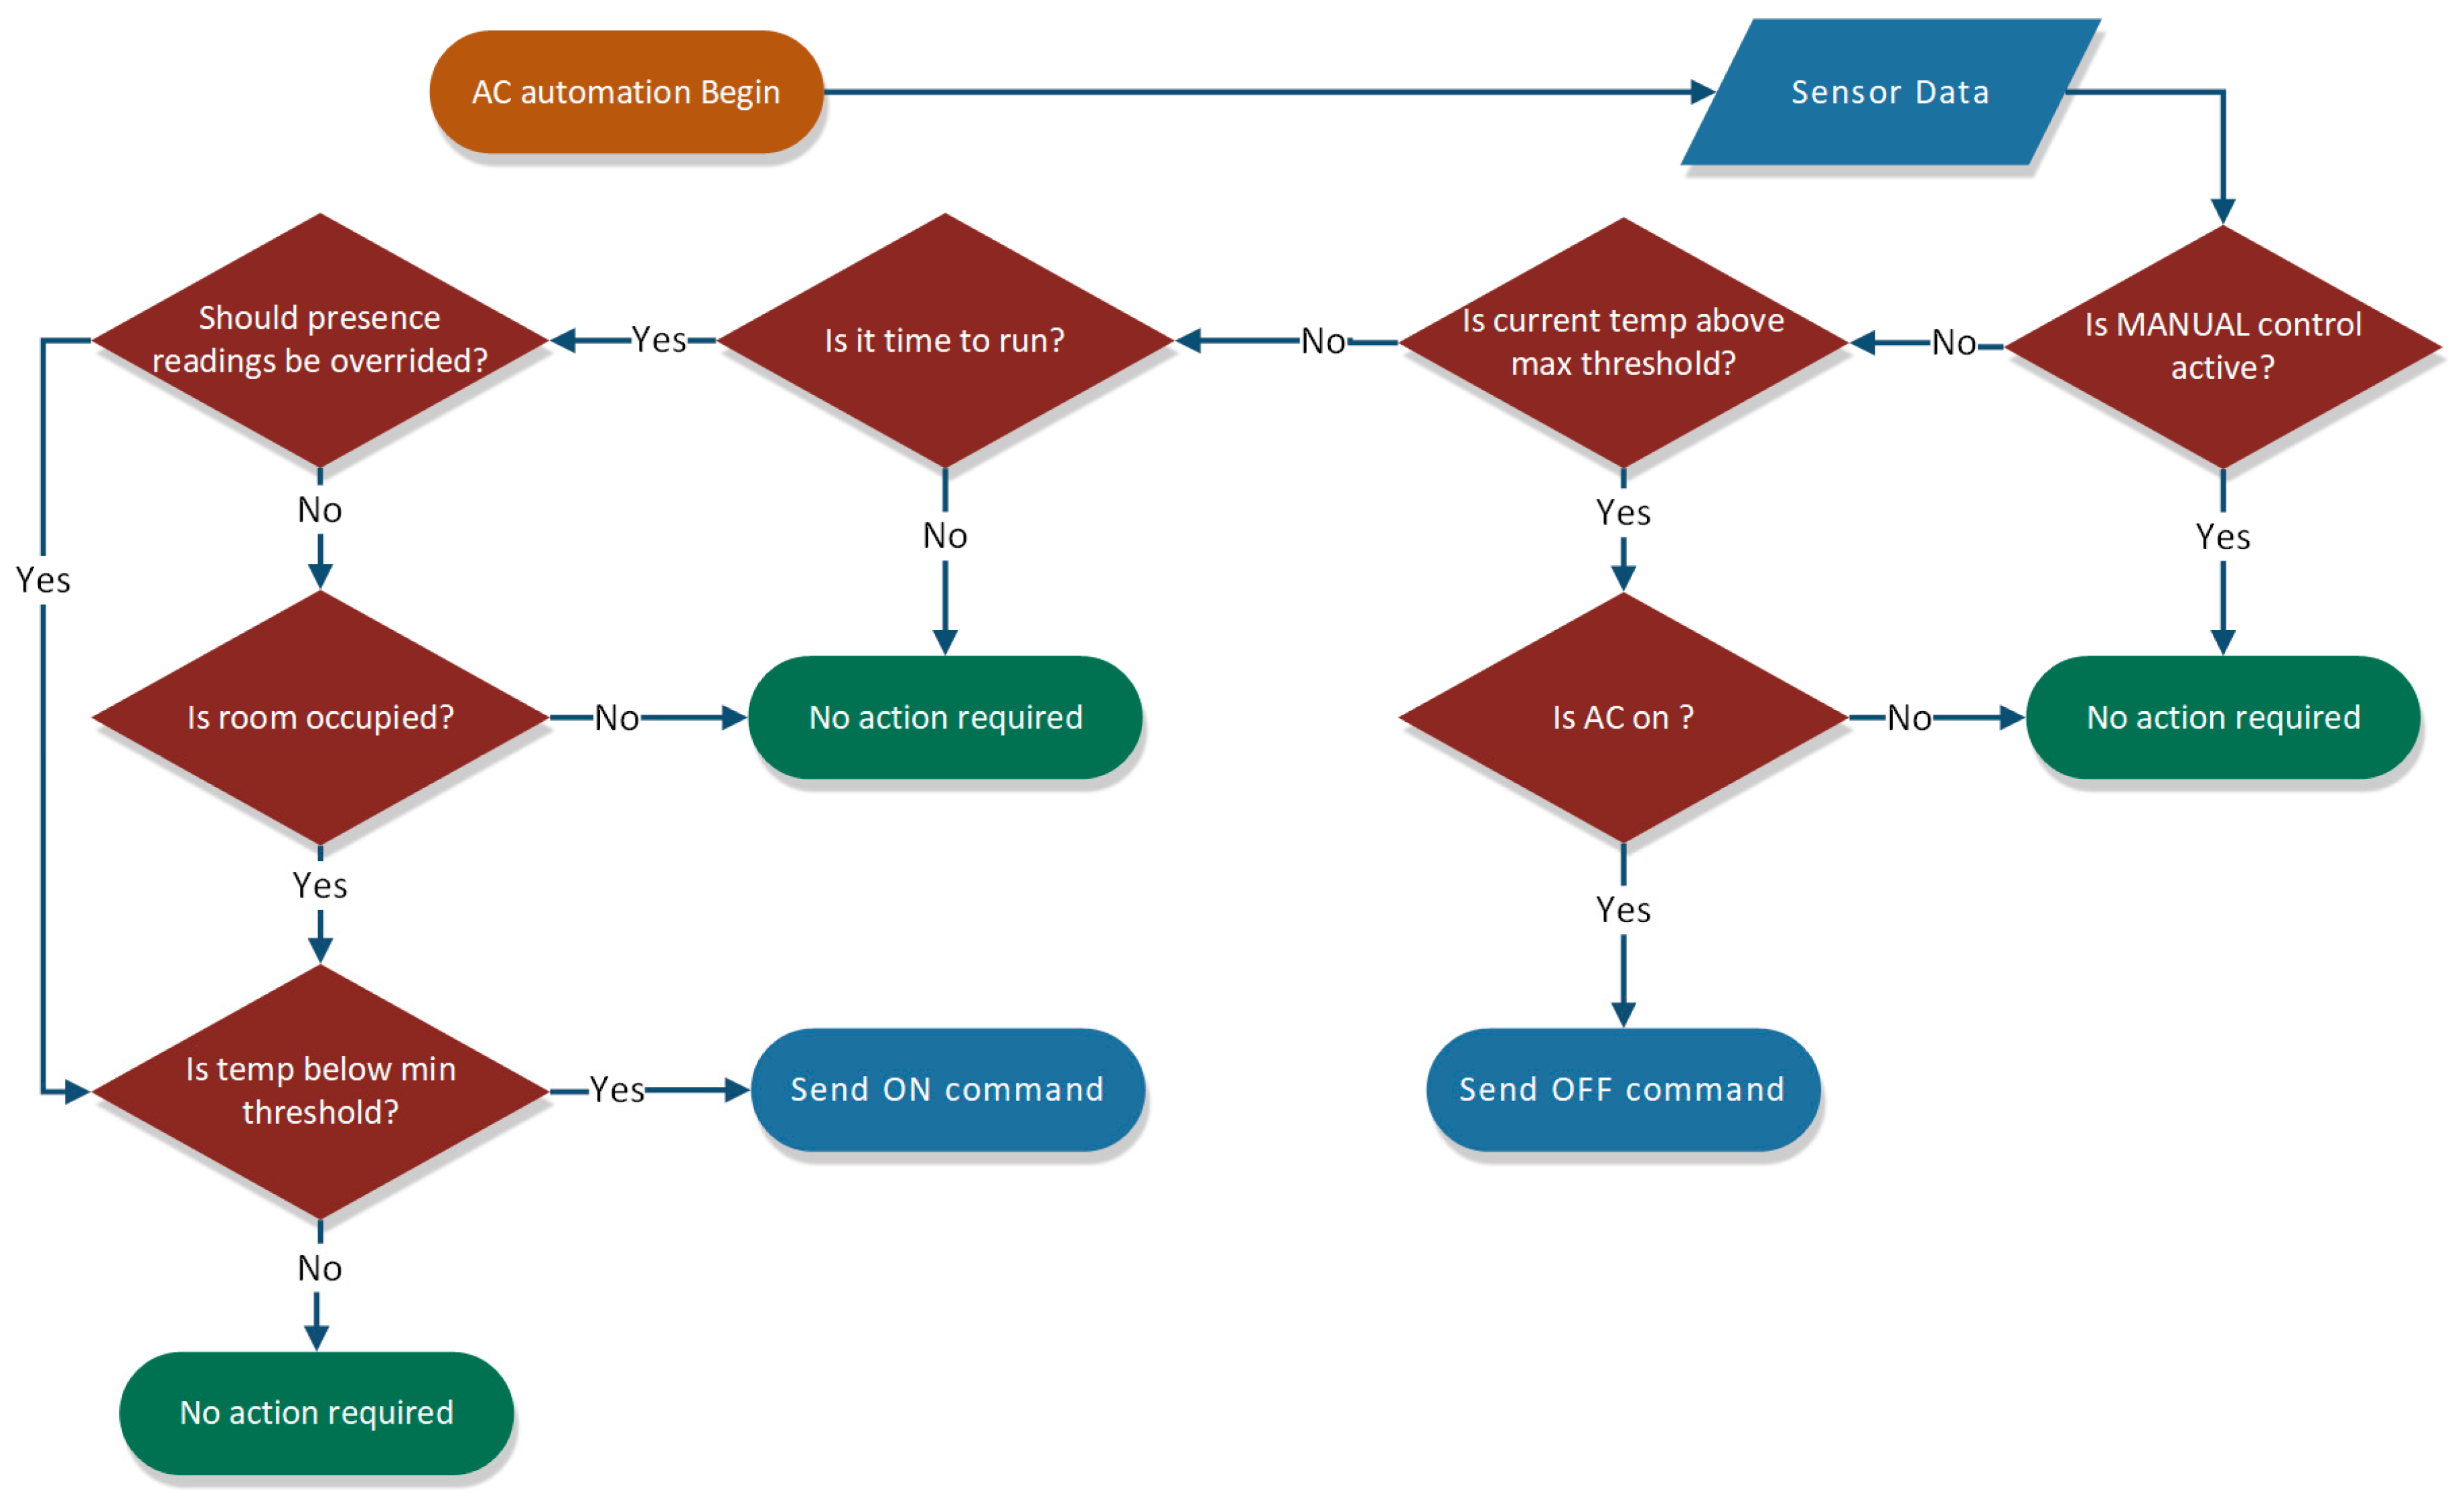
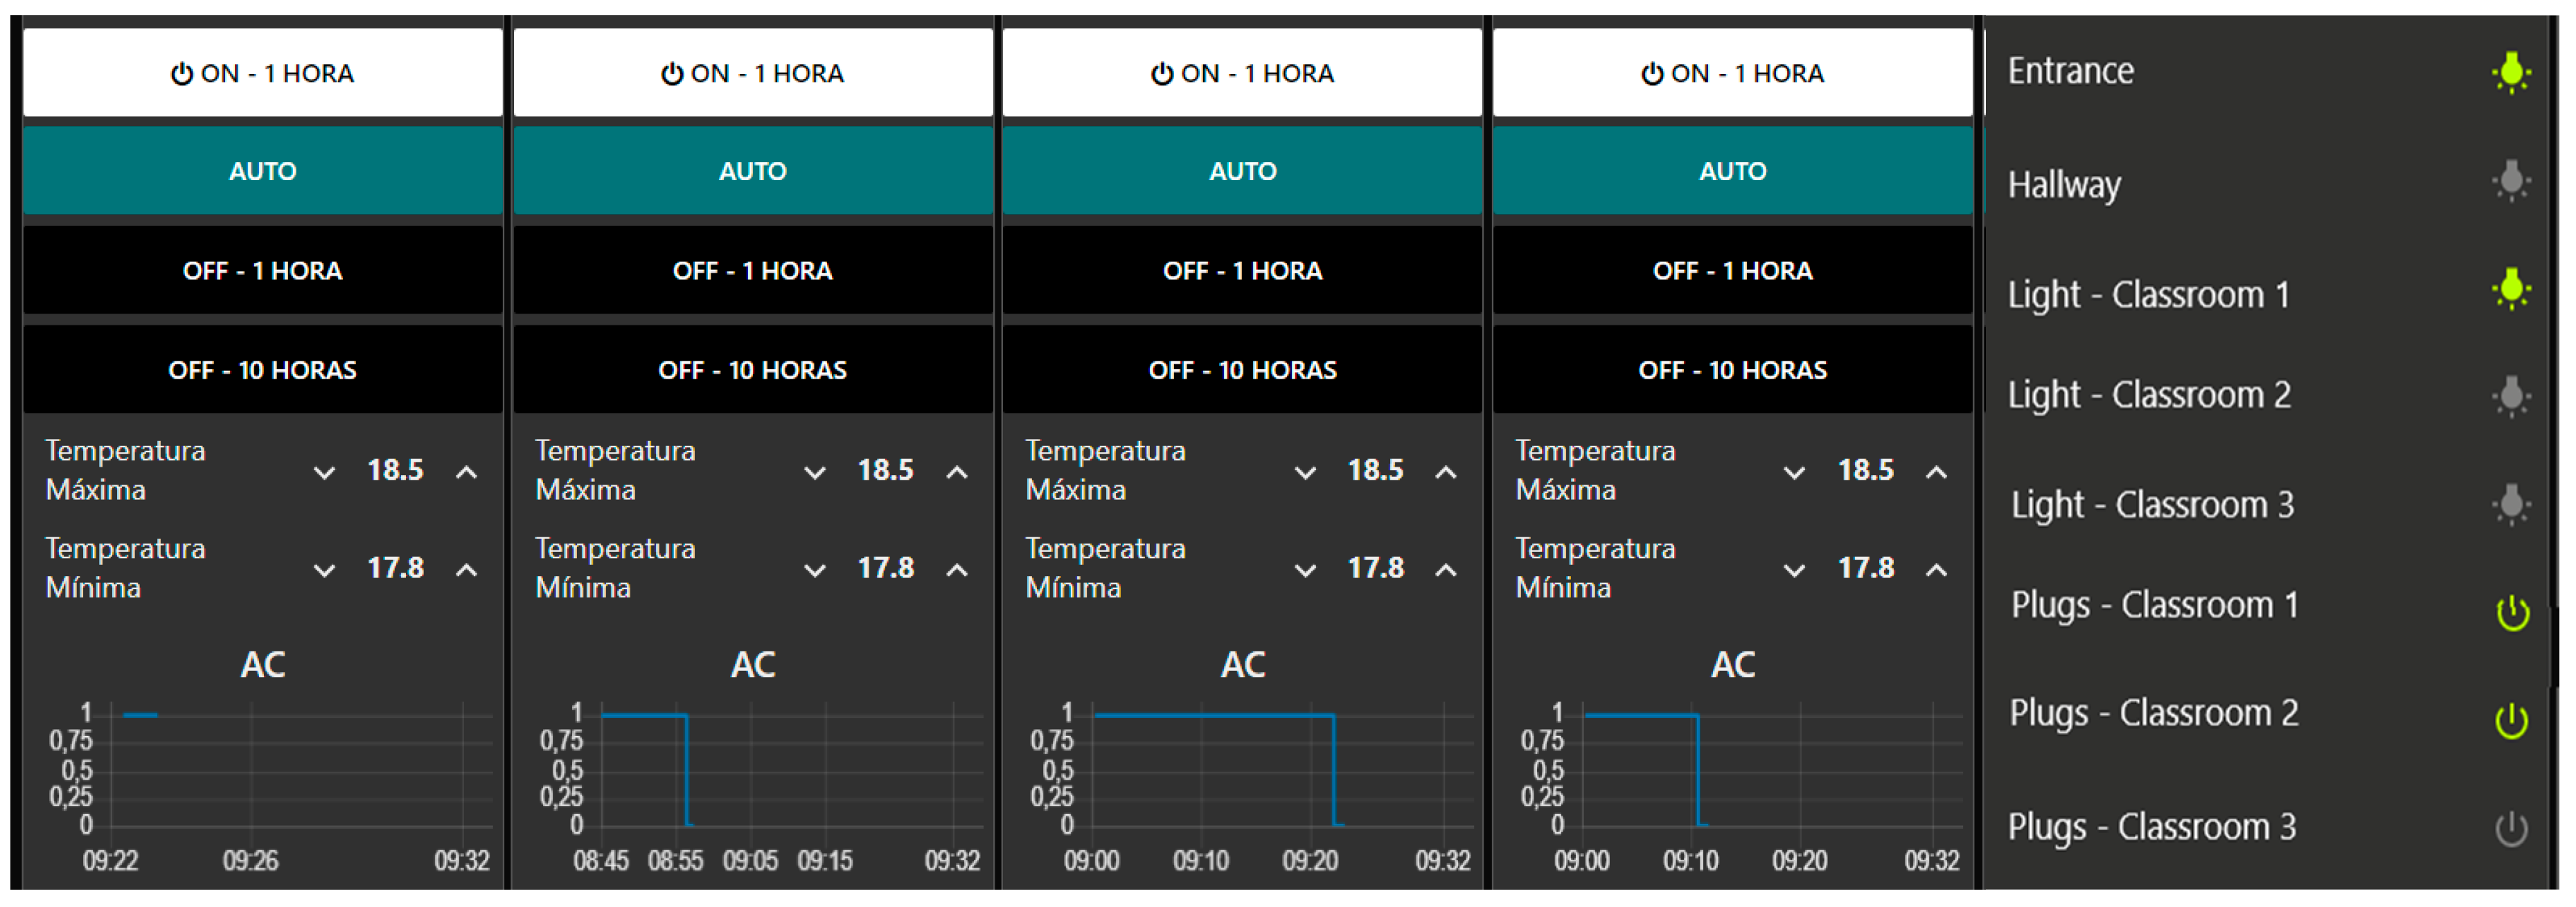
The dashboard interface, as mentioned before, includes interactive buttons and controllers, mainly for A/C and lighting control purposes. The A/Cs of each room can be turned On or Off from the dashboard remotely for 1 h, or for the rest of the day, however, the default mode is AUTO, meaning, autonomous control based on sensor readings. The user can define a minimum and maximum temperature for the room to be used with the automatic rules. Ceiling lights and plugs can also be turned on or off from the dashboard, using the WiFi switches in
Figure 12 as a bridge between the platform and the circuit itself.
A dedicated section (
Figure 13) shows the time each room’s A/C was on, allowing the user to understand which rooms require more heating or cooling per day.
On the bar chart, each color represents a different room A/C working time. By analyzing the data, we can observe that the last 2 days on the chart (01-04-2019 and 02-04-2019) only 1 room required heating. The room usually doesn’t have more than 5 children inside because it is where they sleep when necessary, and this also explains why it required more heating than the others for every day during the previous week.
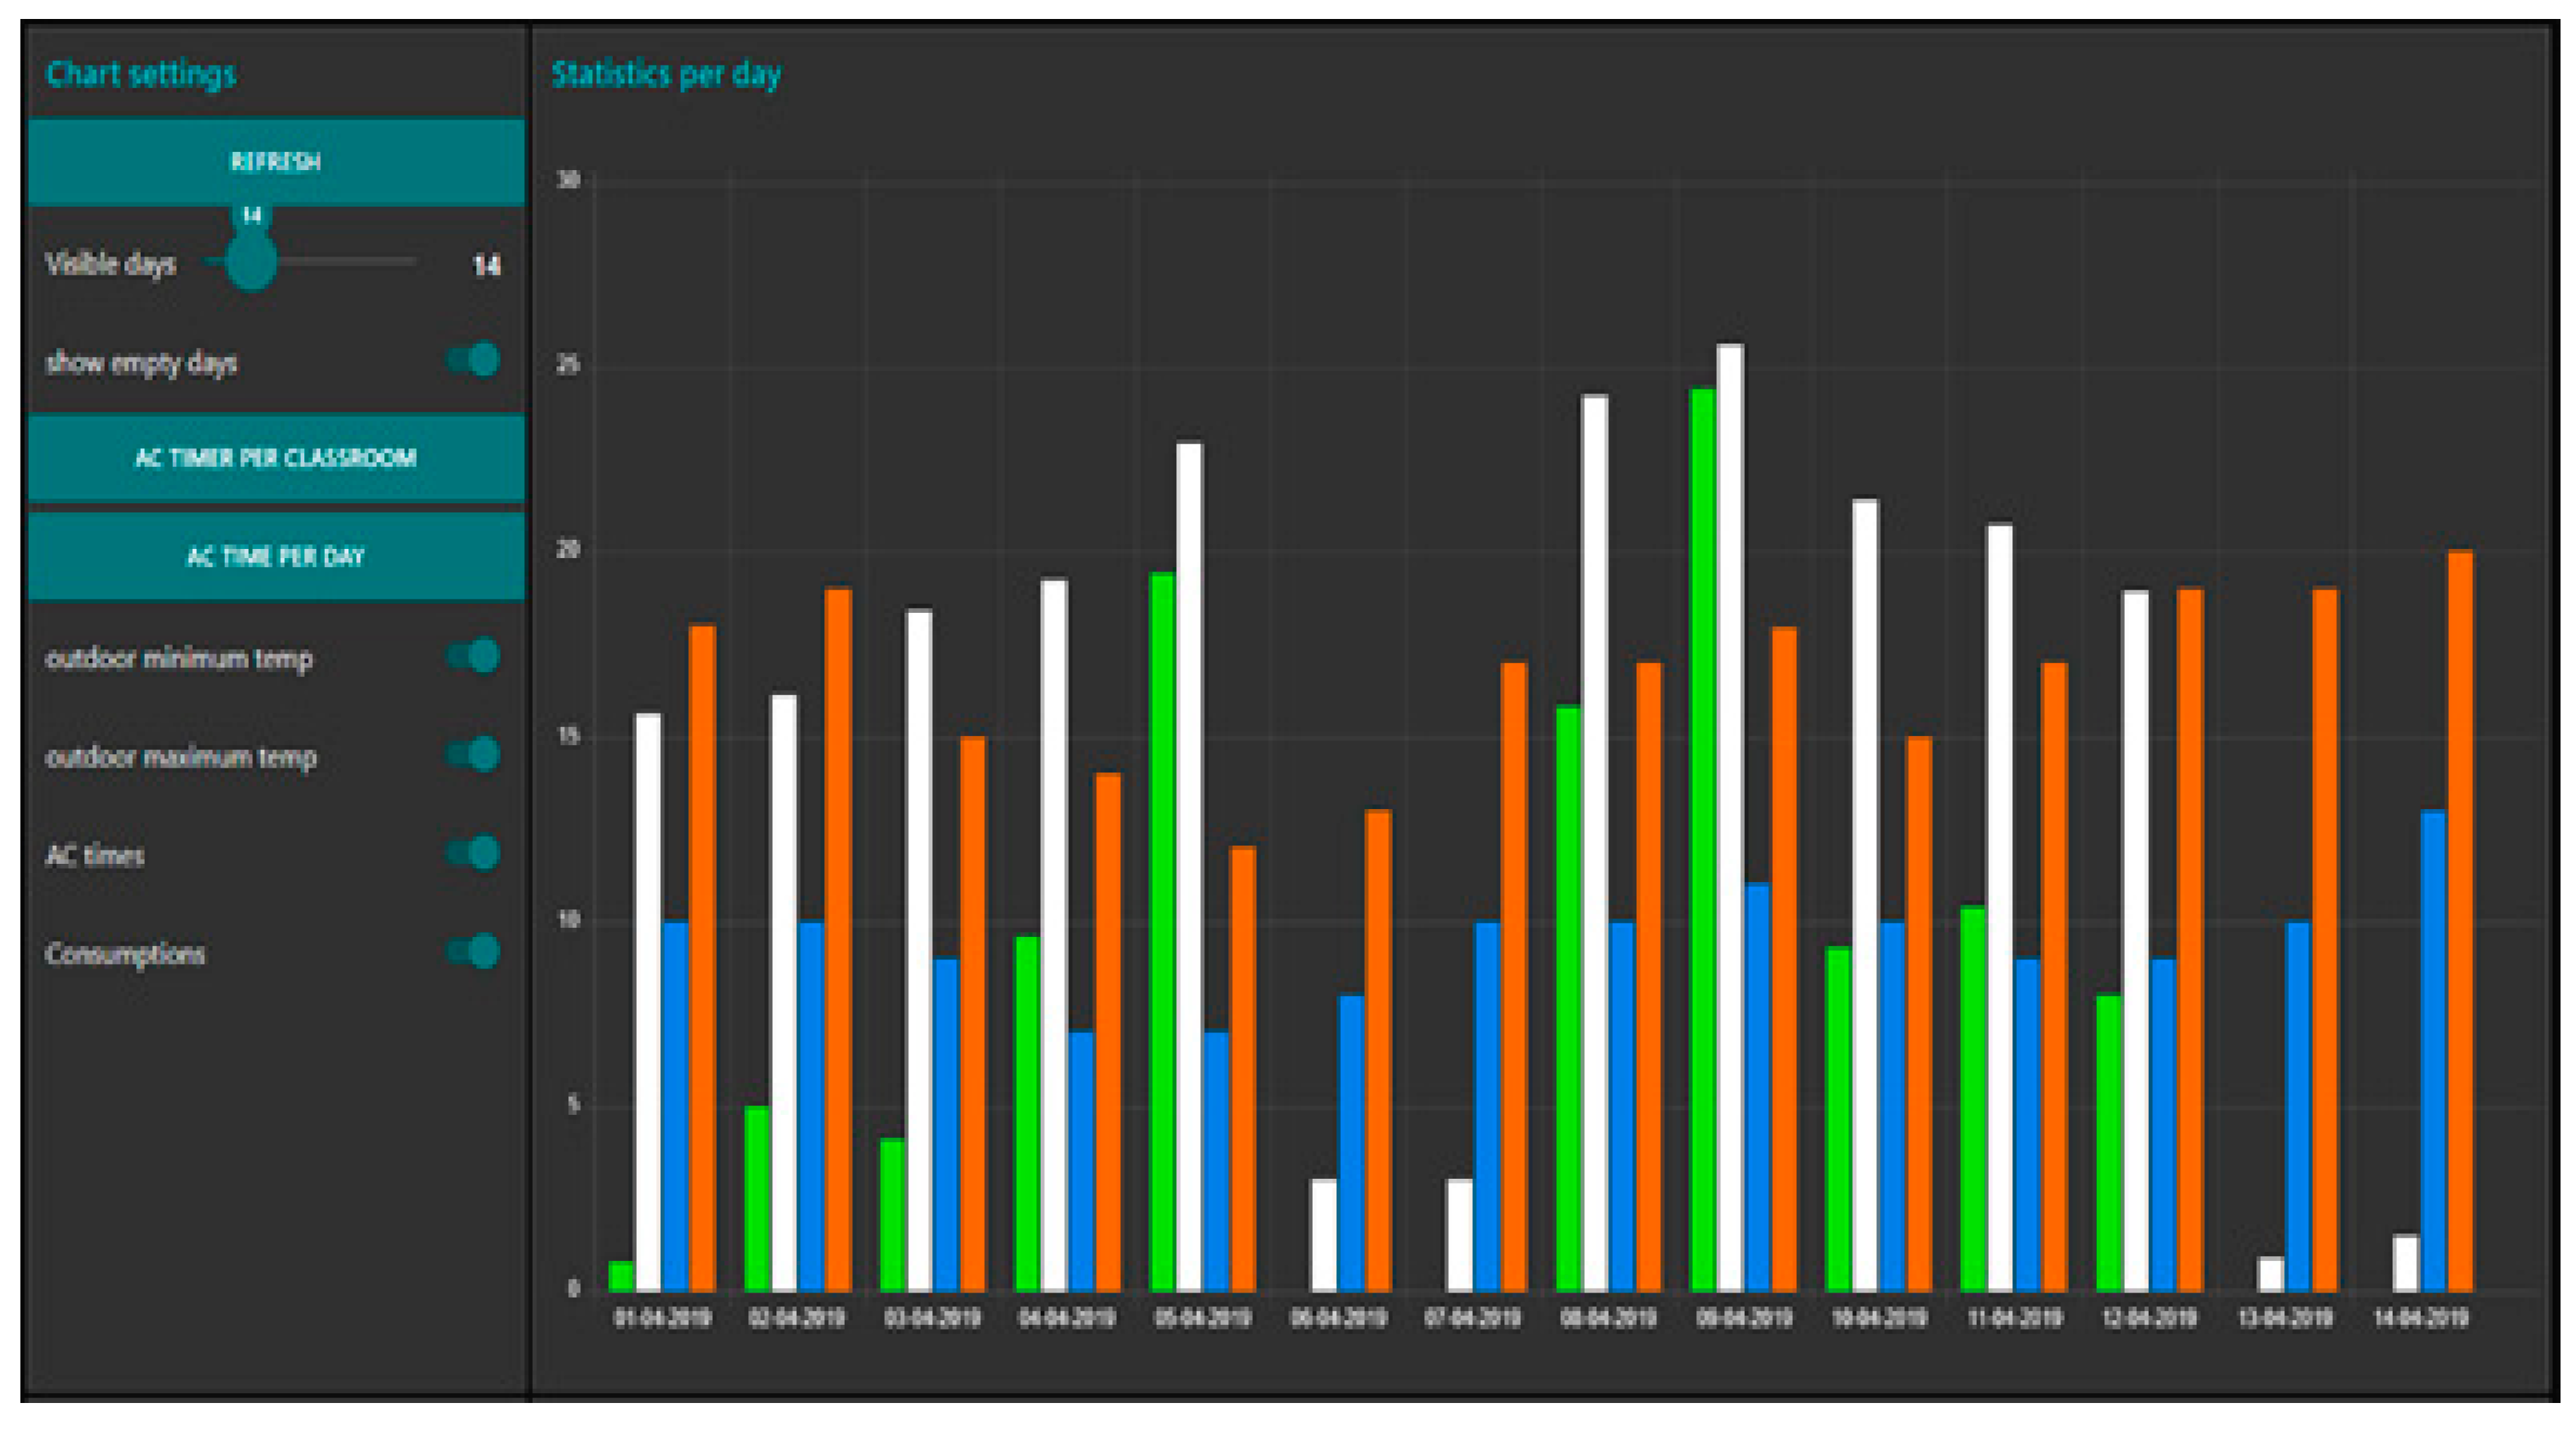
It’s also possible to compare the total amount of time of all A/Cs together, with the maximum and minimum expected temperatures for the District, and understand how outdoor temperatures and general weather affects indoor temperatures and humidities and also daily consumption.
Figure 14 shows another example of template 7 output, where for each day we show the:
Sum of all rooms A/Cs working time in hours;
Total daily energy consumption;
District minimum outdoor temperature;
District maximum outdoor temperature.
It is possible to observe a direct relation between outdoor temperatures and A/C usage, since when the temperature drops (02-04-2019 till 05-04-2019), A/C increases and the opposite occurs when the temperature rises (09-04-2019 till 14-04-2019). It is also possible to observe how much more energy is spent when A/Cs work for more time.
5.2. Savings Actions Outputs
Before the automation rules were created, all sensors data were observed for a week, to understand how temperature and humidity changed considering the time of the day and outdoor temperatures. Users templates allow us to create a big picture overview and from this, the local administrator used works using the definition of rules for automatic actions. We chose this user manual approach over data analytics because local users introduce a human perception about the environment that allows increasing savings. In this section, we show some examples of this.
As expected, during the night period, temperatures were lower at around 2–3 °C and humidity was lower at 10%–20% (
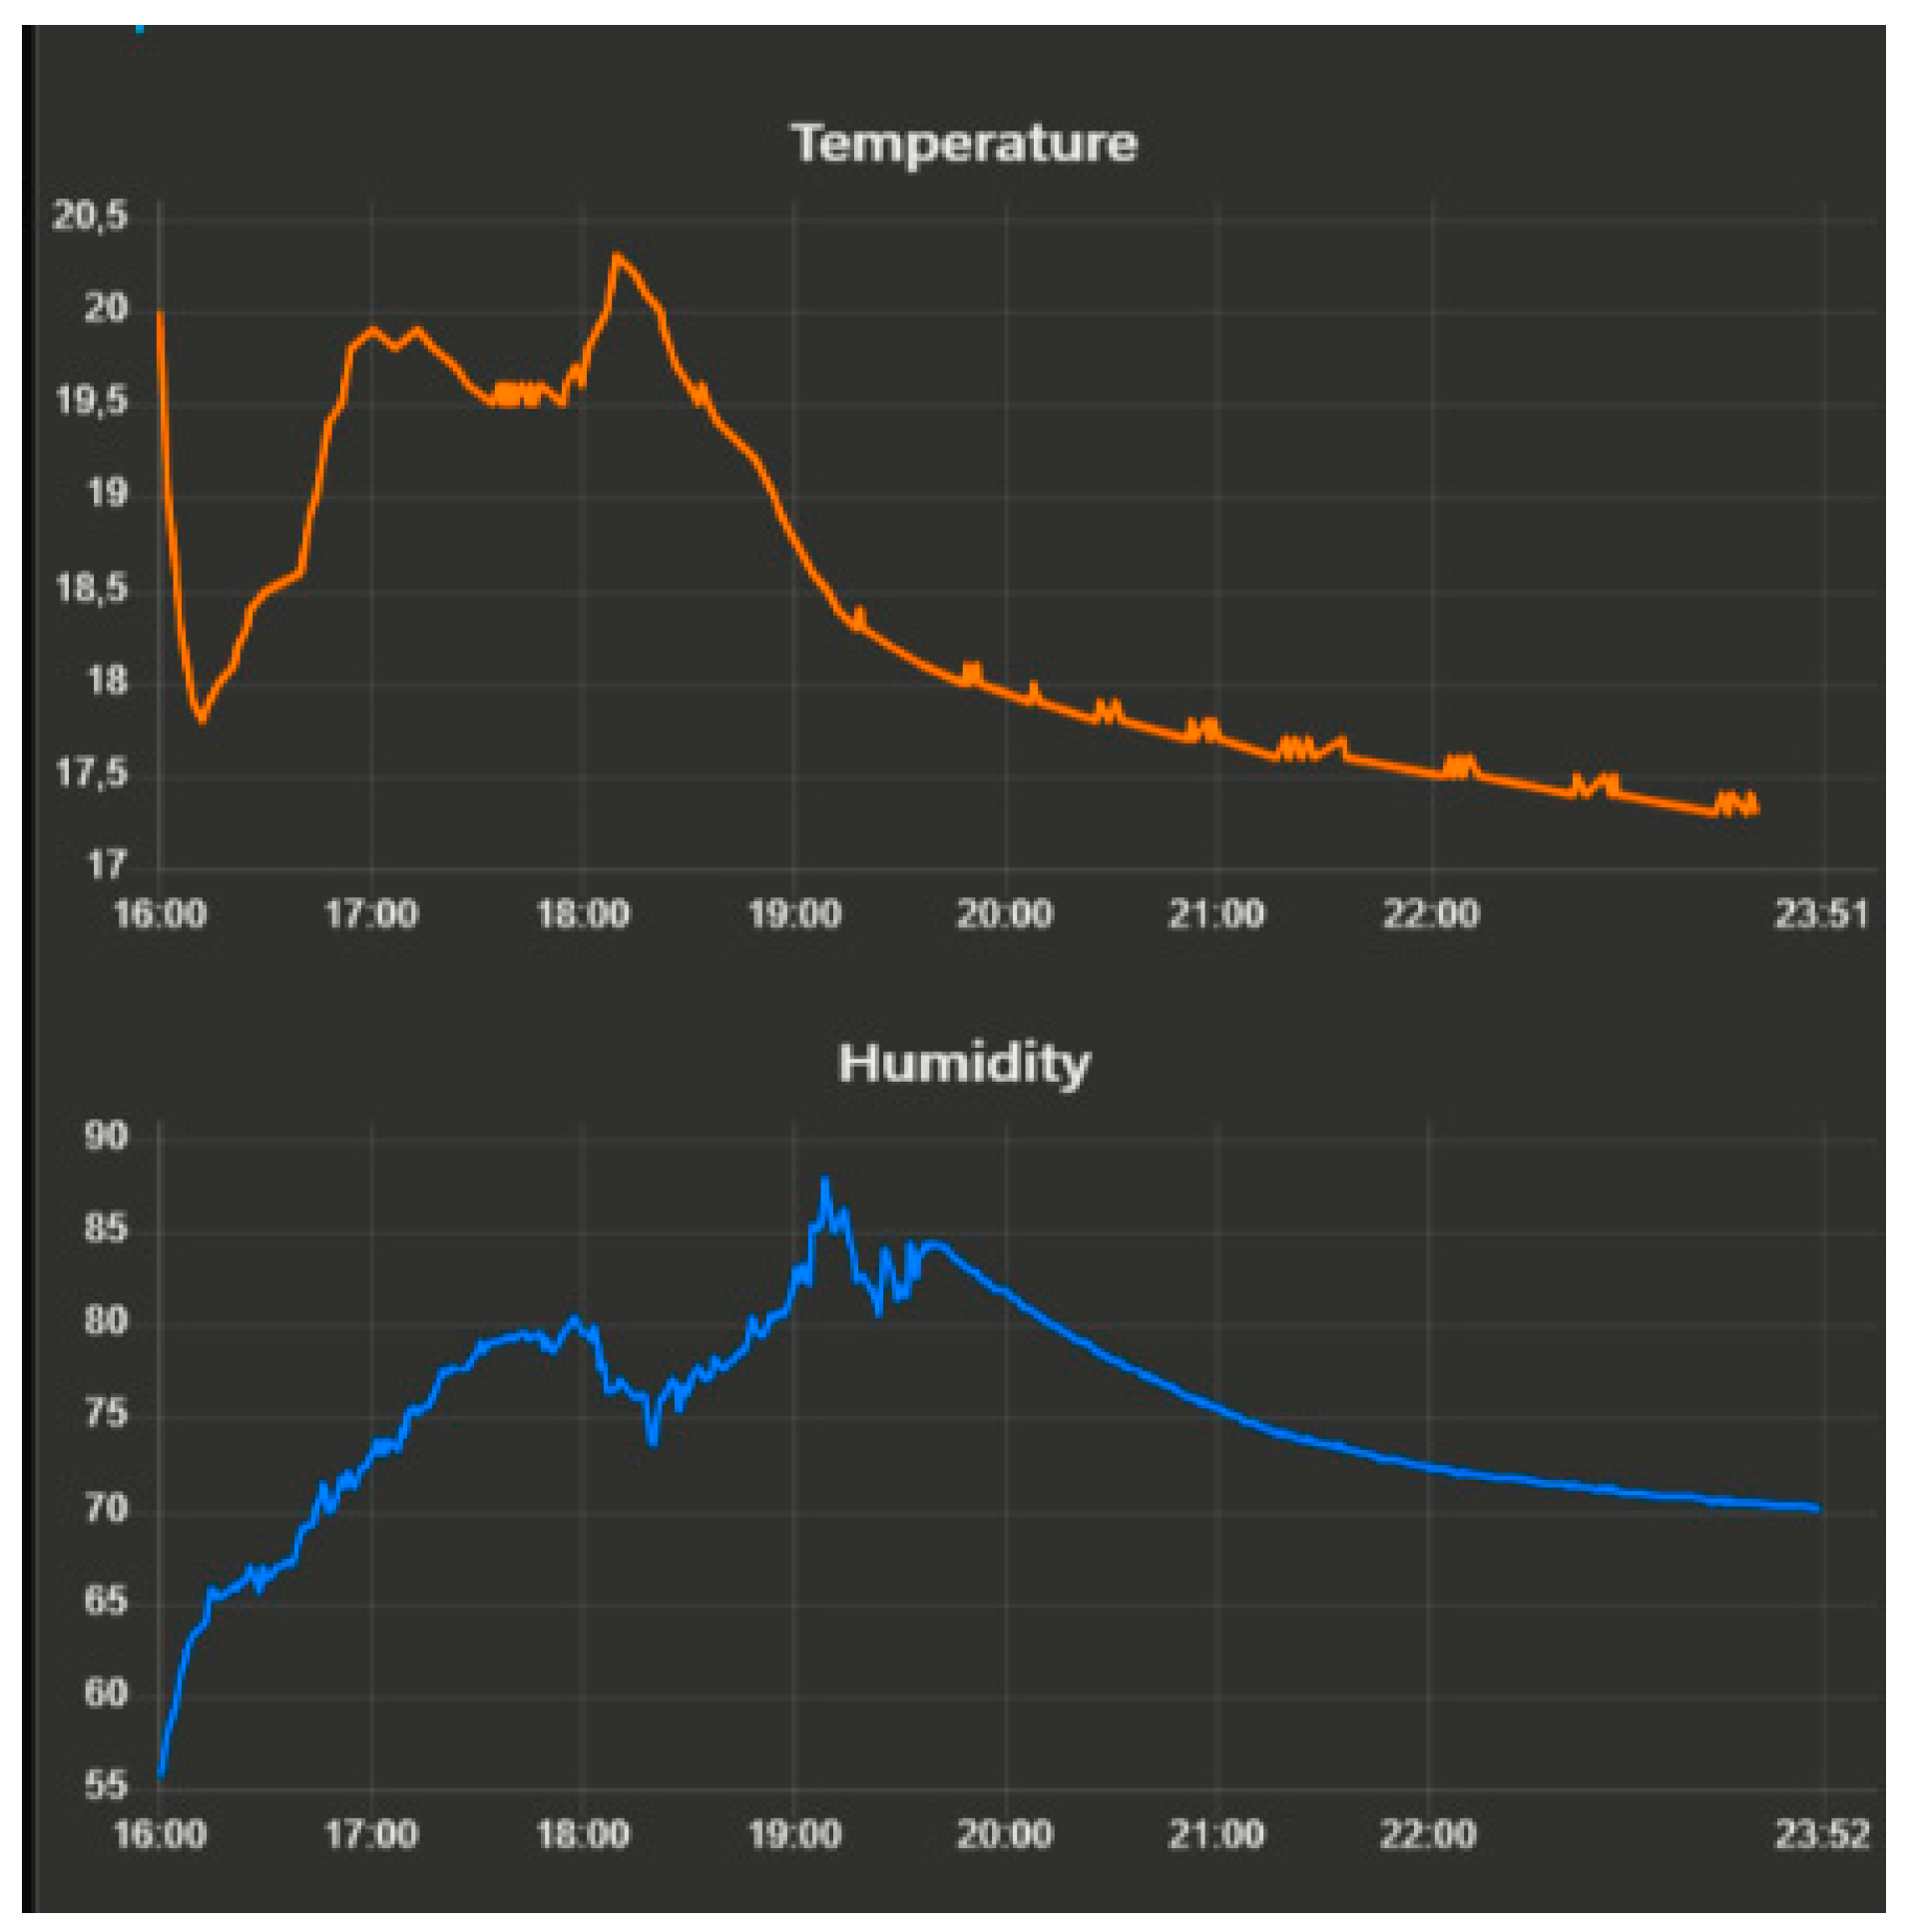
Figure 15, created from template 2). During labor hours, the temperature would quickly rise in the morning when the A/Cs were turned on, then remain constant until closing hours when it begins to drop after the A/Cs were turned off. To keep a constant temperature on each room during the day, air conditioning systems remain on until being manually turned off, and despite the pre-set temperature on the remote, the real room temperature is 1 to 2 degrees above that of the remote, which proves the inefficiency of standard A/Cs’ AUTO mode.
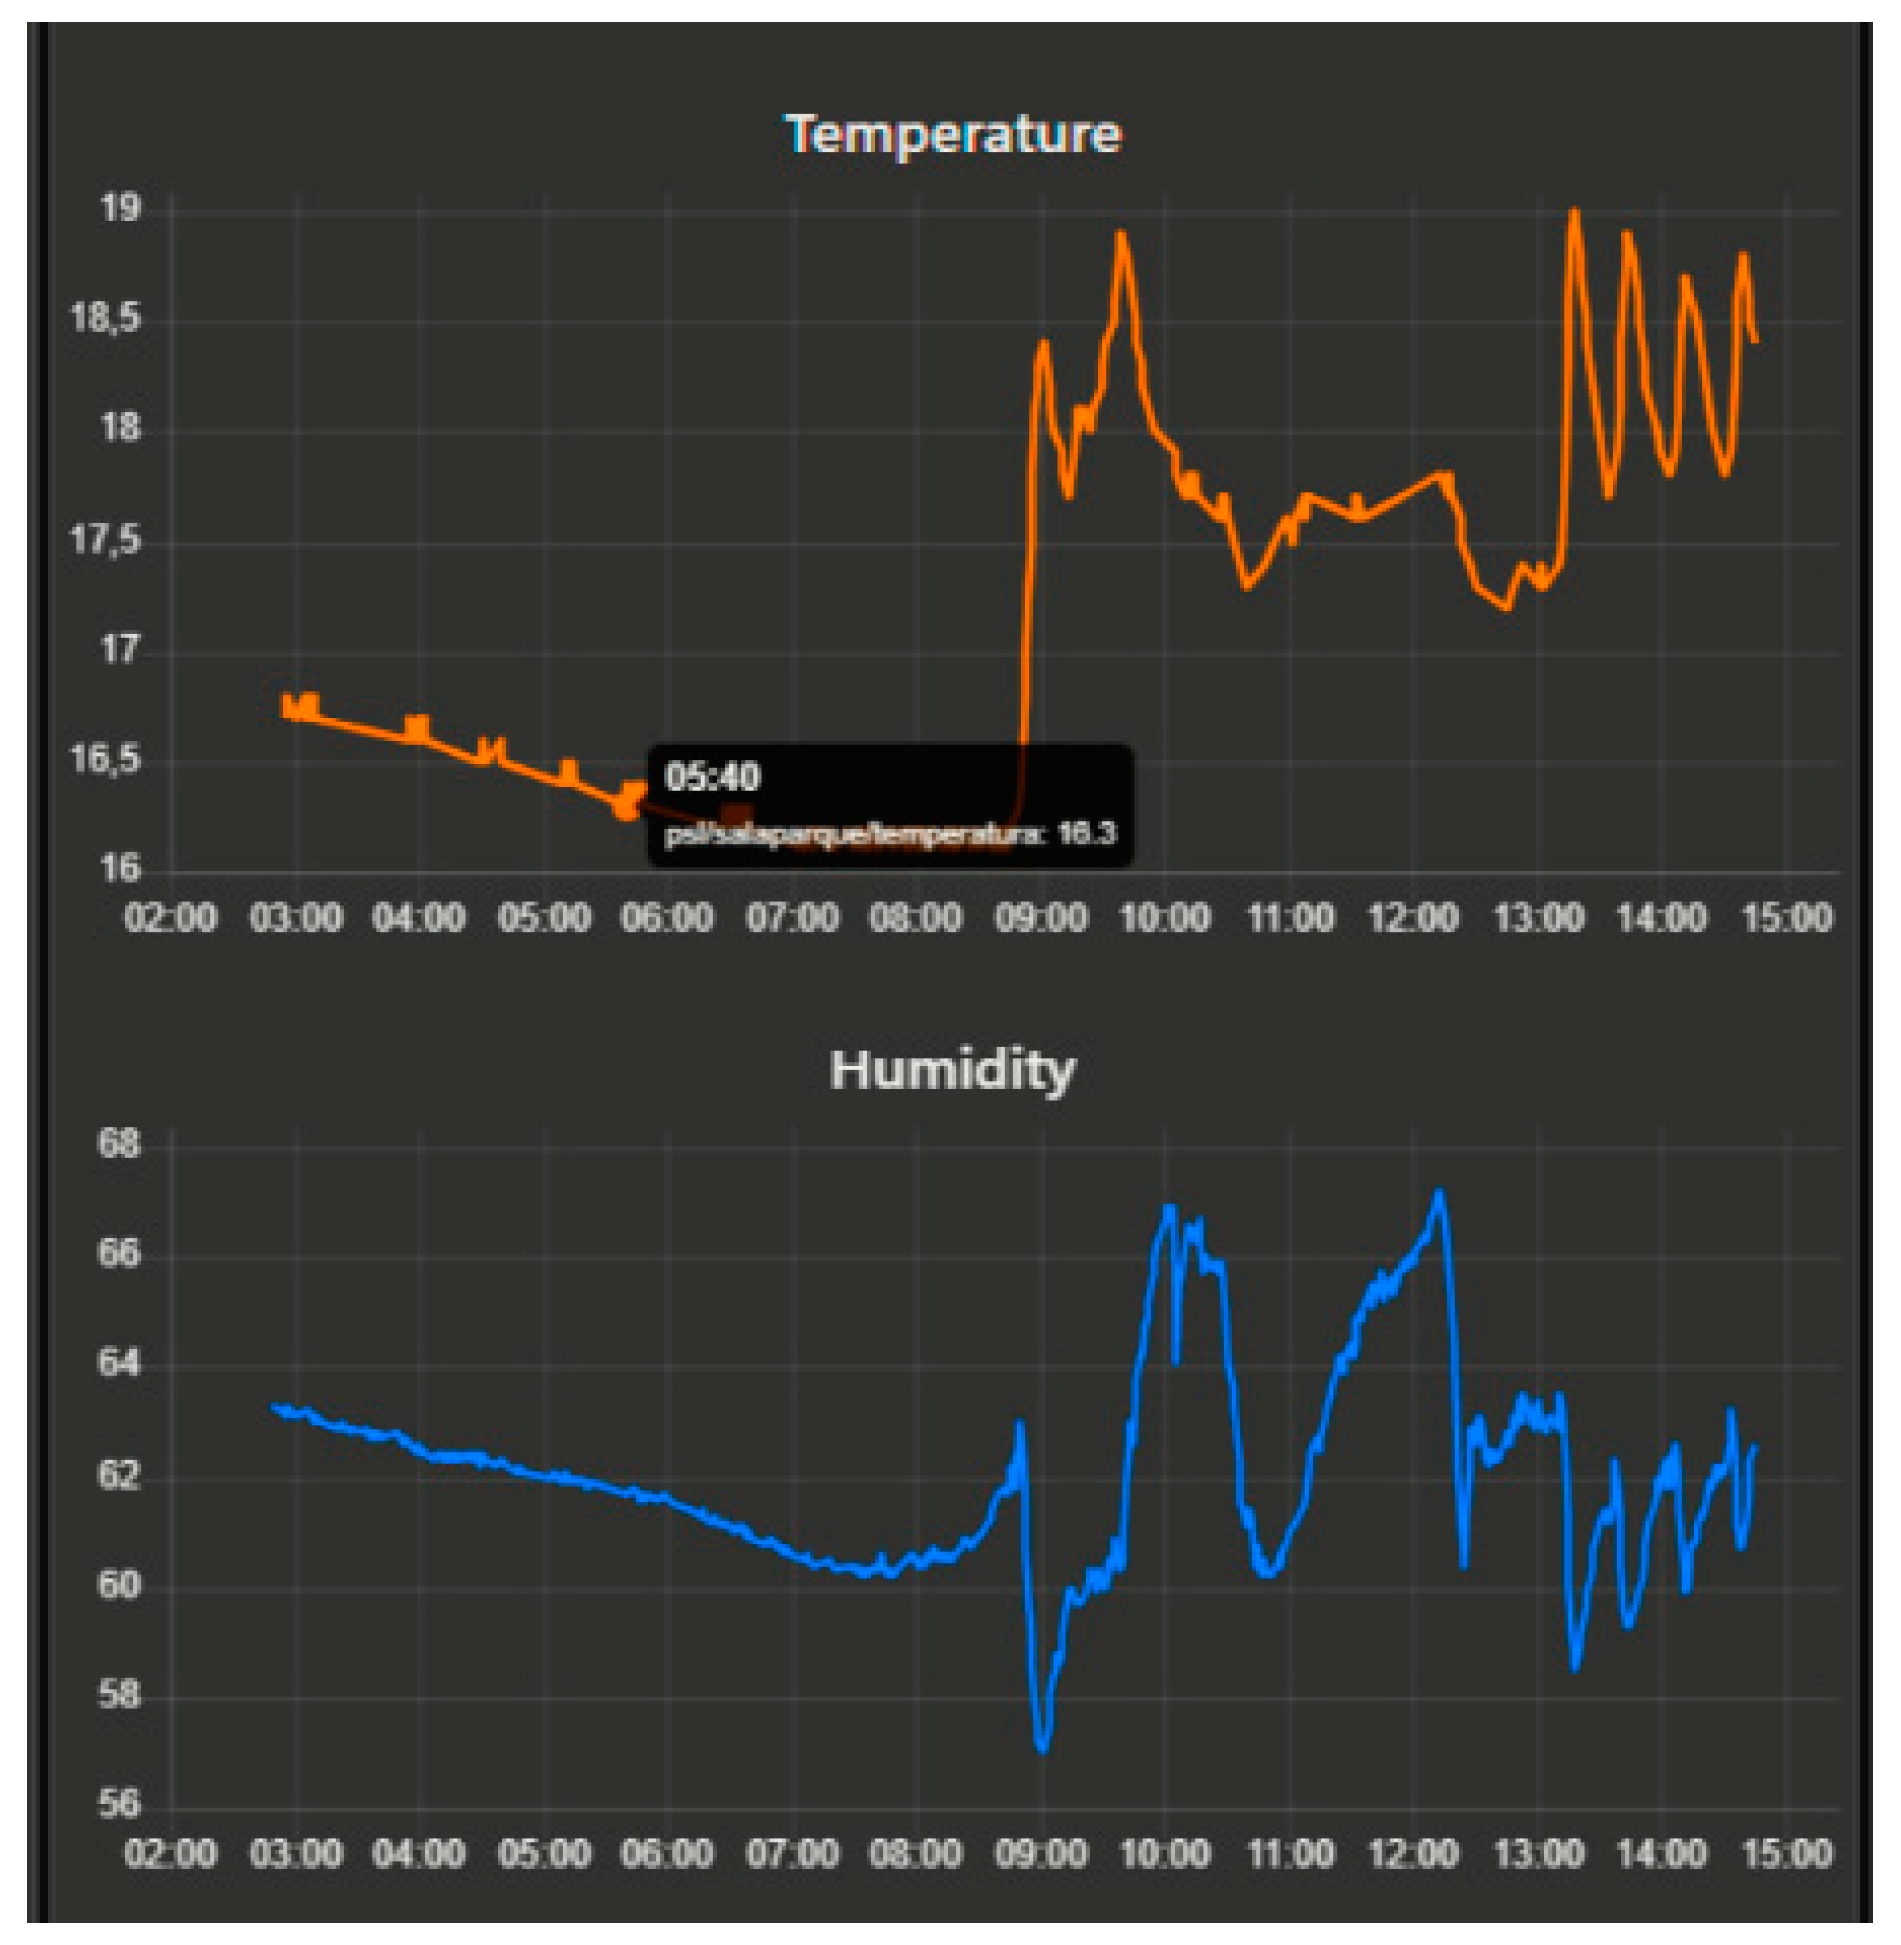
After the automation rules were implemented, the temperature behavior altered completely, changing from constant to a saw line type, (
Figure 16), this is due to the established maximum and minimum temperatures that regulate each room’s temperature according to these two limits. Besides limiting the temperature to a certain range, the system also prevents unnecessary usage when the room is empty and because the amount of time it remains off is significant, the energy saved is reflected on the daily consumption.
The amount of time each room takes to lower 1 degree after the A/C is turned off, is directly proportional to the room size and inversely proportional to the room capacity during the day, meaning that a smaller room with fewer students cools down much faster and requires more heating and more often.
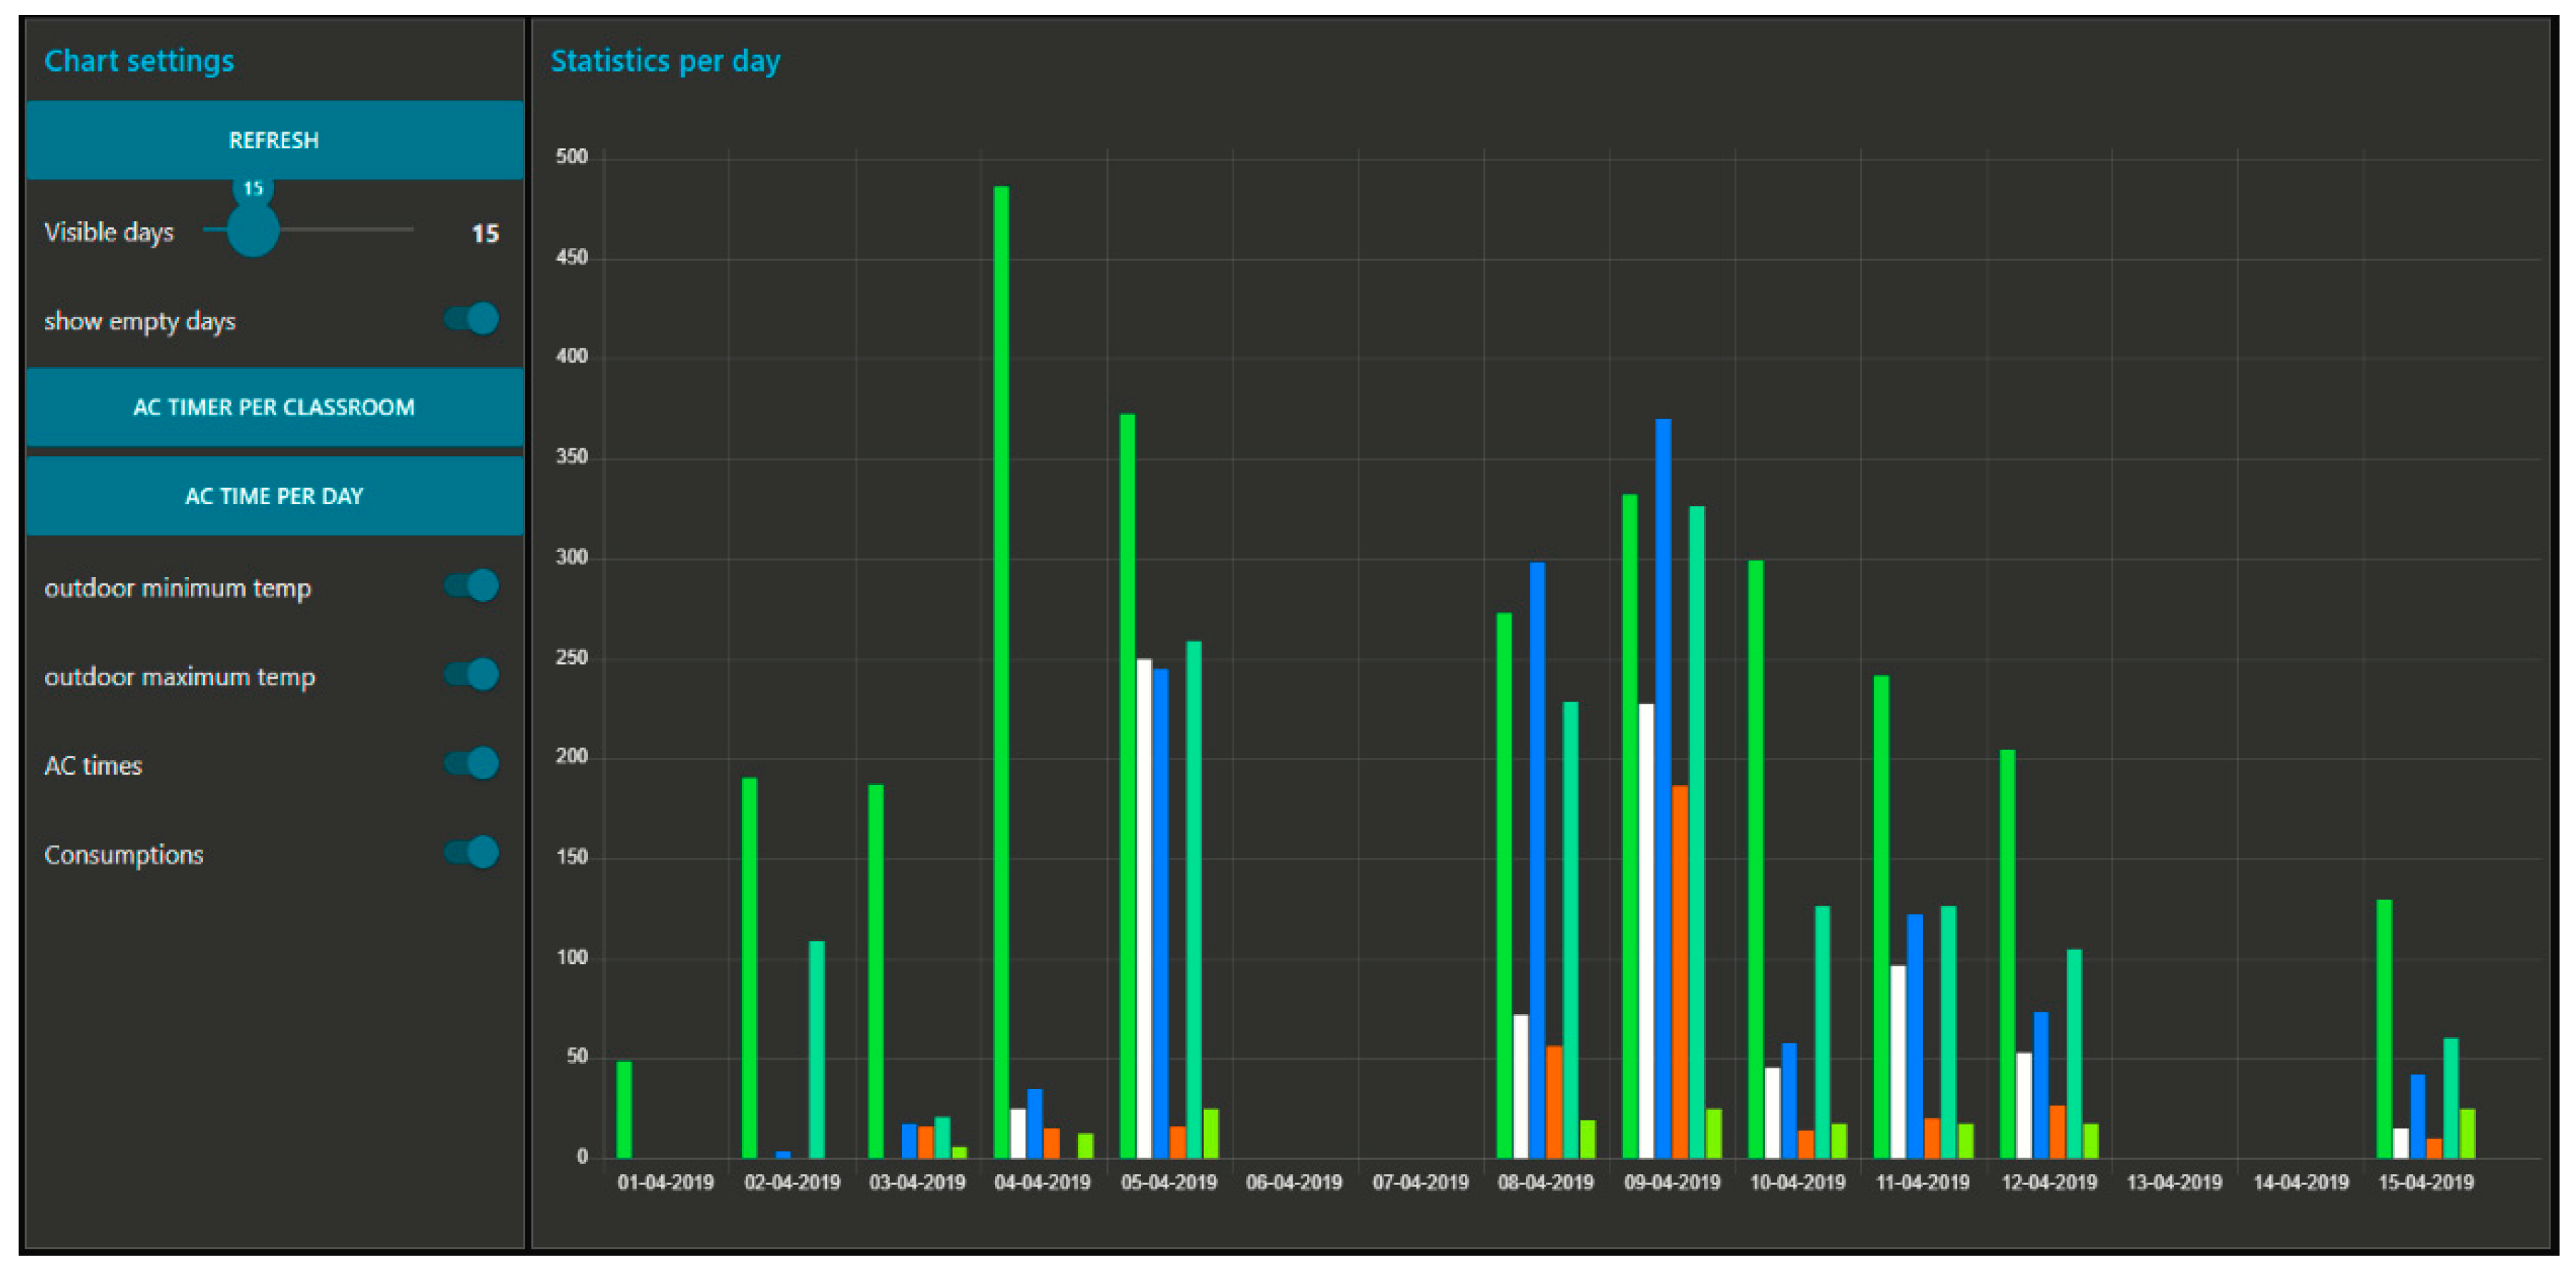
This is perceived on the next graph, (
Figure 17, created based on template 6), where the first column of each day representing the same room has more working time than all the others recurrently. This an example of an anomaly detected by interpretation of system data that allowed for discovering defective window isolation when during a rainy night, when the humidity all rooms was getting lower, while the humidity on a single classroom was showing the opposite behavior and getting higher. The interpretation of these facts allows the creation of rules to generate alerts and in some cases trigger actions.
The room that presented the fastest temperature drop rate, on a windy day, began to display unusual A/C working times, since it worked for hours straight without stopping. aAfter a detailed analysis of the room, it was discovered that a pipe inside a decommissioned energy circuit board cabinet connected to the high ceiling where temperatures are much lower and there is much less isolation, causing the cold air from the street to flow down the pipe into the room. This room is presented in the next chart (
Figure 17), as the first column of each day (green column).
Besides the anomalies mentioned above, another anomaly was detected multiple times, related to strange consumption values during the night or weekends, such as devices being left turned on when it was not expected, stand-by consumptions or malfunctioning appliances.
5.3. Energy Savings
Since 2016 when the energy monitoring system was implemented, and daily energy consumption during winter was on average 33 kWh, and daily energy consumption during Summer was 20 kWh on average, the knowledge about the consumption of the building allowed us to better understand the pattern and associate it with electric equipment who are responsible for most of the energy bill. Energy saving policies were established and allowed a significant reduction in power usage and costs for the first months.
This reduction was followed by a stability period when it was apparently impossible to reduce power usage and costs even more. However, as soon as the LoRa system was created another significant power consumption reduction took place.
As previously mentioned, the data analysis concluded that Kitchen appliances such as fridges or the dishwasher, and air conditioning systems were the main power consumers in the building, however with more precise data, the Node-Red dashboard allowed us to discover other cases where energy was being wasted. Doing an experiment with each circuit breaker at the main electrical switchboard the following standby power was detected:
3 circuit breakers powering an air conditioning unit each, and each of them had a persistent energy waste of 30 watts even with all units off, which meant 90 watts in total;
Emergency lights with a persistent power consumption of 50 watts;
Kitchen appliances such as the mosquito net spend 60 watts;
Each computer and monitor spends 5 watts even if they are completely off.
All the referred power usage is considered to be waste during non-labor days, non-labor hours, which represents 50% of the day or even more when there is no use during labor hours.
Using smart WiFi power sockets and a WiFi power socket for energy circuits, on each of these devices, and scheduling on and off timers, it’s possible to save more than 3 kWh per day, which at the current energy price is equivalent to approximately €364 per year, more than 3 regular months of energy costs.
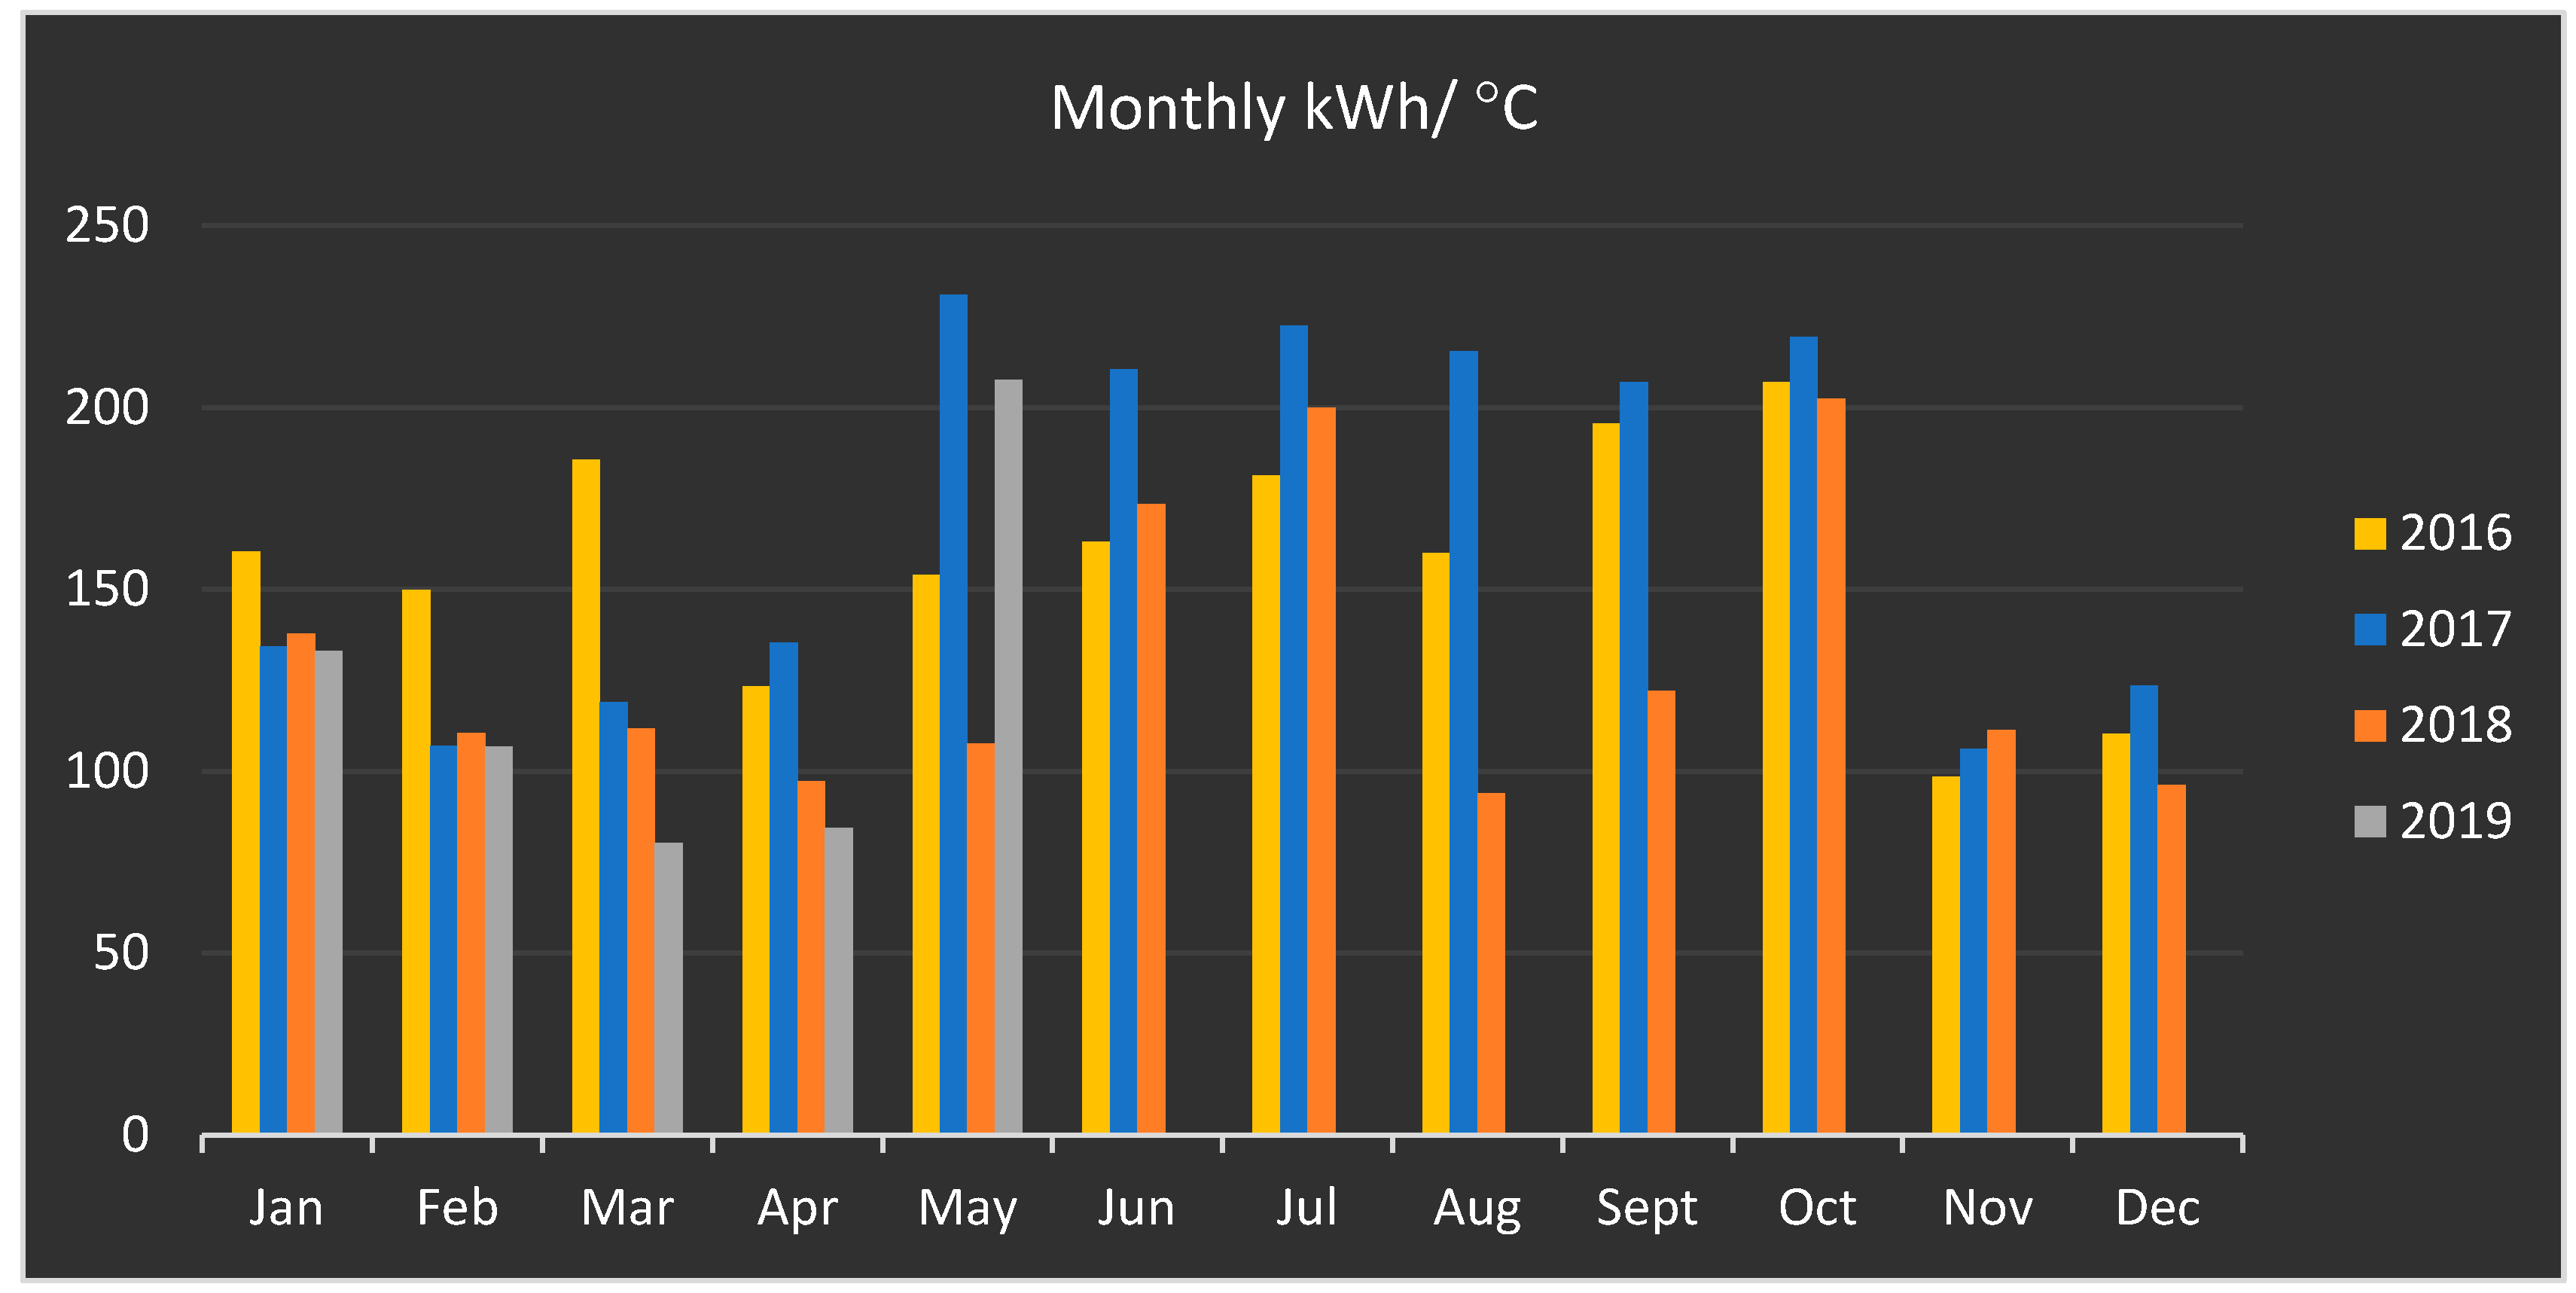
Figure 18 presents a monthly chart with the total energy consumption divided by the difference between 20 °C and the mean temperature of each month.
Since most parts of the system were implemented in February 2019 and the mean temperature increased during May 2019 (no A/C was required), the system effectiveness is only evident during March and April 2019.
5.4. Project Costs
Considering that item three and five were purchased during 2016 in Stage 1, and the rest of the hardware was purchased for and after the LoRa management system implementation, Stage 2 started on February 2019. The total project payback time is one year and seven months approximately; however, the LoRa system payback time is approximately ten months.
The project cost breakdown is described in
Table 3, considering all the acquired hardware since 2016. We can estimate from these values an initial cost of €194 for the energy monitoring system and a cost of €63.3 per room, or €4.4/m² in total. Devices such as the LoRa gateway installed on the Raspberry Pi would not be necessary if the building was within range of a LoRa antenna. Considering other facilities with bigger areas and more rooms, the project cost is expected to be significantly lower, since the LoRa approach allows the system to be easily scaled without further investments other than the sensor board itself.
6. Discussion
In 2016 the system was implemented, and successive improvements were performed based on the current approach of automatic saving actions based on the local working rules created by the local administrator based on data personalized visualization created by pre-defined templates. We introduced a novel MDA approach that provides automatic visualization personalized graphics to users that know the place but are not able to program. This easy approach to visualize collected data allows the creation of local heuristics to performs automatic saving actions on a regular basis. Another important factor is the LoRa communication (or similar low power long range communication) that allows battery sensors to be placed across the building without the requirement of a power outlet or a power source replacement for a few years, and continuously provide reliable data, essential to apply sustainable and efficient measures. Since the project began, more than 750,000 sensor readings were taken and stored, including 150,000 temperature readings.
During the project, we were able to identify several anomalies within the building, such as poor window isolation, appliances left on during the night, missed usage of ceiling lights with enough natural light and many devices with unnecessary standby power consumption. We also detected a major improvement on each room’s temperature levels with the LoBEMS system running and resulting energy savings.
In our case study shows in three years period, it was possible to save 3400 kWh (around €850) in a small building environment; taking into account the building tested area of 130 m2, this gives a saving of €2.2/m2 in a year. This solution applied to big scale building allows for even bigger savings.
Also, a real-time notification can be performed for email, SMS or mobile device App to alert for unexpected behavior. This approach can be applied to any building from houses to companies and campus, provide a monitor control environment. In this IoT, Low Power and Long Range communication, like LoRa, play an important role since sensors can be easily installed without cables using internal batteries. For measurements every 5 min, the small solar panels can easily recharge the batteries during the day, even if the total charge is enough to keep the sensors running for several weeks.
This information visualized and correspondent actions in these three years, conduct to save around 20% to 25% of the total energy consumption, and investments were paid in the first year of operation. Another important finding that we detected is that the system effectiveness at reducing energy consumption was continuously improving since the local administrator started to use it by himself. This was possible because Node-Red visualization templates enabled the modification of data visualization over time. Based on the available templates, variables and predefined charts, the administrator immediately started to changed heuristics and perfect the saving rules, by analyzing the provided indicators, as he intended, such as the chosen temperatures for each room, plugs schedules or warning employees about unsustainable behaviors detected with the system.
7. Conclusions
In this research work, we developed a novel approach that helps local administration entity to identify savings from personalized data visualization. These savings actions were locally implemented with the definition of personalized heuristics that are applied automatically. This is an interaction method with air conditioning (A/C) or heating systems that was developed based on an infrared approach, and can be applied to a diversity of equipment. The collected data is manipulated to create an integrated view in dashboards that can be sent to mobile devices.
Main highlights from this research work: a low-cost and fully developed solution for EMS, with an installation cost of around $2 per square meter with custom features design for the user. LoRa allows easy installation because no cabling is involved and real-time information and user behavior influence play an important role. Data visualization and data analytics are important for automation savings actions based on pre-defined rules. This node red visualization templates can be reused and allow for local building administrators to configure and personalize data visualization in a similar MDA approach for software that is developed based on pre-defined templates. This approach also allows for reducing development costs since we can reuse parts and provide automatic savings actions.
Our three-year data set is available at (
www.kaggle.com/brunomataloto/loems-lora) for scientific community usage. A/C units were turned on and off 3060 times when their usage was required or not required, and more than 130 kWh was saved, based on historical data. Besides all the improvements the system provided, both students and employees sense of comfort has increased. We use only open source software [
29,
30,
31], where a set of pre-defined templates, that can be used to other cases, allows data visualization and from this consumption, reports are available in real-time. From another tested implementation at our university campus, we found that, at public places where local administrator entity does not enrol in sustainability actions, this proposed approach also works, but it doesn’t provide increasing savings through time, because the system works partly based on initial performed configuration and also further user interactions to perfect the implemented rules from the gathered data. To overcome this limitation, we are working in a user collaborative approach, where local context real-time information is provided to users’ mobile devices in a form that can influence them to perform saving actions.


