Article

Utilizing HRV-Derived Respiration Measures for Driver Drowsiness Detection

Bio-Intelligence & Data Mining Lab, School of Electronics Engineering, Kyungpook National University, Daegu 41566, Korea
*
Author to whom correspondence should be addressed.
Electronics 2019, 8(6), 669; https://doi.org/10.3390/electronics8060669
Submission received: 13 May 2019 / Revised: 10 June 2019 / Accepted: 12 June 2019 / Published: 13 June 2019

Abstract

:
This study aims to utilize heart rate variability (HRV) signals obtained with a wearable sensor for driver drowsiness detection. To this end, we investigated respiration characteristics derived from HRV signals based on the known fact that respiratory activity can be estimated from the high frequency (HF) band of HRV signals. For drowsiness detection, many earlier works commonly used dominant respiration (DR) characteristics. However, in some situations where emphasized power in a power spectrum of HRV occurs at multi sub-frequency, the DR measures may possibly fail to capture overall respiration characteristics. To handle this problem, we propose two spectral indices, the weighted mean (WM) and the weighted standard deviation (WSD) of the HF band in the power spectrum. These indices are used to properly capture the overall shape of the respiratory activity shown through the HF band of the HRV power spectrum as an alternative to the DR measures. For experiments, we collected HRV data with an electrocardiogram device worn on the body under a virtual driving environment. The proposed indices somewhat clearly showed the tendency that respiratory frequency decreases and respiration regularity increases in drowsy states of all subjects, while existing DR measures hardly showed this. In addition, when the proposed indices are used alone or together with conventional HRV-related measures as input features for classification models, they showed the best performance in distinguishing drowsiness from wakefulness.

1. Introduction

A driver’s drowsiness is one of the main causes of traffic accidents. According to recent studies [1], up to 30% of deadly car crashes are known to be associated with sleepy driving or driver’s fatigue. Thus, the problem of detecting driver’s fatigue or drowsy conditions is very important for the prevention of car accidents in real life. Until now, there have been many studies that automatically detect drowsiness of driver based on various bio-signals. The heartbeat signal is one of the most common signals for this purpose and has the advantage that it is relatively easy to measure non-invasively in a driving situation with a wearable device.
According to Reference [2], the state of sleep (particularly, NREM sleep) shows the reduction in physiological activity where both breathing and the heart rate slow down. Moreover, breathing becomes deeper and more regular with deep sleep [3]. Particularly, in driving situations, it was shown that respiratory frequency tends to decrease, while respiratory regularity tends to increase, in the drowsy state [4,5]. Thus, respiration information has been often used to assess drivers’ drowsiness [6,7,8,9,10,11,12]. Respiration characteristics of a specific time range have been often estimated from the power spectrum of the respiration signal in the time range. For example, in the study of Vincente et al [5], two measures of dominant respiration power (DRP) and DRP percentage (DRP%) were extracted from the power spectrum of respiration to capture respiratory regularity. Here, the DRP was calculated by first estimating dominant respiration frequency (DRF) from the power spectrum of respiration and then integrating power around DRF. DRP% was obtained by taking the ratio of DRP to the total power of the spectrum. The larger values of DRP and DRP% indicate that the respiration power is more concentrated at the narrow region around a specific frequency. Thus, such measures can be understood as reflecting the degree of the regularity of respiration. Similarly, Takahashi et al [11] measured the respiration curve from strain gage bandaged at the abdominal region, and estimated peak power frequency (i.e., DRF) and median power frequency (MDF) from the respiration power spectrum. They showed the DRF, MDF, and the difference between DRF and MDF are related to sleepiness level. Here the difference between DRF and MDF reflects the degree of respiration regularity like DRP%.
On the other hand, some attempts have been made to investigate respiration characteristics from other measurements of respiration signals. For instance, Lee et al [7] extracted the second peak in the autocorrelation function of the respiration signal over time and considered it as reflecting the regularity of respiration. The higher value of the peak indicates that the respiration signal is more strongly correlated to the lagged version of the signal, implying higher regularity of respiration. Long et al. [13] measured the respiration signal from respiratory inductance plethysmography (RIP) and used the sample entropy method to estimate the regularity of the respiration signal. They confirmed that the estimated regularity can be effective to discriminate wake and light sleep.
It has been known that breathing activity can be approximately estimated from HRV signal, in particular, from the high frequency (HF) band (i.e., 0.15–0.4Hz) of HRV signal [14]. Thus, the HF band of HRV power spectrum can be regarded as the substitute for respiration power spectrum. Some researchers examined the HRV-derived dominant respiration activity and showed its usefulness in drowsiness detection. For example, Tateno et al [15] estimated the breathing numbers from heart rate signals obtained by pulse wave sensor and showed that the estimated numbers are very close to actual breathing numbers. From these results, they confirmed that the use of respiratory signal derived from the heart rate signal is more useful to detect drowsiness than the use of the heart rate signal itself. Also, Bourghelle et al [16] estimated breath-breath intervals (BBIs) from twenty-lead ECG signal and demonstrated that the BBI mean and difference between BBI max and BBI min can be helpful to detect driver drowsiness. Similarly, Vincente et al [5] showed that the measure of DRP% derived from 2-min two-lead ECG signal can improve the performance of drivers’ drowsiness detection.
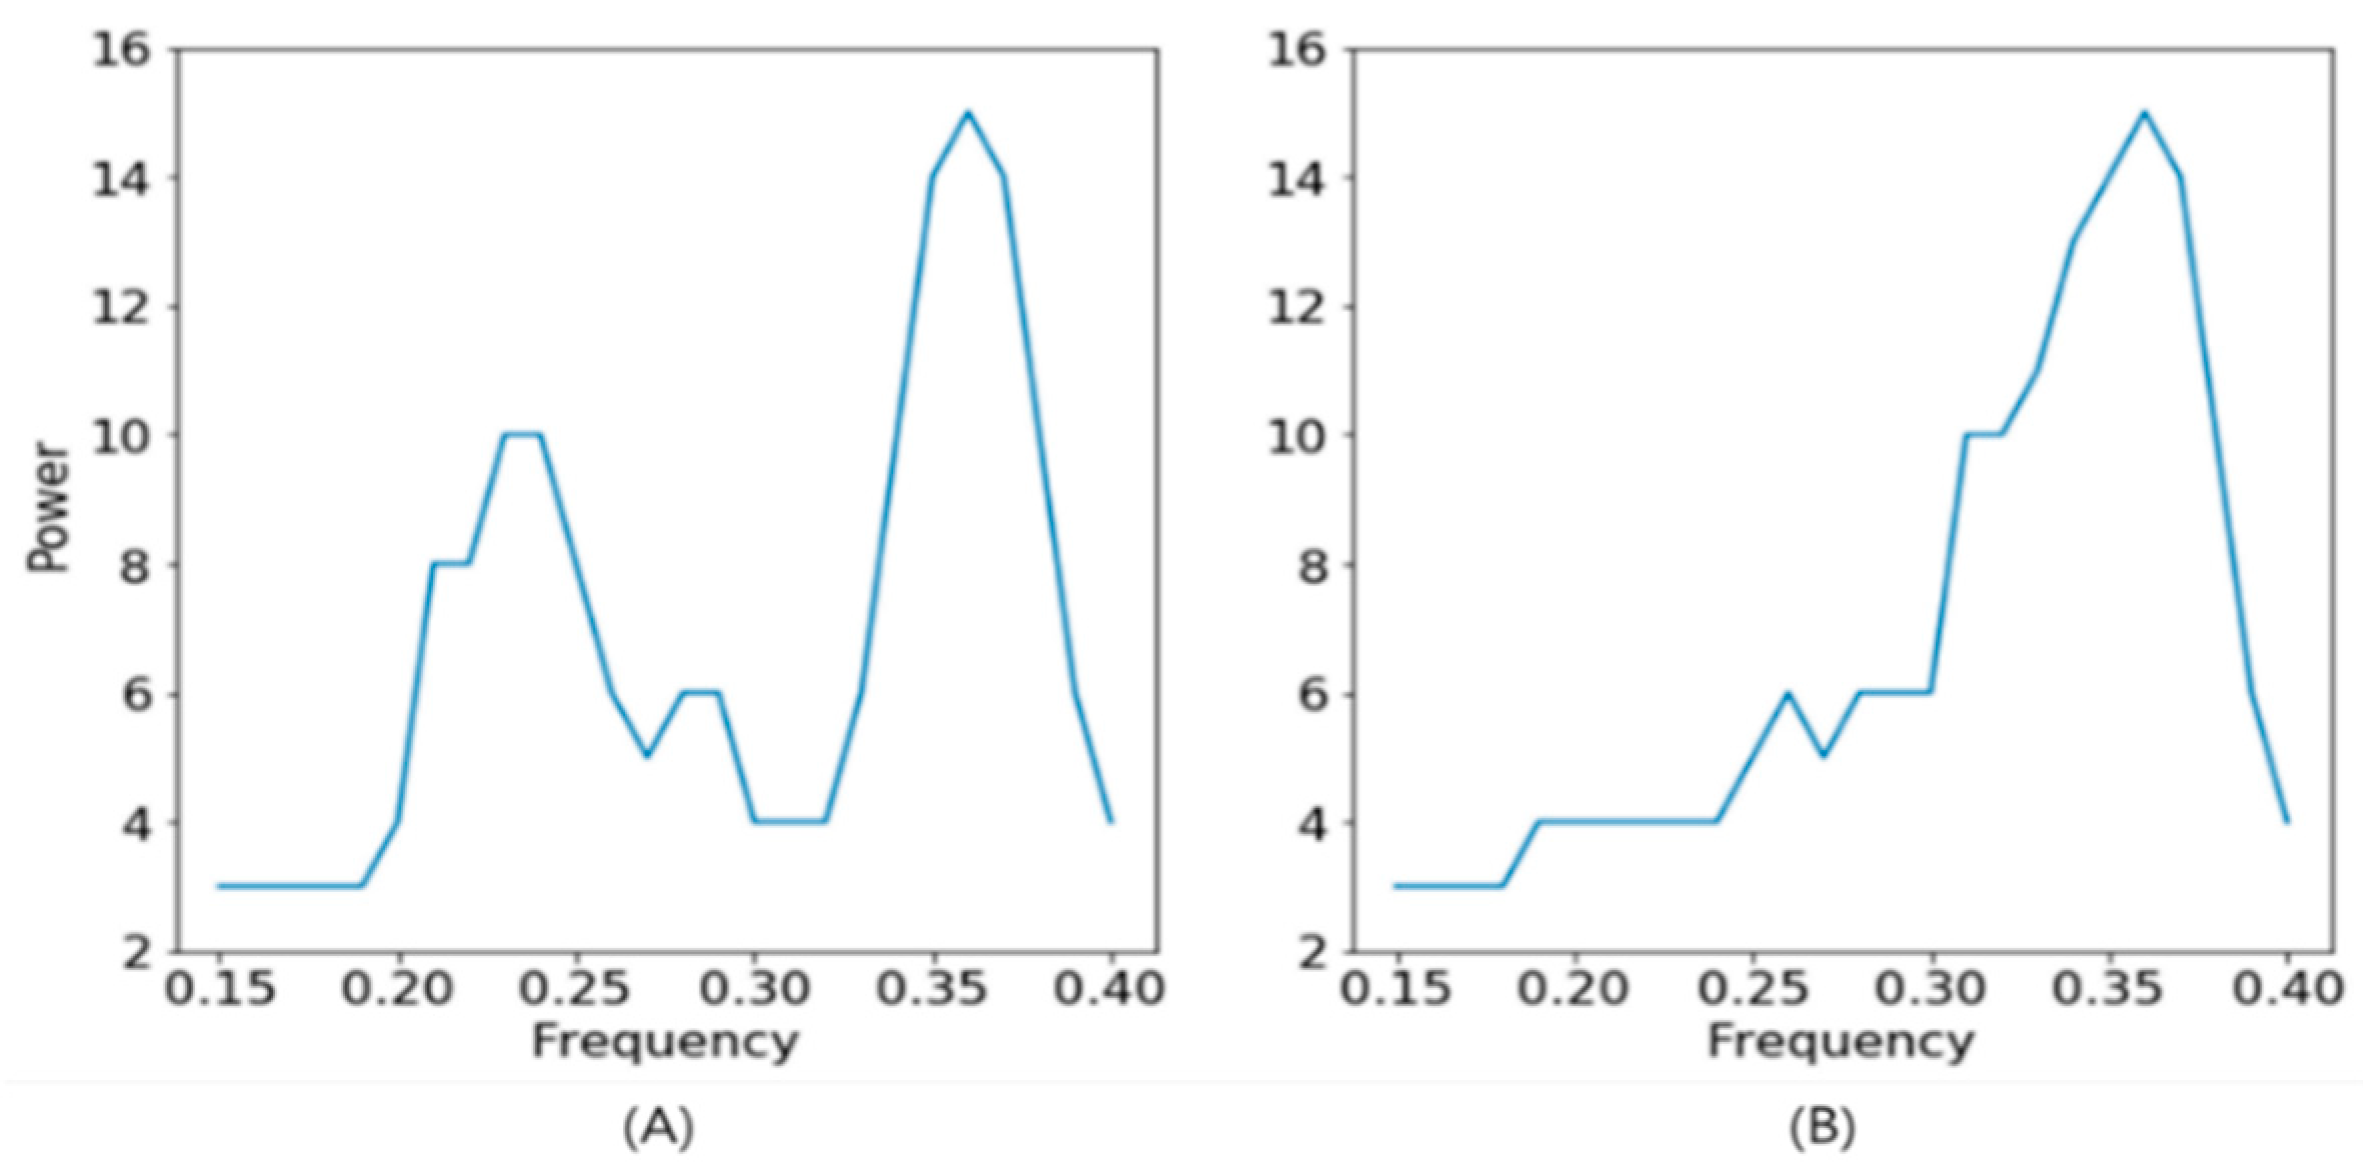
In spite of their usefulness, however, the measures of dominant respiration activity (like DRF or DRP%) may not be enough to capture breathing activity in the drowsy state. For example, in some situations where emphasized power in a power spectrum of HRV occurs at multi sub-frequency like Figure 1, DRF or DRP% may possibly fail to provide overall respiration characteristics. In this figure, both cases of (a) and (b) have almost the same DRP
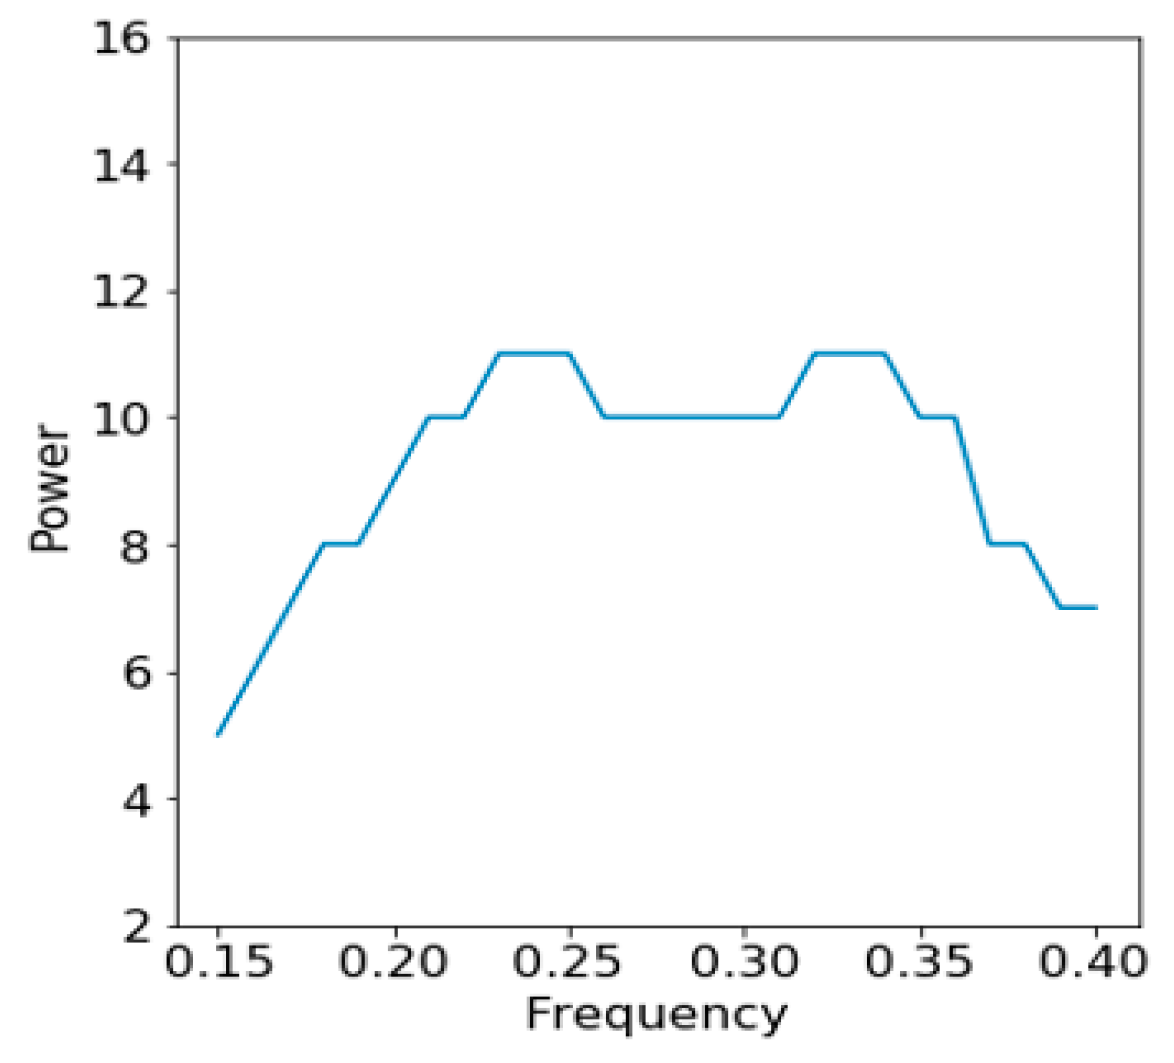
%, although they have different respiration characteristics. In addition, there are other situations, like Figure 2, where it is difficult to define a single peak point in the power spectrum. Therefore, it seems worthwhile to investigate new HRV-derived measurements that can well capture the differentiated activities of breathing between drowsy and wake states.
In this paper, we aim to investigate new measures for the HRV-derived respiration power spectrum that well reflects the characteristics of respiration related to driver’s drowsiness. For this purpose, we suggest two new spectral measures that can capture the overall shape of respiratory activity shown through the HF band of the HRV power spectrum, not requiring to find dominant respiration frequency. To evaluate the usability of the proposed measures, we employed them as input features to classification model for driver drowsiness detection and evaluated which of existing dominant respiratory measures and two proposed measures are more effective in assessing driver’s drowsiness. This study has been done based on the assumption that the information of respiratory characteristics can be extracted from HRV signals obtained with wearable devices, even in driving situations.

2. Materials and Methods

2.1. Data Collection and Preprocessing

A virtual driving environment was set by using the FANATEC virtual driving hardware set and the Euro Truck Simulator 2 program as shown in Figure 3. The hardware set consists of a steering wheel, a pedal and a chair, which provides a very similar environment to actual driving. Originally, we collected 37 recordings of 6 subjects with a strap type of wearable ECG device under the environment. Out of 37, however, those with more than 1% of poorly measured RR-interval values (RRIs) were excluded from this study. Thus, we finally used 20 recordings of 6 subjects for experiments. Here all subjects gave their informed consent for inclusion before they participated in the study. The study was conducted in accordance with the Declaration of Helsinki. The subjects were composed of 5 males and 1 female having no sleep-related illness between the ages of 25 and 35. The data collection was made carefully under some constraints that participants should not have caffeine drink at least 4 h before measurement. They were also asked to drive over 1 h without breaks on the same virtual route, provided by the simulator program, more than 80% of which is a straight course or a gentle curve course. In addition, each subject was guided to do his (or her) best to keep the lane steady along the path, while keeping as close to 80–90 km/h speed as possible and minimizing unnecessary movements for driving. Under such environments, HRV data (i.e., RRIs) were collected via a PolarH7 device which is a comfortable wearable electrocardiogram (ECG) instrument. The average running time of each recording was approximately 67 min. For the labeling purpose of drowsiness, we additionally recorded two videos of the driver’s upper body and simulator screen, respectively, at the rate of 15 fps.
For noise filtering, such RRIs having the values greater or less than 20% of the mean of the neighboring 10 RRIs were considered as poorly measured values and removed out. This process was repeated until there is no RRI to be removed. Those recordings with more than 1% of RRIs filtered out were excluded from this study. Then we performed cubic interpolation with the remained RRI sequence and obtained new RRI data having a constant time interval at the sampling rate of 0.5 seconds.

2.2. Labeling Driver’s Drowsiness

For drowsiness labeling of the HRV data, we defined the drowsy event as the state in which a subject cannot drive properly due to drowsiness, or the state in which a subject is judged to fall into sleep very soon. On the other hand, the ‘wake’ state means that a subject is in the state of showing no or only a little drowsy phenomenon while keeping stable driving.
The labeling of each recording was done based on the presumption that if no rests are taken after the first occurrence of a drowsy event, the drowsiness of a subject will maintain until the end of a recording. Thus, the first occurrence of a drowsy event in a recording was found based on the criteria given in Table 1. To define the criteria of drowsiness, as in Reference [17], we considered two main aspects: Whether a car runs steadily (monitored by simulator screen video), and whether a driver is sufficiently focusing on driving (monitored by driver upper body video). Once a drowsy event is found, each 1-min RRI before the first drowsy event was labeled as ‘wake’, while every 1-min RRI after the first drowsy event was labeled as ‘drowsy’. If one drowsy event or more is found in a 1-min epoch, all subsequent epochs including the epoch were labeled as ‘drowsy’. The epoch size was set to be 1 min. As a result, for all recording data with 1342 min long, 384 epochs were labeled as ‘wake’ and 958 epochs were labeled as ‘drowsy’.

2.3. Calculating Dominant Respiration Measures

To find dominant respiration characteristics, we first set the time-points every 0.5 s in a recording. The power spectrum for each time-point was then obtained with 12 s neighboring RRI data centered on the time-point by using fast Fourier transform (FFT) and bandpass filtering. The range of finite impulse response (FIR) bandpass filter was set between 0.15 Hz and 0.5 Hz. Finally, we considered FFT power spectrum filtered by the bandpass filter as the HRV-derived respiration power spectrum.
From the power spectrum, we need to identify potential DRFs. First, we set the window size of 0.05 Hz with shift by 0.005Hz and calculated the ratio of integrated power in the window to total power in full range for each window. If the ratio values are less than 0.35, we set them to zero, because the dominant respiration frequency should have a power ratio of at least 0.35 according to Bailón et al. [14]. Then, to find a DRF in a specific time range, we built power spectrums for each time-point defined in the given time range, and for each window of frequency in the power spectrums, calculated the average of the integrated power ratios over the time-points in a given time range. Out of the averaged power ratios for each window of frequency, we selected the frequency window with the highest ratios as the DRF and used its power ratio as the DRP% for the given time range.
In this study, we set the length of time range as 120 s or 40 s. The length of 40 s was chosen for comparison with the Bailón’s work, and the length of 120 s was chosen because it showed empirically good results. Hereinafter, we denote ‘DRF’ and ‘DRP%’ for dominant respiration frequency and power ratio based on 120 s signal length, respectively. We denote ‘DRF40’, ‘DRP40%’ based on 40 s signal length. For experiments, we set time-points every 0.5 s in a recording and calculated DRF, DRP%, DRF40, and DRP40% for each time-point.

2.4. Calculating the Proposed Measures

To well distinguish the regularity of breathing between wake and drowsy states, we proposed the two spectral measures, the weighted mean (WM) and the weighted standard deviation (WSD), of the HF band in an HRV-derived power spectrum. These measures can be obtained by using the power values of all sub-frequencies in the spectrum as weights. Specifically, for a given time range of RRI data, the power spectrum is obtained, just as in calculating dominant respiration measures, except with 120 s RRI data or 40 s RRI data. With these spectrums, the proposed measures of WM and WSD are then calculated by using the following Equation (1).
WM = f = 0.15 Hz 0.4 Hz W f f f = 0.15 hz 0.4   hz W f WSD = f = 0.15 Hz 0.4 Hz W f ( f WM ) 2 f = 0.15 Hz 0.4 Hz W f
where f { 0.15 hz ,   0.16 hz ,   0.17 hz ,   ,   0.40 hz } and Wf is a power value at the given frequency f of the HRV-derived respiration power spectrum.
For convenience, hereinafter, we denote WM and WSD for 120 s data, while denoting WM40 and WSD40 for 40 s data. Since WM reflects the average frequency of respiration weighted by power values and WSD reflects the degree of respiration irregularity, by combining them together, they are expected to somewhat capture overall characteristics of HRV-derived respiration power spectrum. Particularly, the large value of WSD implies that there exists a high degree of respiration irregularity.

2.5. Calculating Existing HRV Measures

Many earlier studies have often used some HRV related measures for drowsiness detection. Thus, we calculated and used several commonly used HRV measures for comparison, which include low frequency (LF) power, low frequency (HF) power, LFHF power ratio, and very LF (VLF) power, in predicting drowsy states of the driver. Here, to obtain integral power, we used the power spectrum obtained with RRI data of 120 s.

2.6. Feature Extraction for 1-Minute Epoch

Because labeling was done in 1-minute epochs, we also obtained the summarized measures for each 1-minute epoch and used them to learn a prediction model for drowsiness detection. To define the summarized measures for 1-minute epoch, we used four summation method, including minimum (Min), maximum (Max), arithmetic mean (Mean) and standard deviation (STD). Since all the measures in this study are calculated every 0.5 s in a recording, we can have 120 values for each 1-minute epoch, and obtain four summarized values (Min, Max, Mean, STD) from them with each measure. Along with them, we also employed their normalized values for experiments, which are obtained by subtracting out the mean value of the first 3 min data of each recording from the original values of every epoch in the recording. Eventually, for each measure, we generated 8 feature values (including Min, Max, Mean, STD, Min_nor, Max_nor, Mean_nor, and STD_nor).

3. Results

3.1. Distinguishability of the Proposed Measures between Drowsy and Wake States

According to many studies related to drowsiness, it has been said that the frequency of breathing tends to decrease while the regularity of breathing tends to increase. To verify these phenomena in our dataset, we investigated the distinguishability of the proposed measures in classifying drowsy and wake states. This was done by visualizing all the epoch data (labeled as drowsy or wake) in terms of the two proposed measures, WM and WSD. Figure 4 shows the scatter plots of the proposed features, WM maximum and WSD maximum, for the HRV-derived respiration epoch data of each subject. From this figure, we can observe a reasonably good distinguishability about drowsiness that shows the decreasing trend of breathing frequency and the increasing trend of breathing regularity in drowsy states of each subject, although some data does not show, or makes unclear, such a tendency.
For comparison, we also examined the distinguishability of other common measures in the same context. Figure 5 shows the scatterplots of the two most common measures, DRF maximum and DRP% minimum, for the same data used in Figure 4. In this figure, unlike Figure 4, it is hard to find a good distinction between drowsy and wake states in most of the subjects. These observations support the idea that the proposed measures can work better on each subject than the existing common measures in capturing the distinctive features of respiration related to drowsiness. Based on these results, it is expected that the proposed measures may work better for unknown subjects in detecting drowsiness in driving situations. Thus, we also examined the ability to distinguish drowsy states from wake states in the pooling data of all subjects. Figure 6 shows the scatterplots of the proposed measures in (A) and the existing common measures in (B) for the same data. Figure 7 shows their discrimination ability in terms of the receiver operating characteristics (ROC) curve when each feature set is used for support vector machine (SVM), random forest (RF), and k-nearest neighborhood (KNN) models, respectively, in a manner of recording unit cross-validation. In these figures, as expected, we could also observe better distinction with the proposed measures than the existing respiration measures.

3.2. Prediction Performance for Driver Drowsiness Detection

To verify the usefulness of the proposed measures for drowsiness detection, we built three different prediction models that employ RF regression, SVM regression, and KNN regression, respectively. Each model was trained to predict the state of the driver in the given epoch based on its feature values of the epoch. The prediction result of each model is determined by considering its output value according to the specified threshold. If the output value of a model is greater than the threshold, the final prediction is made to be ‘drowsy’. Otherwise, the prediction is made to be ‘wake’. By adjusting the threshold, we produced the ROC curves, as shown in Figure 8, to compare the prediction performance of several different models employing different feature sets. For evaluation, we used the leave-one-out cross-validation (LOOCV) method of recording unit. For prediction modeling, we set up to create 100 trees for RF and used Gaussian kernel function for SVM. For KNN, k was set to 5 and all the feature values were z-transformed before modeling. Here, the performance was evaluated in terms of the area under curve (AUC) of ROC.
To compare the predictive performance using all features, we prepared three different feature sets, called ‘Proposed’, ‘DominantResp’, and ‘HRV’, and learned several prediction models based on single or combined feature sets. The feature set of ‘Proposed’ contains the features of our proposed measures (i.e., WM, WSD, WM40, WSD40), the feature set of ‘DominantResp’ contains those of dominant respiration measures (i.e., DRF, DRP%, DRF40, DRP40%), and the feature set of ‘HRV’ contains those of conventional HRV related measures (except respiration), which are low-frequency power (LFP), high-frequency power (HFP), very low-frequency power (VLFP), LF/HF power ratio (LFHF), and RRI. In each feature set, we detected the subset of the features with the highest performance by applying the greedy feed-forward feature selection method and used them for the final model learning. The feature selection method is a repetitive procedure of adding features one by one which are the most helpful in improving predictive performance until the performance is no longer improved. Here, the performance was evaluated in terms of the AUC.
Table 2 shows the lists of the selected features in each feature set for different predictive models. From this table, we could observe that the proposed measures are very useful for improving the performance of drowsiness detection, regardless of model type. Also, it was interesting to see that this performance can be more improved by using some of the existing HRV measures along with the proposed measures. On the other hand, these HRV measures were not helpful at all when used in conjunction with the dominant breathing measures instead of the proposed measures. Of the conventional ‘HRV’ measures, ‘LFHF’ (i.e., LF/(HF + LF) power ratio) and ‘LFP’ or ‘HFP’ were chosen as good indicators of driver drowsiness in most cases.
Figure 8 shows the performance of the prediction models for drowsiness detection using ROC graphs. In this figure, it is observed that the feature set of ‘Proposed + HRV’ or that of ‘Proposed’ provides the best performance in all the three models. Particularly, the additional use of ‘HRV’ with ‘Proposed’ seems to have a good effect on improving drowsiness detection performance. On the other hand, for the ‘DominantResp’ feature set, additional use of ‘HRV’ feature set with ‘DominantResp’ does not contribute to the predicted performance at all. Rather, the feature set of ‘DominantResp’ alone outperforms the ‘HRV’ or ‘DominantResp+HRV’ feature set. Overall, the results show that the proposed measures can contribute significantly to improving drowsiness detection performance by using it alone or in combination with traditional HRV measures.

4. Discussion

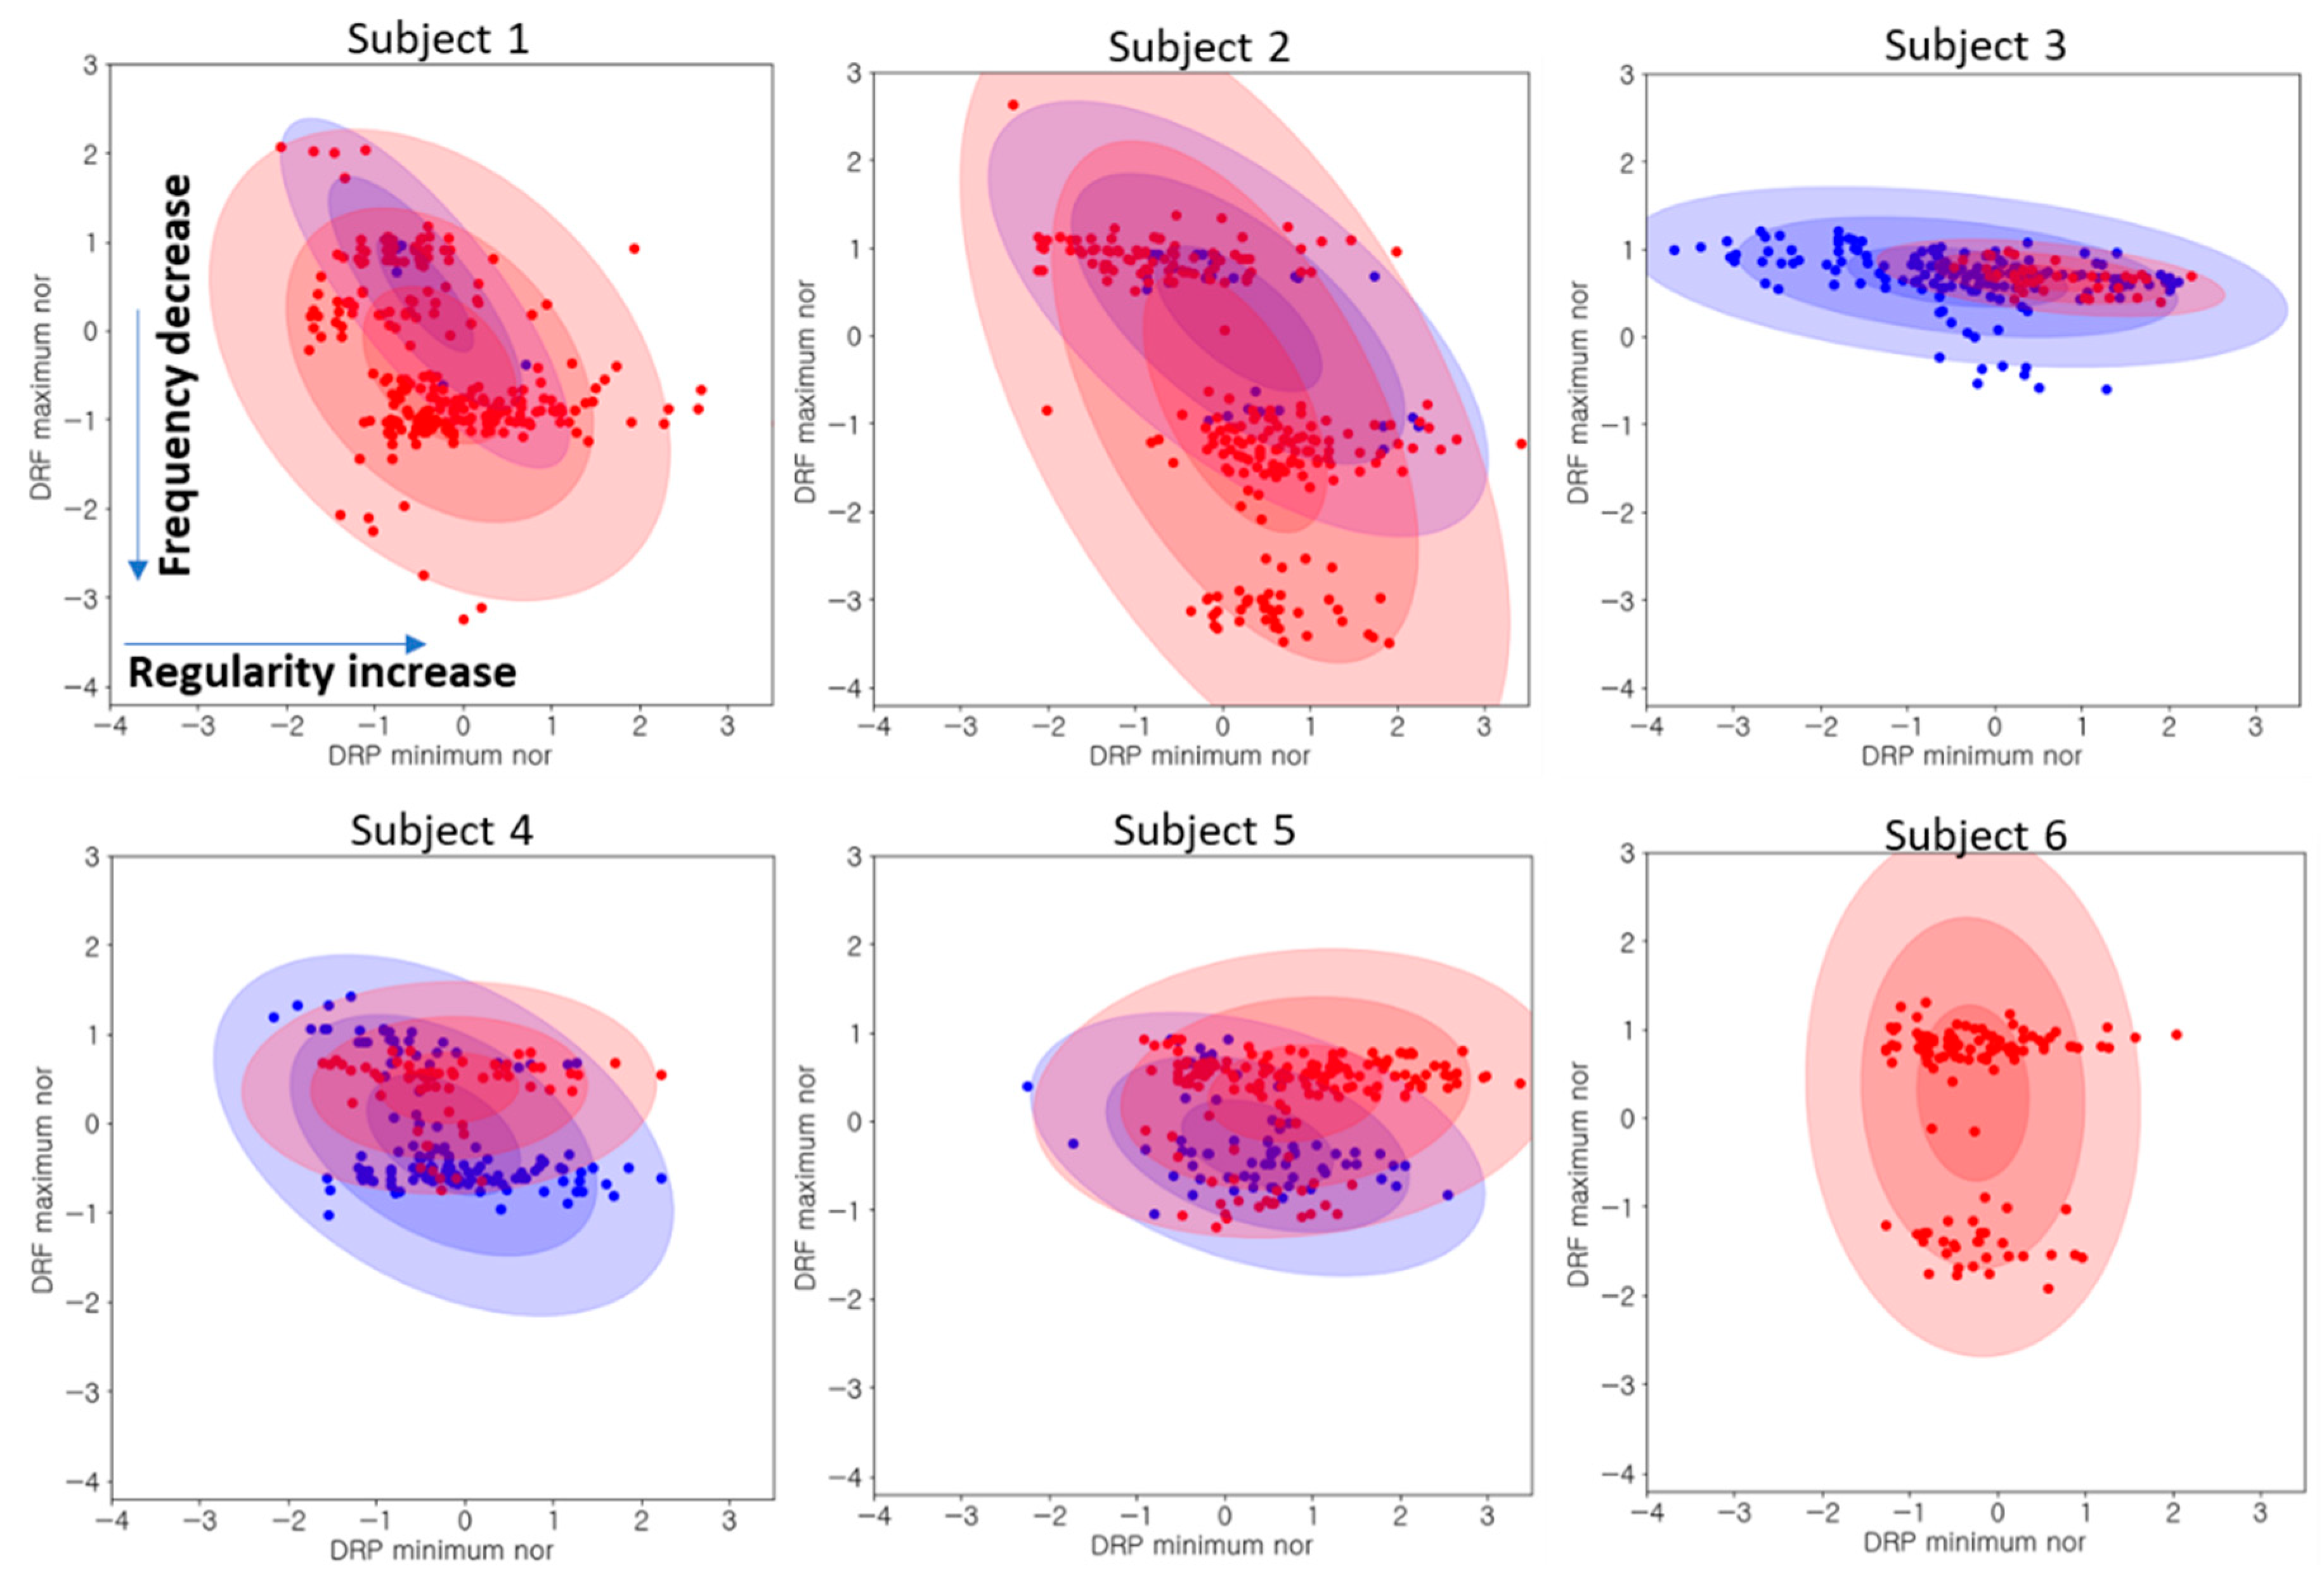
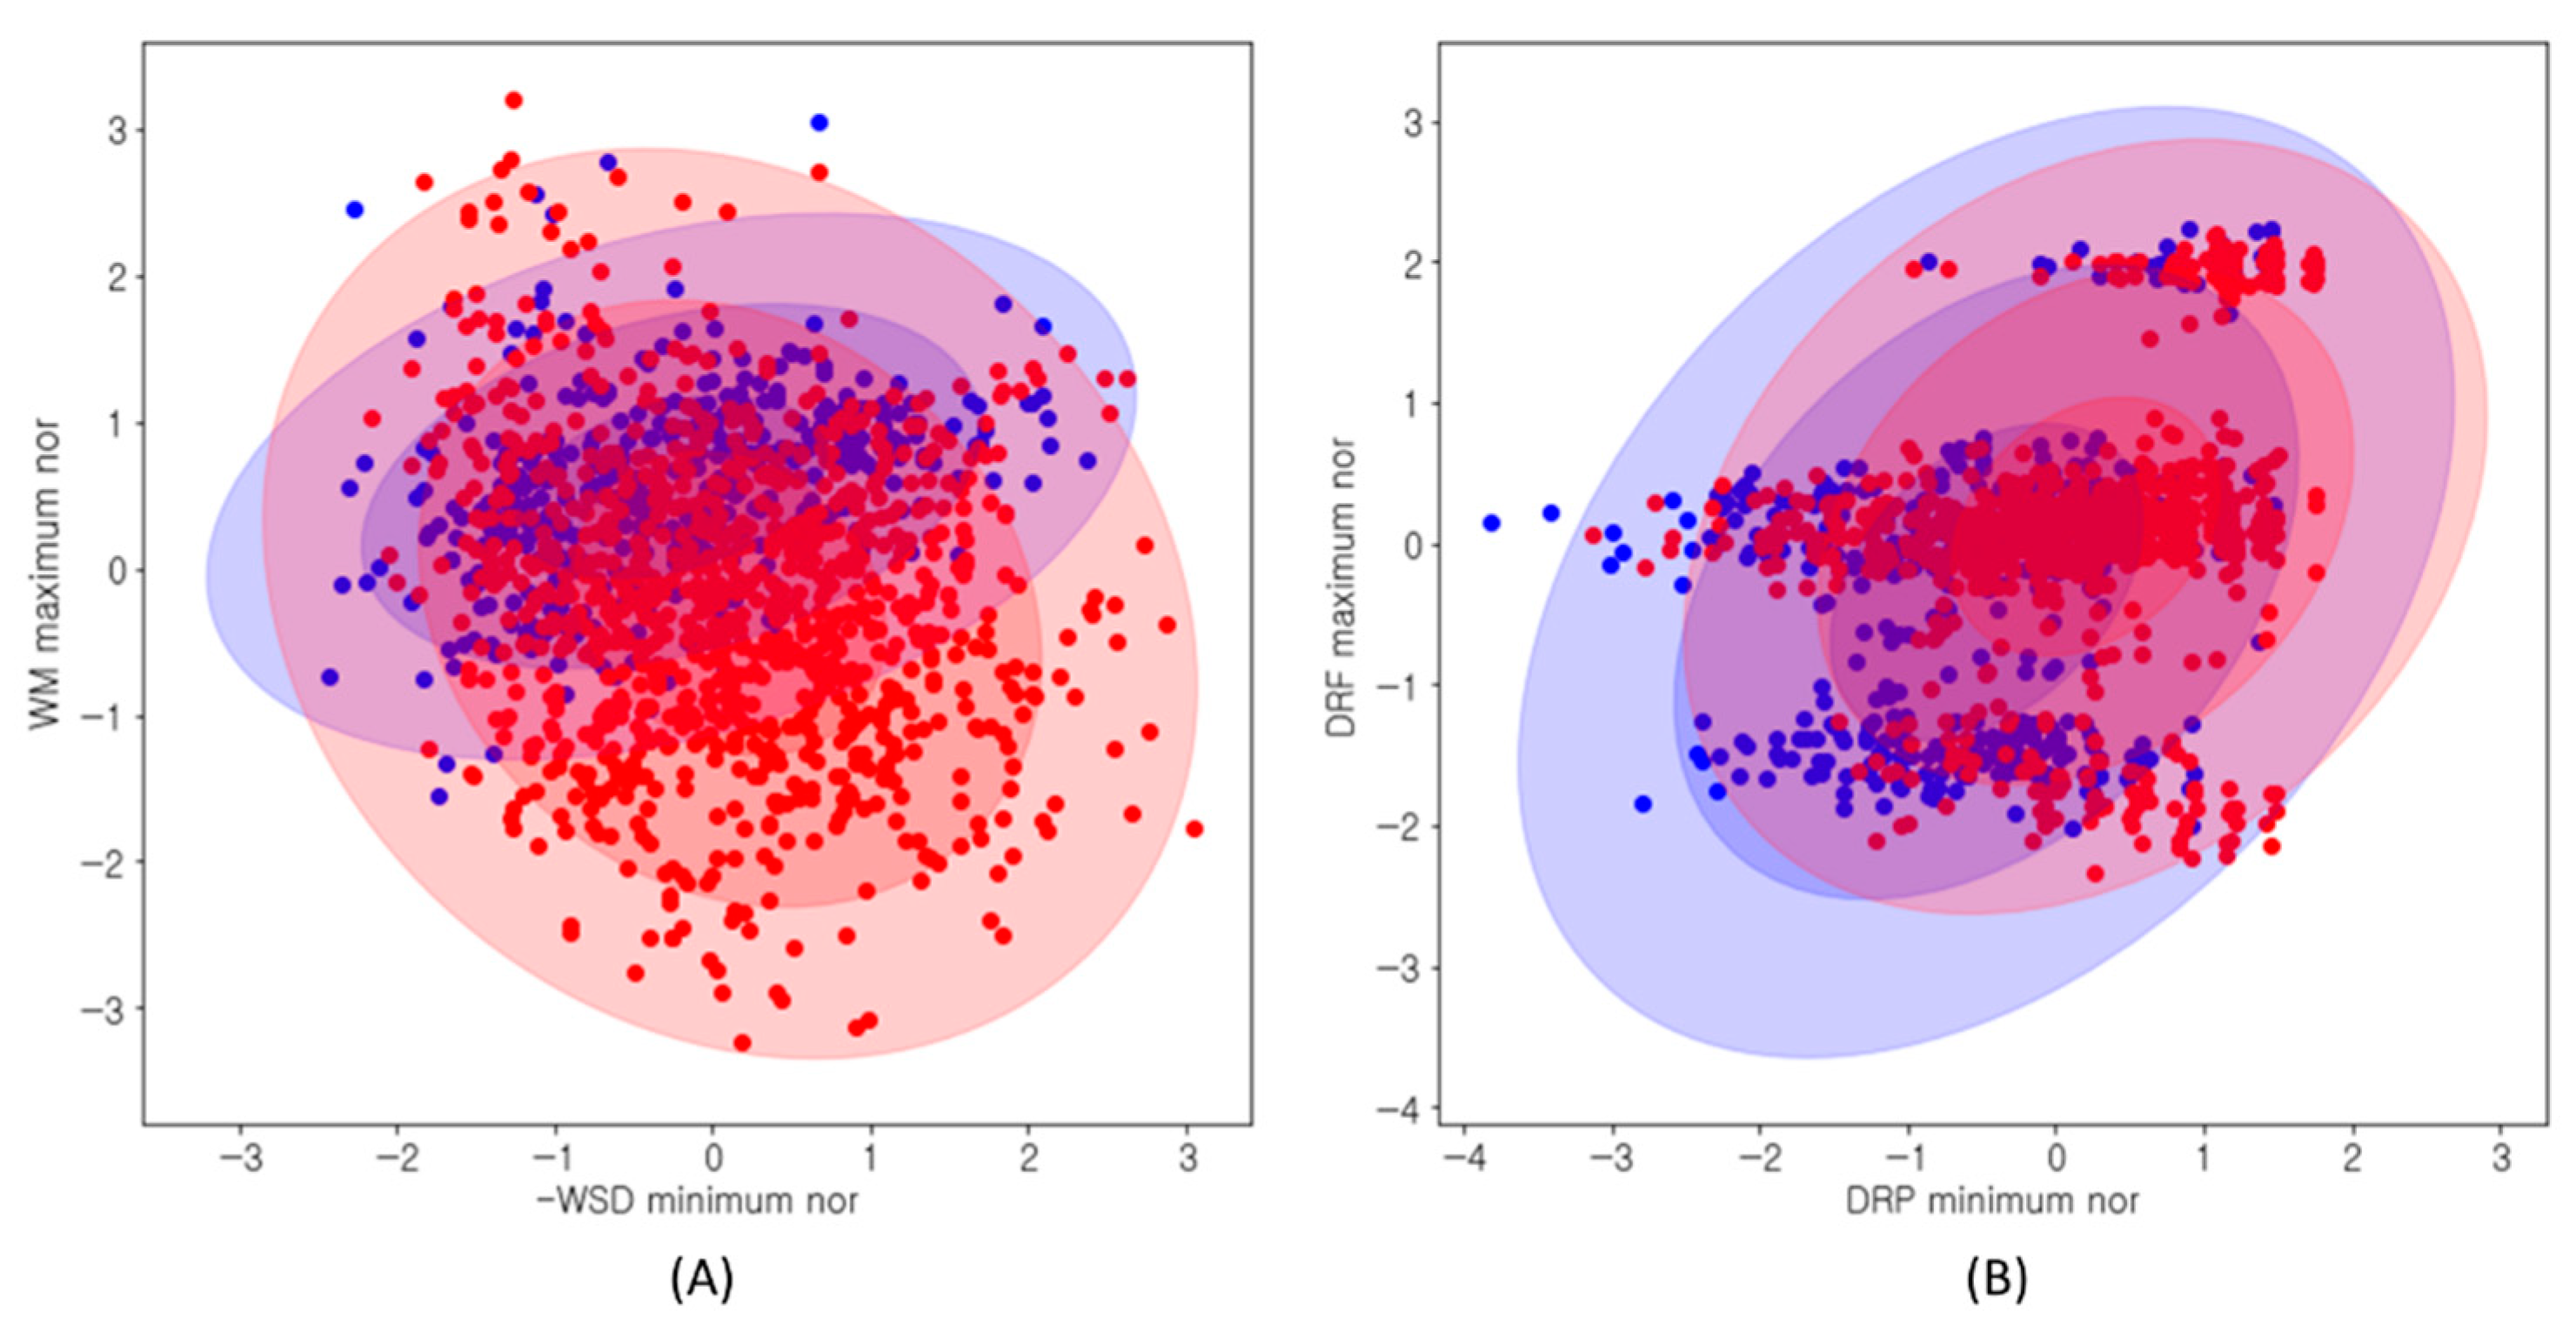
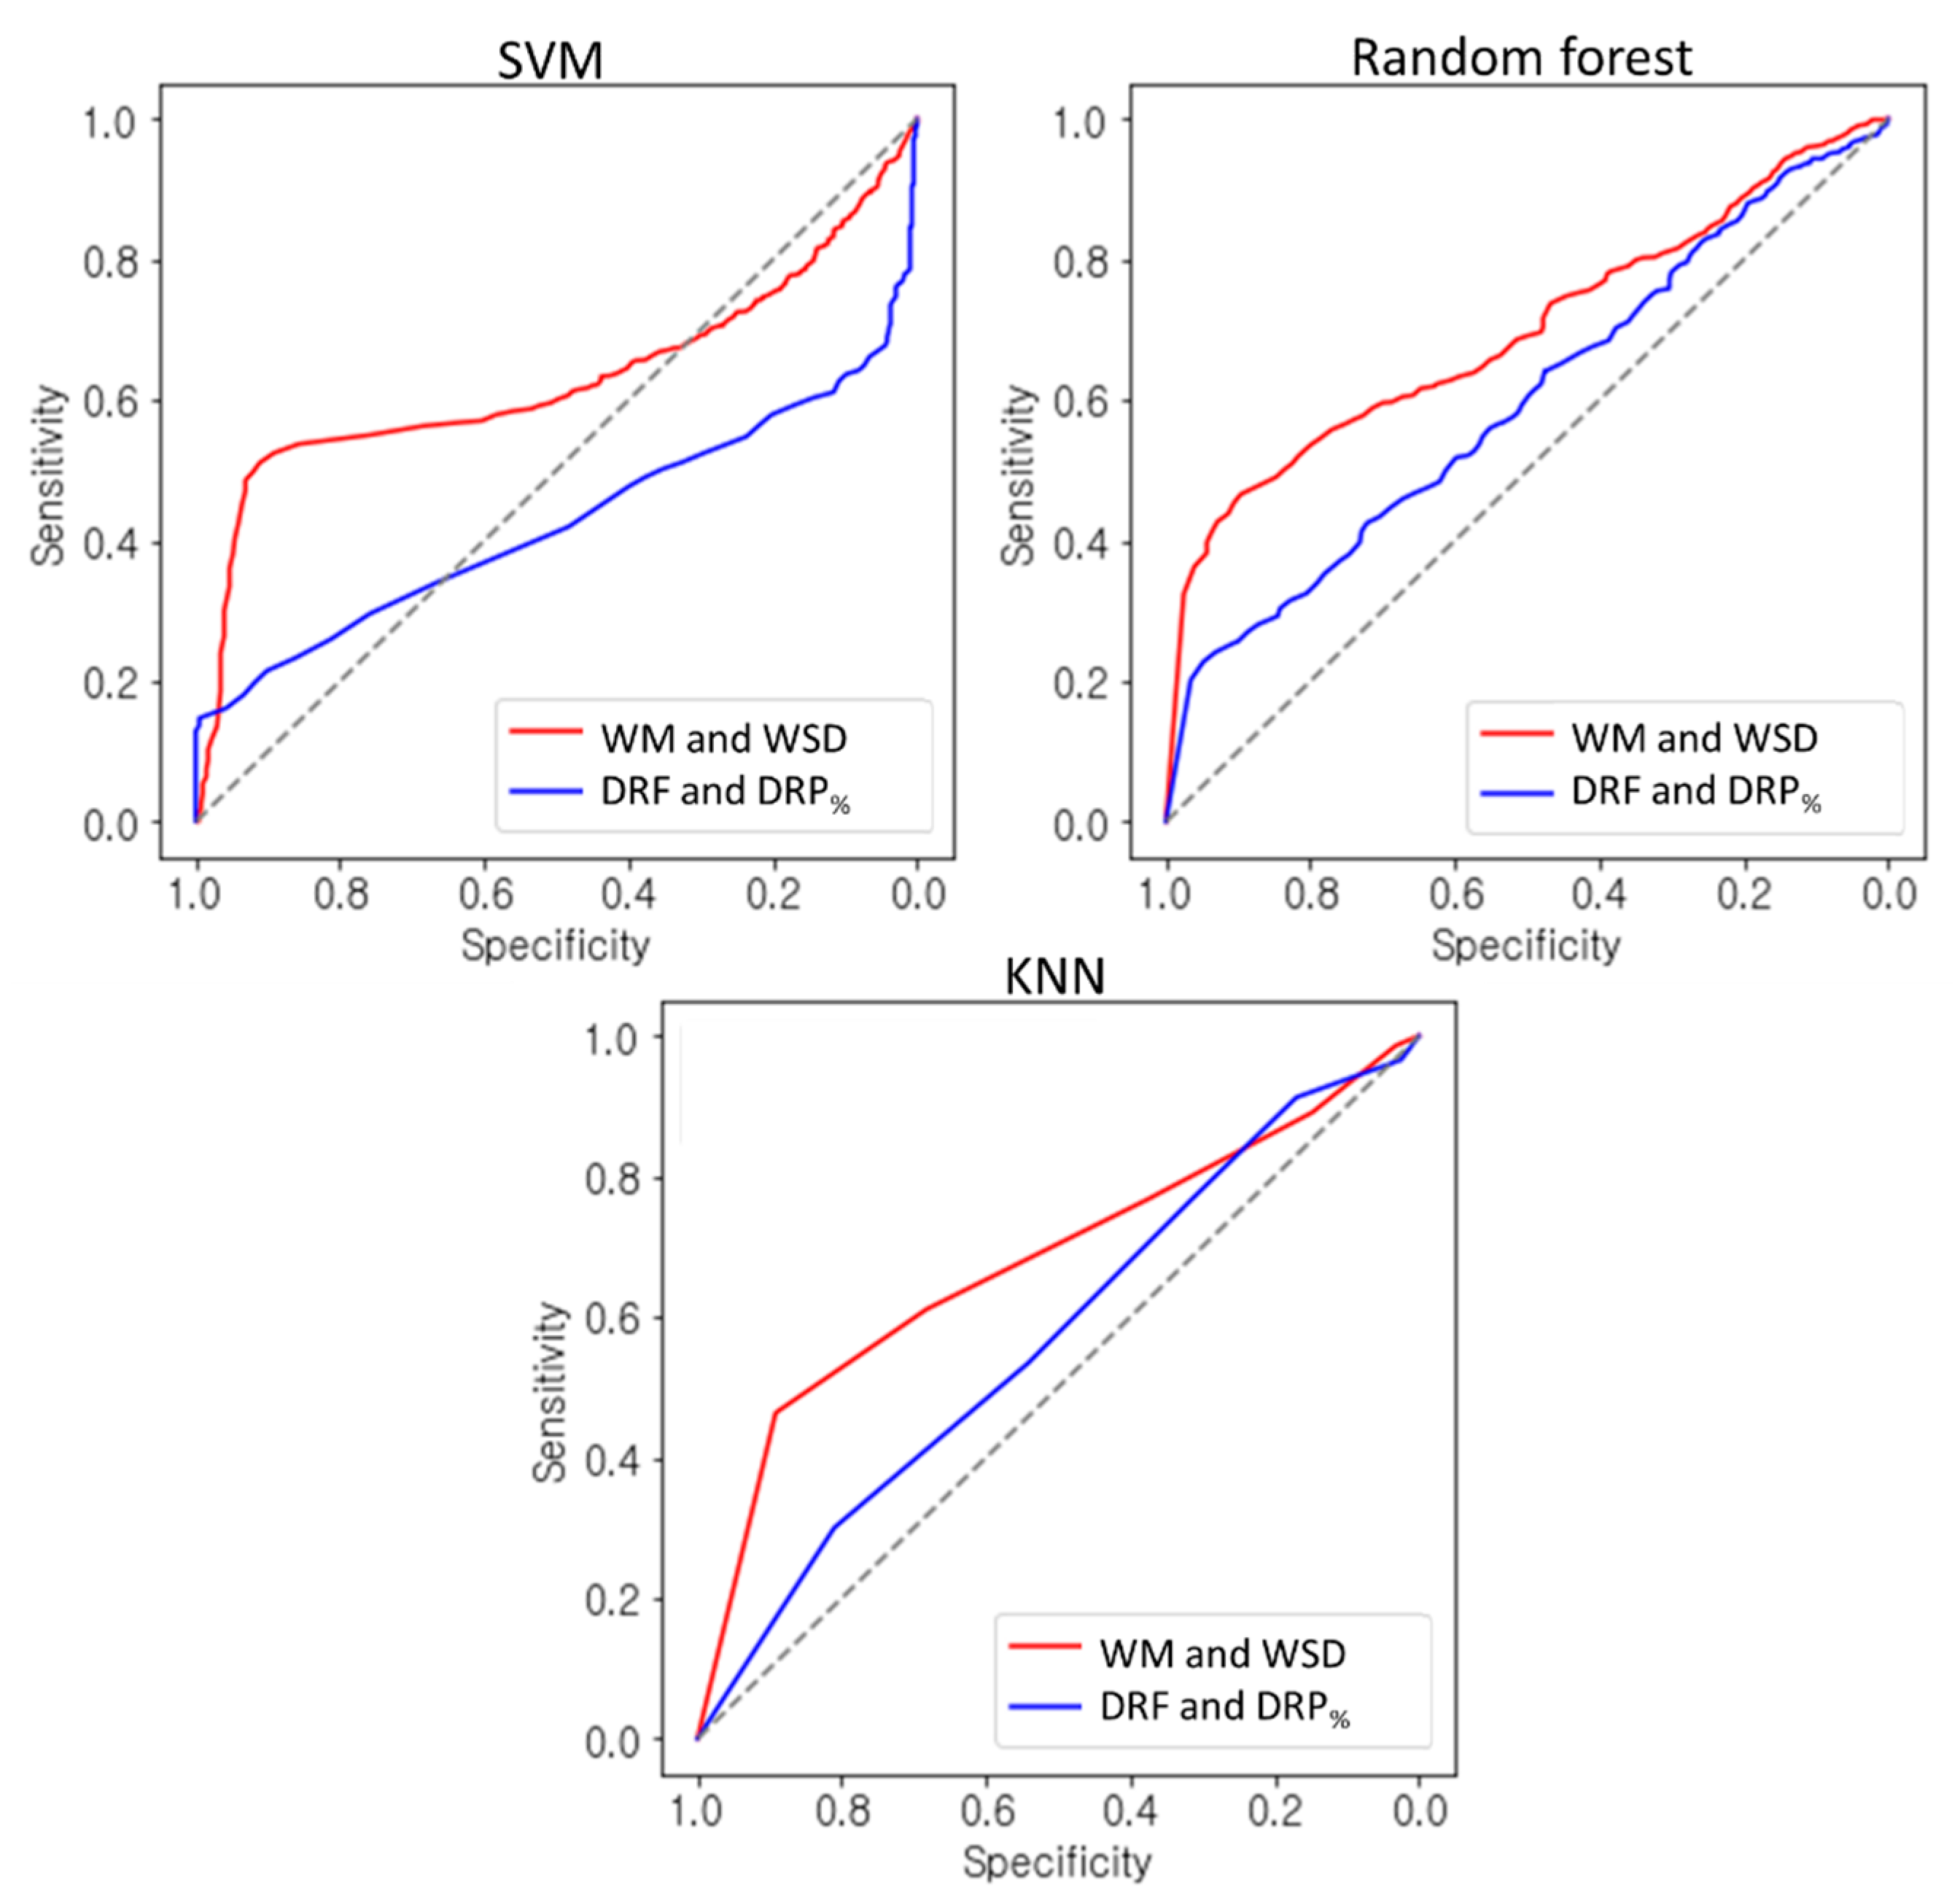
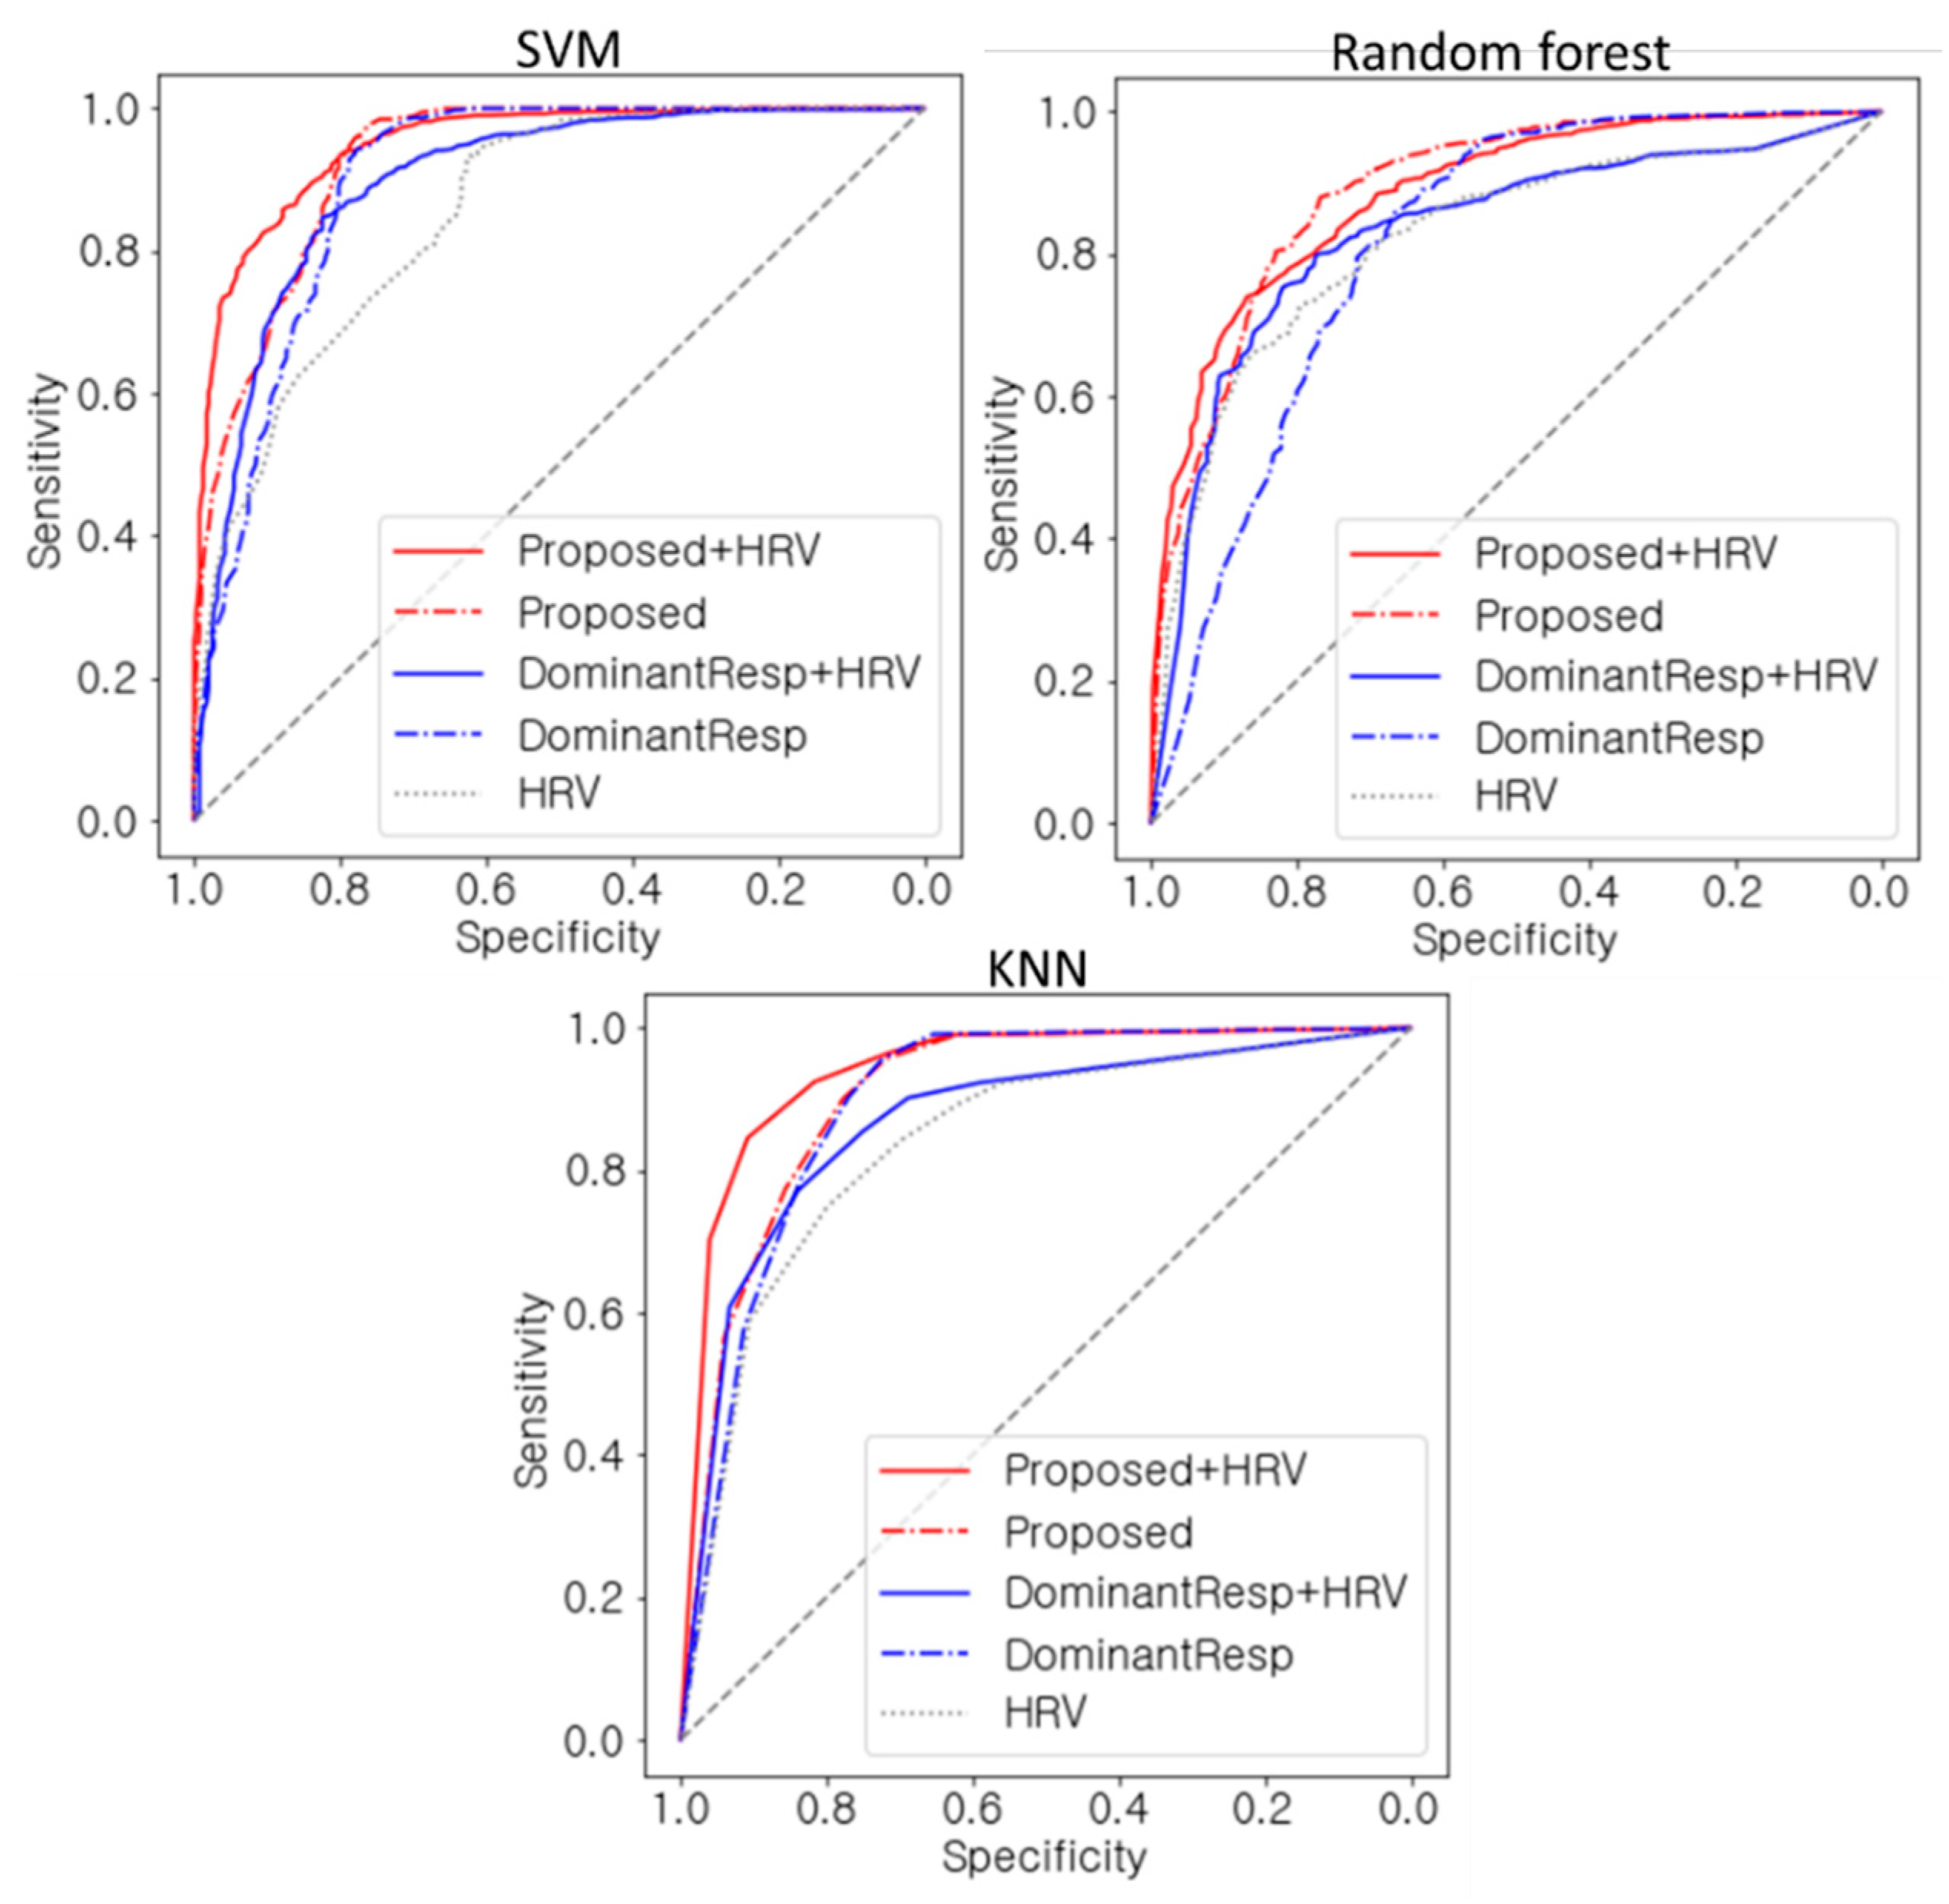
In this study, we suggested new spectral measures applicable to HRV-derived respiration power spectrum and looked into their usefulness for drowsiness detection in driving situations. Unlike earlier works, the proposed approach does not focus on dominant respiration characteristics. Rather, it focuses on capturing the overall shape of the respiration power spectrum. Thus, this method can be more widely employed than existing respiration measures, even in such cases that dominant respiration characteristics are hard to find. Furthermore, the proposed measures showed better performance in drowsiness detection than existing HRV or respiration measures and could be used in conjunction with HRV measures to further improve predictive performance. These results demonstrate that the proposed measures can be good indicators for drowsiness detection. This may be due to the fact that the feature space of the proposed two spectral measures (i.e., WM and WSD) is more separable than the feature space of existing respiration measures (i.e., DRF and DRP%) between drowsy and wake states, as shown in Figure 4, Figure 5 and Figure 6. As expected, it has been also observed that respiratory frequency (captured by WM) tends to be lower and breathing regularity (captured by WSD) tends to be higher in the drowsy state. On the other hand, this phenomenon was not well observed in the feature space of dominant respiration measures (i.e., DRF and DRP%).
This approach can be quite useful in situations where HRV data is collected with wearable sensors because the proposed measures are based on HRV-induced respiratory characteristics. Moreover, it is more interesting that using two proposed measures of respiration together with conventional HRV measures (like LF/HF power ratio), which are easily obtainable from HRV data, can help to further improve predictive performance in detecting a driver’s drowsiness. In addition, this method shows a good ability to capture common phenomenon of respiratory traits in multiple subjects. Accordingly, in reality, it is expected that the steady accumulation of HRV data for a large number of subjects may lead to building more reliable prediction models, providing further improvement in drowsiness detection.

Author Contributions

J.K. designed and performed the experiment, and wrote the first manuscript. M.S. advised on detailed methods of the experiment and revised the manuscript.

Funding

This research was funded by the MSIT (Ministry of Science and ICT), Korea, under the ITRC (Information Technology Research Center) support program (IITP-2019-2016-0-00313) supervised by the IITP (Institute for Information & communications Technology Planning & Evaluation).

Conflicts of Interest

The authors declare no conflict of interest.

References

  1. Martiniuk, A.L.C.; Senserrick, T.; Lo, S.; Williamson, A.; Du, W.; Grunstein, R.R.; Woodward, M.; Glozier, N.; Stevenson, M.; Norton, R.; et al. Sleep-Deprived Young Drivers and the Risk for Crash. JAMA Pediatr. 2013, 167, 647. [Google Scholar] [CrossRef] [PubMed]
  2. Hauri, P. The Sleep Disorders; National Sleep Foundation: Washington, DC, USA, 2013. [Google Scholar]
  3. Cabiddu, R.; Cerutti, S.; Viardot, G.; Werner, S.; Bianchi, A.M. Modulation of the Sympatho-Vagal Balance during Sleep: Frequency Domain Study of Heart Rate Variability and Respiration. Front. Physiol. 2012, 3, 45. [Google Scholar] [CrossRef] [PubMed] [Green Version]
  4. Kiashari, S.E.H.; Nahvi, A.; Homayounfard, A.; Bakhoda, H. Monitoring the Variation in Driver Respiration Rate from Wakefulness to Drowsiness: A Non-Intrusive Method for Drowsiness Detection Using Thermal Imaging. J. Sleep Sci. 2019, 3, 1–9. [Google Scholar]
  5. Vicente, J.; Laguna, P.; Bartra, A.; Bailón, R. Drowsiness detection using heart rate variability. Med. Biol. Eng. Comput. 2016, 2016, 10. [Google Scholar] [CrossRef] [PubMed]
  6. El Haouij, N. Biosignals for Driver’s Stress Level Assessment: Functional Variable Selection and Fractal Characterization; Université Paris-Saclay: Paris, France, 2018. [Google Scholar]
  7. Lee, B.-G.; Lee, B.-L.; Chung, W.-Y. Mobile healthcare for automatic driving sleep-onset detection using wavelet-based EEG and respiration signals. Sensors 2014, 14, 17915–17936. [Google Scholar] [CrossRef] [PubMed]
  8. Rodríguez-Ibáñez, N.; García-González, M.A.; Fernández-Chimeno, M.; De Rosario, H.; Ramos-Castro, J. Synchrosqueezing Index for Detecting Drowsiness Based on the Respiratory Effort Signal. In XIII Mediterranean Conference on Medical and Biological Engineering and Computing 2013; Springer: Cham, Switzerland, 2014; pp. 965–968. [Google Scholar]
  9. Rodríguez-Ibáñez, N.; García-González, M.A.; Fernández-Chimeno, M.; Ramos-Castro, J. Drowsiness detection by thoracic effort signal analysis in real driving environments. In Proceedings of the 2011 Annual International Conference of the IEEE Engineering in Medicine and Biology Society, Boston, MA, USA, 30 August–3 September 2011; pp. 6055–6058. [Google Scholar]
  10. Solaz, J.; Laparra-Hernández, J.; Bande, D.; Rodríguez, N.; Veleff, S.; Gerpe, J.; Medina, E. Drowsiness Detection Based on the Analysis of Breathing Rate Obtained from Real-time Image Recognition. Transp. Res. Procedia 2016, 14, 3867–3876. [Google Scholar] [CrossRef] [Green Version]
  11. Takahashi, I.; Yokoyama, K. Development of a feedback stimulation for drowsy driver using heartbeat rhythms. In Proceedings of the 2011 Annual International Conference of the IEEE Engineering in Medicine and Biology Society, Boston, MA, USA, 30 August–3 September 2011; pp. 4153–4158. [Google Scholar]
  12. Warwick, B.; Symons, N.; Chen, X.; Xiong, K. Detecting Driver Drowsiness Using Wireless Wearables. In Proceedings of the 2015 IEEE 12th International Conference on Mobile Ad Hoc and Sensor Systems, Dallas, TX, USA, 19–22 October 2015; pp. 585–588. [Google Scholar]
  13. Long, X.; Yang, J.; Weysen, T.; Haakma, R.; Foussier, J.; Fonseca, P.; Aarts, R.M. Measuring dissimilarity between respiratory effort signals based on uniform scaling for sleep staging. Physiol. Meas. 2014, 35, 2529–2542. [Google Scholar] [CrossRef] [PubMed] [Green Version]
  14. Bailón, R.; Sornmo, L.; Laguna, P. Chaper 8: ECG- Derived Respiratory Frequency Estimation. In Advanced Methods and Tools for ECG Data Analysis; Artech House: Norwood, MA, USA, 2006; Volume 1, pp. 215–243. [Google Scholar]
  15. Tateno, S.; Guan, X.; Cao, R.; Qu, Z. Development of Drowsiness Detection System Based on Respiration Changes Using Heart Rate Monitoring. In Proceedings of the 2018 57th Annual Conference of the Society of Instrument and Control Engineers of Japan (SICE), Nara, Japan, 11–14 Septemper 2018; pp. 1664–1669. [Google Scholar]
  16. Bourghelle, F. Development of An Automatic Drowsiness Monitoring System Using the Electrocardiogram. Master’s Thesis, Université de Liège, Liège, Belgique, 2016. [Google Scholar]
  17. Sahayadhas, A.; Sundaraj, K.; Murugappan, M. Detecting driver drowsiness based on sensors: A review. Sensors 2012, 12, 16937–16953. [Google Scholar] [CrossRef]
Figure 1. Motivating example 1 in which both cases of (A) and (B) have almost the same values of dominant respiration frequencies (DRFs) (≈0.36 Hz) and dominant respiration power (DRP)% (when DRP is calculated in the range of 0.02 Hz around DRF), although (B) appears to be in a more regular breathing state than (A). (A) HRV-derived respiration with emphasized power at multi frequency. (B) HRV-derived respiration with emphasized power at single frequency.
Electronics 08 00669 g001
Figure 2. Motivating example 2 in which it is difficult to find a single DRF, because there are two peak points at 0.24 Hz and 0.33 Hz with almost the same power.
Electronics 08 00669 g002
Figure 3. (A) The virtual driving environment; (B) a wearable chest-strap electrocardiogram (ECG) device for heart rate variability (HRV) data collection.
Electronics 08 00669 g003
Figure 4. Scatterplots of the proposed features for each subject in our dataset. Here, blue dots represent wake epochs, and red dots represent drowsy epochs. The X-axis represents minus the weighted standard deviation (WSD), and the Y-axis represents the weighted mean (WM). The colored circles are the Gaussian distribution fitted for each label (i.e., drowsy or wake states).
Electronics 08 00669 g004
Figure 5. Scatterplots of existing features for each subject in our dataset. Here, blue dots represent wake epochs, and red dots represent drowsy epochs. The X-axis represents DRF% and the Y-axis DRF. The colored circles are the Gaussian distribution fitted for each label (i.e., drowsy or wake states).
Electronics 08 00669 g005
Figure 6. Scatterplot for all subjects. (A) Proposed features are used (i.e., WSD and WM), and (B) existing features are used (i.e., DRP% and DRF). Here, blue dots represent wake epochs, and red dots represent drowsy epochs. The colored circles are the Gaussian distribution fitted for each label (i.e., drowsy or wake states).
Electronics 08 00669 g006
Figure 7. Receiver operating characteristics (ROC) graphs of different prediction models using two different feature sets given in Figure 6. Here the sensitivity corresponds to the ability of predicting the actual ‘drowsy’ epoch as ‘drowsy’. The specificity corresponds to the ability of predicting the actual ‘wake’ epoch as ‘wake’.
Electronics 08 00669 g007
Figure 8. ROC graphs of different prediction models using five different feature sets. Here, the sensitivity corresponds to the ability of predicting the actual ‘drowsy’ epoch as ‘drowsy’. The specificity corresponds to the ability of predicting the actual ‘wake’ epoch as ‘wake’.
Electronics 08 00669 g008
Table 1. The criteria to define drowsy events.
TypeDrowsy Events
Vehicle-basedGetting off the main road completely
Causing big collision (e.g., a car is overturned or crashes).
Failure to maintain lanes in a stable way more than 5 seconds.
Keeping less than 70km/h speed more than 10 seconds without special reasons.
Driver behavior-basedFailure to focus on driving.
(e.g., Showing sleepy eyes clearly, nodding, or repeated yawning)
Leaning back head on the chair with closed eyes.
Table 2. A list of selected features (using the greedy feed forward selection method) in each feature set for prediction. In each feature set, the chosen features are given in the order of significance. (Notation ended with ‘nor’ indicates that it is a normalized value).
Learning ModelFeature Set NameSelected Features in the Set for Best PerformanceAUC
SVMProposed+HRVLFHF(mean), WSD40(mean)nor, WSD(max), WM(std)nor, LFP(mean)nor, WSD(min), WSD40(min)nor, WSD40(mean), WSD40(max), RR(max)nor, WSD40(min), WM(mean)nor0.95
ProposedWSD(max), WSD(mean)nor, WM(std)nor, WM(max)nor0.93
DominantResp+HRVDRF(min)nor, LFHF(max), DRF40(min)nor, DRF(max), HFP(min)nor, LFP(min)nor, HFP(std), DRP%(mean), LFHF(mean)0.9
DominantRespDRF(min)nor, DRF40(min)nor, DRP40%(std)nor, DRP40%(std), DRP40%(mean)nor, DRP40%(mean), DRP40%(max)nor, DRF40(max), DRF40(max)nor, DRP%(min)nor0.9
HRVLFHF(mean), HFP(max)nor, HFP(mean), HFP(std)nor, VLFP(max), LFP(mean)nor, HFP(max)0.85
RFProposed+HRVLFHF(mean), WSD40(mean)nor, WM(max)nor, WM40(min)nor, VLFP(max)nor, WSD40(min)nor0.89
ProposedWM(max)nor, WM40(min)nor, WSD40(mean)nor, WSD40(min)0.89
DominantResp+HRVLFHF(mean), HFP(std)nor, LFP(mean)nor, DRP40%(mean)0.83
DominantRespDRF(min)nor, DRF40(min)nor, DRP40%(std)nor, DRP40%(std), DRP40%(max)nor, DRP40%(min)0.84
HRVLFHF(max), HFP(std)nor, LFP(mean)nor, LFHF(mean), LFHF(std)0.82
KNNProposed+HRVLFHF(mean), WSD40(mean)nor, WM(std)nor, WSD(max), RR(max)nor, WSD(mean)nor, LFHF(mean)nor, WM(std), LFP(min), WSD(min)0.94
ProposedWM(max)nor, WM40(min)nor, WSD40(mean)nor, WSD40(mean), WSD40(min)nor, WSD40(std)0.91
DominantResp+HRVLFHF(mean), DRF(max)nor, HFP(max)nor, LFP(min)nor, HFP(std)nor, DRP%(min), HFP(max)0.87
DominantRespDRF(min)nor, DRP40%(max)nor, DRP40%(std)nor, DRP40%(std), DRP40%(min), DRP40%(mean)nor, DRF40(min)nor, DRP40%(max)0.9
HRVLFHF(mean), HFP(std)nor, LFP(mean)nor, HFP(std), LFHF(mean)nor, VLFP(min)nor, HFP(max)nor0.84

